 Shujia Wang
 Peng Zhang
 Jibiao Zhang
- College of Chemistry and Environmental Science, Guangdong Ocean University, Zhanjiang, China
Estuaries and sewage outlets are key pathways for the transport of microplastics (MPs) from land to coastal waters. In this study, the spatiotemporal pattern, composition, and flux of MPs transported from land to Zhanjiang Bay (ZJB) in the South China Sea were investigated. The results showed that the overall mean MP abundance (± standard deviation) was 17.99 ± 9.72 items/L, with the highest in the normal season, followed by the dry and wet seasons. Fibers were the most dominant shape in these samples, blue was the most common color, and most MPs ranged between 100 and 330 μm. The MP diversity was higher in the wet and normal seasons than in the dry season. The highest seasonal flux of MPs was observed during the wet season, accounting for 79.68%, with the largest contribution from the Suixi River. There was a significant positive relationship between the annual MP flux and river discharge (R² = 0.95, p< 0.001). Hydrological processes, human behavior, and weather conditions were key factors that contributed toward the spatiotemporal variation of MPs. Overall, the aim of this study was to provide baseline information on MP pollution in ZJB to help formulate control strategies for improving regional water quality and mitigating its pollution. In the future, this study can be used to assess the role of river basins and sewage outlets in transporting MPs to the estuaries and ocean.
Introduction
The concept of microplastics (MPs) was first introduced in 2004 (Thompson et al., 2004). MPs are defined as small pieces of plastic that are less than 5 mm in size (GESAMP, 2015). They are known to affect aquatic organisms, cause environmental hazards (Desforges et al., 2015; Wright and Kelly, 2017), and become one of the major carriers of pollutants (Faure et al., 2015; Mani et al., 2015; Zhang et al., 2015). Moreover, as they do not degrade easily and tend to remain in water for thousands of years (Ng and Obbard, 2006; Frias et al., 2010; McCormick et al., 2014), they are ubiquitous in the environment, including seawater and freshwater (Law et al., 2014), marine organisms (Sanchez et al., 2014; Peters and Bratton, 2016; Silva–Cavalcanti et al., 2017), air (Johnny et al., 2018), bottled mineral water (Darena et al., 2018; Oßmann et al., 2018), and tap water (Tong et al., 2020) at varying concentrations.
As MPs have a higher specific surface area, their ability to adsorb pollutants increases (Reisser et al., 2014). As a result, MPs are found in rivers and oceans, where pollutants are easily adsorbed (Browne et al., 2010; Yonkos et al., 2014; Fok and Cheung, 2015). Previous studies estimated that more than 80% of marine litter comes from land-based sources and up to 90% of river litter comes from 10 rivers (Marine Litter Solutions, 2020). However, studies on the abundance, spatiotemporal composition, and flux of riverine MPs are limited, compared with those of marine MPs. Moreover, investigations on MPs in rivers have only recently been put into practice (Eerkes–Medrano et al., 2015; Rochman, 2018; Eo et al., 2019). It has been shown that pollution sources, anthropogenic impacts, and hydrodynamics can influence MP accumulation and transport rates (Browne et al., 2011; Eerkes–Medrano et al., 2015; Luo et al., 2019). Coastal river and sewage systems are often closer to land-based sources and are directly influenced by human activities (Pan et al., 2020). They play a key role in regulating the fate and transport of MPs in estuarine and marine habitats. Patterns for studying the characteristics of MPs in river systems are related to their sources, such as proximity to industrial and agricultural areas, high urban density areas, and wastewater discharge (Mani et al., 2015; Baldwin et al., 2016; Leslie et al., 2017). Although the proportion of plastics in wastewater as a percentage of freshwater is largely unknown, industrial and domestic wastewaters that enter estuaries and sewage outlets play an important role in MP pollution (Barnes et al., 2009; Lisa et al., 2018; Luo et al., 2019). In addition, hydrological conditions are important factors that control the downstream export of MPs and influence river flow (Taryono et al., 2020). Coastal river estuaries are the predominant transport pathways (Lebreton et al., 2017; Schmidt et al., 2017; Wu et al., 2020), but they are complex dynamic systems that can accumulate, store, and recycle MPs at different spatiotemporal scales (Bai et al., 2022). Therefore, a comprehensive understanding of MP spatiotemporal patterns, compositions, and fluxes in estuaries and sewage outlets is required to provide a reference for the assessment of related MP pollution.
Zhanjiang Bay (ZJB) is a subtropical semi-enclosed bay located at the southernmost tip of the Leizhou Peninsula in Guangdong Province, mainland China (Zhang et al., 2019b; Zhang et al., 2020a; Zhang et al., 2021a) and is the largest port in Zhanjiang City. Over the past decades, rapidly expanding mariculture, population growth, and economic development have led to environmental impacts on ZJB, including eutrophication (Zhang et al., 2019b) and harmful algal blooms (Zhang et al., 2022a). However, with the advancement of economic activities and an increase in the population of Zhanjiang City, many rivers have become canals for industrial and domestic wastewater discharge (Zhang et al., 2020b). Although previous studies have focused on nutrients from land-based sources entering coastal waters in Zhanjiang City (Zhang et al., 2019b; Zhang et al., 2020b; Zhang et al., 2021a), to the best of our knowledge, studies on MP pollution in the estuaries and sewage outlets of Zhanjiang City have not been conducted. To better understand pollution in ZJB, this study investigated land-based MPs in the coastal rivers and sewage outlets of ZJB during different seasonal periods.
To this end, coastal waters that were influenced by major adjacent estuaries and sewage outlets were selected for this study, which covered different land-based sources. The primary study objectives were as follows: (1) to determine the spatiotemporal distribution of MPs in the wet, normal, and dry seasons in ZJB; (2) to identify the composition and diversity of MPs input from land-based sources in ZJB; and (3) to quantify the land-based sources of MP flux into ZJB. This study aimed to provide a basis for understanding the transport of MPs from land-based sources to marine environments, and the possible contributions of anthropogenic activities as well as industrial and agricultural processes to MP pollution in ZJB.
Materials and Method
Study Area
ZJB is a semi-enclosed bay with weak hydrodynamic conditions. It is spread across an area of 193 km2 (Zhang et al., 2020a), having a total length of 54 km and a width of 24 km (Zhang et al., 2021a). In addition, it has a deep channel that is more than 10 m deep and 40 km long, and an estuary that is approximately 2 km wide. During the last three decades, human activities have disturbed the coastal environment, especially in the rapidly urbanizing and industrializing areas of the ZJB (Zhang et al., 2020c). Most of the rivers in ZJB were polluted by land-based agricultural, industrial, and domestic wastewater from neighboring areas of ZJB (Zhang et al., 2020c). More than 10 small seasonal rivers and sewage outlets discharge into the bay with varying discharge and nutrient loads, including the Suixi, Nanliu, and Lvtang Rivers. The largest of these rivers is the Suixi River, which is located at the top of ZJB. It carries runoff from key agricultural areas and is the largest freshwater flow into ZJB (Zhang et al., 2019b; Zhang et al., 2020b). In this study, samples were collected from three estuarine monitoring stations and nine land-source input sewage outlets in ZJB (Figure 1). Land-based sources were sampled at different seasonal periods, considering the characteristics of the samples. The surroundings of these sampling stations were diverse and represented different areas of ZJB. Detailed information about each station is presented in Table 1.
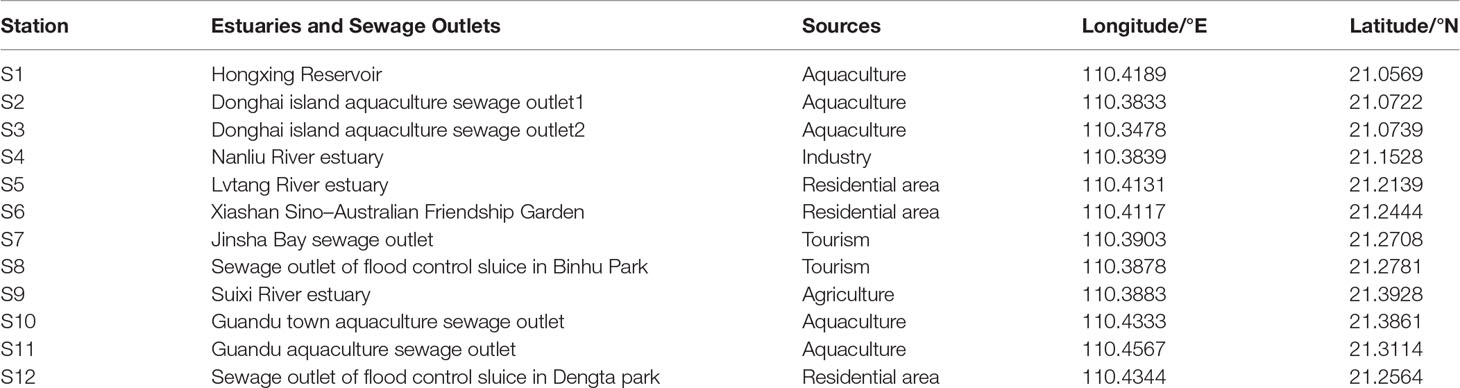
Table 1 Investigation of estuaries and sewage outlets.
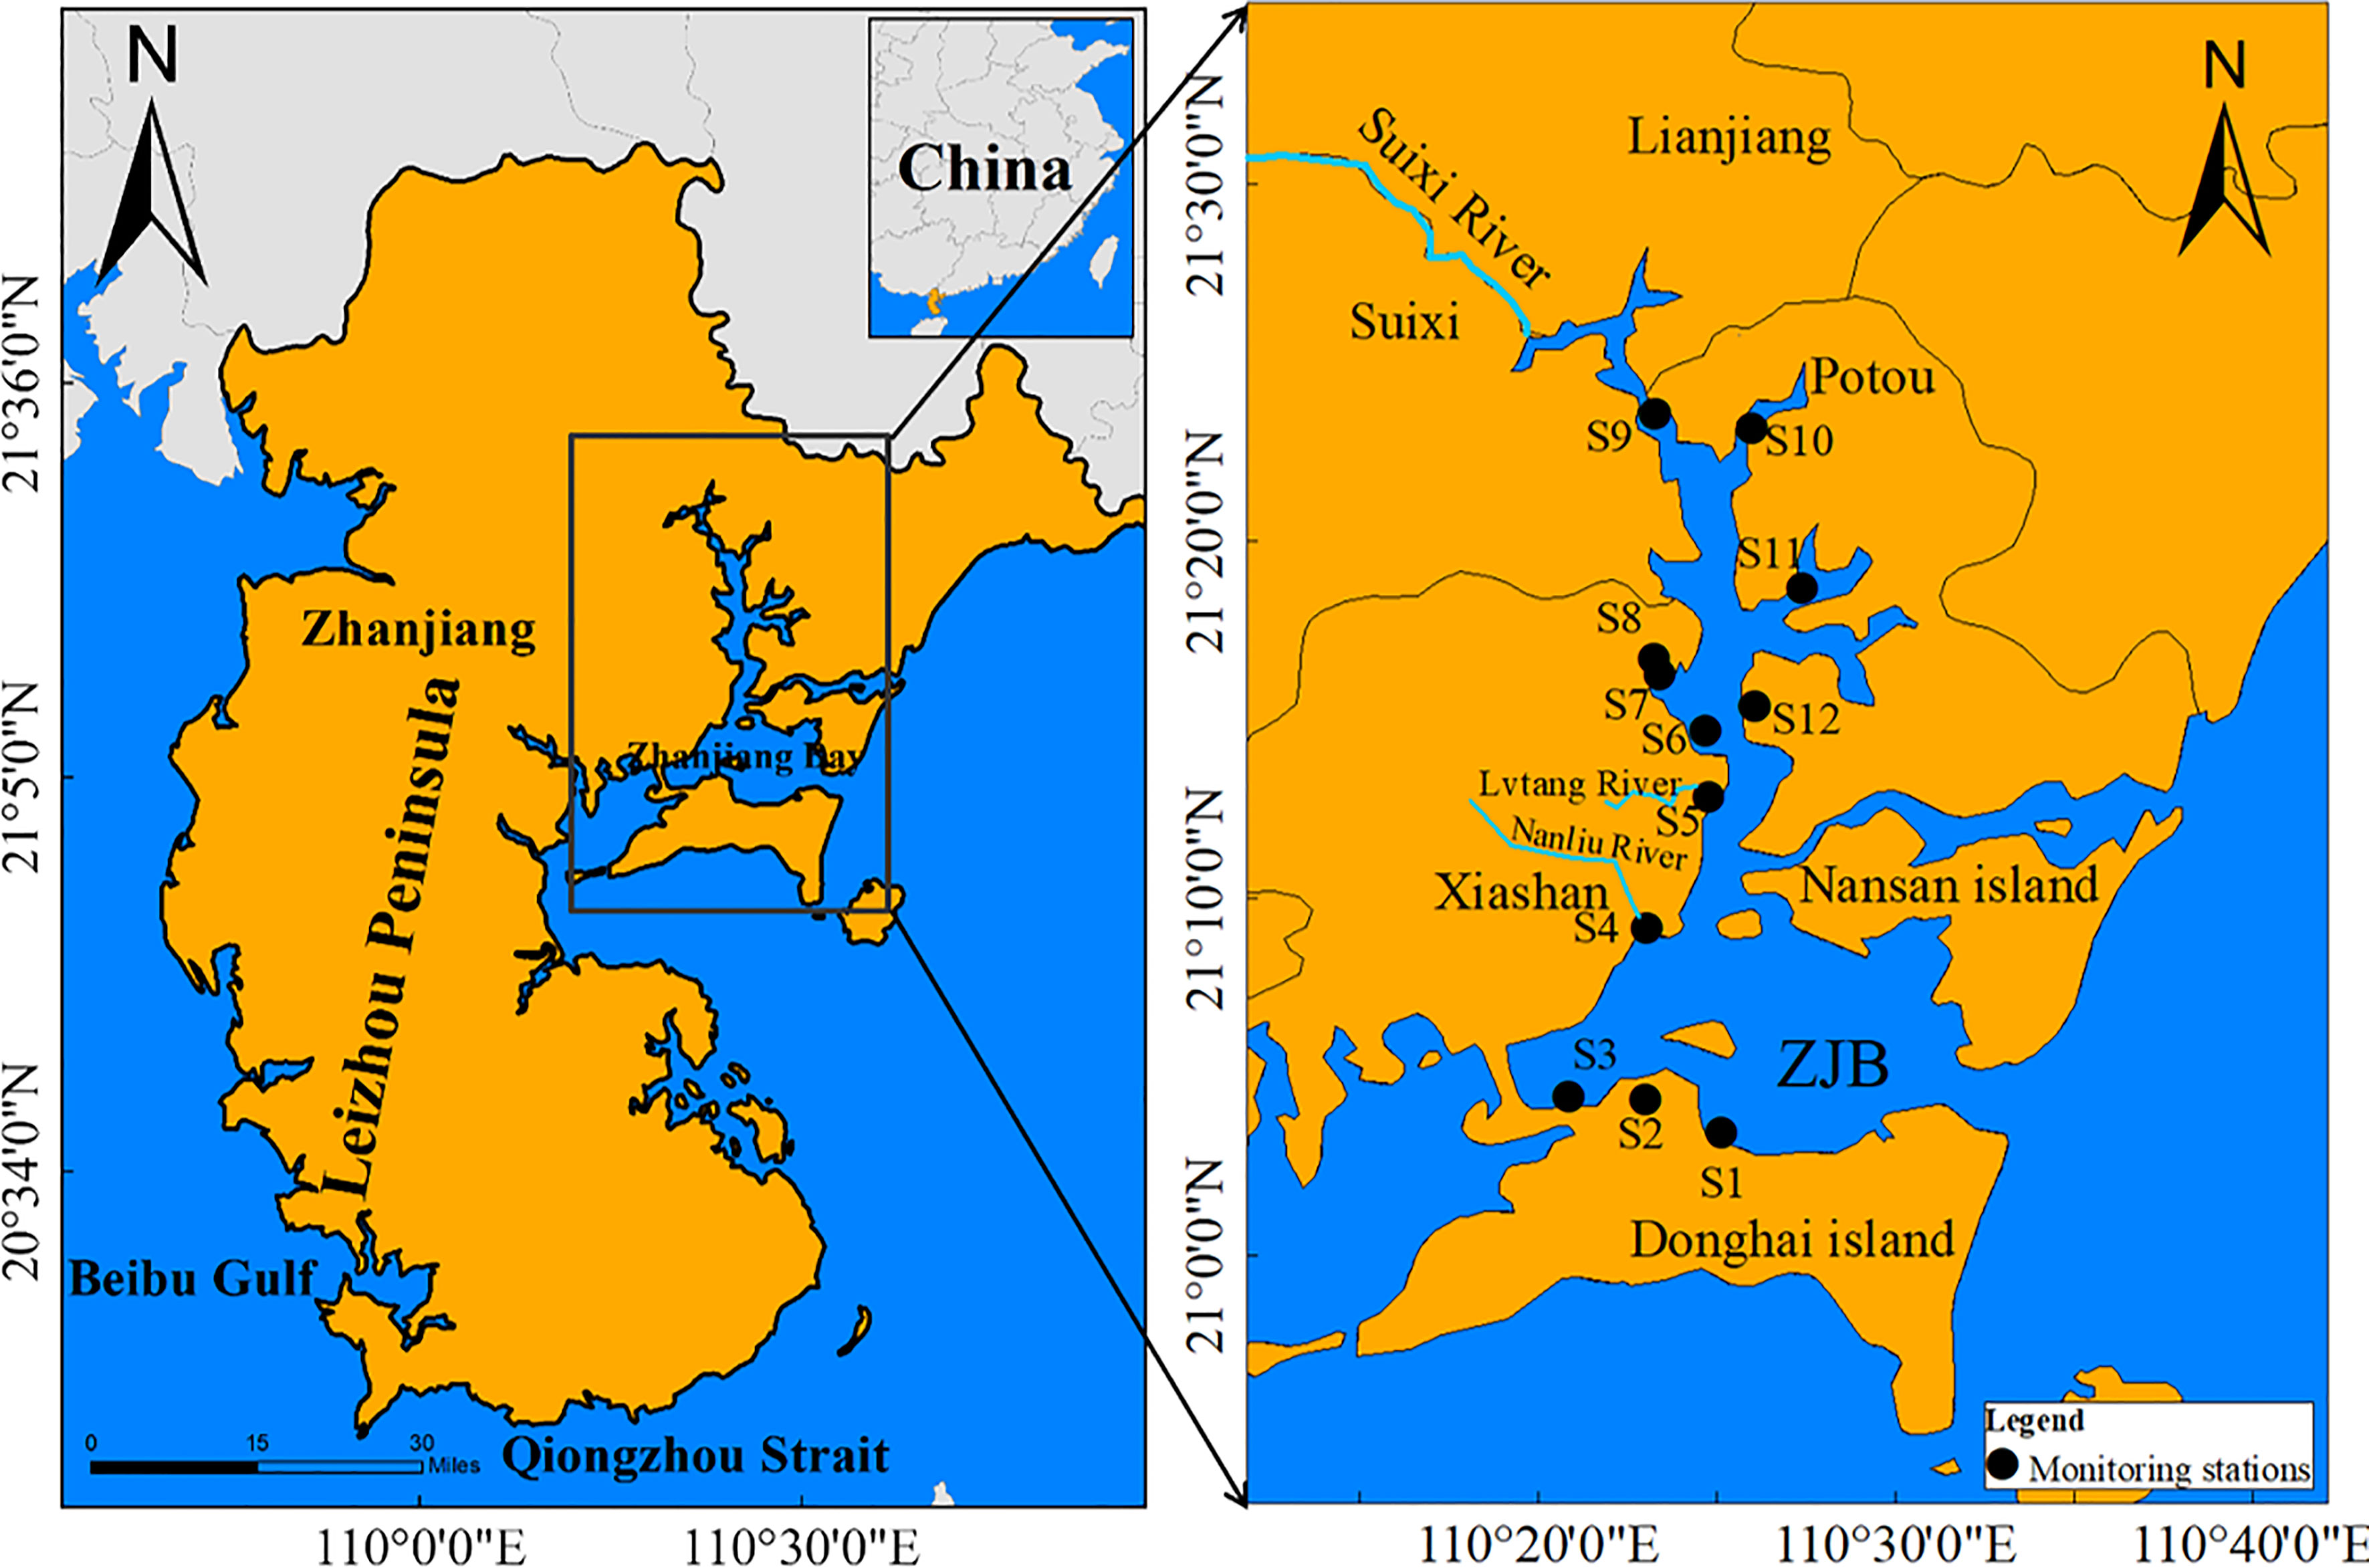
Figure 1 Geographic location and land-based sources input sampling stations in Zhanjiang Bay (ZJB).
Sampling and Analysis Methods
On the basis of the seasonal precipitation variation in Zhanjiang City in 2021, December, January, and February are classified as dry seasons; March, April, October, and November are the normal seasons; and May, June, July, August, and September are the wet seasons (Zhang et al., 2021a). Water samples were collected from 12 land-based input stations for three field surveys on September 19, 2021; October 30, 2021; and January 1, 2022, representing the wet, normal, and dry seasons, respectively (Zhao et al., 2019). Note that data for four sampling stations (S3, S4, S5, and S9) in the wet season were obtained from Jian et al. (2022). All the tools used for this study were cleaned with distilled water prior to sampling. River water and wastewater samples were collected, stored, and measured according to the technical specification requirements for monitoring surface water and wastewater (HJ/T91–2002) (MEPC, 2002a). Water samples were collected using portable samplers according to the Code for Liquid Flow Measurement in Open Channels (GB50179–93) (Ministry of Water Resources, 2005). Flow rates in each of the inlet rivers were monitored using a rotor flow meter (Zhang et al., 2021a). Sewage outlets 8 and 12 of the floodgate (Table 1) and the Hongxing Reservoir outlet estuary were closed during the survey period, so no water samples were available in January (dry season). A 5-L surface water sample was collected from the top 50 cm of each water body, after which the samples were promptly transported back to the laboratory.
In the laboratory, surface water samples were collected and passed through a 45-μm stainless steel sieve. The residue on the sieve was washed three times with ultrapure water and then transferred to a 100-ml beaker. To dissolve natural organic matter in the water samples, 10 ml of 30% H2O2 and 10 ml of 0.05 M ferrous sulphate (FeSO4) solution were added to the samples, according to the National Oceanic and Atmospheric Administration (NOAA) protocol (NOAA, 2015). Then, this mixture was heated in a 75°C water bath for 24 h and cooled to room temperature (25°C) (Nuelle et al., 2014; Zhao et al., 2014). The samples were filtered using 10-μm glass fiber membranes under a vacuum pump. They were placed on an aluminium tray, air-dried at 75°C, and cooled in the same manner (as described above) for further analysis.
MPs retained on the filter membrane were systematically counted using a stereomicroscope (SMZ1270, Nikon, Japan) at a magnification of up to 40 x (Free et al., 2014; McCormick et al., 2014; Gies et al., 2018). MP particles were visually identified and had to meet the following criteria: (1) particles could not be broken using forceps, (2) particles were uniformly distributed in color, and (3) particles were free of tissue and cellular structures (Cole et al., 2011; Hidalgo–Ruz et al., 2012). The microscope was connected to a computer to capture images until each location was photographed (Zhao et al., 2020). The microscope resolution was limited to a minimum particle size of 45 μm, and the size was determined using the maximum length of each particle (including fibers). The number of MPs present in each photograph was then calculated manually and obtained by integration, after which they were classified according to their normalized sizes, colors, and shapes (Figure 3) (Li et al., 2021a). However, visual observation alone cannot fully and accurately identify MPs (Silva et al., 2018). In this study, the most common types of suspicious MPs representing visual identification were selected. The analysis was performed by micro-Fourier transform infrared spectroscopy (Frontier, PerkinElmer, USA). The obtained spectra were compared with the library spectra on the instrument. Particles were identified as MPs only if they matched the spectral library by > 70% (Hidalgo–Ruz et al., 2012).
Quality Assurance and Control
Cotton lab coats were worn during all experimental steps, such as sampling, sample pre-treatment, and testing to protect the fibers from other clothing materials (Nuelle et al., 2014). During the experiments, glass/metal containers and instruments were covered with aluminium foil after rinsing several times with distilled water to prevent MPs from falling out. Prior to sample filtration, all solutions were filtered through a glass fiber filter membrane (47 mm diameter, 10 µm pore size) to prevent interference from external MPs. In addition, to prevent the effect of fibers on the filter membrane, the membrane was washed several times with distilled water. During sample pre-treatment, a set of blank experimental procedures was prepared, where the same volume of ultrapure water was used in place of the seawater sample and treated as the other samples throughout the process. On average, four artificial fibers were detected on the filter membranes of the environmental blank group, which could be due to airborne MPs (Dris et al., 2015; Prata, 2018; Zhu et al., 2019). The final data were corrected for the average MP concentration in the corresponding blank group.
Quantifying the Diversity of Microplastics (MPs) Entering Zhanjiang Bay (ZJB) From Land-Based Sources
To estimate the complexity of MP types and sources in ZJB, the diversity indices D’ (MPs) were calculated according to Equation (1) (Wang et al., 2019; Huang et al. 2020b; Huang et al., 2021). In summary, three types of D’ (MPs), namely, size D’ (MPs), color D’ (MPs), and shape D’ (MPs) were calculated based on their shape, color, and size characteristics, respectively.
where S is the number of MP categories, Ni is the number of MPs categorized into the ith type, and N is the total number of MPs in the sample.
Quantifying the Total Amount of MPs Entering ZJB From Land-Based Sources
MP exports were estimated from onshore sources of ZJB, which represented the MP flux from the most downstream main channel stations for which water discharge data were available. Therefore, each sampling station was used to quantify the flux of MPs transported from estuaries and sewage outlets to the coastal waters. The annual MP flux from the estuaries and sewage outlets was estimated using Equation (2), as follows (Zhang et al., 2019b; Zhang et al., 2020a):
where Fi (items) is the seasonal MP flux from land-based source i, Ci (items/m3) is the average MP abundance from daily land-based source i, and Qi (m3/s) is the daily discharge from land-based source i.
Thus, the total amount of MPs in ZJB was estimated using Equation (3):
where Fi (items) is the single-season flux of 12 stations in ZJB and F (items) represents the cumulative number of MPs in three different periods in ZJB.
Statistical Analysis
Microsoft Excel 2019 was used for the analysis of MP data. Software Origin2022 (Origin Lab Corporation, Northampton, MA, USA) was employed for graphical analysis. Two-way ANOVA was used in SPSS28 to detect whether the two factors, namely, station and seasonal period significantly affected single and multiple elements. The former analyzed the abundance and flux of MPs, and the latter analyzed the characteristics (size, color, and shape). Pearson correlation coefficients were used to determine the correlation between MP flux and river discharge. All correlation analyses were determined to be significant at p< 0.05 and highly significant at p< 0.01. The station locations were mapped using ArcGIS 10.2 (Esri Corporation, New York, USA).
Results
Spatiotemporal Pattern of MPs in ZJB From Land-Based Sources
The abundance of MPs in ZJB from land-based sources during the wet, normal, and dry seasons was observed; however, no significant differences in MP abundance were found among stations or seasonal periods (p > 0.05) (Figure 2). MPs were detected in all water samples collected from 12 sampling stations, with a total mean abundance of 17.99 ± 9.72 items/L. Under the microscope, MPs were detected from 7.00 to 40.33 items/L (average: 15.59 ± 8.94 items/L) in the wet season, from 12.00 to 25.33 items/L (average: 18.90 ± 4.97 items/L) in the normal season, and from 3.33 to 45.52 items/L (average: 19.48 ± 13.66 items/L) in the dry season. The highest MP abundance in the dry season (45.52 ± 16.25 items/L) occurred at the Jinsha Bay sewage outlet (S7) and the lowest MP abundance (3.33 ± 1.15 items/L) occurred at Guandu aquaculture sewage outlet (S11).
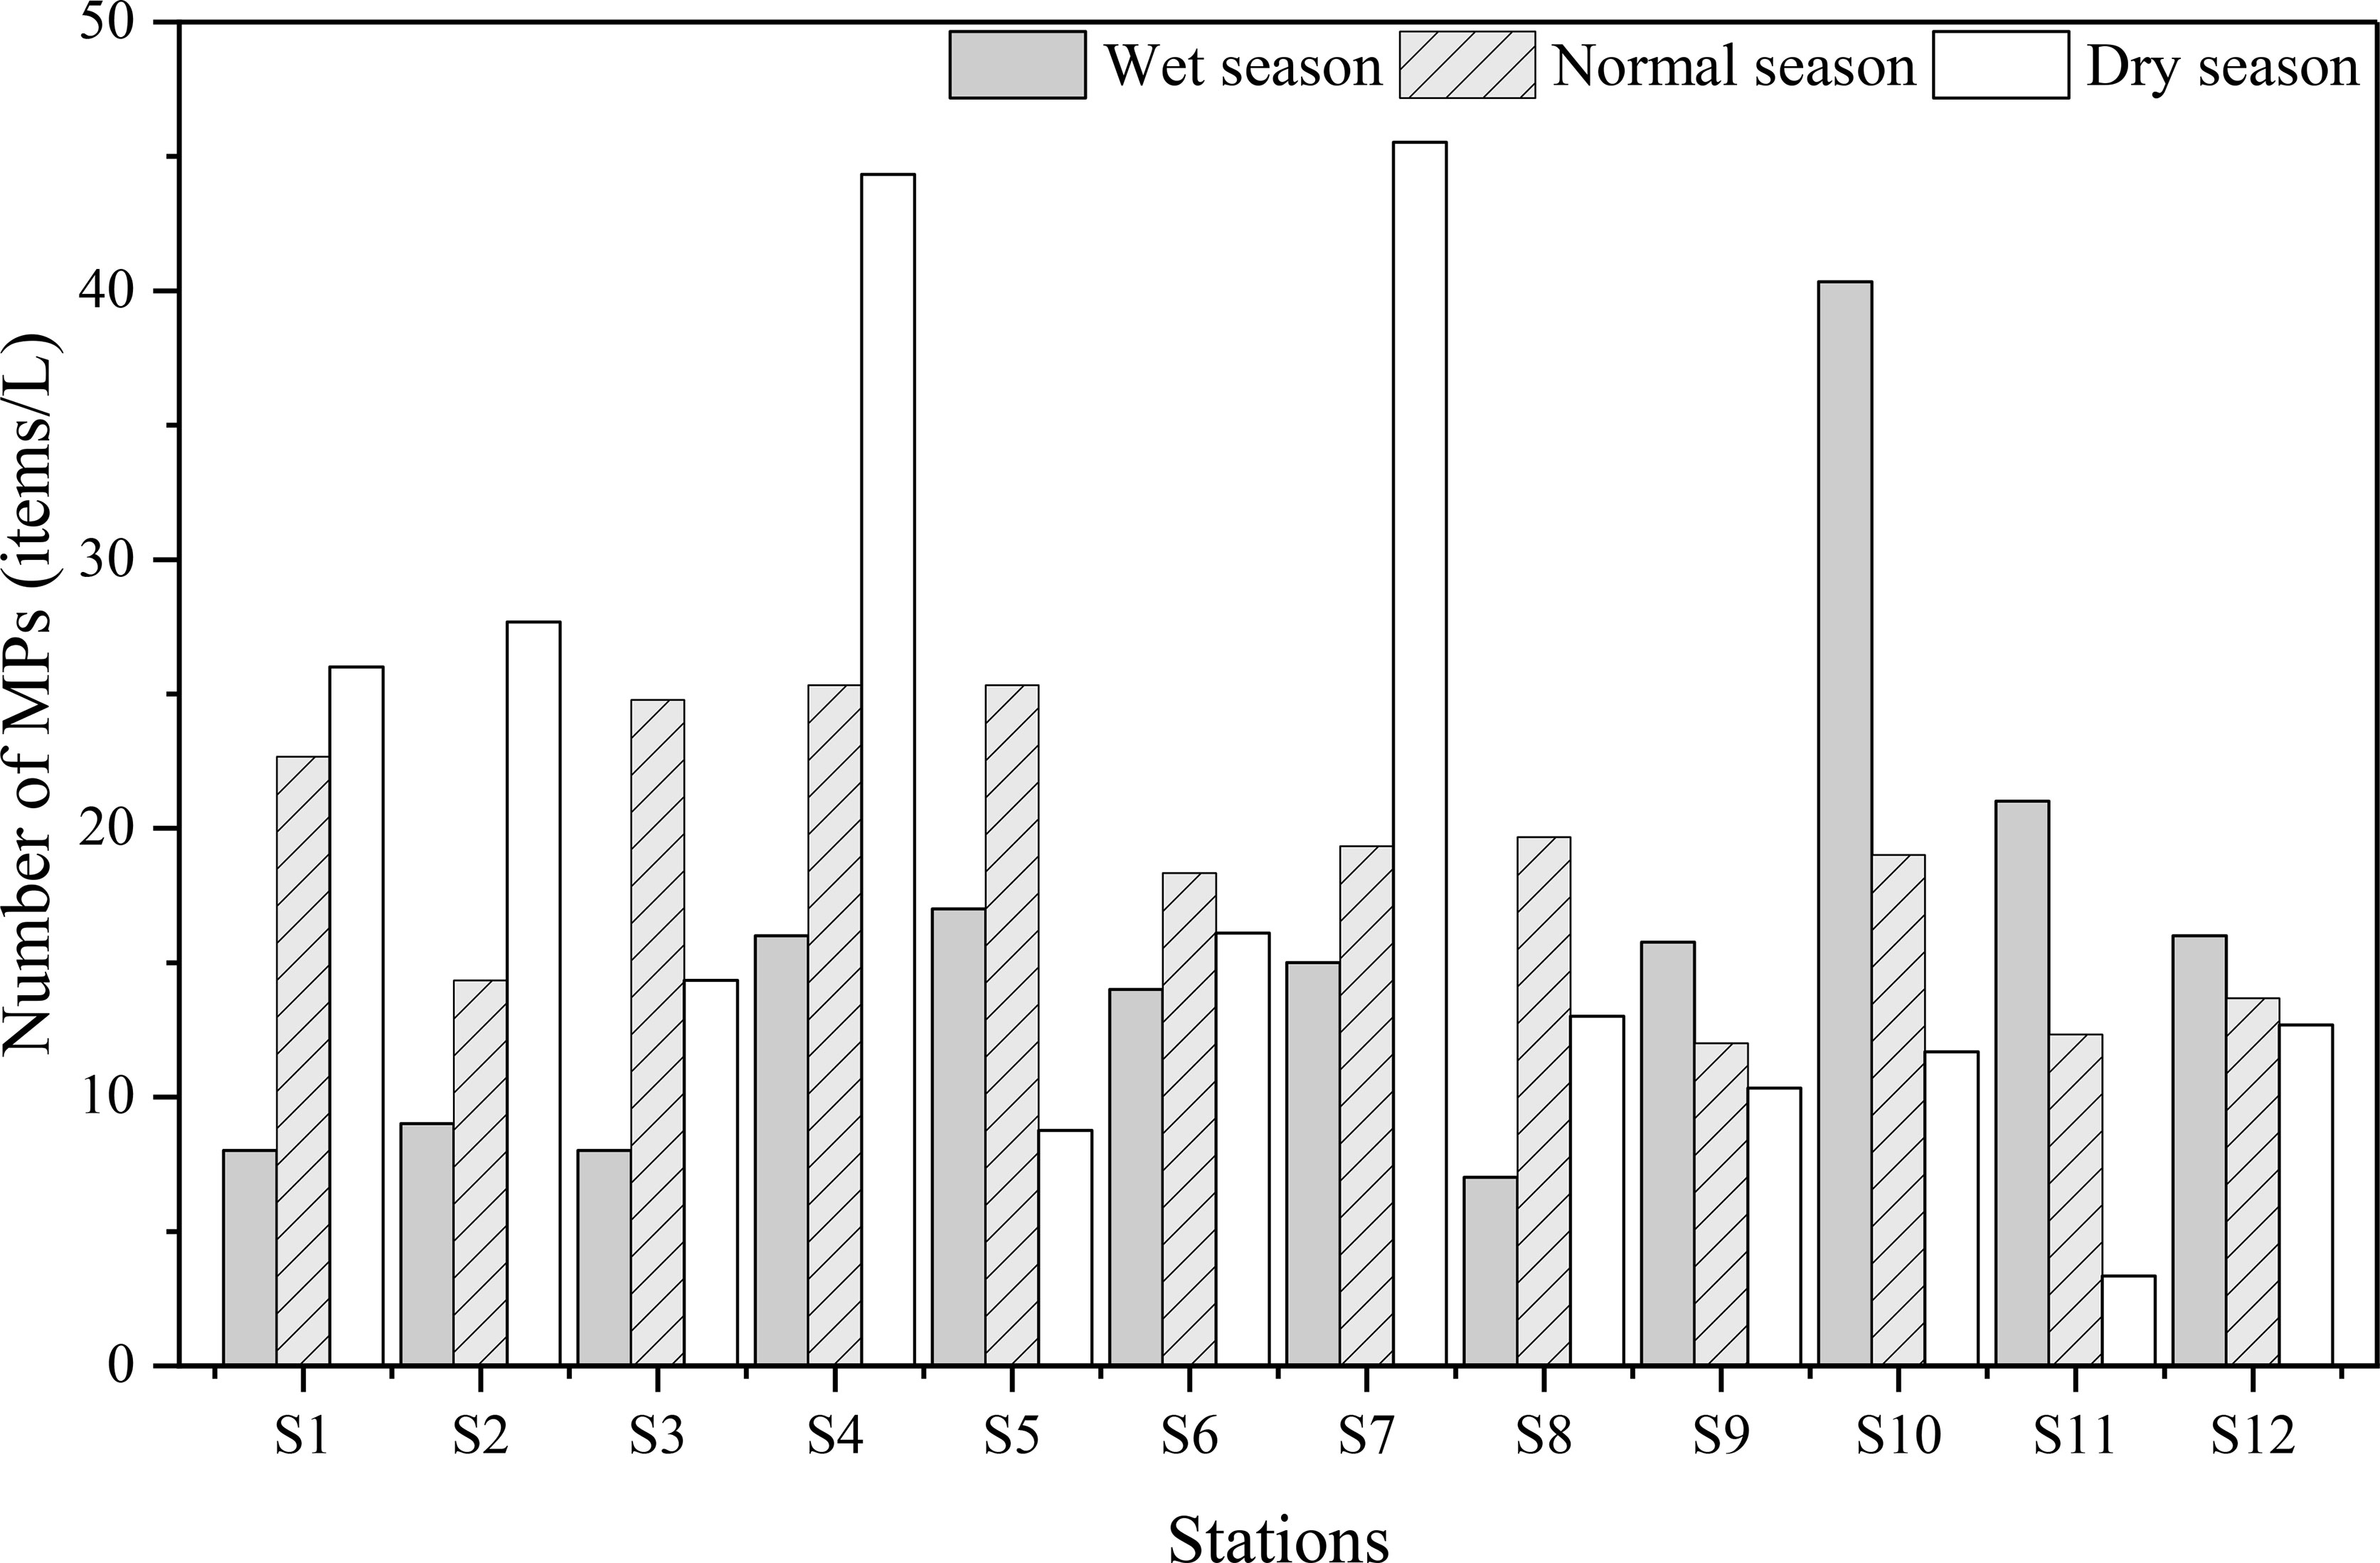
Figure 2 Spatiotemporal pattern of MPs from land-based sources in ZJB coastal water.
Spatiotemporal Composition of MPs in ZJB From Land-Based Sources
As shown in Figure 3A, among the six size groups (45–5000 μm), MPs varied significantly with seasonal periods (p< 0.05) but not among the stations (p > 0.05). MPs between 100 and 330 μm were the most abundant, accounting for 25.00%–50.00% of all detected MPs in the 12 stations during the wet season, 18.92%–52.78% during the normal season, and 12.90%–59.04% during the dry season. The second most abundant MPs in the wet season, normal season, and dry season had size ranges of 45–100 μm (28.91%), 330–500 μm (20.55%), and 500–1000 μm (21.78%), respectively. MPs with particle sizes less than 1,000 μm accounted for 87.02% of all samples and were mainly detected in the Guandu town aquaculture sewage outlet (S10) during the wet season, in the Suixi River estuary (S9) during the normal season, and in the Guandu aquaculture sewage outlet (S11) during the dry season. Thus, the smaller the particle size, the higher the abundance.
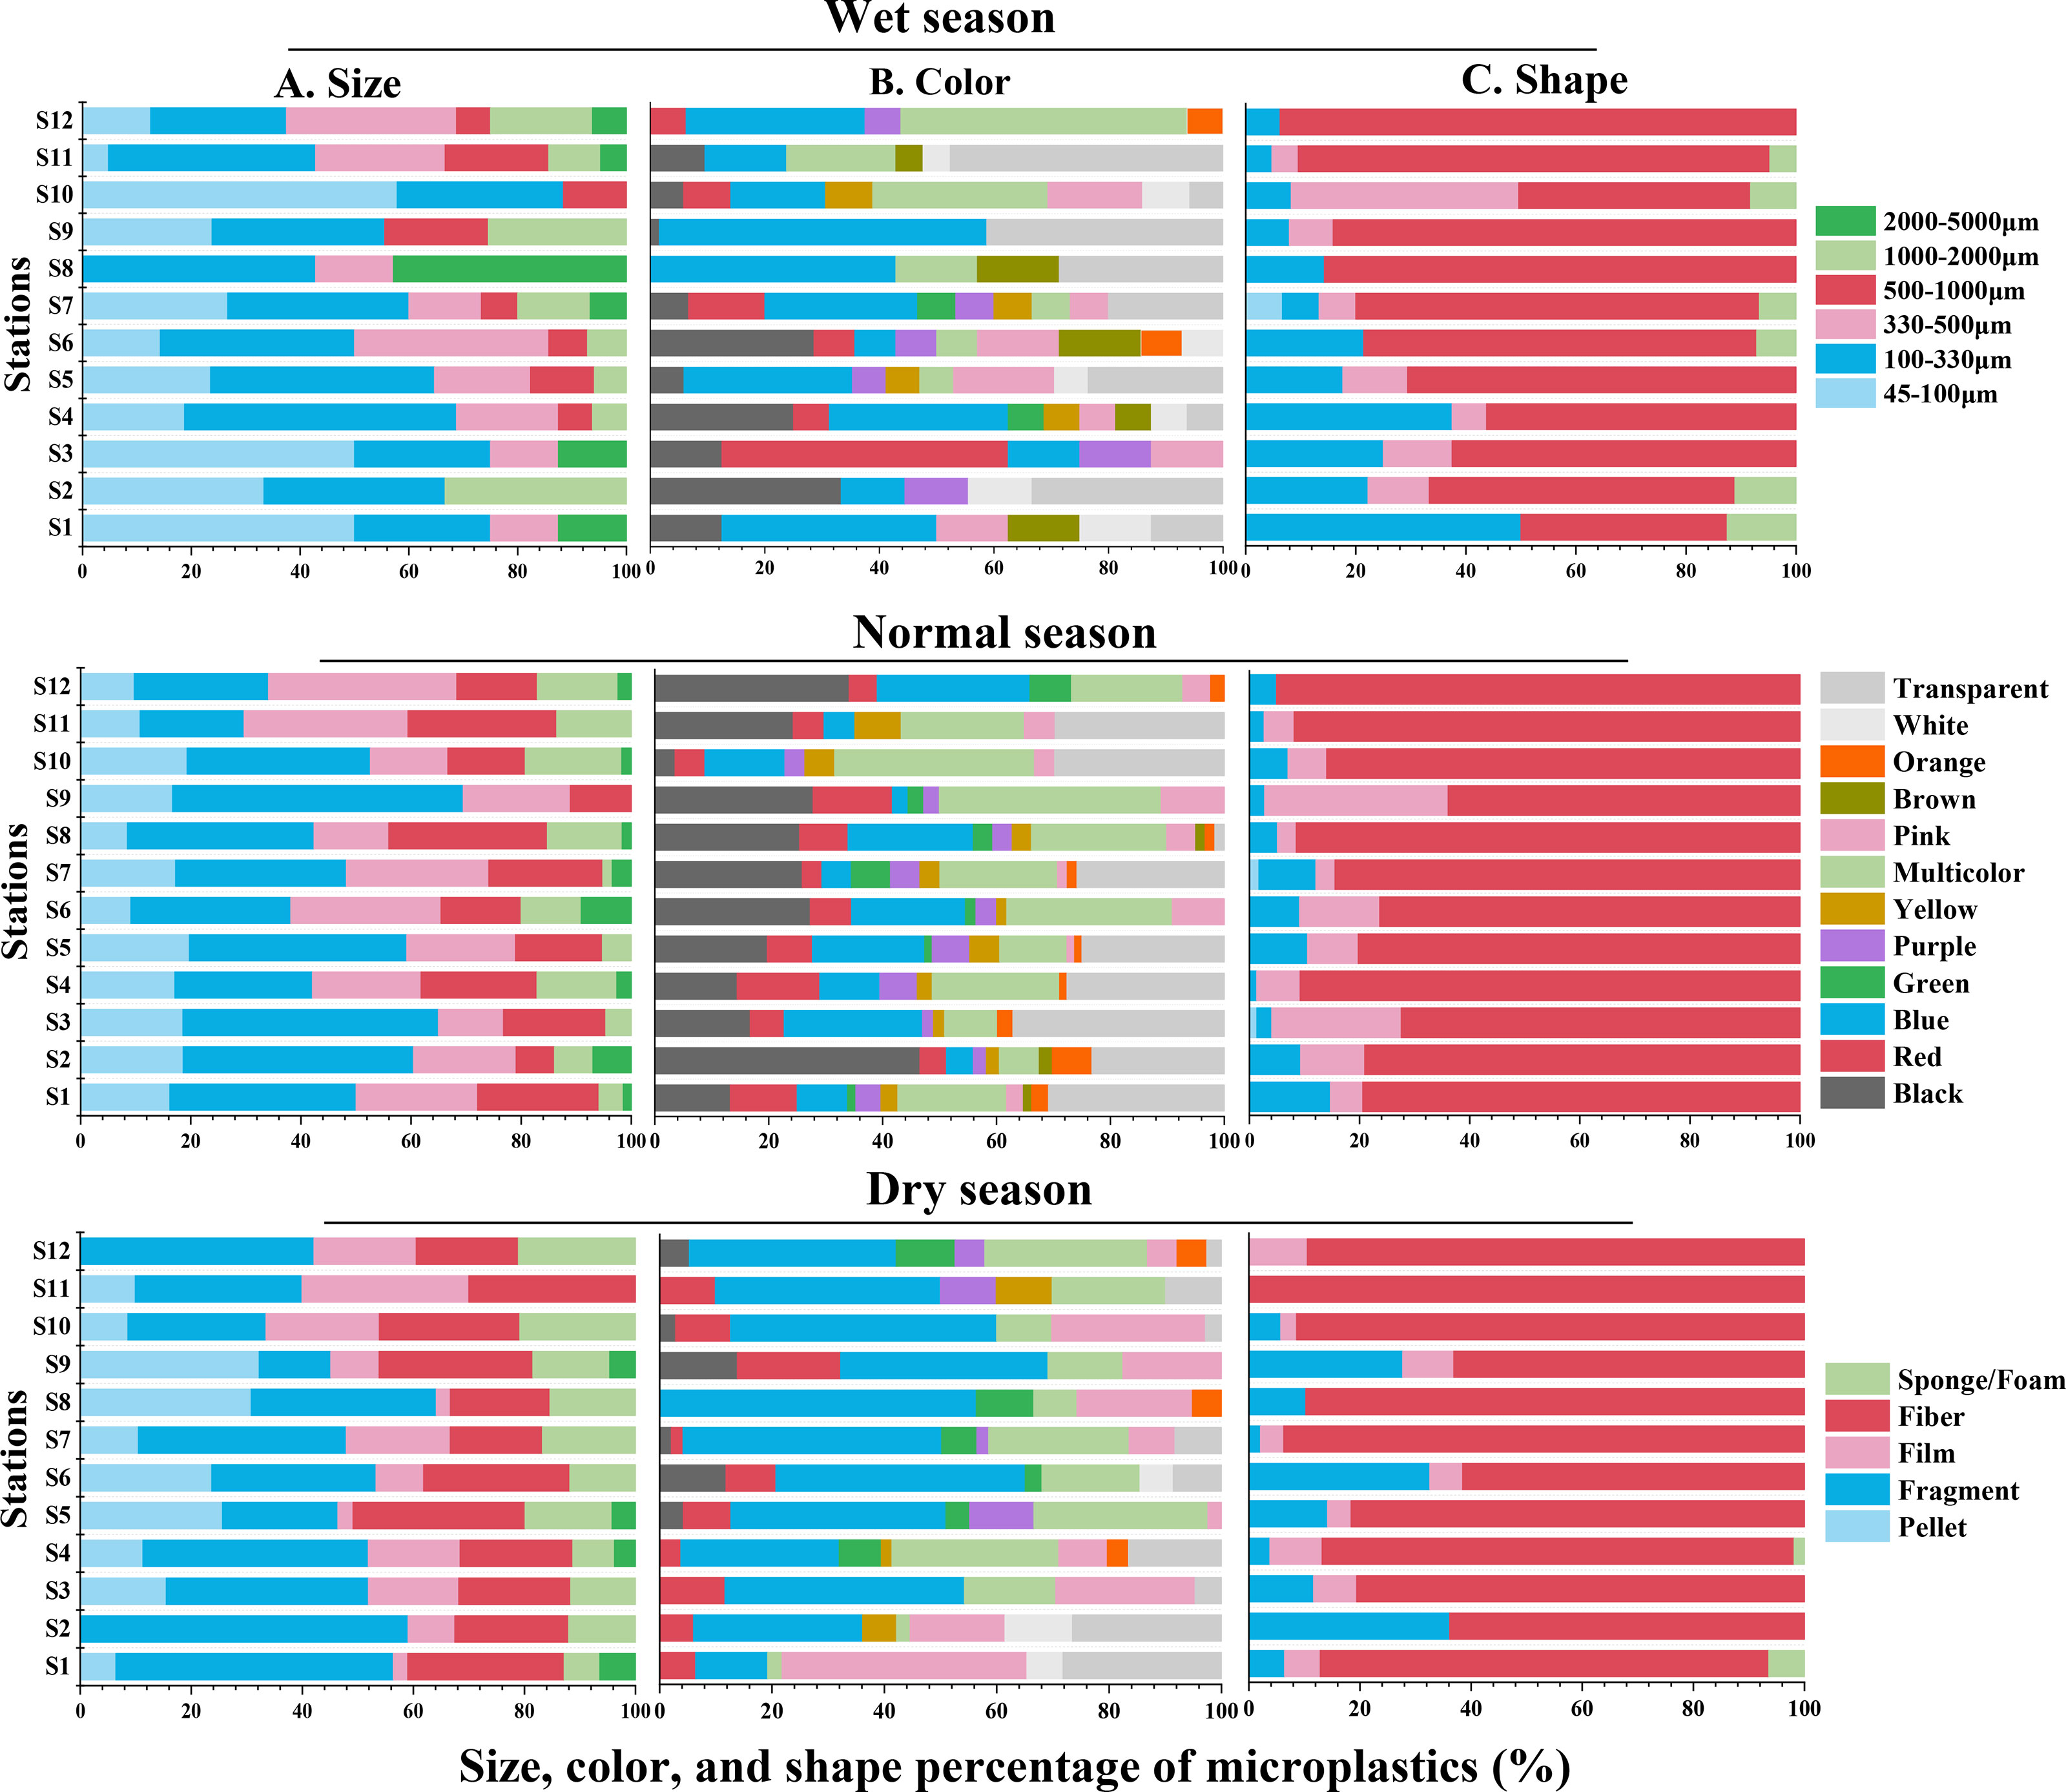
Figure 3 Spatiotemporal composition of MPs from land-based sources in ZJB (A, size; B, color; and C, shape).
In addition, the 12 colors of MPs varied remarkably among seasonal periods (p< 0.05) but not among stations (p > 0.05) (Figure 3B). In the sewage outlet water samples, the main colors were black, multicolor, transparent, and blue. During the wet season, blue (24.94%) was the most common color, followed by transparent (17.55%), multicolor (15.14%), and black (10.47%). Black (21.67%) was the most common colors in the samples during the normal season, followed by transparent (20.96%), multicolor (20.71%), and blue (14.41%). Blue (36.11%) was the most prevalent color in the dry season water samples, followed by black (17.80%), multicolor (15.25%), and transparent (12.33%). All other colors accounted for less than 10.0% in each of the three seasonal periods. Brown was the least common colors found in our study, accounting for 1.08% of all samples.
Likewise, the shapes differed significantly among seasonal periods (p< 0.05) but not among stations (p > 0.05). Fibers were the most dominant component, ranging from 37.50% to 93.75% in the wet season, from 63.89% to 95.12% in the normal season, and from 61.54% to 100.00% in the dry season at the 12 stations (Figure 3C). This was followed by fragments in the wet (4.76%–50.00%) and dry seasons (0.00%–36.14%) and by films in the normal season (0.00%–33.33%). In this study, seven stations exceeded 80% of the fibers in the normal season, the nine stations in the dry season, compared with the four stations in the wet season. In short, fibers were more likely to be found close to sewage outlets.
Typical characteristics and compositions of MPs under the micro-FTIR were shown in Figure 4. The main polymers were found in selected samples of blue fragments (A), purple films (B), faded fibers that changed from blue to transparent (C), and black fibers (D), with the main types including polyacrylate (A), polypropylene (B), polyethylene terephthalate (C), and cellulose (D).
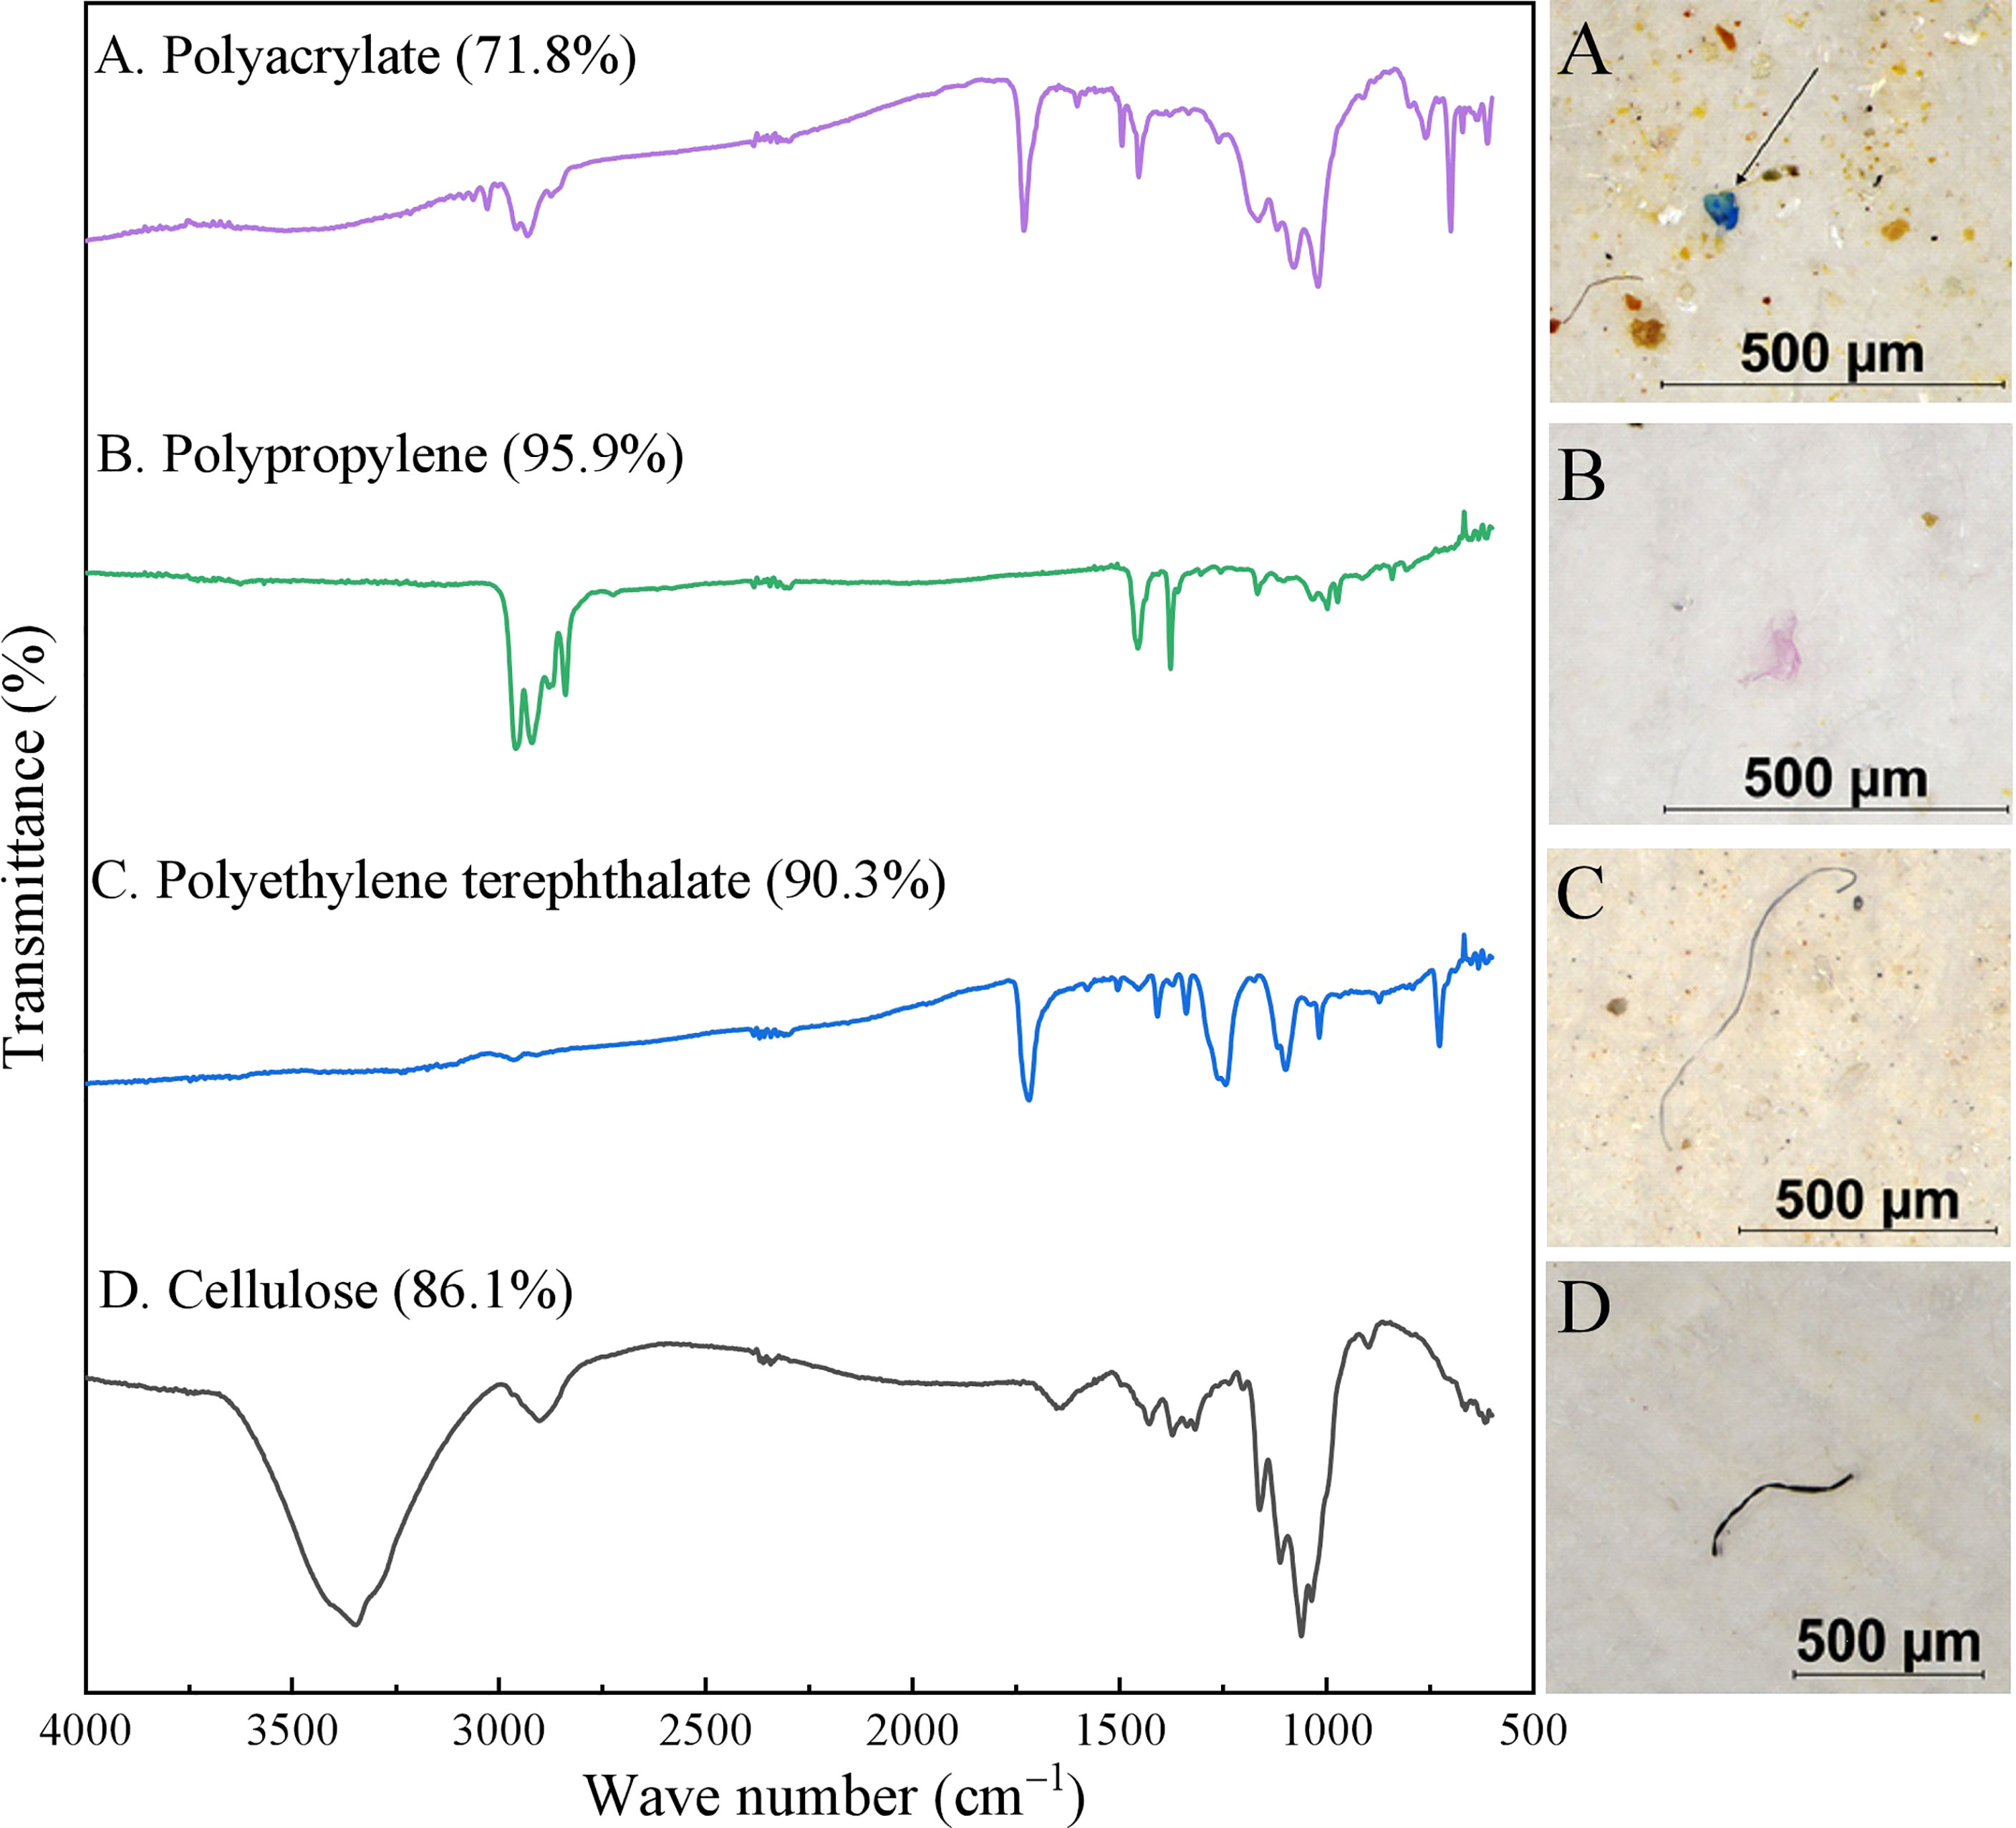
Figure 4 Typical MPs for identification and their composition. (A) Blue fragment, (B) purple film, (C) fading fiber from blue to transparent, and (D) black fiber.
Seasonal Diversity of MPs Input From Land-Based Sources in ZJB
Variations in size, color, and shape were calculated separately according to Equation (1), and the diversity of the MP size, color, and shape indices, i.e., size D’ (MPs), color D’ (MPs), and shape D’ (MPs), was significantly different in each seasonal period (p< 0.05) (Figure 5). Size D’ (MPs) (0.69 ± 0.07) was significantly different from shape D’ (MPs) (0.43 ± 0.17) (p< 0.01), and color D’ (MPs) (0.74 ± 0.10) was significantly different from shape D’ (MPs) (0.43 ± 0.17) (p< 0.001) during the wet season. Shape D’ (MPs) (0.28 ± 0.12) was significantly different from size D’ (MPs) (0.75 ± 0.04) and color D’ (MPs) (0.78 ± 0.04), respectively, during the normal season (p< 0.001). In addition, shape D’ (MPs) (0.28 ± 0.16) was significantly different from size D’ (MPs) (0.73 ± 0.06) and color D’ (MPs) (0.73 ± 0.05), respectively, during the dry season (p< 0.001).
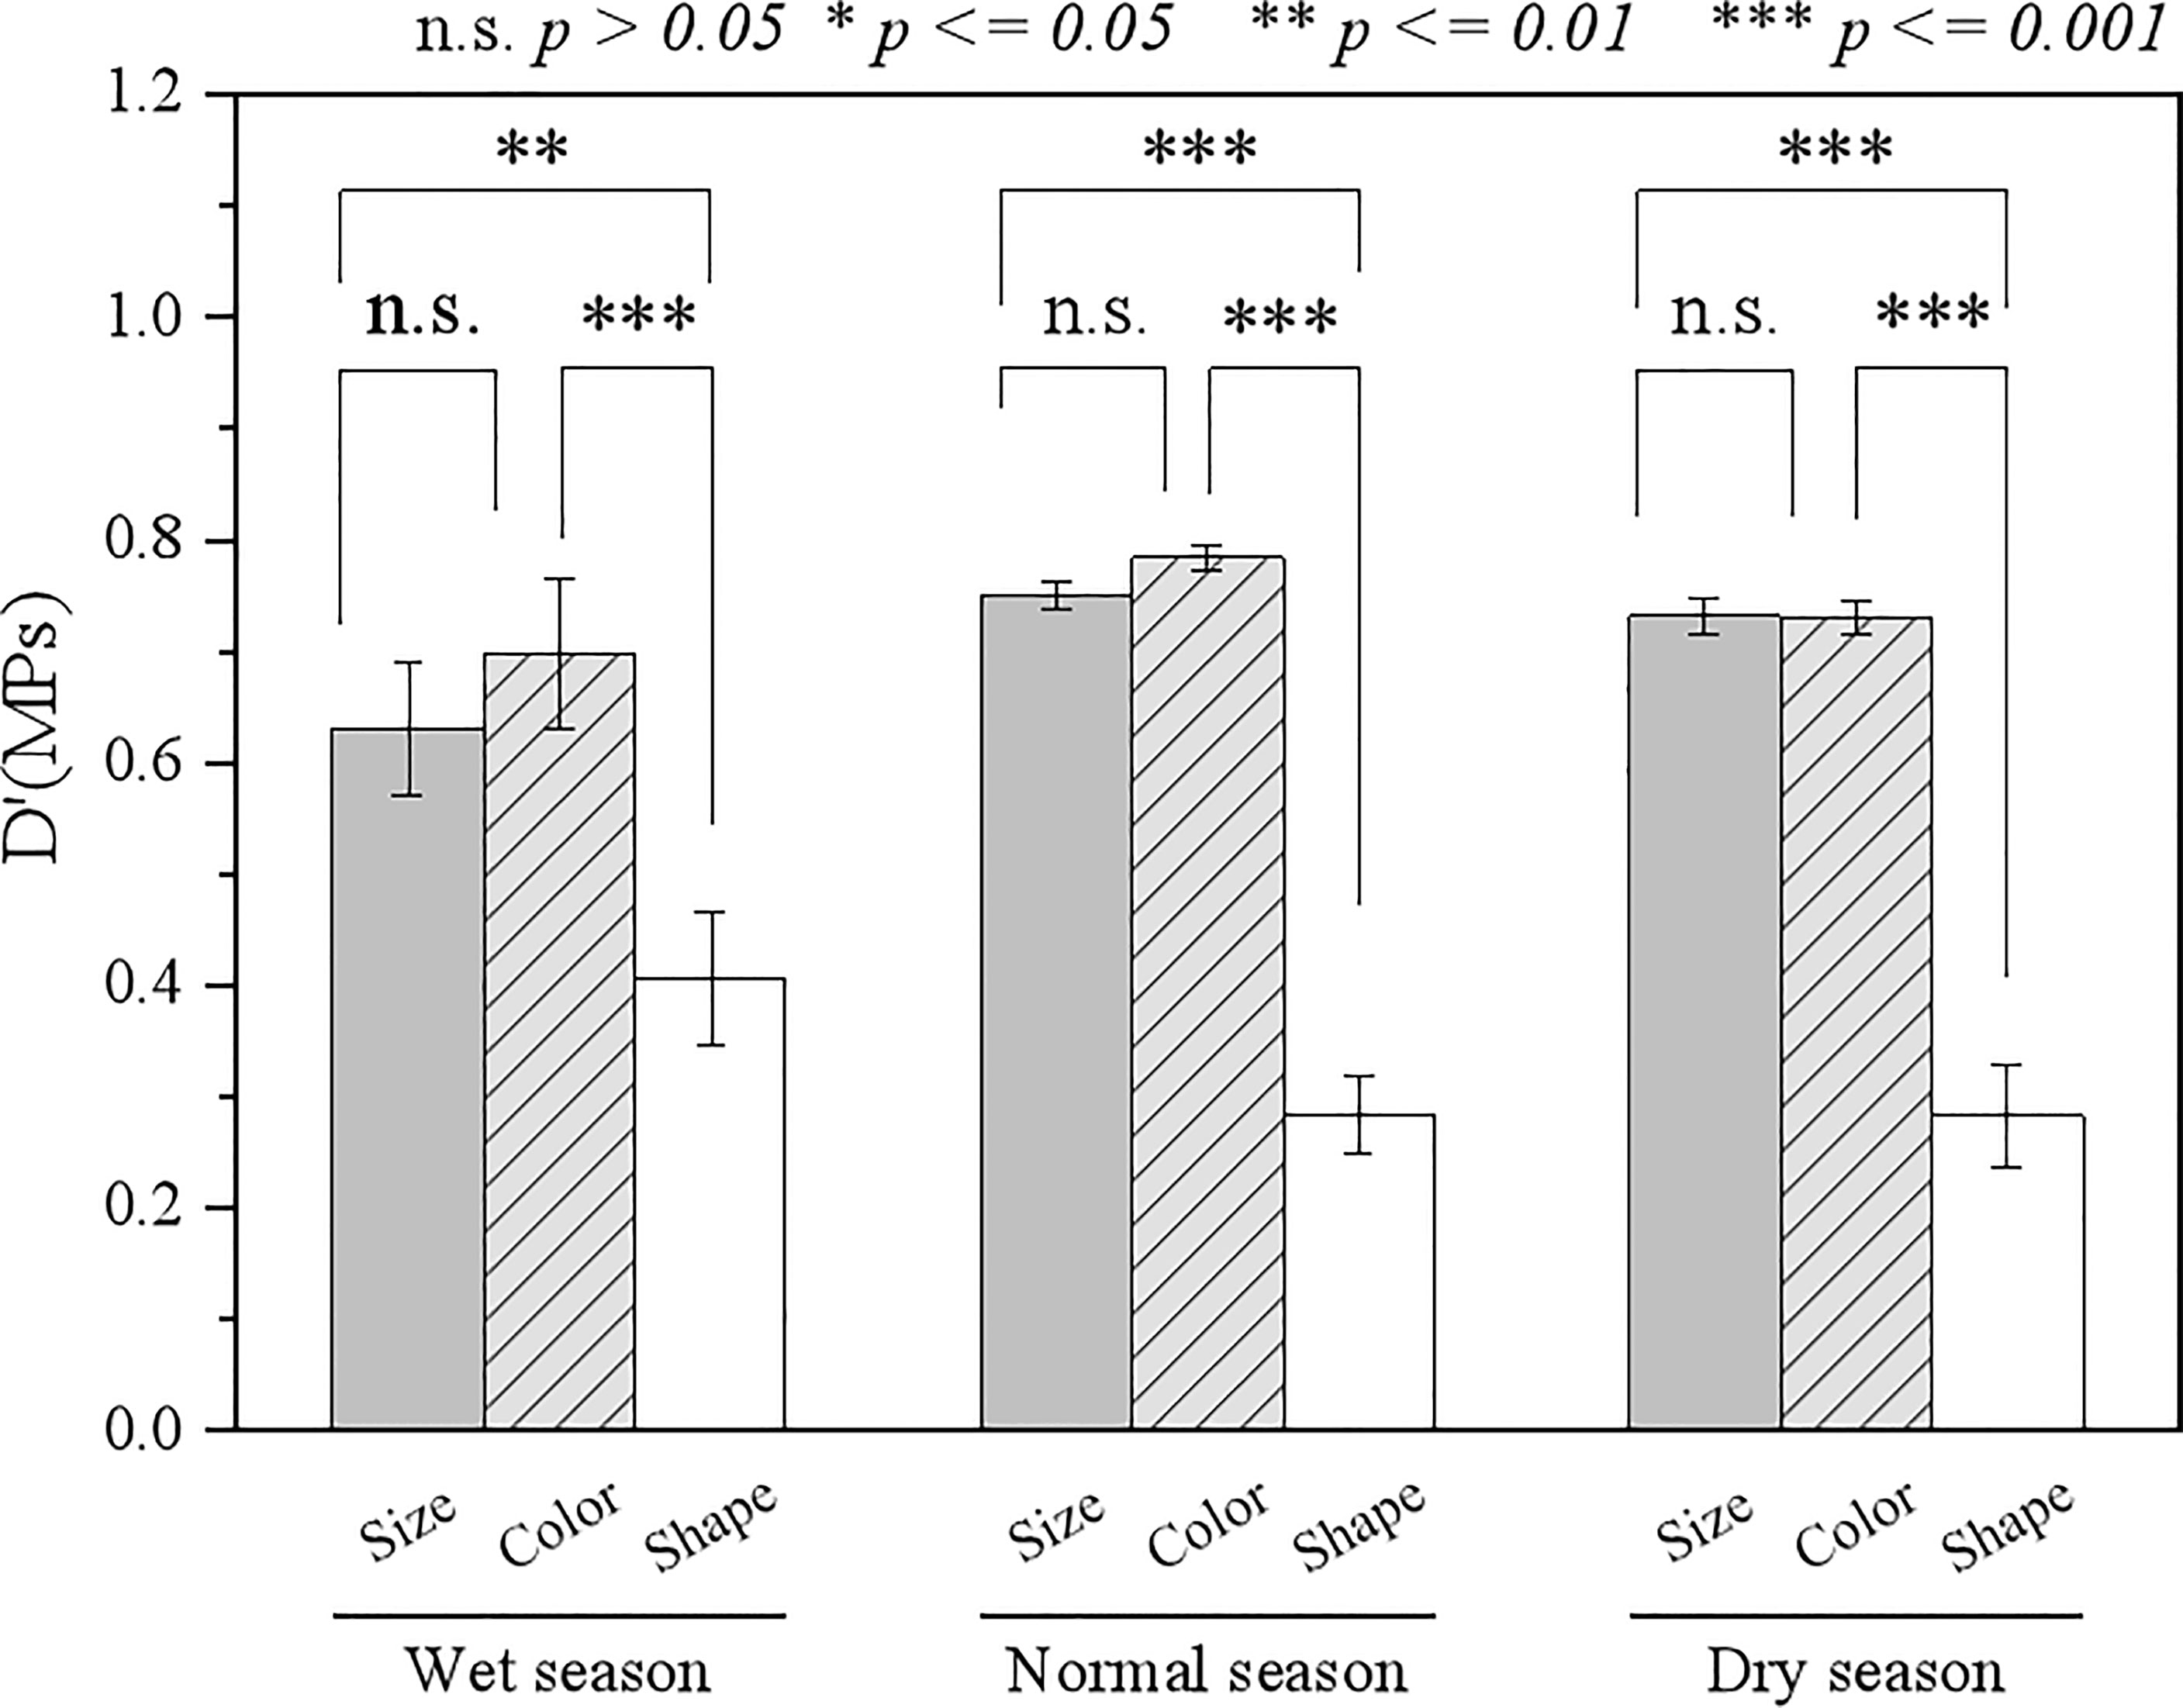
Figure 5 Seasonal diversity variation of MPs from land-based sources in ZJB.
Quantifying the Total Amount of MPs in ZJB From Land-Based Sources
At the 12 sampling stations, the MP flux varied considerably during the three seasonal periods (Figure 6). On the basis of Equations (2) and (3), the flux of MPs into the sea was calculated during the wet, normal, and dry seasons. The annual MP flux into ZJB was 8.46 × 10¹³ items, including 79.68% in the wet season, 15.19% in the normal season, and 5.13% in the dry season. The highest flux of MPs was found in the Suixi River estuary (S9), accounting for 65.06%, 63.04%, and 32.13% in the three seasonal periods, respectively. In addition, its MP flux contributed the most to the annual MP load in ZJB, that is 63.06% of the total load, whereas the Jinsha Bay sewage outlet (S7) had the lowest contribution, that is 0.04% of the total load. Given that stations S1, S8, and S12 were closed during the dry season survey, their fluxes were zero, which also led to a relatively lower contribution of fluxes in the dry season.
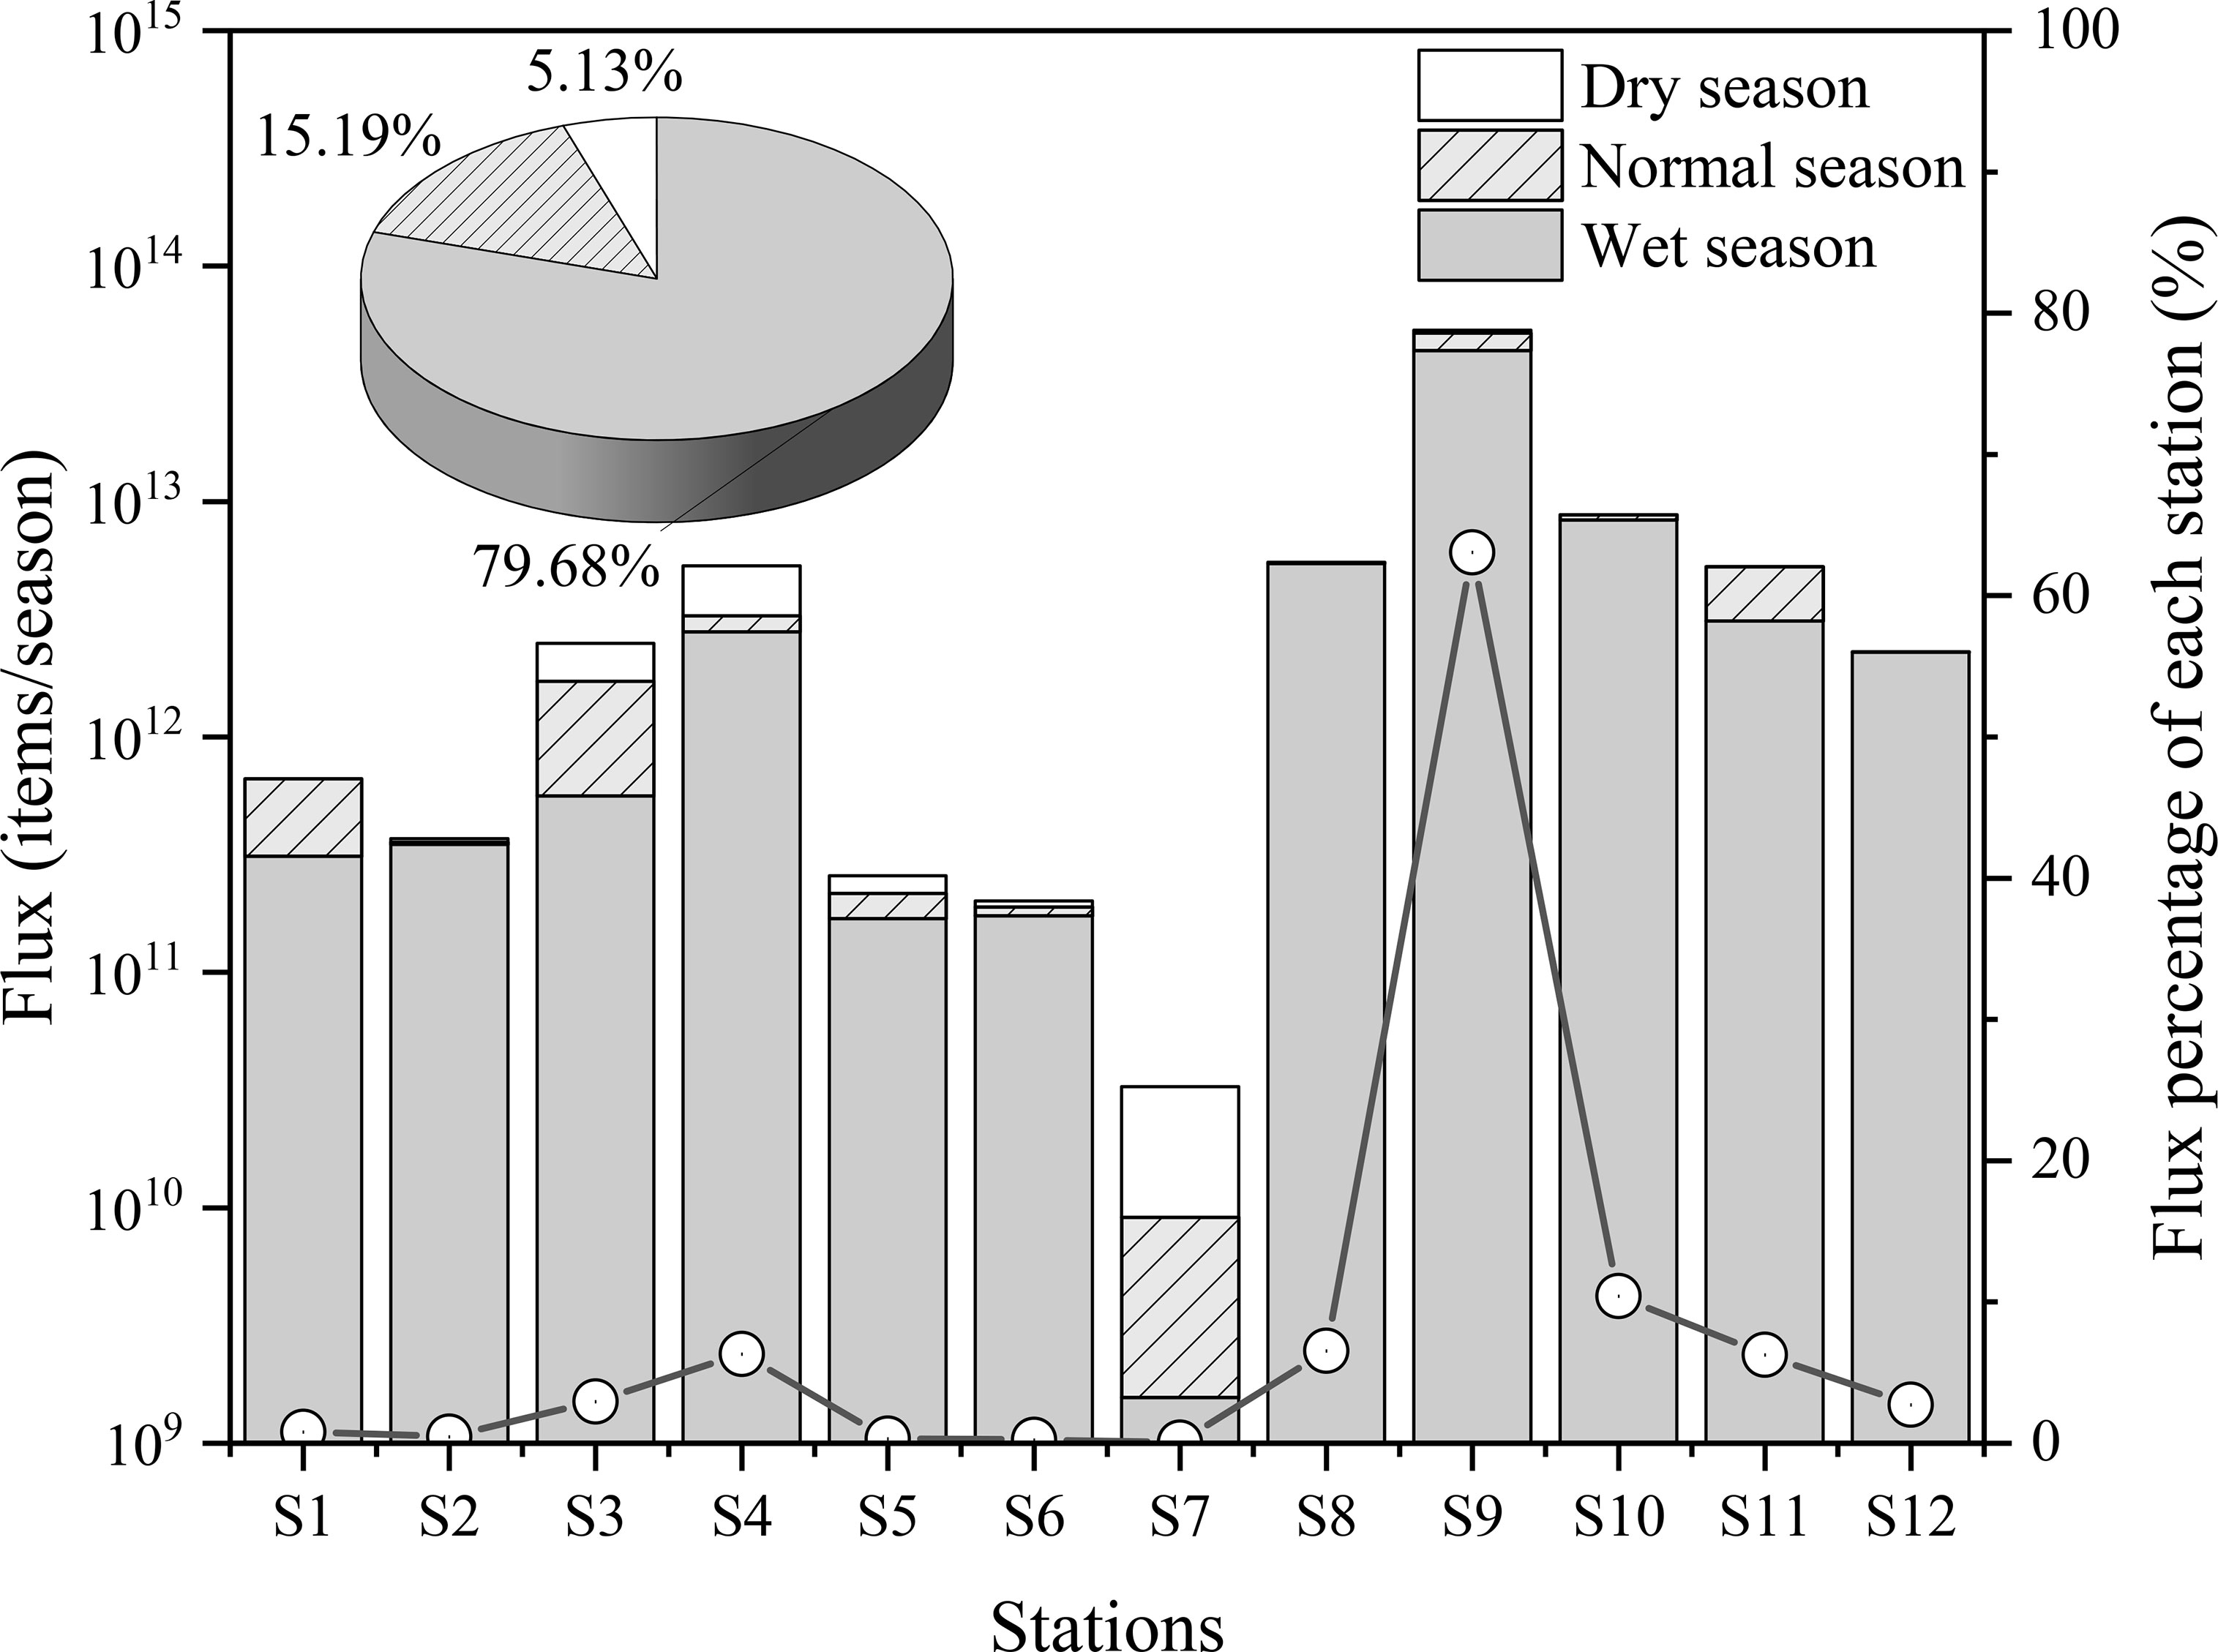
Figure 6 The total amount of MPs from land-based sources in ZJB.
Discussion
Degree of Pollution of MPs Transported to the Sea in ZJB
As demonstrated in Table 2, almost all the sampling meshes used in this study were between 10 and 75 μm. As compared with other rivers and estuaries, ZJB had moderate levels of MP pollution. The seasonal variation of MPs in coastal waters varied because ZJB influenced by local aquaculture activities, sediment discharge, industrial wastewater discharge, precipitation, and anthropogenic influences (e.g., garbage that was not disposed properly and microfibers in the waste washing machine water) (Zhao et al., 2019; Zhang et al., 2020c; Zhang et al., 2020a). The concentration of MPs in ZJB was higher than that of the Chin Ling-Wei River (Bian et al., 2022), Suzhou River (Luo et al., 2019), Charleston Harbor (Gray et al., 2018), and Chishui River, South Carolina (Li et al., 2021b). However, the range of MPs concentrations in ZJB was lower than that in other areas (Gray et al., 2018; Yan et al., 2019; Zhang et al., 2019a; Han et al., 2020; Devereux et al., 2022). The high abundance of MPs in all studies may be due to a combination of economic development (commercial and tourism activities), human activities (agricultural cultivation, aquaculture, wastewater removal, solid waste management, industrial emissions, and land use), geographical features (rivers at mid-upper levels, weak hydrodynamics, prevailing winds, and ocean currents), and population density; the relatively low abundance of MPs may be mainly ascribed to one of the factors. In the present study, ZJB was observed to have a relatively high abundance of MPs due to its semi-enclosed bay as well as poor hydrodynamic exchange conditions because of reclamation, especially in the northern and northeastern waters of the bay (Zhang et al., 2016; Zhang et al., 2020c). Other studies have shown that seasonal variation in MP abundance was usually related to rainfall, temperature, and sea breeze (Cheung et al., 2016; Eo et al., 2019). The results of this study showed that the abundance of MPs was high during the normal and dry seasons but relatively low during the wet season. In addition, the river flow varied in different seasonal periods. During the wet season, a large amount of rainfall-runoff washed away a large number of MPs (Li et al., 2021a), which might lead to the dilution of MPs (Liu et al., 2021). Rivers were known to be the major pathways for the deposition of MPs in the adjacent oceans (Lebreton et al., 2017; Zhu et al., 2019). Changes in MP concentrations were influenced by human activities (Cole et al., 2011; Barboza and Gimenez, 2015; Zhu et al., 2019), hydrodynamics of land-based sources, and coastal waters influences (Zhang et al., 2020b).
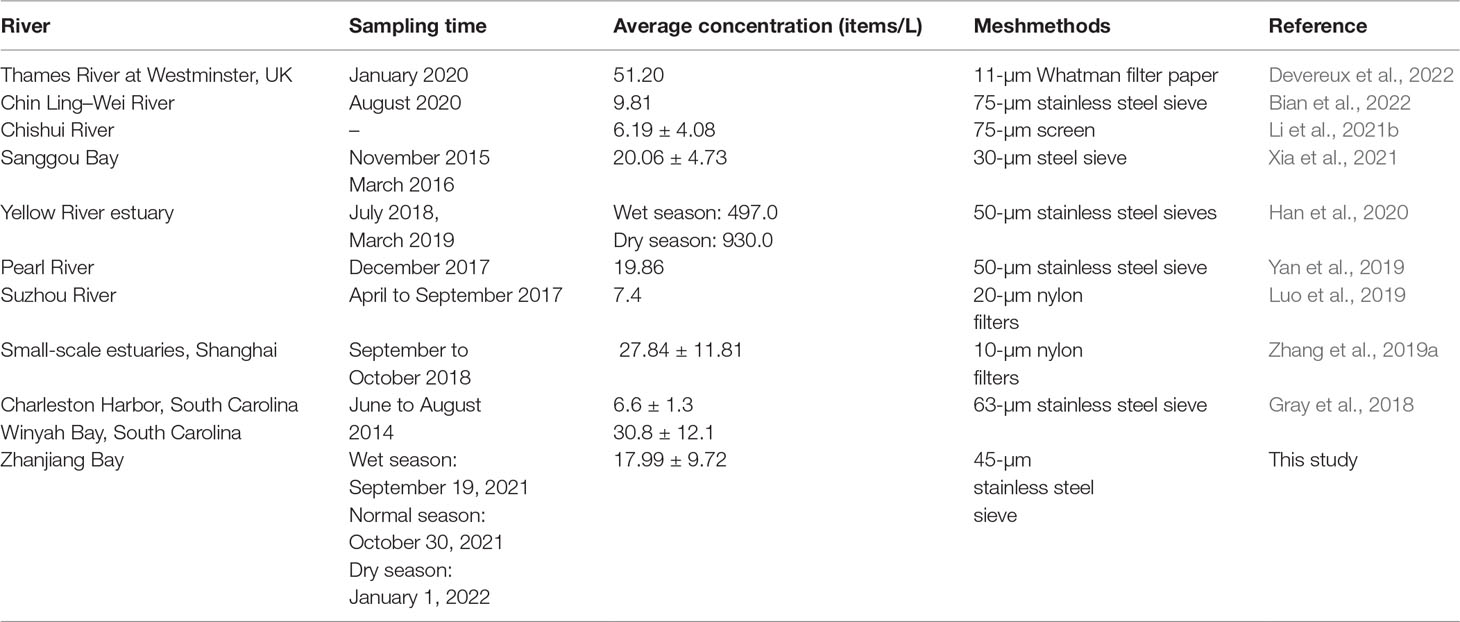
Table 2 Comparison of the abundance of MPs in ZJB with other rivers and estuaries.
Factors Controlling the Spatial Variation of MPs in ZJB
The spatial variation of MPs in estuaries and sewage outlets near ZJB may be influenced by a variety of environmental factors, such as weather conditions, watershed characteristics (Thiel et al., 2003; Kukulka et al., 2012), and anthropogenic activities (Browne et al., 2011; Zhang et al., 2015; Wang et al., 2017). Seasonal streamflow is a predominant factor that affects the spatial variation of MPs. Therefore, a high proportion of MP flux during the wet season may be due to the large freshwater discharge caused by rainfall, especially tropical storms (Kubo and Yamahira, 2020; Zhang et al., 2020c). In addition, the Suixi River is the largest contributor to the flux of MPs discharged into ZJB, which is mainly influenced by agricultural activities and rainfall-driven runoff (Zhang et al., 2019b). In contrast, owing to its proximity to the beach and the lack of dynamic tidal dynamics, most MPs at the Jinsha Bay sewage outlet (S7) tend to accumulate in the high tide area and on the dry beach, resulting in reduced water flow and MP flux (Kim et al., 2015; Lefebvre et al., 2021; Zhang et al., 2022b). Concentrations of MPs vary considerably between estuaries and sewage outlets in ZJB, indicating different anthropogenic disturbances within the coastal watershed (Zhang et al., 2020c). The limited sample size in our study may have contributed to the spatial heterogeneity of MPs in water samples (Zhao et al., 2015; Wang et al., 2017). Sewage discharges and garbage accumulation are some of the important land-based sources of plastic waste to coastal waters through surface runoff or estuaries (Fendall and Sewell, 2009); Hidalgo–Ruz et al., 2012). For example, the industrial area is in close proximity to the Nanliu River Estuary (S4), where wastewater is discharged. The Lvtang River estuary (S5) is surrounded by residential areas, so residents inevitably discharge domestic wastewater into the river or dispose plastic wastes in the river, which undergoes degradation and produces MPs. (Zhang et al., 2019b; Jian et al., 2022).
Interactions Between Discharge and MP Flux in Estuaries and Sewage Outlets
Measurements, such as discharge, are often used to derive fluxes throughout rivers or watersheds (Luo et al., 2019). Zhao et al. (2019) used average MP concentrations from field data to calculate annual plastic fluxes. Mai et al. (2019) used Manta trawls (330 µm) to sample MPs in the surface waters of the Pearl River Delta by multiplying MP concentrations by river flow to calculate riverine MP input. However, there is no single method for estimating river MP fluxes. Many factors influence riverine MP flux estimates, including different sampling methods (Bai et al., 2022), seasonal variations (Eo et al., 2019), small sampling volumes (Park et al., 2020), ease of river sampling (large, fast, or rivers with high suspended loads greatly affect river fluxes) (Bai et al., 2022), efficiency of sewage outlets (Siegfried et al., 2017), and incomplete MP data (Zhao et al., 2019). In this study, the same sampling method was used in all three seasonal periods to ensure data integrity and thus reduce the uncertainty in estimating the flux of MPs. River discharge was determined by water depth, water width, and channel velocity, whereas flux was determined by river discharge, mean abundance of MPs, and time of day. There was a significant positive linear relationship (p< 0.001) between MP flux and river discharge during the wet and normal seasons in ZJB (Figures 7A, B), which could be attributed to the fact that the input of MPs were mainly due to land-based sources (runoff-dominated Suixi River and MPs flowing into sewage outlets due to anthropogenic activities) and meteorological processes (affecting the instantaneous concentration and spatial accumulation of MPs, such as wind and rain), resulting in their accumulation in surface waters (Browne et al., 2011; Barboza and Gimenez, 2015; Luo et al., 2019). In this study, no direct linear correlation (p > 0.05) was observed during the dry season (Figure 7C). This may be due to anthropogenic influences (e.g., closure of sewage outlets, resulting in low water flow velocity as well as low depth, and thus small flux of MPs) at some stations (Guandu Town aquaculture sewage outlet S10 and Guandu aquaculture sewage outlet S11) (Besseling et al., 2017; Bai et al., 2022). However, the low river discharge but high MP flux in the Nanliu River estuary (S4) may be influenced by a combination of prevailing hydrological processes (channel morphology, turbulence, and tides) (González–Fernández et al., 2019; Luo et al., 2019; Bai et al., 2022) and wastewater treatment efficiency (Max et al., 2017). In general, there was a significant positive linear relationship between MP flux and river discharge (p< 0.001) (Figure 7D), which also revealed that estuarine and effluent discharges were the main factors limiting MP flux. However, the river discharges obtained in this study were transient, which could have been responsible for the elevated or reduced results. Therefore, further studies should focus over longer time scales to consider the temporal variability of MPs and estimate the flux of MPs with greater confidence.
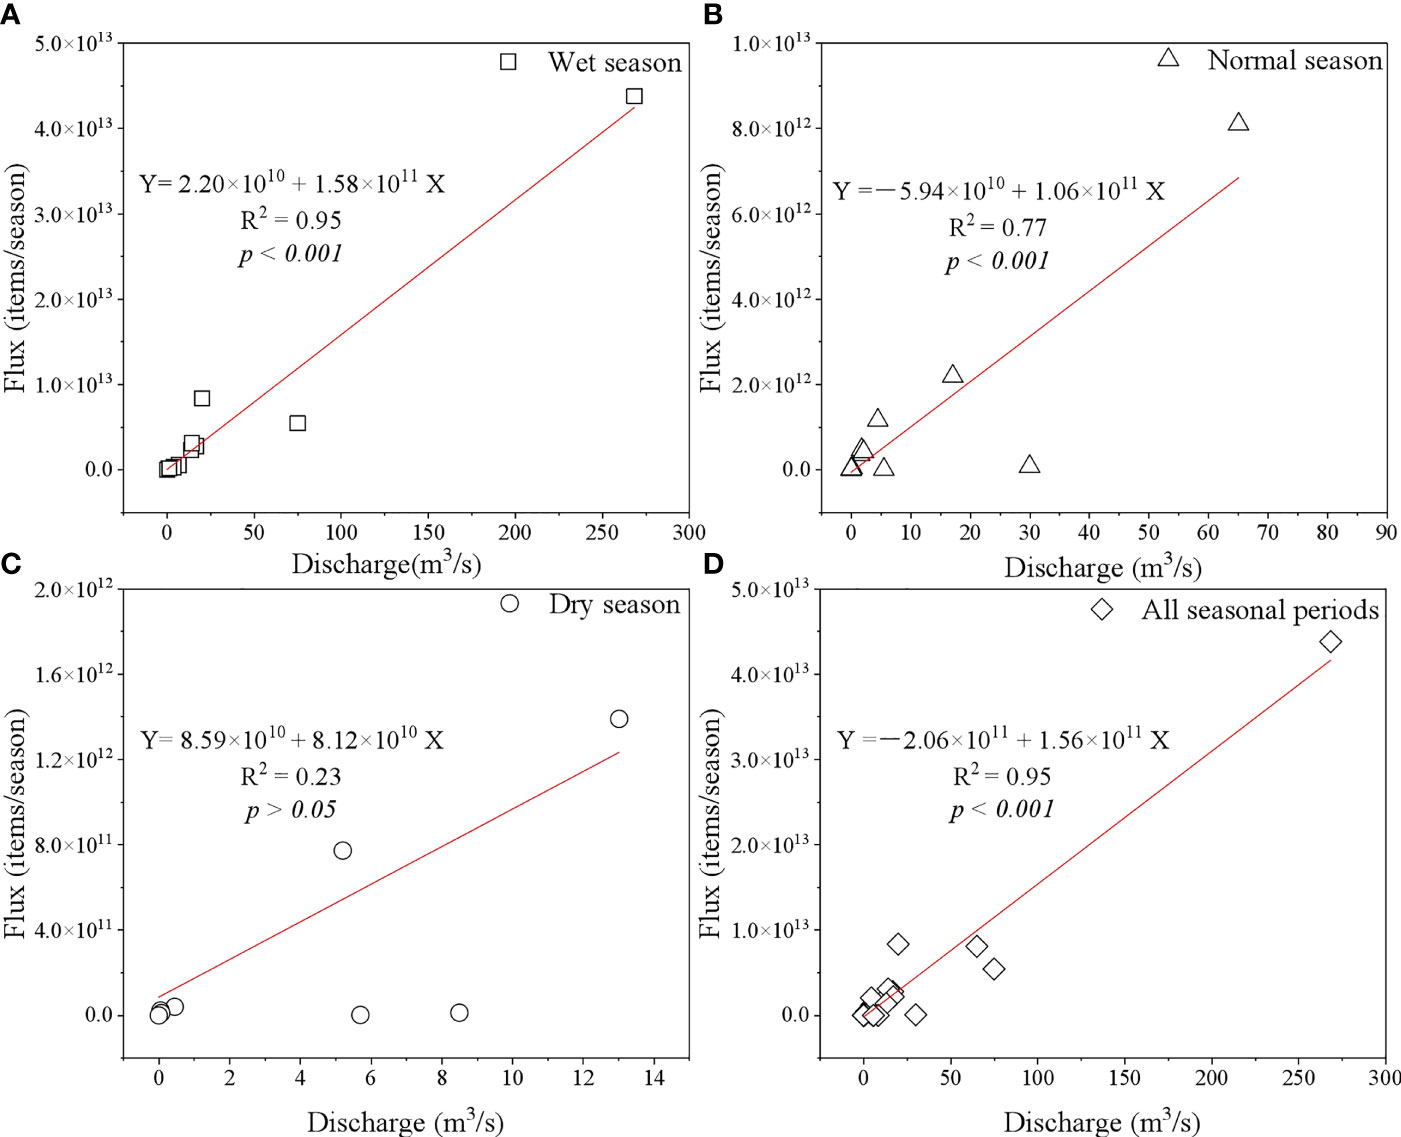
Figure 7 Linear regression relationships between river discharge and flux of MPs in ZJB. (A) Wet season, (B) Normal season, (C) Dry season, and (D) All seasonal periods.
Mitigation Strategies to Reduce the Accumulation of Contaminated MPs From Land-Based Sources
Tracing pathways of primary MPs will help in understanding the influencing factors and in developing monitoring strategies for the accumulation of MPs in rivers and sewage outlets. From the perspective of the spatial imbalance of land-based source inputs, the predominant source of MP pollution probably originated from the Suixi River estuary (S9), which had the highest runoff volume. The Suixi River contributed significantly to the load of MPs in ZJB during all seasonal periods, which was mainly due to two reasons. First, it was the largest freshwater river in ZJB with an area of 1,486 km2 (Zhang et al., 2019b). On the other hand, the Suixi River Basin was dominated by agricultural land. Because heavy rains in summer and improper disposal of plastic wastes, which got exposed to the environment, broke into MPs, and entered rivers (Zhang et al., 2019b; Jian et al., 2022). Therefore, to improve the water quality in the estuary and along the coast, more attention should be paid to their source areas during the traceability process, and measures should be taken to control the sources of pollution in the Suixi River basin. In addition, the sources of MP pollution in the Nanliu River Estuary (S4) were industrial plants in the vicinity. The effluents from these plants contained large amounts of MPs that were discharged into coastal waters (Zhang et al., 2019b; Jian et al., 2022). The MPs in the samples were mainly 100–330 μm, which were typical of MPs from sewage outlets. This explained why smaller MPs that were a source of shoreline and rivershore sediments should be tracked and treated (Browne et al., 2011; Klein et al., 2015). In addition, aquaculture areas in inland waters (S1, S2, S3, S10, and S11) were used for the culture of shrimp, crabs, and finfish. During rearing, nets and ropes made of polypropylene were widely used in fisheries around the world, including in China and Southeast Asian countries, to increase production (Xue et al., 2020). Mechanical wear and tear of these plastic fishing gears due to regular stocking, feeding, and catching could result in the release of large amounts of MPs into the marine environment. Moreover, the Lvtang River estuary (S5) in this study was heavily contaminated by untreated municipal wastewater discharge (Zhang et al., 2019b), which included a large number of fibers (cellulose). This was consistent with the study by Huang et al. (2020), who found a high percentage (70%) of fibers in fish from mangrove wetlands in ZJB, probably from fiber fishing gear and residual fibers from residential washing machines (Cole et al., 2011). Therefore, proper regulation of aquaculture activities, such as shifting from crude to intensive fisheries while maintaining the carrying capacity of the ecosystem, can help reduce the total amount of MP pollution. The establishment of wastewater treatment plants may reduce the impact of MPs on rivers and coastal waters. Furthermore, polyethylene terephthalate was mainly used in food packaging, fast food containers, or plastic containers (Du et al., 2020), which were often unintentionally released and then stranded in tourist areas (S7 and S8) (Vidyasakar et al., 2020). Blue MPs were most abundant in sewage outlets adjacent to urban living areas (S6 and S12). They were most likely to come from packaging waste from surrounding residential areas and polluted wastewater containing paint from fishing boats (Aliabad et al., 2019; Li et al., 2020). Therefore, advanced cleaning technologies should be developed in tourist areas to track and recycle plastic debris to reduce MP pollution (Zhang et al., 2022b). In addition, the government should implement policies in residential areas to reduce the production of MPs by calling on residents to recycle water and eliminating the practice of littering plastic products in public places.
Conclusion
Spatiotemporal patterns, compositions, and fluxes were investigated in the estuaries and sewage outlets of ZJB. The abundance of MPs in ZJB ranged between moderate and high, as compared with that in similar rivers. MP pollution was mainly caused by smaller-sized MPs (100–330 μm), with fiber being the dominant shape and blue being the most abundant color. In addition, the diversity of MPs varied significantly. Moreover, the annual MP flux increased remarkably with river discharge, with the Suixi River contributing the most to the MP flux. This study also indicated the widespread presence of MPs in local watersheds, which helped quantify the total amount of MPs and provided an effective mitigation strategy for ZJB. Future studies should focus on tracing the fate and transport of MPs to gain insight into MP pollution from land-based sources into the ocean.
Data Availability Statement
The original contributions presented in the study are included in the article/supplementary material. Further inquiries can be directed to the corresponding authors.
Author Contributions
Conceptualization: PZ; Methodology: PZ and JZ; Software: SW and QJ; Validation: SW and QJ; Formal analysis: SW and QJ; Writing—original draft preparation: PZ, SW, and QJ; Writing—review and editing: PZ, SW, and QJ; Visualization: DL; Supervision: LZ; Project management: PZ and JZ; Funding acquisition: PZ, XK, and JZ. All listed authors made substantial, direct, and intellectual contributions to the work and are approved for publication.
Funding
We gratefully acknowledge the Research and Development Projects in Key Areas of Guangdong Province (2020B1111020004), Guangdong Basic and Applied Basic Research Foundation (2020A1515110483), Guangdong Ocean University Fund Project (R18021), Science and Technology Special Project of Zhanjiang City (2019B01081), First-class Special Fund (231419018); Innovation Strong School Project (230420021) of Guangdong Ocean University, Project of Enhancing School with Innovation of Guangdong Ocean University (GDOU2017052502), and Province College Student Innovation and Entrepreneurship Plan (S202110566063, S202210566007) for funding.
Conflict of Interest
The authors declare that the research was conducted in the absence of any commercial or financial relationships that could be construed as a potential conflict of interest.
Publisher’s Note
All claims expressed in this article are solely those of the authors and do not necessarily represent those of their affiliated organizations, or those of the publisher, the editors and the reviewers. Any product that may be evaluated in this article, or claim that may be made by its manufacturer, is not guaranteed or endorsed by the publisher.
Acknowledgments
Special appreciation is given to the reviewers for their careful review and constructive suggestions. We thank all members of the research team and others who participated in this study.
References
Aliabad M. K., Nassiri M., Kor K. (2019). Microplastics in the Surface Seawaters of Chabahar Bay, Gulf of Oman (Makran Coasts). Mar. pollut. Bull. 143, 125–133. doi: 10.1016/j.marpolbul.2019.04.037
Bai M. Y., Lin Y., Hurley R. R., Zhu L. X., Li D. J. (2022). Controlling Factors of Microplastic Riverine Flux and Implications for Reliable Monitoring Strategy. Environ. Sci. Technol. 56, 48–61. doi: 10.1021/acs.est.1c04957
Baldwin A. K., Corsi S. R., Mason S. A. (2016). Plastic Debris in 29 Great Lakes Tributaries: Relations to Watershed Attributes and Hydrology. Environ. Sci. Technol. 50 (19), 10377–10385. doi: 10.1021/acs.est.6b02917
Barboza L. G. A., Gimenez B. C. G. (2015). Microplastics in the Marine Environment: Current Trends and Future Perspectives. Mar. pollut. Bull. 97, 5–12. doi: 10.1016/j.marpolbul.2015.06.008
Barnes D. K. A., Galgani F., Thompson R. C., Barlaz M. (2009). Accumulation and Fragmentation of Plastic Debris in Global Environments. Philos. Trans. R. Soc B Biol. Sci. 364, 1985–1998. doi: 10.1098/rstb.2008.0205
Besseling E., Quik J. T. K., Sun M., Koelmans A. A. (2017). Fate of Nano- and Microplastic in Freshwater Systems: A Modeling Study. Environ. pollut. 220, 540–548. doi: 10.1016/j.envpol.2016.10.001
Bian P. Y., Liu Y. X., Zhao K. H., Hu Y., Zhang J., Kang L., et al. (2022). Spatial Variability of Microplastic Pollution on Surface of Rivers in a Mountain-Plain Transitional Area: A Case Study in the Chin Ling-Wei River Plain, China. Ecotoxicol. Environ. Saf. 232, 113298. doi: 10.1016/j.ecoenv.2022.113298
Browne M. A., Crump P., Niven S. J., Teuten E., Tonkin A., Galloway T., et al. (2011). Accumulation of Microplastic on Shorelines Worldwide: Sources and Sinks. Environ. Sci. Technol. 45, 9175–9179. doi: 10.1021/es201811s
Browne M. A., Galloway T. S., Thompson R. C. (2010). Spatial Patterns of Plastic Debris Along Estuarine Shorelines. Environ. Sci. Technol. 44, 3404–3409. doi: 10.1021/es903784e
Cheung P. K., Cheung L. T. O., Fok L. (2016). Seasonal Variation in the Abundance of Marine Plastic Debris in the Estuary of a Subtropical Macro-Scale Drainage Basin in South China. Sci. Total Environ. 562, 658–665. doi: 10.1016/j.scitotenv.2016.04.048
Cole M., Lindeque P., Halsband C., Galloway T. S. (2011). Microplastics as Contaminants in the Marine Environment: A Review. Mar. pollut. Bull. 62 (12), 2588–2597. doi: 10.1016/j.marpolbul.2011.09.025
Darena S., Goldbeck C., Hans–Ulrich H., Peter F. (2018). Analysis of Microplastics in Water by Micro–Raman Spectroscopy: Release of Plastic Particles From Different Packaging Into Mineral Water. Water Res. 129, 154–162. doi: 10.1016/j.watres.2017.11.011
Desforges J. P., Galbraith M., Ross P. S. (2015). Ingestion of Microplastics by Zooplankton in the Northeast Pacific Ocean. Arch. Environ. Contam. Toxicol. 69, 320–330. doi: 10.1007/s00244-015-0172-5
Devereux R., Westhead E. K., Jayaratne R., Newport D. (2022). Microplastic Abundance in the Thames River During the New Year Period. Mar. pollut. Bull. 177, 113534. doi: 10.1016/j.marpolbul.2022.113534
Dris R., Gasperi J., Rocher V., Saad M., Renault N., Tassin B. (2015). Microplastic Contamination in an Urban Area: A Case Study in Greater Paris. Environ. Chem. 12, 592–599. doi: 10.1071/EN14167
Du F. N., Cai H. W., Zhang Q., Chen Q. Q., Shi H. H. (2020). Microplastics in Take-Out Food Containers. J. Hazard. Mater. 399, 122969. doi: 10.1016/j.jhazmat.2020.122969
Eerkes–Medrano D., Thompson R. C., Aldridge D. C. (2015). Microplastics in Freshwater Systems: A Review of the Emerging Threats, Identification of Knowledge Gaps and Prioritisation of Research Needs. Water Res. 75, 63–82. doi: 10.1016/j.watres.2015.02.012
Eo S., Hong S. H., Song Y. K., Han G. M., Shim W. J. (2019). Spatiotemporal distribution and annual load of microplastics in the Nakdong River, South Korea. Water Res. 160, 228–237. doi: 10.1016/j.watres.2019.05.053
Faure F., Saini C., Potter G., Galgani F., De Alencastro L. F., Hagmann P. (2015). An Evaluation of Surface Micro–and Mesoplastic Pollution in Pelagic Ecosystems of the Western Mediterranean Sea. Environ. Sci. pollut. Res. 22, 12190–12197. doi: 10.1007/s11356-015-4453-3
Fendall L. S., Sewell M. A. (2009). Contributing to Marine Pollution by Washing Your Face: Microplastics in Facial Cleansers. Mar. pollut. Bull. 58 (8), 1225–1228. doi: 10.1016/j.marpolbul.2009.04.025
Fok L., Cheung P. K. (2015). Hong Kong at the Pearl River Estuary: A Hotspot of Microplastic Pollution. Mar. pollut. Bull. 99, 112–118. doi: 10.1016/j.marpolbul.2015.07.050
Free C. M., Jensen O. P., Mason S. A., Eriksen M., Williamson N. J., Boldgiv B. (2014). High Levels of Microplastic Pollution in a Large, Remote, Mountain Lake. Mar. pollut. Bull. 85, 156–163. doi: 10.1016/j.marpolbul.2014.06.001
Frias J. P., Sobral P., Ferreira A. M. (2010). Organic Pollutants in Microplastics From Two Beaches of the Portuguese Coast. Mar. pollut. Bull. 60 (11), 1988–1992. doi: 10.1016/j.marpolbul.2010.07.030
GESAMP (2016). Sources, Fate and Effects of Microplastics in the Marine Environment: Part 2 of a Global Assessment. In: Kershaw P. J., Rochman, C.M. (Eds.), Rep. Stud. GESAMP No. 93, 220p. http://www.gesamp.org/publications/microplastics-in-the-marine-environment-part-2.
Gies E. A., LeNoble J. L., Noël M., Etemadifar A., Bishay F., Hall E. R., et al. (2018). Retention of Microplastics in a Major Secondary Wastewater Treatment Plant in Vancouver, Canada. Mar. pollut. Bull. 133, 553–561. doi: 10.1016/j.marpolbul.2018.06.006
González–Fernández D., Hanke G., Viejo Marin J., Cozar C. A. (2019). Modelling Floating Macro Litter Loads From Rivers to the Marine Environment Based on Visual Observations. Eur. Geosciences Union (EGU) Gen. Assembly Conf., 21, 18013. https://meetingorganizer.copernicus.org/EGU2019/EGU2019-18013.pdf.
Gray A. D., Wertz H., Leads R. R., Weinstein J. E. (2018). Microplastic in Two South Carolina Estuaries: Occurrence, Distribution, and Composition. Mar. pollut. Bull. 128, 223–233. doi: 10.1016/j.marpolbul.2018.01.030
Han M., Niu X.R., Tang M., Zhang B.T., Wang G.Q., Yue W.F., et al. (2020). Distribution of Microplastics in Surface Water of the Lower Yellow River near Estuary. Sci. Total Environ. 707, 135601. doi: 10.1016/j.scitotenv.2019.135601
Hidalgo–Ruz V., Gutow L., Thompson R. C., Thiel V. (2012). Microplastics in the Marine Environment: A Review of the Methods Used for Identification and Quantification. Environ. Sci. Technol. 46 (6), 3060–3075. doi: 10.1021/es2031505
Huang J. S., Koongolla J. B., Li H. X., Lin L., Pan Y. F., Liu S., et al. (2020b). Microplastic Accumulation in Fish From Zhanjiang Mangrove Wetland, South China. Sci. Total Environ. 708, 134839. doi: 10.1016/j.scitotenv.2019.134839
Huang Y. Z., Xiao X., Effiong K., Xu C. C., Su Z. N., Hu J., et al. (2021). New Insights Into the Microplastic Enrichment in the Blue Carbon Ecosystem: Evidence From Seagrass Meadows and Mangrove Forests in Coastal South China Sea. Environ. Sci. Technol. 55 (8), 4804–4812. doi: 10.1021/acs.est.0c07289
Huang Y. Z., Xiao X., Xu C. C., Perianen Y. D., Hu J., Holmer M. (2020). Seagrass Beds Acting as a Trap of Microplastics – Emerging Hotspot in the Coastal Region? Environ. pollut. 257, 113450. doi: 10.1016/j.envpol.2019.113450
Jian Q. Y., Wang S. J., Zhang P., Zhang J. B., Zhao L. R., Liu D. (2022). Microplastics Variation in Land–Based Sources Input Coastal Water Affected by the Tropical Typhoon Events in Zhanjiang Bay, China. Water 14, 1455. doi: 10.3390/w14091455
Johnny G., Stephanie L. W., Rachid D., France C., Corinne M., Mohamed G., et al. (2018). Microplastics in Air: Are We Breathing it in? Curr. Opin. Environ. Sci. Health 1, 1–5. doi: 10.1016/j.coesh.2017.10.002
Kim I. S., Chae D. H., Kim S. K., Choi S., Woo S. B. (2015). Factors Influencing the Spatial Variation of Microplastics on High–Tidal Coastal Beaches in Korea. Arch. Environ. Contam. Toxicol. 69 (3), 299–309. doi: 10.1007/s00244-015-0155-6
Klein S., Worch E., Knepper T. P. (2015). Occurrence and Spatial Distribution of Microplastics in River Shore Sediments of the Rhine-Main Area in Germany. Environ. Sci. Technol. 49 (10), 6070–6076. doi: 10.1021/acs.est.5b00492
Kubo A., Yamahira N. (2020). Super Typhoon Induced High Silica Export From Arakawa River, Japan. Environ. Sci. pollut. Res. 27, 36838–36844. doi: 10.1007/s11356-020-09634-y
Kukulka T., Proskurowski G., Morét–Ferguson S., Meyer D. W., Law K. L. (2012). The Effect of Wind Mixing on the Vertical Distribution of Buoyant Plastic Debris. Geophys. Res. Lett. 39, 7601. doi: 10.1029/2012GL051116
Law K. L., Moret–Ferguson S. E., Goodwin D. S., Zettler E. R., Deforce E., Kukulka T., et al. (2014). Distribution of Surface Plastic Debris in the Eastern Pacifific Ocean From an 11–Year Data Set. Environ. Sci. Technol. 48, 4732–4738. doi: 10.1021/es4053076
Lebreton L. C. M., van der Zwet J., Damsteeg J. W., Slat B., Andrady A., Reisser J. (2017). River Plastic Emissions to the World’s Oceans. Nat. Commun. 8, 15611. doi: 10.1038/ncomms15611
Lefebvre C., Rojas I. J., Lasserre J., Villette S., Lecomte S., Cachot J., et al. (2021). Stranded in the High Tide Line: Spatial and Temporal Variability of Beached Microplastics in a Semi–Enclosed Embayment (Arcachon, France). Sci. Total Environ. 797, 149144. doi: 10.1016/j.scitotenv.2021.149144
Leslie H. A., Brandsma S. H., Van Velzen M. J. M., Vethaak A. D. (2017). Microplastics Enroute: Field Measurements in the Dutch River Delta and Amsterdam Canals, Wastewater Treatment Plants, North Sea Sediments and Biota. Environ. Int. 101, 133–142. doi: 10.1016/j.envint.2017.01.018
Li Y. F., Liu S. G., Liu M. Y., Huang W., Chen K., Ding Y. C., et al. (2021a). Mid–level Riverine Outflow Matters: A Case of Microplastic Transport in the Jiulong River, China. Front. Mar. Sci. 8, 712727. doi: 10.3389/fmars.2021.712727
Li J. L., Ouyang Z. Z., Liu P., Zhao X. N., Wu R. R., Zhang C. T., et al. (2021b). Distribution and Characteristics of Microplastics in the Basin of Chishui River in Renhuai, China. Sci. Total Environ. 773, 145591. doi: 10.1016/j.scitotenv.2021.145591
Lisa L., Emilie S., Thuy-C K.-L., Rachid D., Kada B., Emmanuel R., et al. (2018). Macroplastic and Microplastic Contamination Assessment of a Tropical River (Saigon River, Vietnam) Transversed by a Developing Megacity. Environ. pollut. 236, 661–671. doi: 10.1016/j.envpol.2018.02.005
Liu S., Chen H., Wang J. Z., Su L., Wang X. L., Zhu J. M., et al. (2021). The Distribution of Microplastics in Water, Sediment, and Fish of the Dafeng River, a Remote River in China. Ecotox. Environ. Safe. 228, 113009. doi: 10.1016/j.ecoenv.2021.113009
Li R. L., Yu L., Chai M., Wu H., Zhu X. (2020). The Distribution, Characteristics and Ecological Risks of Microplastics in the Mangroves of Southern China. Sci. Total Environ. 708, 135025. doi: 10.1016/j.scitotenv.2019.135025
Luo W. Y., Su L., Craig N. J., Du F. N., Wu C. X., Shi H. H. (2019). Comparison of Microplastic Pollution in Different Water Bodies From Urban Creeks to Coastal Waters. Environ. pollut. 246, 174–182. doi: 10.1016/j.envpol.2018.11.081
Mai L., You S. N., He H., Bao L. J., Liu L. Y., Zeng E. Y. (2019). Riverine Microplastic Pollution in the Pearl River Delta, China: Are Modeled Estimates Accurate? Environ. Sci. Technol. 53 (20), 11810–11817. doi: 10.1021/acs.est.9b04838
Mani T., Hauk A., Walter U., Burkhardt–Holm P. (2015). Microplastics Profile Along the Rhine River. Sci. Rep. 5, 17988. doi: 10.1038/srep17988
Marine Litter Solutions (2020) The Declaration of the Global Plastics Associations for Solutions on Marine Litter – 5th Progress Report. Available at: https://www.marinelittersolutions.com/wp-content/uploads/2020/08/ACC_12376_2020-Marine-Litter-Solutions_V5_Pages_NoCropsBleeds.pdf.
McCormick A., Hoellein T. J., Mason S. A., Schluep J., Kelly J. J. (2014). Microplastic is an Abundant and Distinct Microbial Habitat in an Urban River. Environ. Sci. Technol. 48, 11863–11871. doi: 10.1021/es503610r
MEPC (2002a). Technical Specifications Requirements for Monitoring of Surface Water and Waste Water. Ministry of Environment Protection, People’s Republic of China (Beijing, China: Standards Press of China). Available at: https://www.mee.gov.cn/image20010518/3589.pdf.
Ministry of Water Resources (2005). Code for Liquid Flow M Easurement in Open Channels: GB50179–93; People’s Republic of China (Beijing, China: Standards press of China).
Ng K. L., Obbard J. P. (2006). Prevalence of Microplastics in Singapore’s Coastal Marine Environment. Mar. pollut. Bull. 52 (7), 761–767. doi: 10.1016/j.marpolbul.2005.11.017
NOAA (2015) Laboratory Methods for the Analysis of Microplastics in the Marine Environment: Recommendations for Quantifying Synthetic Particles in Waters and Sediments. Available at: https://marinedebris.noaa.gov/sites/default/files/.
Nuelle M. T., Dekiff J. H., Remy D., Fries E. (2014). A New Analytical Approach for Monitoring Microplastics in Marine Sediments. Environ. pollut. 184, 161–169. doi: 10.1016/j.envpol.2013.07.027
Oßmann B. E., Sarau G., Holtmannspotter H., Pischetsrieder M., Christiansen S. H., Dicke W. (2018). Small–sized Microplastics and Pigmented Particles in Bottled Mineral Water. Water Res. 141, 307–316. doi: 10.1016/j.watres.2018.05.027
Pan Z., Sun Y., Liu Q. L., Lin C., Sun X. W., He Q., et al. (2020). Riverine Microplastic Pollution Matters: A Case Study in the Zhangjiang River of Southeastern China. Mar. pollut. Bull. 159, 111516. doi: 10.1016/j.marpolbul.2020.111516
Park T. J., Lee S. H., Lee M. S., Lee J. K., Lee S. H., Zoh K. D. (2020). Occurrence of Microplastics in the Han River and Riverine Fish in South Korea. Sci. Total Environ. 708, 134535. doi: 10.1016/j.scitotenv.2019.134535
Peters C. A., Bratton S. P. (2016). Urbanization is a Major Influence on Microplastic Ingestion by Sunfish in the Brazos River Basin, Central Texas, USA. Environ. pollut. 210, 380–387. doi: 10.1016/j.envpol.2016.01.018
Prata J. C. (2018). Airborne Microplastics: Consequences to Human Health? Environ. pollut. 234, 115–126. doi: 10.1016/j.envpol.2017.11.043
Reisser J., Shaw J., Hallegraeff G., Proietti M., Barnes D. K., Thums M., et al. (2014). Millimeter–sized Marine Plastics: A New Pelagic Habitat for Microorganisms and Invertebrates. PLoS One 9 (6), e100289. doi: 10.1371/journal.pone.0100289
Rochman C. M. (2018). Microplastics Research–From Sink to Source. Sci. 360 (6384), 28–29. doi: 10.1126/science.aar7734
Sanchez W., Bender C., Porcher J. M. (2014). Wild Gudgeons (Gobio Gobio) From French Rivers are Contaminated by Microplastics: Preliminary Study and First Evidence. Environ. Res. 128, 98–100. doi: 10.1016/j.envres.2013.11.004
Schmidt C., Krauth T., Wagner S. (2017). Export of Plastic Debris by Rivers Into the Sea. Environ. Sci. Technol. 51, 12246–12253. doi: 10.1021/acs.est.7b02368
Siegfried S., Koelmans A. A., Besseling E., Kroeze C. (2017). Export of Microplastics From Land to Sea. A Modelling Approach. Water Res. 127, 249–257. doi: 10.1016/j.watres.2017.10.011
Silva A. B., Bastos A. S., Justino C. I. L., da Costa J. P., Duarte A. C., Rocha-Santos T. A. P. (2018). Microplastics in the Environment: Challenges in Analytical Chemistry - a Review. Anal. Chim. Acta 1017, 1e19. doi: 10.1016/j.aca.2018.02.043
Silva–Cavalcanti J. S., Silva J. D. B., França E. J., Araújo M. C. B., Gusmão F. (2017). Microplastics Ingestion by a Common Tropical Freshwater Fishing Resource. Environ. pollut. 221, 218–226. doi: 10.1016/j.envpol.2016.11.068
Taryono P. E., Wardiatno Y., Mashar A. (2020). Macroplastic Distribution, Abundance, and Composition Which Flows to Cimandiri Estuary, West Java. IOP Conf. Series: Earth Environ. Science. 420, 012031. doi: 10.1088/1755-1315/420/1/012031
Thiel M., Hinojosa I., Vasquez N., Macaya E. (2003). Floating Marine Debris in Coastal Waters of the SE–Pacifific (Chile). Mar. pollut. Bull. 46, 224–231. doi: 10.1016/S0025-326X(02)00365-X
Thompson R. C., Olsen Y., Mitchell R. P., Davis A., Rowland S. J., John A. W. G., et al. (2004). Lost at Sea: Where is All the Plastic? Sci. 304, 838. doi: 10.1126/science.1094559
Tong H. Y., Jiang Q. Y., Hu X. S., Zhong X. C. (2020). Occurrence and Identification of Microplastics in Tap Water From China. Chemosphere. 252, 126493. doi: 10.1016/j.chemosphere.2020.126493
Vidyasakar A., Krishnakumar S., Kasilingam K., Neelavannan K., Magesh N. S. (2020). Characterization and Distribution of Microplastics and Plastic Debris Along Silver Beach, Southern India. Mar. pollut. Bull. 158, 111421. doi: 10.1016/j.marpolbul.2020.111421
Wang W., Ndungu A. W., Li Z., Wang J. (2017). Microplastics Pollution in Inland Freshwaters of China: A Case Study in Urban Surface Waters of Wuhan, China. Sci. Total Environ. 575, 1369–1374. doi: 10.1016/j.scitotenv.2016.09.213
Wang T., Zou X., Li B., Yao Y., Zhang Z., Li Y., et al. (2019). Preliminary Study of the Source Apportionment and Diversity of Microplastics: Taking Floating Microplastics in the South China Sea as an Example. Environ. pollut. 245, 965–974. doi: 10.1016/j.envpol.2018.10.110
Wright S. L., Kelly F. J. (2017). Plastic and Human Health: A Micro Issue? Environ. Sci. Technol. 51, 6634–6647. doi: 10.1021/acs.est.7b00423
Wu P. F., Tang Y. Y., Dang M., Wang S. Q., Jin H. B., Liu Y. S., et al. (2020). Spatial–temporal Distribution of Microplastics in Surface Water and Sediments of Maozhou River Within Guangdong–Hong Kong–Macao Greater Bay Area. Sci. Total Environ. 717, 135187. doi: 10.1016/j.scitotenv.2019.135187
Xia B., Sui Q., Sun X. M., Zhu L., Wang R. Y., Cai M. G., et al. (2021). Microplastic Pollution in Surface Seawater of Sanggou Bay, China: Occurrence, Source and Inventory. Mar. pollut. Bull. 162, 111899. doi: 10.1016/j.marpolbul.2020.111899
Xue B. M., Zhang L. L., Li R. L., Wang Y. H., Guo J., Yu K. F., et al. (2020). Underestimated Microplastic Pollution Derived From Fishery Activities and “Hidden” in Deep Sediment. Environ. Sci. Technol. 54, 2210–2217. doi: 10.1021/acs.est.9b04850
Yan M. T., Nie H. Y., Xu K. H., He Y. H., Hu Y. T., Huang Y. M., et al. (2019). Microplastic Abundance, Distribution and Composition in the Pearl River Along Guangzhou City and Pearl River Estuary, China. Chemosphere. 217, 879–886. doi: 10.1016/j.chemosphere.2018.11.093
Yonkos L. T., Friedel E. A., Perez–Reyes A. C., Ghosal S., Arthur C. D. (2014). Microplastics in Four Estuarine Rivers in the Chesapeake Bay, USA. Environ. Sci.Technol. 48, 14195–14202. doi: 10.1021/es5036317
Zhang K., Gong W., Lv J., Xiong X., Wu C. (2015). Accumulation of Floating Microplastics Behind the Three Gorges Dam. Environ. pollut. 204, 117–123. doi: 10.1016/j.envpol.2015.04.023
Zhang P., Peng C. H., Zhang J. B., Zhang J. X., Chen J. Y., Zhao H. (2022a). Long-Term Harmful Algal Blooms and Nutrients Patterns Affected by Climate Change and Anthropogenic Pressures in the Zhanjiang Bay, China. Front. Mar. Sci. 9, 849819. doi: 10.3389/fmars.2022.849819
Zhang P., Peng C. H., Zhang J. B., Zou Z. B., Shi Y. Z., Zhao L. R., et al. (2020a). Spatiotemporal Urea Distribution, Sources, and Indication of DON Bio–Availability in Zhanjiang Bay, China. Water. 12 (3), 633. doi: 10.3390/w12030633
Zhang P., Ruan H. M., Dai P. D., Zhao L. R., Zhang J. B. (2020b). Spatiotemporal River Flux and Composition of Nutrients Affecting Adjacent Coastal Water Quality in Hainan Island, China. J. Hydrol. 591, 125293. doi: 10.1016/j.jhydrol.2020.125293
Zhang P., Wei L. R., Lai J. Y., Dai P. D., Chen Y., Zhang J. B. (2019b). Concentration, Composition and Fluxes of Land–Based Nitrogen and Phosphorus Source Pollutants Input Into Zhanjiang Bay in Summer. J. Guangdong Ocean Univ. 39, 46–55. https://kns.cnki.net/kcms/detail/44.1635.n.20190624.1709.002.html
Zhang P., Wei S. S., Zhang J. B., Zhong H. F., Wang S. J., Jian Q. Y. (2022b). Seasonal Distribution, Composition, and Inventory of Plastic Debris on the Yugang Park Beach in Zhanjiang Bay, South China Sea. Int. J. Environ. Res. Public Health 19 (8), 4886. doi: 10.3390/ijerph19084886
Zhang Z. F., Xu Y. L., He J. (2016). Influences of Long–Term Reclamation Works on Hydrodynamic Environment in Zhanjiang Bay. Hydro Sci. Eng. 3, 96–104. doi: 10.16198/j.cnki.1009-640X.2016.03.013
Zhang P., Xu J. L., Zhang J. B., Li J. X., Zhang Y. C., Li Y., et al. (2020c). Spatiotemporal Dissolved Silicate Variation, Sources, and Behavior in the Eutrophic Zhanjiang Bay, China. Water. 12 (12), 3586–3586. doi: 10.3390/w12123586
Zhang J. X., Zhang C. L., Deng Y. X., Wang R. X., Ma E., Wang J. W., et al. (2019a). Microplastics in the Surface Water of Small-Scale Estuaries in Shanghai. Mar. pollut. Bull. 149, 110569. doi: 10.1016/j.marpolbul.2019.110569
Zhang J. B., Zhang Y. C., Zhang P., Li Y., Li J. X., Xu J. L., et al. (2021a). Seasonal Phosphorus Variation in Coastal Water Affected by the Land–Based Sources Input in the Eutrophic Zhanjiang Bay, China. Estuar. Coast. Shelf Sci. 252, 107277. doi: 10.1016/j.ecss.2021.107277
Zhao W. L., Huang W., Yin M. C., Huang P., Ding Y. C., Ni X., et al. (2020). Tributary Inflows Enhance the Microplastic Load in the Estuary: A Case From the Qiantang River. Mar. pollut. Bull. 156, 111152. doi: 10.1016/j.marpolbul.2020.111152
Zhao S., Wang T., Zhu L., Xu P., Wang X., Gao L., et al. (2019). Analysis of Suspended Microplastics in the Changjiang Estuary: Implications for Riverine Plastic Load to the Ocean. Water Res. 161, 560–569. doi: 10.1016/j.watres.2019.06.019
Zhao S. Y., Zhu L. X., Li D. J. (2014). Suspended Microplastics in the Surface Water of the Yangtze Estuary System, China: First Observations on Occurrence, Distribution. Mar. pollut. Bull. 86, 562–568. doi: 10.1016/j.marpolbul.2014.06.032
Zhao S. Y., Zhu L. X., Li D. J. (2015). Characterization of Small Plastic Debris on Tourism Beaches Around the South China Sea. Reg. Stud. Mar. Sci. 1, 55–62. doi: 10.1016/j.rsma.2015.04.001
Keywords: microplastics, pattern, composition, flux, land-based source
Citation: Wang S, Jian Q, Zhang P, Zhang J, Zhao L, Liu D and Kang X (2022) Tracing Land-Based Microplastic Sources in Coastal Waters of Zhanjiang Bay, China: Spatiotemporal Pattern, Composition, and Flux. Front. Mar. Sci. 9:934707. doi: 10.3389/fmars.2022.934707
Received: 02 May 2022; Accepted: 13 June 2022;
Published: 15 July 2022.
Edited by:
Renato Rodrigues Neto, Federal University of Espirito Santo, BrazilReviewed by:
Gabriel Enrique De-la-Torre, Saint Ignatius of Loyola University, PeruMitsuharu Yagi, Nagasaki University, Japan
Copyright © 2022 Wang, Jian, Zhang, Zhang, Zhao, Liu and Kang. This is an open-access article distributed under the terms of the Creative Commons Attribution License (CC BY). The use, distribution or reproduction in other forums is permitted, provided the original author(s) and the copyright owner(s) are credited and that the original publication in this journal is cited, in accordance with accepted academic practice. No use, distribution or reproduction is permitted which does not comply with these terms.
*Correspondence: Peng Zhang, emhhbmdwZW5nQGdkb3UuZWR1LmNu; Jibiao Zhang, emhhbmdqYkBnZG91LmVkdS5jbg==