 Peng Zhang
 Shujun Ou1
 Junxiao Zhang
 Jibiao Zhang
95% of researchers rate our articles as excellent or good
Learn more about the work of our research integrity team to safeguard the quality of each article we publish.
Find out more
ORIGINAL RESEARCH article
Front. Mar. Sci. , 23 September 2022
Sec. Marine Pollution
Volume 9 - 2022 | https://doi.org/10.3389/fmars.2022.1004235
This article is part of the Research Topic Coastal and Marine Environmental Quality Assessments View all 28 articles
Coastal eutrophication, the over-enrichment of water with nutrients, has become a global ecological problem. As coastal waters are subjected to great pressure due to anthropogenic influences and climate change, establishing numeric nutrient criteria for coastal waters has been exceedingly complex at present. To control and improve the water quality of the Pearl River Estuary (PRE), based on the data from 2015 to 2020, the nutrient criteria of the PRE and adjacent waters were established using frequency statistical analysis. Based on the spatiotemporal salinity patterns, the coastal waters of the PRE were divided in three subareas namely freshwater (Zone I), mixed (Zone II), and seawater (Zone III) using cluster analysis. The recommended criteria values of dissolved inorganic nitrogen (DIN) were 0.573, 0.312, and 0.134 mg·L-1 in Zones I, II, and III, respectively. The total nitrogen (TN) criterion for Zone III (0.222 mg·L-1) was much lower than those for Zone I (0.902 mg·L-1) and Zone II (0.885 mg·L-1).The dissolved inorganic phosphorus (DIP) criteria were different for the three Zones, ranging from 0.004 to 0.009 mg·L-1, and the total phosphorus (TP) recommended criteria in Zones I, II, and III were 0.039, 0.028, and 0.020 mg·L-1, respectively. In the water quality assessment, the categorizing numeric nutrients criteria can be referred and applied into fresh, mixed, and seawater zones of PRE. The results of this study provide a new nutrient reference condition in the PRE, which could be helpful in establishing integrated land-ocean unified nutrient criteria and water quality assessment, and implementing effective coastal eutrophication control in the future.
Nitrogen (N) and Phosphorus (P) are the material foundations for the growth and reproduction of phytoplankton, and their composition, concentration, and distribution directly affect the primary productivity of the ocean and food chain (Ryther and Dunstan, 1971, Anderson et al., 2002; Conley et al., 2009; Davidson et al., 2014; Lin G. and Lin X., 2022). In marine environments, N and P nutrients exist in various forms of inorganic and organic matter (Zhang et al., 2019a, Ge et al., 2021). Dissolved inorganic nitrogen (DIN, including -N, -N and -N) is the main form of N, and its concentration change is the main factor controlling the change in total nitrogen (TN) content (Wei et al., 2014; Zhang et al., 2020b; Hong et al., 2019). In addition, dissolved organic nitrogen (DON) is an important potential direct or indirect nitrogen source for microorganisms and phytoplankton (Lu et al., 2016; Luo, 2017; Luo et al., 2017; Zhang et al., 2020c). As ocean is one of the largest nitrogen pools, its important role in the marine nitrogen cycle has been widely recognized (Luo et al., 2017). The main form of P is dissolved inorganic phosphorus (DIP), which accounts for more than 50% of total phosphorus (TP), and is not only the most preferred phosphorus source for organisms, but also a limiting factor for most of the marine ecosystems (Li, 2017; Zhang et al., 2017; Zhang et al., 2019a; Zhang et al., 2020). When DIP cannot meet the needs of phytoplankton, heterotrophic bacteria in the ocean supplement DIP by hydrolyzing dissolved organic phosphorus (DOP) using alkaline phosphatase (Zhang et al., 2021). With the rapid development of industry and agriculture, the use of pesticides, fertilizers, and fossil fuels has increased significantly, and a large amount of nitrogen and phosphorus nutrients have been transported to the estuaries and coasts through river flow, atmospheric deposition, and groundwater discharge, resulting in severe eutrophication (Herbeck et al., 2013; Li et al., 2014; Ménesguen, 2014; Wang et al., 2018; Zhang et al., 2019b; Zhang et al., 2020a; Peng et al., 2021). Nutrient criteria representing the enrichment status of surface waters that are minimally impacted by human development maybe defined as the threshold value that supports a particular beneficial designated use (US EPA, 1998; US EPA, 2001). Coastal eutrophication has caused serious damage to the ecosystem and disturbed the balance of original ecosystem, resulting in outbreak of harmful algal blooms and the formation of hypoxic or anoxic zones (DePinto and Verhoff, 1977; Boynton et al., 1982; Burkholder et al., 1992; Arai, 2001; Wu, 2007; Lin et al., 2018; Xu, 2020; Ke et al., 2022; Zhang et al., 2022; Cai et al., 2011). Therefore, developing and categorizing the numeric nutrients criteria played an important role in assessing the attainment of designated uses and measuring progress toward achieving water quality goals (US EPA, 1998; US EPA, 2001; Huo et al., 2015; Yang et al., 2019).
Estuaries are mixed areas of freshwater and seawater, and the interaction of hydrodynamic environment, biochemical processes, and human activities here is very complex (Zhang et al., 2017; Li et al., 2018; Lu et al., 2018; Li et al., 2013; Liu et al., 2011). Estuaries and coastal waters are particularly vulnerable to pollution because they are the final receiving waters of most rivers in the upper reaches. Estuarine zoning is the most effective tool for coastal marine resource management, which can identify different types of estuarine, so as to different standards can be used to manage estuarine resources (Hume and Herdendorf, 1988). It is also the premise for the formulation of nutrient criteria (Liu et al., 2011). To reduce and prevent the further aggravation of eutrophication, it is necessary and urgent to develop estuarine nutrient criteria. In the 1960s, the United States carried out research on water quality criteria, published a series of literatures on water quality criteria, and issued technical guidelines for nutrient water criteria for different water bodies (such as lakes, rivers, wetlands), which had a profound impact on the formulation of nutrient criteria or standards for every American state and other countries around the world (Xu, 2020; Department of Ecology and Environment of Jiangsu Province, 2021b). The reference condition approach, mechanistic modelling, and stressor-response analysis are commonly recommended for setting nutrient criteria globally (US EPA, 2000). The US EPA applied the reference state method and mechanical model method to formulate the TN nutrient criteria values for the Tampa Bay and Florida Bay, respectively, while the European Union pioneered the transition node identification method to determine the Baltic Sea nutrient criteria (Florida Department of Environment Protection, 2007; Florida Department of Environment Protection, 2011; Wang et al., 2020; Xu, 2020). The research on nutrient criteria in China started relatively late and began at the beginning of the 20th century (Xu, 1981; Xia and Zhang, 1990). Some progress has been made in establishing nutrient criteria for lakes based on foreign experience (Huo et al., 2009; Huo et al., 2017; Liang et al., 2021). However, systematic studies on nutrient criteria in estuaries are limited (Su et al., 2016; Liu et al., 2018a; Yang et al., 2019). In addition, the existing standards involving nutrient indicators include Environmental quality standards for surface water (GB3838-2002) applicable to freshwater and Seawater Quality Standard (GB3097-1997) applicable to seawater, but they are not applicable to the estuarine area where salt and fresh water are mixed, and the latter only includes two indicators of DIN and DIP, lacking the assessment of TN and TP (Douglas and Mclaughlin, 2014; Su et al., 2017). Some studies have used reference state method to establish nutrient criteria in the Liaohe Estuary and coastal waters (Hu et al., 2011; Su et al., 2016). On the basis of the segmentation of the Jiulong River Estuary, whose nutrient criteria was determined using reference conditions, statistical model analysis, and cumulative frequency distributions (Liu et al., 2018a), a nutrient criteria for the Yangtze Estuary and coastal waters was developed using population distribution approach (Yang et al., 2019). Therefore, categorizing numeric nutrients criteria for the estuarine transitional zones can be developed based on the segmentation of estuary.
The Pearl River Estuary (PRE) is characterized by superior natural conditions, dense population, and developed economy (Yin et al., 2000; Zhou et al., 2018; Li et al., 2020; Huang et al., 2021). With the development of social and economic activities and high-intensity human activities, the wastewater and sewage discharge to the PRE continues to increase, which intensifies the enrichment of nutrients in local waters (Lu et al., 2009). This results in the frequent occurrence of red tide disasters and the increasing degree and expansion of hypoxia phenomenon (Glibert et al., 2018; Geeraert et al., 2021; Ke et al., 2022). The amount of TN discharged from land sources in the PRE is still high, and the water quality has been inferior to Grade IV (DIN > 0.5mg mg·L-1 or DIP > 0.045mg/L) for a long time. DIN and DIP are the main factors exceeding the standard, among which DIN exceeds the standard by 1.7−5.9 times (Moffat, 1998; Tong et al., 2015; South China Sea Branch of the State Oceanic Administration, 2017; State of Oceanic Administration, 2018; Yan and Li, 2018; Department of Ecology and Environment of Guangdong Province, 2022a). In the summer of 2019, the concentrations of DIN and DIP in the PRE were 0.168-1.247 mg·L-1 and 0.011-0.044 mg·L-1, respectively, and 25% of the monitoring stations were over-eutrophication (Ma and Zhao, 2021). In addition, from 1981 to 1998 and 2000 to 2009, nearly 116 red tides were recorded in the PRE affecting more than 2850 km2 of coastal waters (Wei et al., 2012). Many red tides had a long duration and high toxicity, endangering the habitat environment of aquatic organisms (Lai et al., 2018). At present, the PRE has been listed as one of the three major areas in the “14th Five-Year Plan” national key sea area of comprehensive management battle, which will drive the overall improvement of the quality of marine ecological environment (Ministry of Ecology and Environment of the People’s Republic of China, 2022b). The government and Guangdong Province have also successively put forward plans to prevent and control pollution in estuaries and coastal waters, comprehensively implementing the principle of “coordinating land and sea, taking into account river and sea”, strengthening the linkage between land pollution control and comprehensive treatment of marine environment, adhering to both pollution prevention and control and ecosystem protection, so as to realize the whole chain of pollution control from source to end (Ministry of Ecology and Environment of the People’s Republic of China, 2022a; Department of Ecology and Environment of Guangdong Province, 2022b). Therefore, to control and improve water quality, provide effective management measures, it is urgent and critical to establish effective nutrients criteria.
Based on the seasonal data of the PRE and adjacent waters from 2015 to 2020, the study objectives were (1) to establish nutrient criteria using the frequency distribution method, (2) to establish water quality standards based on nutrient criteria to evaluate and verify it, and (3) to estimate the background concentrations of N and P and implement zoning management in the PRE. This study can provide a scientific basis for effectively solving the problem of eutrophication, evaluating water quality in coastal waters, and joint prevention and control of water pollution land-ocean coordination.
The Pearl River originates from Mashen Mountain in the Wumeng Mountain System of the Yunnan-Guizhou Plateau, with a total drainage area of 453690 km2, and flows through Yunnan, Guizhou, Guangxi, Guangdong, Hunan, Jiangxi, and northern Vietnam (Zhao, 1989; Cui et al., 2020). The Pearl River is rich in water, with an annual inflow of 326 billion steres and an annual runoff of over 330 billion steres, followed by the Yangtze River. It is the largest water system in southern China (Zeng et al., 2020). The runoff of the Pearl River varies greatly, and the annual distribution of runoff is corresponding to the rainy season. The runoff in the wet season accounts for 70-80% of the total amount of the whole year, which is characterized by the wet > normal > dry season, indicating that the runoff is of the type of precipitation replenishment (Zhao, 1989; Yuan, 2005). The PRE is more than 80 km long, from north to south, and covers an area of 2100 km2. It borders Guangzhou in the north, Shenzhen and Hong Kong in the east, Zhuhai and Macao in the west, and is located in the core of the Guangdong-Hong Kong-Macao Greater Bay Area (Huang X. and Huang L., 2002) (Figure 1A). The tidal nature of the PRE belongs to irregular semi diurnal mixed tide. The surface flow velocity is higher than the bottom flow velocity, and the summer flow velocity is higher than the winter flow velocity (Xia and Zhou, 2021). With the rapid development of industry and agriculture along the PRE and the continuous influx of population, pollutants such as nitrogen, phosphorus, and other nutrients enter the PRE through artificial discharge, river carrying, precipitation, and other means, resulting in eutrophication and deterioration of water quality (Niu et al., 2020a, Niu et al., 2020b, Qiu et al., 2010, Yin et al., 2013). The environmental quality of the PRE ecosystem needs to be improved urgently (Strokal et al., 2017; Zeng et al., 2020).
Monitoring data in the PRE were acquired from the Department of Ecology and Environment of Guangdong Province. During the six years from 2015 to 2020, the study area was sampled in the dry (April), wet (July), and normal (October) water flow seasons every year, totaling to 18 sampling seasons. A total of 15 stations were set in the study area (Figure 1B) and 921 datasets were collected, including 262 groups of DIN, 90 groups of TN, DIP groups of 262, TP groups of 90, and 217 groups of salinity. Water samples were collected using cleaned polyethylene bottles or hard glass bottles and promptly brought back to the laboratory for filtration within 24 h. The relative standard deviations (RSD) of repeated determinations of selected samples were less than 5%. The details of analytical methods, processes and instruments in this study had been described in the Specification of Oceanographic Survey (China National Standardization Management Committee, 2007; China National Standardization Management Committee, 2007b; Ministry of Environmental Protection of the PRC, 2009).
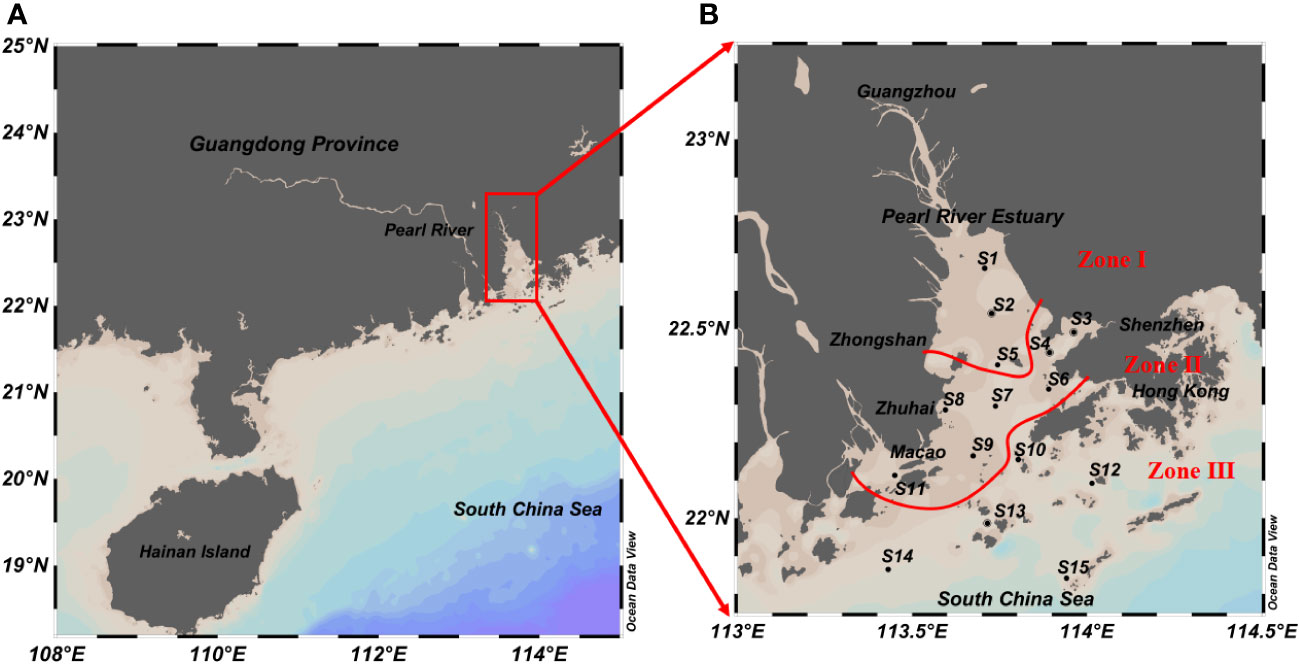
Figure 1 Study area (A) and monitoring stations (B) of the Pearl River Estuary coastal water.
Combined with domestic and foreign experience, the frequency distribution method was used to establish nutrient water criteria in the PRE. In the case of sufficient data or good habitat condition, the corresponding value of the 25th percentile (or other suitable percentile) of the nutrient index frequency distribution curve was used as the criteria value. The selection of specific percentage point is only a suggestion and can be determined according to the habitat of the study area. If the area is heavily polluted, the corresponding value of the 5th percentile (or other appropriate percentile) on the frequency distribution curve of nutrient indicators can be selected as the criteria value (Hu et al., 2011; McLaughlin, 2014; Yang, 2015). After processing and integrating the experimental data, the K-S test (Kolmogorov-Smirnov test) was conducted to determine whether the data conformed to a normal distribution. If it conformed (P≥0.05), a frequency distribution diagram was drawn. If not (P<0.05), the partial maximum or minimum values were removed or logarithmic transformation was carried out before testing, and then the corresponding frequency distribution diagram was drawn. Based on the figure, reference to the historical data and the data of this study, water quality criteria were determined, and then compared with Seawater Quality Standard to evaluate, interpret, and correct the recommended water quality criteria. The detailed process is illustrated in Figure 2 (US EPA, 1998; US EPA, 2001; Meng et al., 2008; Li et al., 2019).
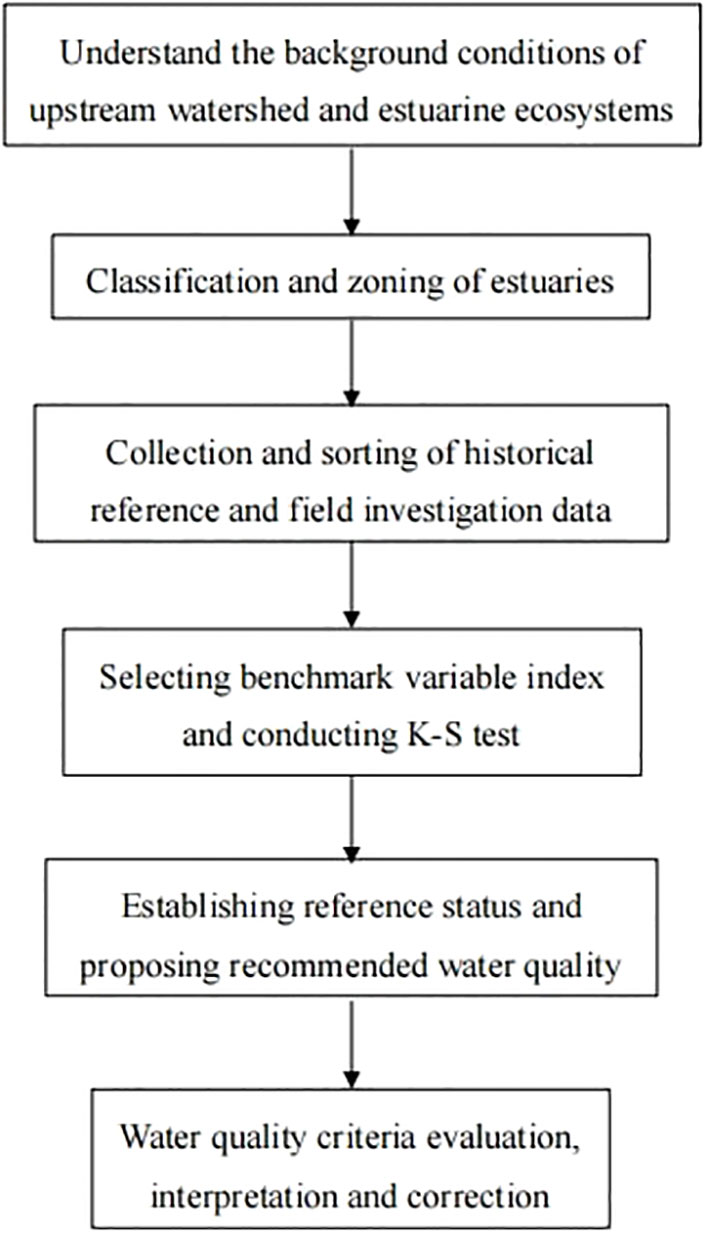
Figure 2 Framework of establishing water quality criteria in the PRE coastal water (Li et al., 2019).
Microsoft Excel 2016 was used to record and organize the data, and Statistical Product and Service Solution (SPSS) software was used for salinity clustering analysis to complete the estuary division. The establishment of the nutrient criteria adopted the frequency distribution method, and the normal distribution test of each nutritional index was performed using SPSS to determine the criteria. Ocean Data View (4.0) (Schlitzer, 2002) was used to draw a schematic diagram of the monitoring stations and a spatiotemporal distribution map. Other images, such as the frequency distribution curve and salinity cluster analysis dendrogram, were drawn using Origin Lap 2021 software. The average data used in this study are expressed as mean ± standard deviation (mean ± SD).
Among the three periods in the PRE, the average salinity was 18.48 ± 8.86 PSU, and the maximum and minimum salinity were 32.48 PSU in the dry season and 2.23 PSU in the wet season, respectively. The salinity in the PRE decreased from dry to wet water flow period, and then remarkable increased during the normal water flow period. The salinity range in surface seawater in the dry season was 5.47−32.48 PSU, with an average value of 19.92 ± 8.74 PSU. In the wet season, salinity in the surface water had a range from 2.23−27.99 PSU, and the average was 14.31 ± 8.06 PSU, which differed from the other two seasons and was the lowest. The average salinity in the normal season was 21.21 ± 8.73 PSU, which ranged from 5.71−32.15 PSU. Spatially, the distribution of salinity was similar during the three water flow periods, and it was low in the upper part of the estuary and gradually increased to the open sea (Figure 3).
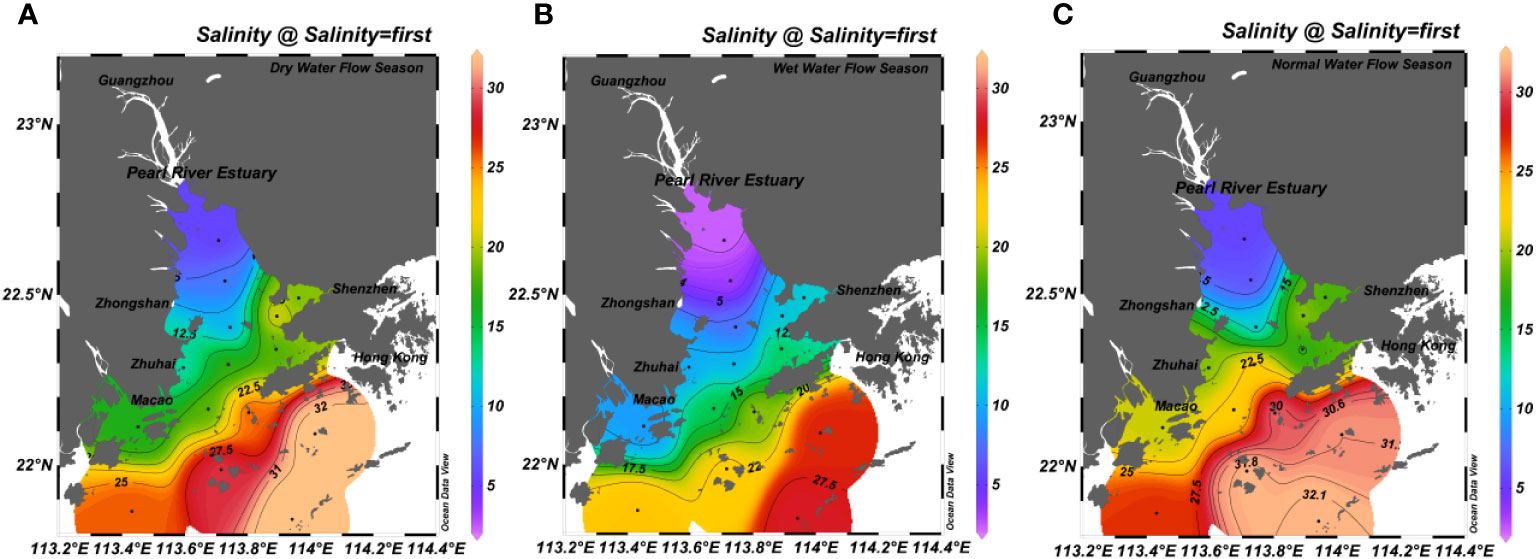
Figure 3 Spatial and temporal distribution of salinity along the PRE coastal water in the dry (A), wet (B), normal (C) season.
Applying the SPSS cluster analysis model with salinity as the reference condition, the PRE can be divided in three zones (Figure 4). The first subsection contained S1, S2, and S5, which included the upper estuary, whose water characteristics are mainly freshwater, and the average salinity value was 6.93 ± 2.56 PSU. The second subsection contains S3, S4, S6, S7, S8, S9, and S11. This area belongs to the middle of the estuary and is the largest area where salt water and fresh water are mixed in different proportions, with an average salinity of 16.71 ± 1.49 PSU. The third subsection contained S10, S12, S13, S14, and S15, which are the ocean-dominated areas in the lower part of the estuary with an average salinity of 27.96 ± 2.56 PSU. As a result, based on the morphological characteristics of the estuary and the spatial distribution of salinity (Figure 3), the PRE can be divided in Zone I (S1, S2, S5), Zone II (S3, S4, S6, S7, S8, S9, S11), and Zone III (S10, S12, S13, S14, S15).
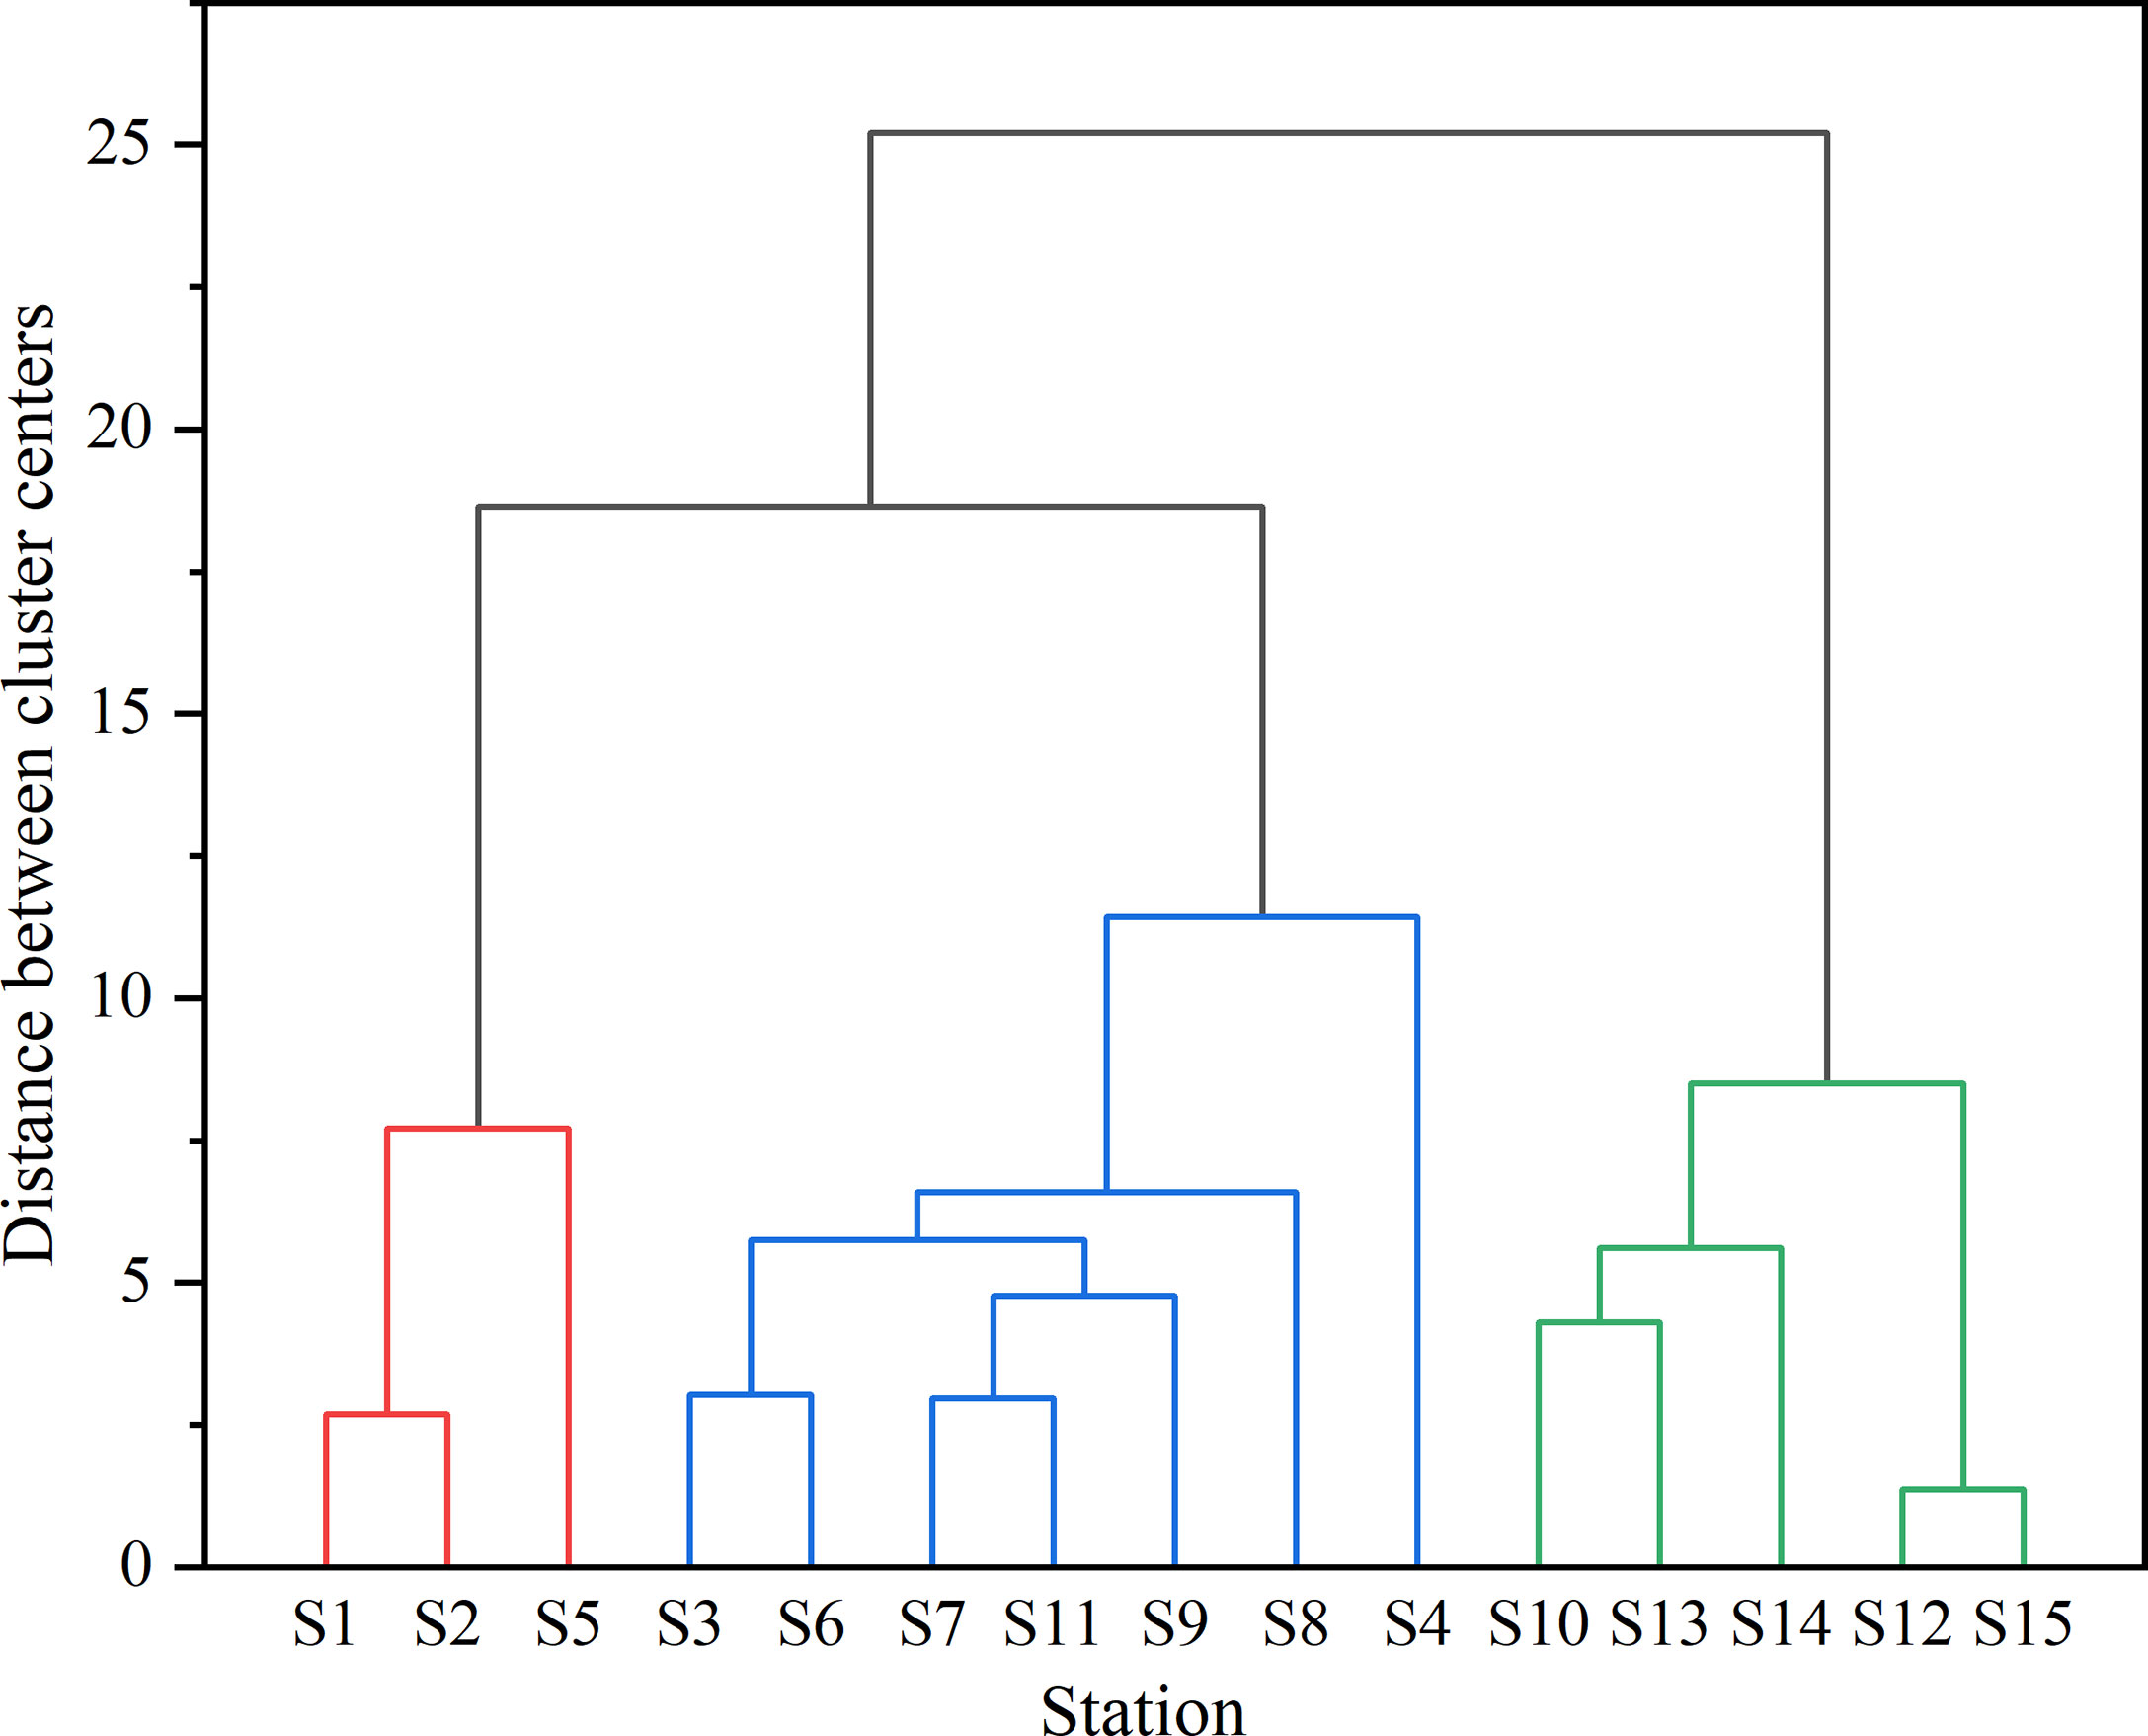
Figure 4 Cluster analysis tree of salinity.
The frequency distributions of nitrogen and phosphorus nutrients in the PRE was obtained through a normal distribution test and frequency distribution analysis of the partitioned data (Figure 5, Table 1, and Table A1).
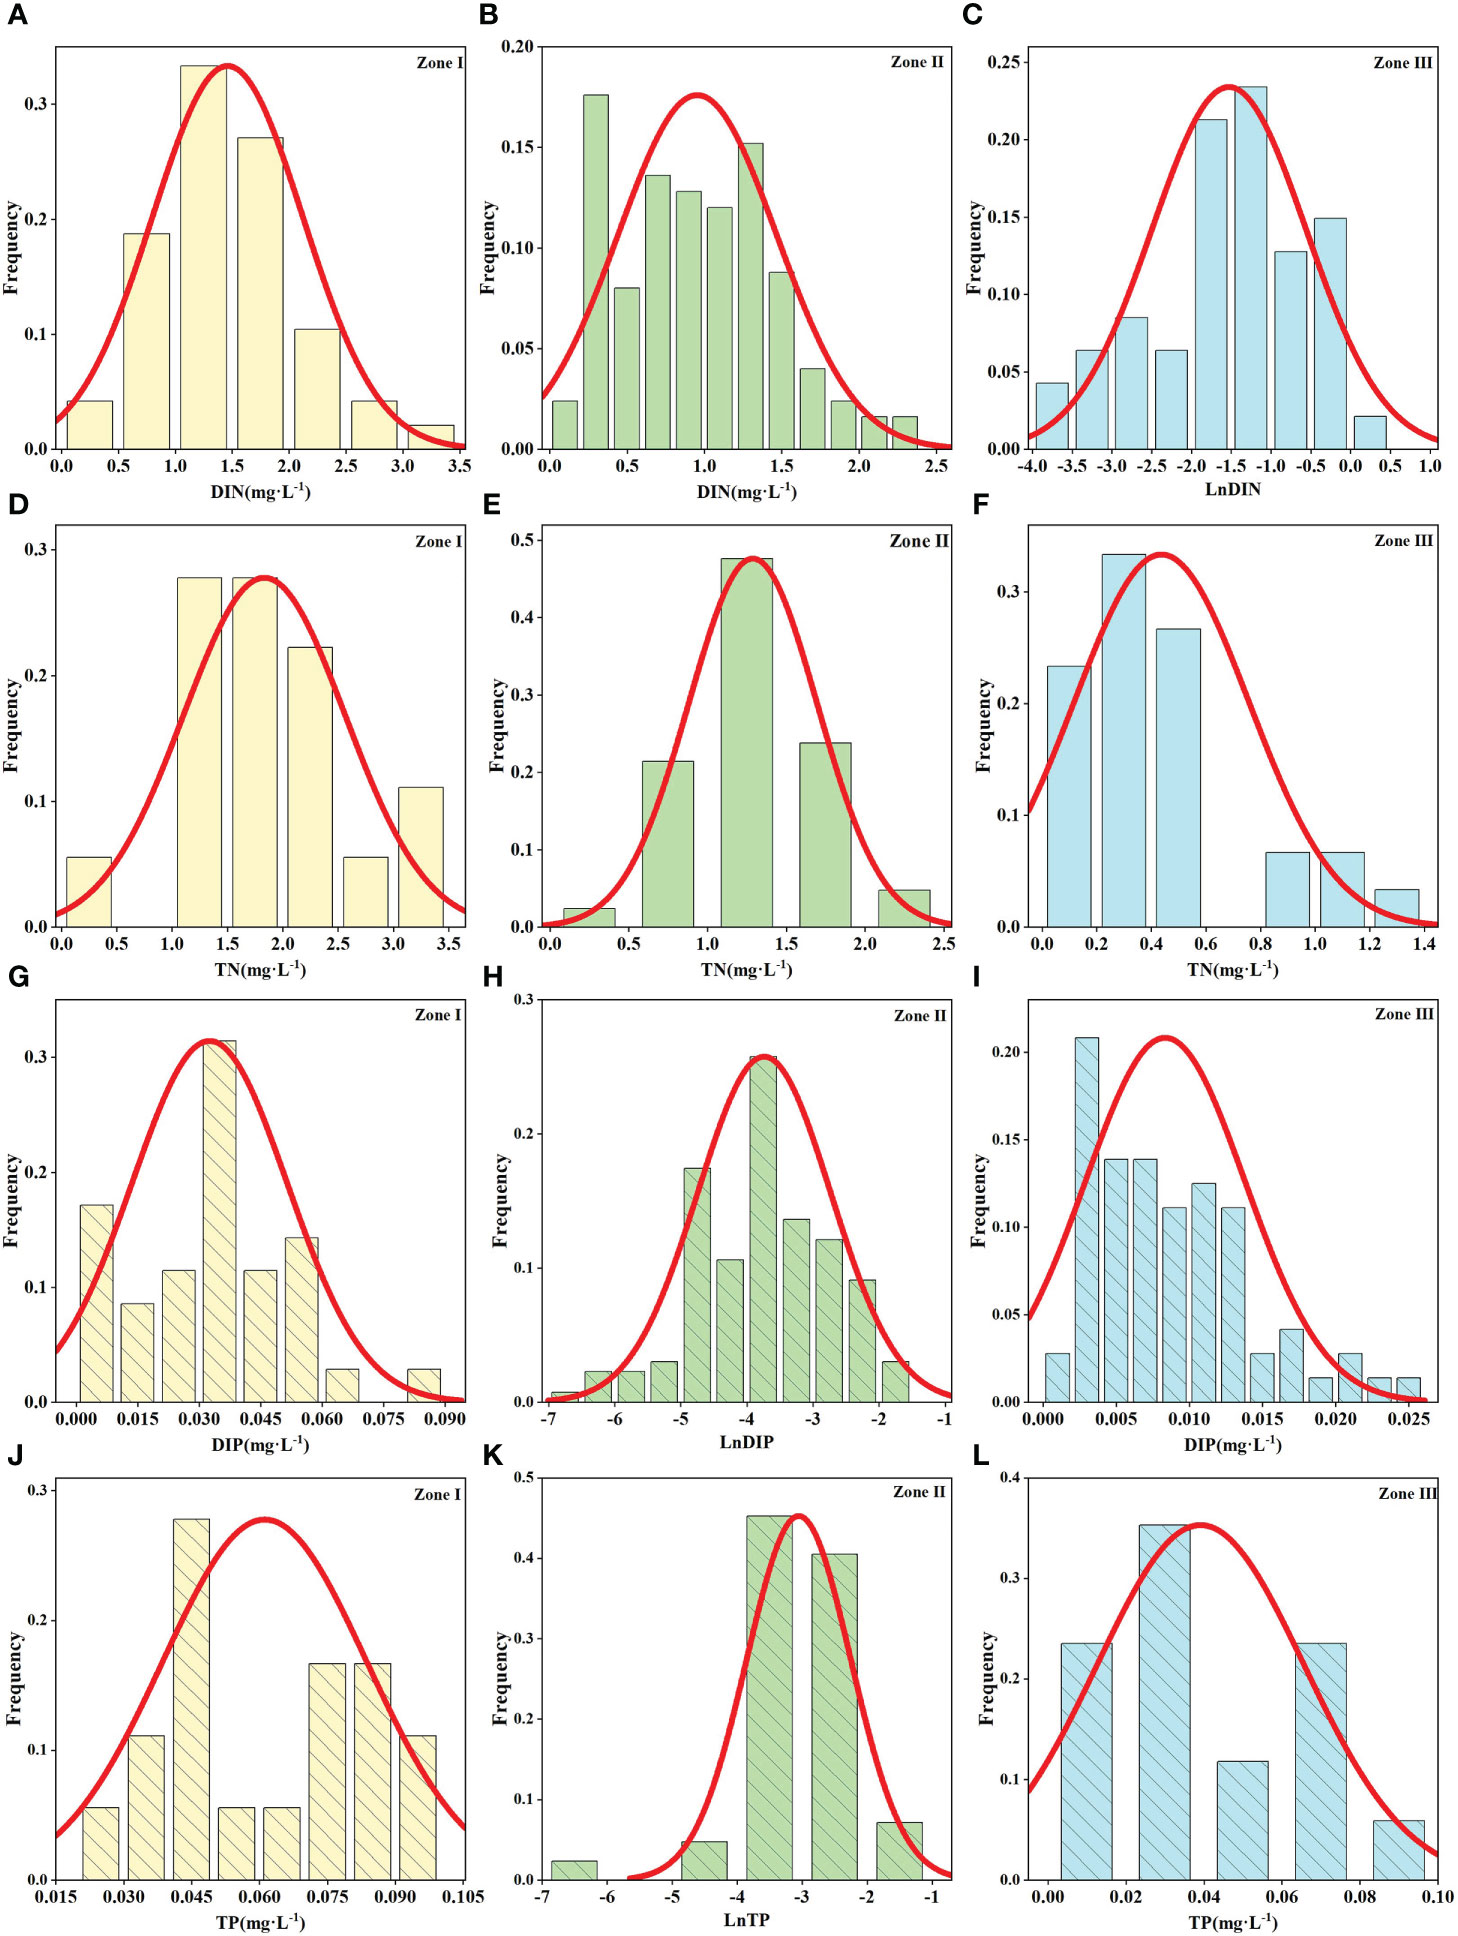
Figure 5 Frequency distributions of DIN (A–C), TN (D–F), DIP (G–I), and TP (J–L) in the PRE coastal water.
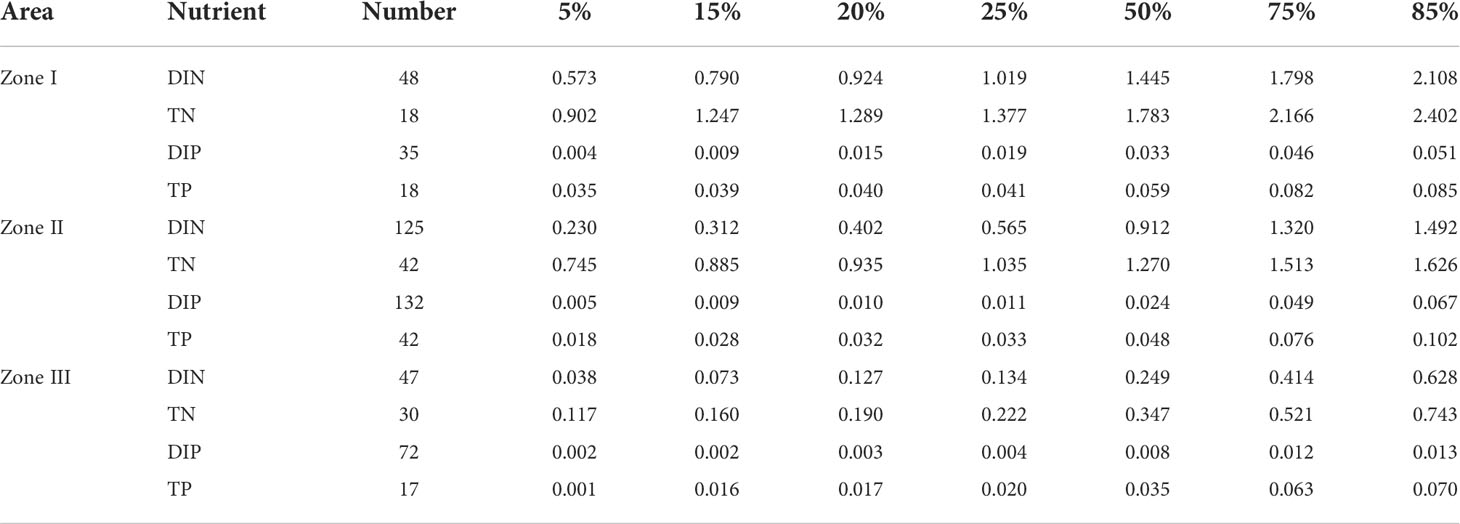
Table 1 Frequency distribution results of DIN, TN, DIP and TP in the PRE coastal water (mg·L-1).
In Zone I, the average value of DIN in the three water flow seasons was 1.459 mg·L-1, with a median of 1.445 mg·L-1, varying from 0.098 to 3.237 mg·L-1. The average value and median of TN were 1.832 mg·L-1 and 1.783 mg·L-1, respectively, and the variation range was 0.177−3.220 mg·L-1 from the dry to the normal season. According to the Bulletin on Marine Environment of Guangdong Province from 2015 to 2017 and the Bulletin on Ecological Environment of Guangdong Province from 2018 to 2020, the water quality of coastal waters along the PRE is poor. Zone I is located in the estuary, and the water quality of most sea areas was Grade IV or inferior. In recent years, DIN has exceeded standard limits. Therefore, for DIN and TN the corresponding value of the 5th percentage point of the frequency distribution curve was selected as the reference state to propose the criteria value, which were 0.573 mg·L-1 for DIN and 0.902 mg·L-1 for TN (Figure 6).
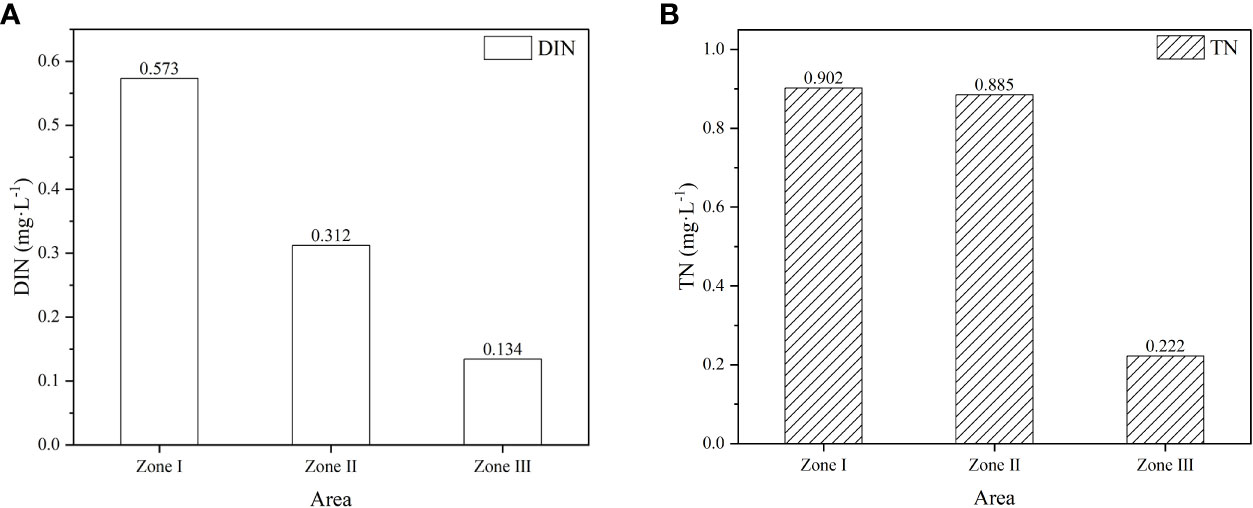
Figure 6 Recommended criteria for DIN (A) and TN (B) in the PRE coastal water.
In Zone II, the average value of DIN in the three water flow seasons was 0.953 mg·L-1 and the median was 0.912 mg·L-1, varying from 0.116 to 2.379 mg·L-1. The average and median values of TN were 1.287 mg·L-1 and 1.270 mg·L-1, respectively, and the variation range was 0.286−2.480 mg·L-1. Based on the Bulletin on Marine Environment of Guangdong Province from 2015 to 2017 and the Bulletin on Ecological Environment of Guangdong Province from 2018 to 2020, the water quality of coastal waters along the PRE was poor, but it was Grade I or Grade II in most of the sea area of Zone II, which was better than Zone I. The 15th percentage point of the water quality frequency distribution curve was selected as the reference state to propose the recommended water quality criteria, which were 0.312 mg·L-1 for DIN and 0.885 mg·L-1 for TN (Figure 6).
In Zone III, the average value of DIN in the three water flow seasons was 0.217 mg·L-1 and the median was 0.250 mg·L-1, varying from 0.020 to 1.049 mg·L-1. The average and median values of TN were 0.432 mg·L-1 and 0.347 mg·L-1, respectively, and the variation range was 0.038−1.340 mg·L-1. It can be seen from the data that nutrient pollution in Zone III was not as serious as that in Zones I and II. It may be due to the distance from the estuary, the reduction of the influence of terrestrial input and the physical mixing process of ocean currents (Liu et al., 2020). However, it is possible that there is a negative correlation between salinity and nitrogen and phosphorus nutrients (Hu et al., 2016; Zhou et al., 2022; Ke et al., 2022). Therefore, the 25th percentile under the water quality frequency distribution curve was selected as the reference state, and the recommended water quality criteria were proposed as 0.134 mg·L-1 for DIN and 0.222 mg·L-1 for TN (Figure 6).
In Zone I, the average value of DIP in all three seasons was 0.033 mg·L-1, with a median of 0.033 mg·L-1, ranging from 0.002 to 0.086 mg·L-1. The mean value of the TP concentration during the three seasons was 0.039 mg·L-1, the median was 0.059 mg·L-1, and the variation range was 0.028−0.098 mg·L-1. For DIP and TP the corresponding value of the 15th percentage point of the frequency distribution curve was selected as the reference state to propose the criteria value, which were 0.009 mg·L-1 for DIP and 0.039 mg·L-1 for TP (Figure 7).
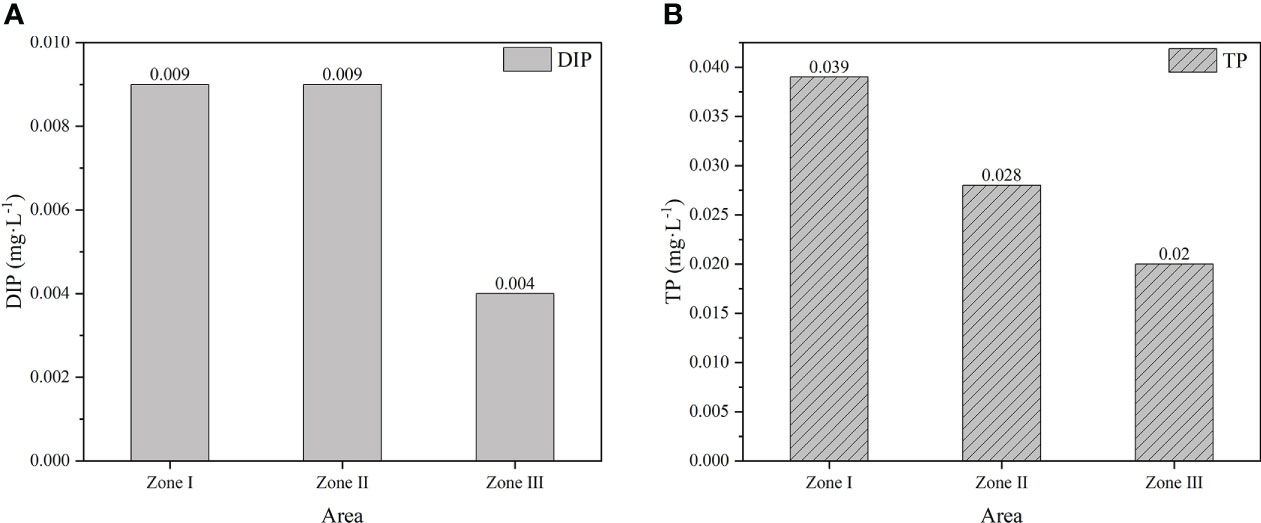
Figure 7 Recommended criteria for DIP (A) and TP (B) in the PRE coastal water.
In Zone II, during the three water flow seasons, the average value of DIP was 0.024 mg·L-1, with a median of 0.024 mg·L-1, ranging from 0.001 to 0.201 mg·L-1. The mean value of the TP concentration was 0.047 mg·L-1, the median was 0.049 mg·L-1, and the variation range was 0.002−0.259 mg·L-1. The 15th percentage point of the water quality frequency distribution curve was selected as the reference state to propose the recommended water quality criteria, which were 0.009 mg·L-1 for DIP and 0.028 mg·L-1 for TP (Figure 7).
In Zone III, the average DIP value in all three seasons was 0.008 mg·L-1, with a median of 0.008 mg·L-1, ranging from 0.001 to 0.024 mg·L-1. The mean value of the TP concentration was 0.039 mg·L-1, the median was 0.035 mg·L-1, and the variation range was 0.001−0.085 mg·L-1. The 25th percentile under the water quality frequency distribution curve was selected as the reference state, and the recommended water quality criteria were proposed as 0.004 mg·L-1 for DIP and 0.020 mg·L-1 for TP (Figure 7).
According to the sea water quality standard and different applicable functions and protection objectives, the coastal waters of the PRE were divided in four functional areas (Table A2), and the marine water quality standards of DIN, TN, DIP, and TP were formulated.
For the water quality standard limits of nitrogen and phosphorus applicable to class I marine functional areas, the seawater quality standard needs to be stricter because it involves areas with special needs to be protected, such as marine nature reserves and rare and endangered marine biological reserves. The sea water and environmental quality standards for surface water stipulate relatively strict water quality requirements for areas requiring special protection, such as nature reserves. Therefore, it was formulated with reference to the water quality criteria for coastal waters in the PRE (Table 2).
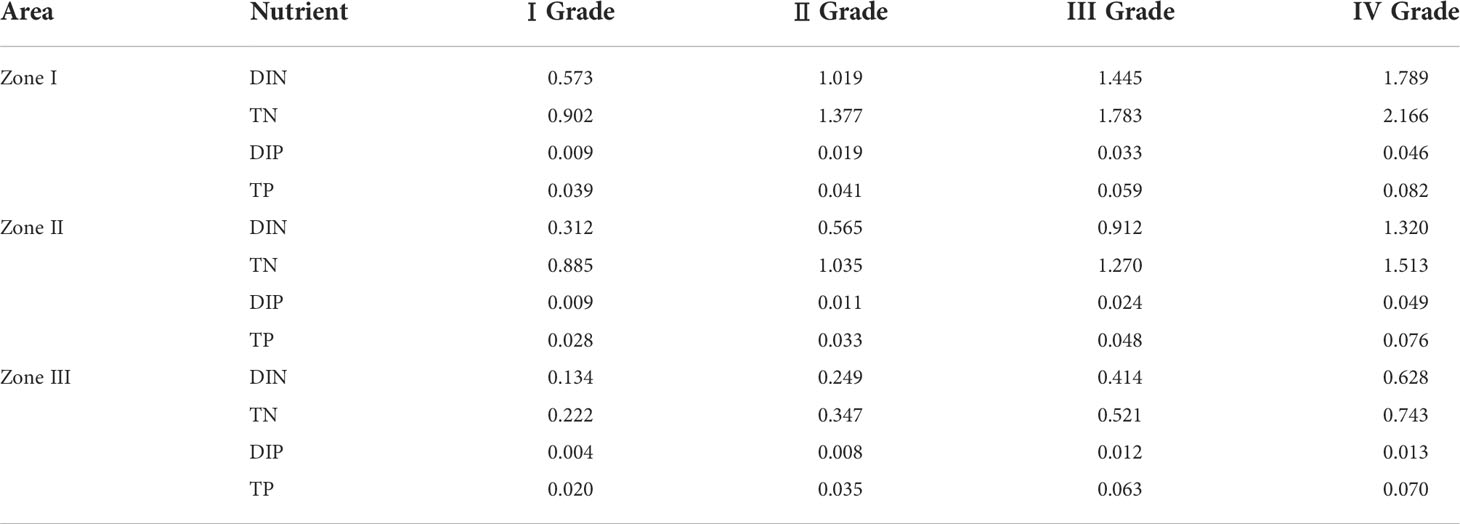
Table 2 Sea water quality standard in coastal waters of the PRE (mg·L-1).
For the water quality standard limits of nitrogen and phosphorus applicable to class II marine functional areas, considering the accessibility and economic factors of the standards and the large amount of nutrients required for aquaculture biological bait in aquaculture areas, the standard values of nitrogen and phosphorus should be relaxed appropriately. The nutrient water quality standards for fishery waters in the seawater quality standard and the environmental quality standards for surface water are considerably higher than those for nature reserves. The nutrient indicators in Zones I and II can be formulated with reference to a cumulative frequency of 25% in the results of the frequency distribution curve, and Zone III can be formulated with reference to a cumulative frequency of 50% in the results of the frequency distribution curve (Table 2).
Classes III and IV include general industrial water use areas, coastal scenic tourism areas, marine port waters, and marine development operation areas. As the nutrient index has relatively little impact on the use function and protection objectives of the two types of marine functional areas and considering the accessibility and economic factors of the standard, the nutrient standard limit should be more relaxed. Similar situations are reflected in the seawater quality standards and environmental quality standards for surface water. The standard was developed with reference to the values of 50% and 70% of the cumulative frequency in the statistical results of the frequency distribution curve in Zones I and II, whereas Zone III is formulated with reference to the cumulative frequencies of 75% and 85% in the statistical results of the frequency distribution curve method (Table 2).
During the 40 years from 1980 to 2020, nutrients in the PRE showed different trends (Long et al., 2020). The concentration of DIN showed a very significant increasing trend, while the DIP concentration began to decrease after a significant increase, and then remained unchanged (Howarth, 2008; Huang, 2008; Long et al., 2020; Ma et al., 2009). In the early 1980s, the concentration of DIN was only 0.120 mg·L-1 (Yuan, 2005), and 0.270 mg·L-1 in 1986 (He et al., 2004), which is close to the DIN criteria of the PRE seawater area (0.134 mg·L-1) and the mixing area (0.312 mg·L-1); therefore, the DIN concentration in the PRE without pollution was roughly between 0.120 mg·L-1 and 0.312 mg·L-1. Before 1990, the DIN concentration in the PRE increased slowly and reached as high as 0.510 mg·L-1 in 1995 (Dang et al., 2019). Then, it began to increase explosively and reached a peak of 1.256 mg·L-1 in 2017, increasing more than 10 times. The concentration of DIP was maintained between 0.008 and 0.015 mg·L-1 before 1990 (Yuan, 2005), which was comparable to the DIP criteria proposed in this study for the PRE seawater area (0.004 mg·L-1), mixing area (0.009 mg·L-1), and freshwater area (0.009 mg·L-1). The DIP concentration in the PRE without pollution was approximately 0.004−0.015 mg·L-1. After 1990, the DIP began to increase remarkably, reaching 0.070 mg·L-1 in 2010 (Dang et al., 2019), which had increased more than eight times in the past 30 years. It then began to fluctuate at a high level, showing an oscillatory downward trend.
Some studies have shown that the water quality of the PRE has gradually changed from exceeding the standard of heavy metals to nutrients around 1990, and excessive pollutants were mainly DIN and DIP (Yuan, 2005; Dang et al., 2019). However, owing to the lack of long-term continuous monitoring data and seawater quality assessment for TN and TP, the phenomenon of exceeding the standard may have occurred earlier. In recent years, the Guangdong Provincial Department of Ecology and Environment and many studies have monitored TN and TP in the PRE. The results suggested that the average concentrations of TN and TP were 1.113 and 0.050 mg·L-1 in 2019-2020, respectively (Department of Ecology and Environment of Guangdong Province, 2020; Department of Ecology and Environment of Guangdong Province, 2021). Compared with 2014, TN decreased, while TP was relatively constant (Zhang et al., 2015). In addition, TN/TP can also reflect the demand of phytoplankton for nutrients, reflecting the total amount of nutrients that may be absorbed and utilized by phytoplankton in the sea area (Redfield et al., 1963; Huang and Hong, 1999; Chen et al., 2013; Jin and Liu, 2013). Therefore, it is necessary to establish the relationship between DIN and TN, DIP and TP, and to calculate the background concentration of TN and TP to evaluate the criteria of TN and TP, to better understand their impact on eutrophication.
There is a negative correlation between DIN and DIP and salinity in the PRE, indicating that the terrigenous nutrients are strongly influenced by the mixing of sea and fresh water (Lan et al., 2014; Ke et al., 2022; Hong, 2022; Smith et al., 1999). The runoff input regulates the distribution of N and P to the sea, resulting in a gradual decrease in DIN and DIP from south to north. Therefore, the N and P nutrient criteria values (except DIP) are shown as Zone I > Zone II > Zone III.
The numerical nutritional standards for the different estuaries and coastal waters were different (Table 3). This may be due to the natural characteristics of different estuaries, such as dilute water, water residence time, and vertical stratification (US EPA, 2001), as well as differences in methods of deriving nutrient criteria in different countries (Wang et al., 2020). The recommended nutrient criteria in the PRE were comparable to those found in most of the estuaries as listed in the Table 3. The research on water criteria in China mainly focuses on DIN and DIP, while the international studies focus on TN and TP (Raymond et al., 2011; Evans-white et al., 2013), and the criteria values of TN and TP compared with those in the coastal waters of estuaries of China, are relatively strict. Among these the TN criteria of the coastal waters of the Yangtze River Estuary are more than 10 times that of the coast of Hawaii, and that of the freshwater area of the PRE is about six times (Table 3). Compared to other estuaries in China, the Yangtze River Estuary is the largest estuary in China and is located in the core area of the Yangtze River Delta economy. It is also the most developed area for industry and agriculture in China. In recent years, the impact of rapid economic development on near-shore water quality has become increasingly evident. Moreover, coastal waters of the Yangtze River estuary are affected by water masses such as the Yangtze River flushing fresh water, Jiangsu-Zhejiang coastal current, northern Jiangsu coastal current, and Taiwan warm current, and the hydrological environment is relatively complex (Li et al., 2022). They all resulted in lower DIN, TN, DIP, and TP nutritional criteria than those for other estuarine areas in China. There are few differences in the DIP and TP criteria between the PRE and Liaohe River Estuary, which may indicate that the two estuaries have similar phosphorus distribution characteristics, both of which are phosphorus limited (Wu et al., 2017; Zeng et al., 2020; Chen et al., 2020; Ke et al., 2022). Some studies have shown that nitrogen in the PRE ranks first among many estuaries in China (Huang et al., 2003; Lai et al., 2018). To alleviate nitrogen pollution, the recommended standards for DIN and TN are relatively strict.
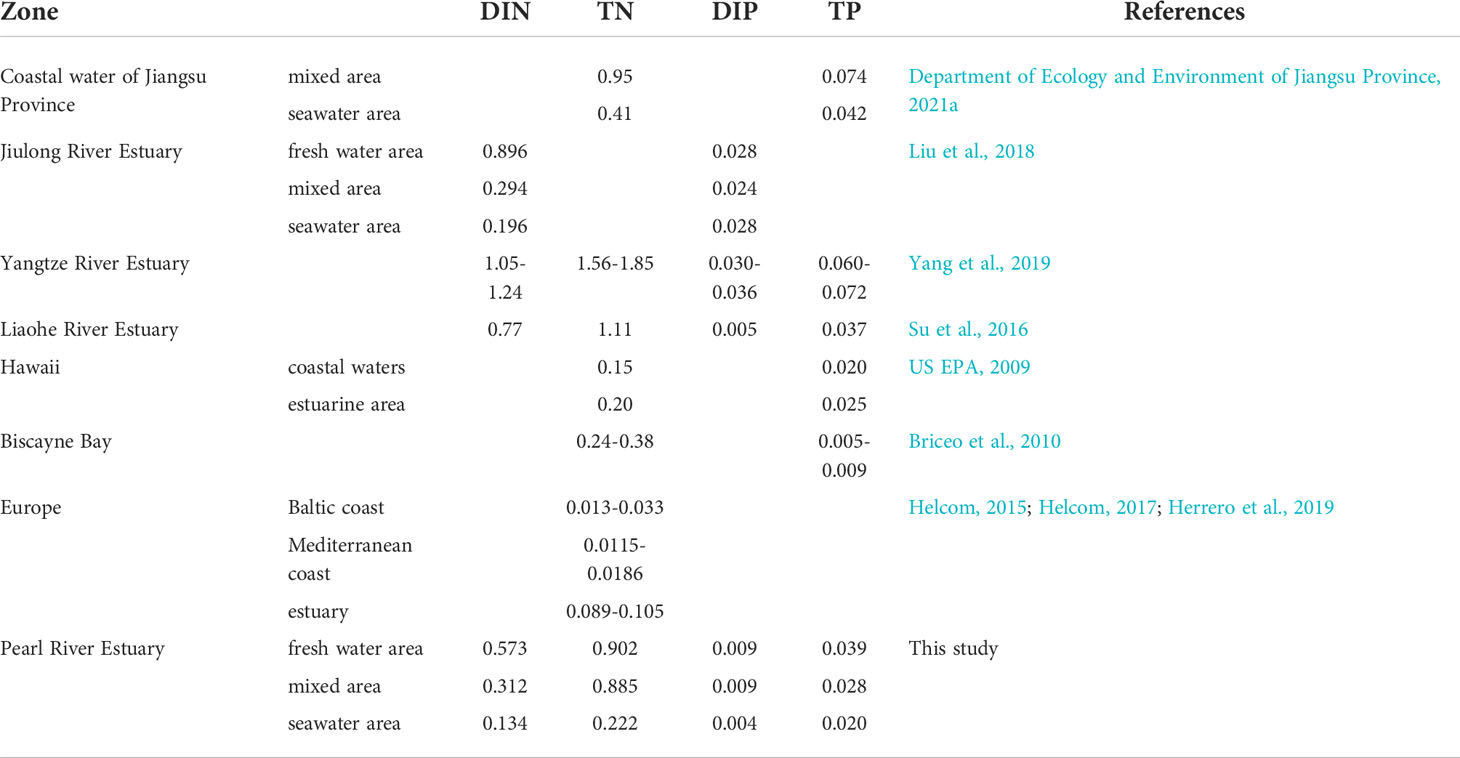
Table 3 Reference condition or criteria in different coastal water and estuaries worldwide (mg·L-1).
In this study, the monitoring data of DIN and DIP in the near-shore waters of the PRE from 2015 to 2020 were used to evaluate the new standards proposed in this study, while the exceedances of DIN and DIP in the same period were analyzed using the seawater quality standard (GB3097-1997). If the seawater quality standard was adopted for assessment, the DIN concentration in the three seasons did not meet the Grade IV water quality standard by more than 50%, especially in the dry season, which was 56.67%. At the same time, only approximately 40% of the DIN concentration met the Grade I, II, or III water quality standards. Using the recommended water quality standard proposed in this study, the concentration of DIN did not meet the Grade IV water quality standard decreased by nearly 75% in the normal period, while DIN concentration met Grade I, Grade II, and Grade III water quality standards and increased to more than 60%, and up to 76% in the normal water flow season (Figure 8A). As for DIP, if the seawater quality standard was employed, the DIP concentration in the dry, wet, and normal seasons met the water quality standards of Grade I and Grade II, reaching approximately 70%, and the water quality in the inferior Grade IV was less than 20%. If the water quality standard recommended in this study was used, the proportion of DIP concentration that met Grade I and Grade II water quality standards during the three seasons considerably decreased and dropped by half in the dry season, while the proportion of DIP concentration in Grade IV or inferior increased by 59% in the dry season (Figure 8B).
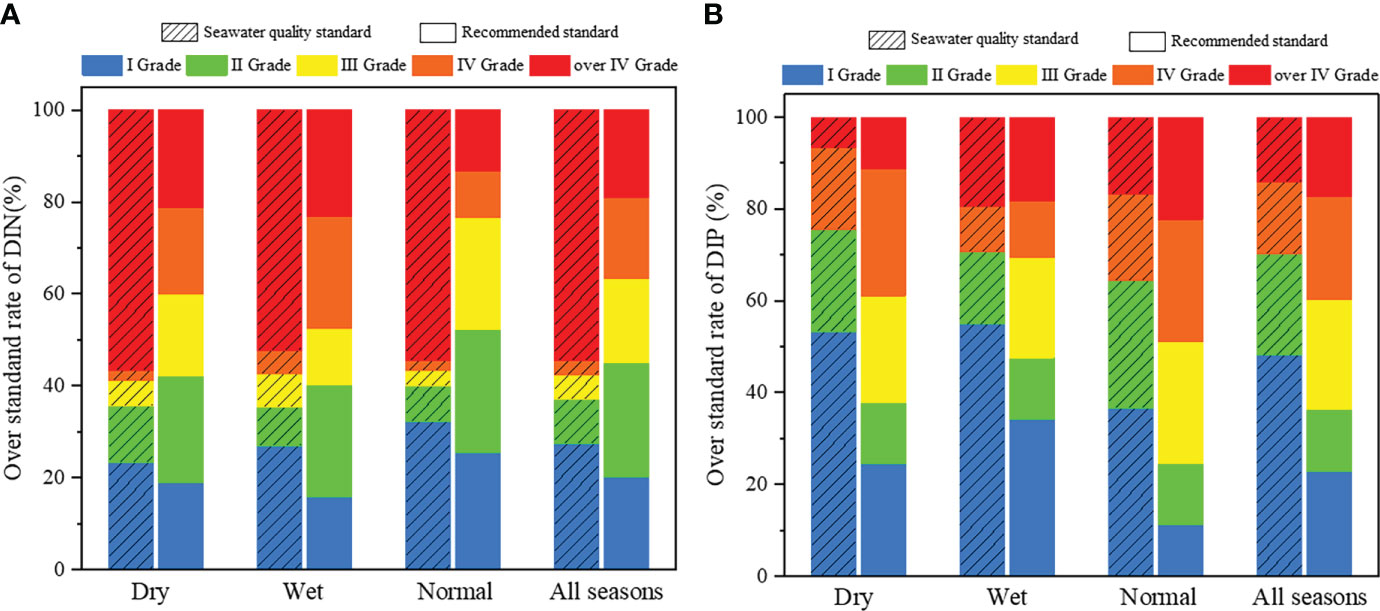
Figure 8 Seawater quality standard and the recommended standard assessment DIN (A) and DIP (B).
Currently, there are no seawater assessment standards for TN and TP in China. The study also used monitoring data from the PRE in 2019 and 2020 to verify the TN and TP specified in this standard. The proportions of TN and TP failed to meet the Grade IV water quality standard, which was the highest in the wet season. Overall, TN and TP met the Grade III water quality standard (Figure 9). The compliance rate of TP meeting the Grade III water quality standard was higher than that of DIN, TN, and DIP. As shown in the picture, using the recommended standard to evaluate DIN, TN, DIP and TP, the annual compliance of each index was almost the same, the proportion of each nutrient standard to reach Grade III water quality standard was more than 60%. Therefore, it can be tentatively judged that there may be “over-protection” for DIN and “under-protection” for DIP in the current seawater quality standard of the PRE. Therefore, from the management perspective, the new standard had no obvious impact on the assessment of seawater quality in the coastal waters of the PRE. From a scientific point of view, the standard is formulated based on the monitoring data of PRE over the years and conforms to the status of the environmental quality of PRE. Since the standard is a recommended local standard and was first explored in China, it is scientifically reasonable and operable, although it cannot consider all aspects.
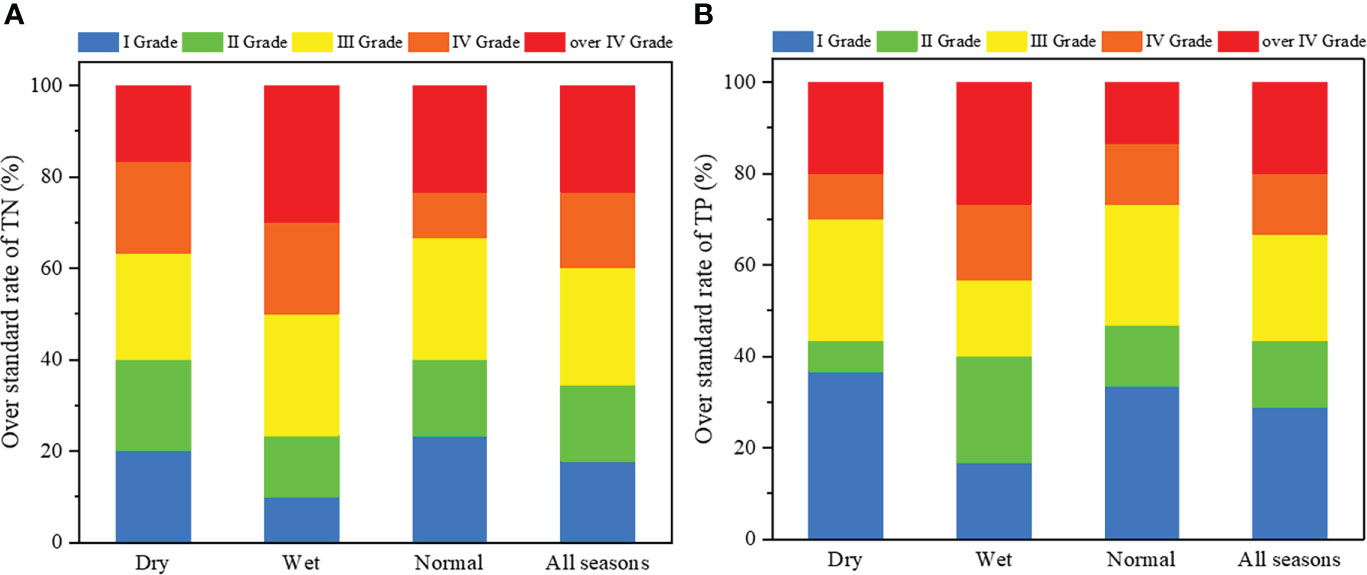
Figure 9 Recommended standard assessment TN (A) and TP (B).
There are differences in the nutrient monitoring indicators stipulated in China’s current seawater quality standard and environmental quality standards for surface water, and they are applicable to seawater and freshwater, respectively (Ministry of Ecology and Environment of the People’s Republic of China, 1997; Ministry of Ecology and Environment of the People’s Republic of China, 2002). However, they may not be fully applicable to estuaries in which seawater and freshwater are mixed (Su et al., 2016; Li et al., 2020). Therefore, the significance of establishing estuarine nutrient criteria for eutrophication mitigation is as follows: first, the water quality index system is unified, supplementing the seawater quality assessment of TN and TP, and the nutrient pollution status and source of nutrient pollution are objectively assessed (Yang, 2015); second, the management of estuaries by zoning and classification has been realized, and the establishment of a joint mechanism for pollution prevention and control of watershed, estuary, and coastal sea area waters has been promoted (Song et al., 2021); finally, the establishment of estuarine nutrient criteria realizes the overall planning of land and sea, and takes into account rivers and seas, which promotes water pollution prevention and control, water ecological protection, and water resources management, which is of great significance to further realize the construction of beautiful estuaries and bays and high-quality development of the marine economy (Liu et al., 2017; Ministry of Ecology and Environment of the People’s Republic of China, 2022). In addition, land-based pollution will lead to nutrient enrichment in estuaries, which will cause great damage to the marine environment (Wu et al., 2019). Based on the fact that the PRE is a typical estuarine ecosystem with high N and low P, and has been in a P-limited state for a long term, it is appropriate to adopt the pollution control mode of land and sea integration (Redfield et al., 1963). Establishing estuarine nutrient criteria can estimate the background concentration of nutrient, and formulate scientific water quality standard for assessment, which can strictly control the discharge of land-based pollutant, reduce the total amount of nutrients entering to the sea, and reduce the contribution of land-based pollution to the PRE from the source (Hu et al., 2020). At the same time, it is necessary to strengthen the comprehensive management of rivers flowing into the PRE, and reinforce the real-time monitoring of water quality in the PRE, accurately identify the sudden changes in water quality in the PRE, and provide a scientific basis for the improvement of water quality in the PRE (Hong, 2022).
Therefore, this study considers that long-term monitoring should be carried out in the coastal waters of various estuaries, such as the Pearl River Estuary, Yangtze River Estuary, and Yellow River Estuary, to accumulate rich reference data to provide data support for the formulation of nutrient criteria in China (Su et al., 2016). Simultaneously, corresponding nutrient control standards and management strategies should be put forward based on the actual situation of different estuaries (Huo et al., 2018; Zhou et al., 2020). Under the background of “Strengthening the environmental protection and restoration of estuaries and bays, implementing the comprehensive management of one bay and one policy in estuaries and adjacent bays, and building a number of beautiful bays by implementing classified policies”, establish zoning management and control of nutrients in the basin-estuary-coastal water, achieve the goal of fine water quality management and control, make full use of the self-purification capacity of water bodies, and improve the eutrophication of estuarine coastal water (Department of Ecology and Environment of Guangdong Province, 2022b).
In this study, the PRE was divided in three segments based on salinity, corresponding to freshwater, mixed, and seawater areas, with increasing salinity from north to south. Frequency statistical analysis was applied to establish the recommended nutrient criteria. The recommended DIN, TN, DIP, and TN criteria in the freshwater area were 0.573, 0.902, 0.009, and 0.039 mg·L-1, respectively; the recommended DIN, TN, DIP, and TN criteria in the mixed area were 0.312, 0.885, 0.009, and 0.028 mg·L-1, respectively; and the recommended DIN, TN, DIP, and TP criteria in the seawater area were 0.134, 0.222, 0.004, and 0.020 mg·L-1, respectively. The DIN concentration in the PRE without pollution was approximately between 0.120 mg·L-1 and 0.312 mg·L-1, and the DIP concentration without pollution was approximately 0.004−0.015 mg·L-1. It is necessary to establish the relationship between DIN and TN, DIP and TP to better understand their impact on eutrophication. Under the integrated management mode of land and ocean, the emissions of land-based pollutants should be strictly controlled to reduce the impact on estuaries and coastal waters. At present, the Sea Water Quality Standard may have “over-protection” problems in the assessment of DIN of the PRE, while there may be “under-protection” problems in the DIP assessment. As a result, the establishment and application of nutrient water quality criteria unified the water quality monitoring indicator for land and ocean, is the basis for setting water quality standards, an effective measure to prevent eutrophication of water bodies, and a scientific basis for comprehensive monitoring, assessment, and management of nutrients in estuaries, which is of great significance for building beautiful estuaries and bays in China and worldwide. In the future, long-term monitoring should be carried out in the coastal waters of various estuaries, such as the Pearl River Estuary, Yangtze River Estuary, and Yellow River Estuary, to accumulate rich reference data to provide data support for the formulation of nutrient criteria in China.
The original contributions presented in the study are included in the article/Supplementary Material. Further inquiries can be directed to the corresponding author.
Conceptualization: PZ; Methodology: PZ and JBZ; Software: SO; Validation: PZ, JXZ, and LZ; Formal analysis: PZ, JXZ, and LZ; Writing-original draft preparation: PZ and SO; Writing-review and editing: PZ and SO; Visualization: PZ and JBZ; Supervision: PZ and JBZ; Project management: PZ and JXZ; Funding acquisition: PZ and JBZ. All listed authors made substantial, direct, and intellectual contributions to the work and are approved for publication.
This research was financially supported by Key Laboratory of Marine Environmental Survey Technology and Application, Ministry of Natural Resource, P.R. China (MESTA-2020-B014); Research and Development Projects in Key Areas of Guangdong Province (2020B1111020004); Guangdong Ocean University Fund Project (R18021); First-class Special Fund (231419018); Innovation Strong School Project of Guangdong Ocean University (230420021).
The authors are grateful for the anonymous reviewers’ careful review and valuable suggestions to improve the manuscript.
The authors declare that the research was conducted in the absence of any commercial or financial relationships that could be construed as a potential conflict of interest.
All claims expressed in this article are solely those of the authors and do not necessarily represent those of their affiliated organizations, or those of the publisher, the editors and the reviewers. Any product that may be evaluated in this article, or claim that may be made by its manufacturer, is not guaranteed or endorsed by the publisher.
The Supplementary Material for this article can be found online at: https://www.frontiersin.org/articles/10.3389/fmars.2022.1004235/full#supplementary-material
Anderson D. M., Glibert P. M., Burkholder J. M. (2002). Harmful algal blooms and eutrophication: nutrient sources, composition, and consequences. Estuaries 25, 704–726. doi: 10.1007/BF02804901
Arai M. N. (2001). Pelagic coelenterates and eutrophication: a review. Hydrobiologia 451 (1-3), 69–87. doi: 10.1023/A:1011840123140
Boynton W. R., Kemp W. M., Keefe C. W. (1982). “A comparative analysis of nutrients and other factors influencing estuarine phytoplankton production,” in Estuarine comparisons (New York, USA: Academic Press), 69–90.
Briceo H., Boyer J., Harlem P. (2010). Proposed methodology for the assessment of numeric nutrient criteria for south Florida estuaries and coastal waters (USA: Florida International University, Southeast Environmental Research Center).
Burkholder J. M., Noga E. J., Hobbs C. H., Glasgow H. B., Smith S. A. (1992). New ‘phantom’ dinoflagellate is the causative agent of major estuarine fish kills. Nature 358 (6385), 407–410. doi: 10.1038/360768e0
Cai W. J., Hu X., Huang W. J., Murrell M. C., Lehrter J. C., Lohrenz S. E., et al. (2011). Acidification of subsurface coastal waters enhanced by eutrophication. Nat. Geosci. 4, 766. doi: 10.1038/ngeo1297
Chen M. Y., Chen D., Zheng A. R., Shi X. Y., Li Q. D., Jiang P., et al. (2020). Distribution features of nitrogen, phosphorus, chlorophyll-a and their relationships with environmental factors in the jiulongjiang river estuary sea area. J. Xiamen University(Natural Science) 59 (S1), 99–106.
Chen N., Peng B., Hong H., Turyaheebwa N., Cui S., Mo X. (2013). Nutrient enrichment and n: P ratio decline in a coastal bay-river system in southeast China: the need for a dual nutrient (N and p) management strategy. Ocean Coast. Manag. 81, 7–13. doi: 10.1016/j.ocecoaman.2012.07.013
China National Standardization Management Committee (2007). The specification for marine monitoring. China: Standards Press of China.
China National Standardization Management Committee (2007b). Specification for oceanographic survey-part 4: Survey of chemical parameters in sea water. China: Standards Press of China.
Conley D. J., Paerl H. W., Howarth R. W., Boesch D. F., Seitzinger S. P., Havens K. E., et al. (2009). Controlling eutrophication on: nitrogen and phosphorus. Science 323 (5917), 1014–1015.
Cui X., Huang C., Wu J., Liu X., Hong Y. (2020). Temporal and spatial variations of net anthropogenic nitrogen inputs (NANI) in the pearl river basin of China from 1986 to 2015. PloS One 15 (2), e0228683. doi: 10.1371/journal.pone.0228683
Dang E. S., Tang J. Y., Zhou L. N., Ye C., Bao C. G. (2019). Water quality assessment and eutrophication analysis in coastal waters of pearl river estuary. J. Dalian Ocean Univ. 34 (4), 580–587.
Davidson K., Gowen R. J., Harrison P. J., Fleming L. E., Hoagland P., Moschonas G. (2014). Anthropogenic nutrients and harmful algae in coastal waters. J. Environ. Manage. 146, 206–216. doi: 10.1016/j.jenvman.2014.07.002
Department of Ecology and Environment of Guangdong Province (2020). Seawater monitoring information in coastal waters of guangdong province in 2019. Guangzhou, Guangdong: Guangdong Environmental Monitoring Center.
Department of Ecology and Environment of Guangdong Province (2021). Seawater monitoring information in coastal waters of guangdong province in 2020. Guangzhou, Guangdong: Guangdong Environmental Monitoring Center.
Department of Ecology and Environment of Guangdong Province (2022a). 2021 report on the state of guangdong provincial ecology and environment. Guangzhou, Guangdong: Guangdong Provincial Department of ecology and environment.
Department of Ecology and Environment of Guangdong Province (2022b). The “14th five-year plan” for marine ecological environmental protection in guangdong province. Guangzhou, Guangdong: Department of Ecology and Environment of Guangdong Province.
Department of Ecology and Environment of Jiangsu Province (2021a). Evaluation standard for seawater quality of jiangsu province, total nitrogen and total phosphorus. Nanjing, Jiangsu: Department of Ecology and Environment of Jiangsu Province.
Department of Ecology and Environment of Jiangsu Province (2021b). Specification for compilation of total nitrogen and total phosphorus of marine water quality assessment standard (draft for public comment). Jiangsu, China: Department of Ecology and Environment of Jiangsu Province.
DePinto J. V., Verhoff F. H. (1977). Nutrient regeneration from aerobic decomposition of green algae. Environ. Sci. Technol. 11 (4), 371–377. doi: 10.1021/es60127a002
McLaughlin. D. B. (1977). Maximizing the accuracy of field-derived numeric nutrient criteria in water quality regulations. Integrated Environmental Assessment and Management 10 (1), 133–137.
McLaughlin D. B. (2014). Maximizing the accuracy of field-derived numeric nutrient criteria in water quality regulations. Integrated environmental assessment and management. 10 (1), 131–137.
Evans-white M. A., Haggard B. E., Scott J. T. (2013). A review of stream nutrient criteria development in the united states. J. Environ. Qual. 42 (4), 1002–1014. doi: 10.2134/jeq2012.0491
Florida Department of Environment Protection (FDEP) (2007). State of Florida numeric nutrient criteria development plan. USA: Florida Department of Environment Protection.
Florida Department of Environment Protection (FDEP) (2011). Site-specific information in support of establishing numeric nutrient criteria for Biscayne bay, Florida bay, Florida keys, and whitewater bay-ten thousand islands. USA: Florida Department of Environment Protection.
Geeraert N., Archana A., Xu M. N., Kao S. J., Baker D. M., Thibodeau B. (2021). Investigating the link between pearl river-induced eutrophication and hypoxia in Hong Kong shallow coastal waters. Sci. Total Environ. 772, 145007. doi: 10.1016/j.scitotenv.2021.145007
Ge T. T., Wang X. Y., Tan L. J., Li T. (2021). Effect of stratification and tides on the transport of particulate nitrogen and phosphorus near the changjiang river estuary in summer. Mar. Sci. 45 (08), 1–9. doi: 10.11759/hykx20210319003
Glibert P. M., Al-Azri A., Icarus Allen J., Bouwman A. F., Beusen A. H., Burford M. A., et al. (2018). “Key questions and recent research advances on harmful algal blooms in relation to nutrients and eutrophication,” in Global ecology and oceanography of harmful algal blooms, 229–259. doi: 10.1007/978-3-319-70069-4_12
Helcom (2015)HELCOM eutrophication assessment. Available at: http://helcom.fi/helcom-at-work/projects/eutro-oper/.
Helcom (2017)HELCOM core indicator report. Available at: www.helcom.fi.
Herbeck L. S., Unger D., Wu Y., Jennerjahn T. C. (2013). Effluent, nutrient and organic matter export from shrimp and fish ponds causing eutrophication in coastal and back-reef waters of NE hainan, tropical China. Cont. Shelf Res. 57, 92–104. doi: 10.1016/j.csr.2012.05.006
Herrero F. S., Teixeira H., Poikane S. (2019). A novel approach for deriving nutrient criteria to support good ecological status: application to coastal and transitional waters and indications for use. Front. Mar. Sci. 6 (255). doi: 10.3389/fmars.2019.00255
He G. F., Yuan G. M., Li F. Q. (2004). Effect of economic development on water quality in zhujiang estuary. Mar. Environ. Sci. 23 (4), 50–52. doi: 10.2174/0929866043478455
Hong X. Y. (2022). Analysis of the long-term dynamics of nutrients linking to terrestrial pollution in xiamen bay. J. Appl. Oceanogr. 41 (02), 249–258.
Hong Y., Wu J., Guan F., Yue W., Long A. (2019). Nitrogen removal in the sediments of the pearl river estuary, China: Evidence from the distribution and forms of nitrogen in the sediment cores. Mar. pollut. Bull. 138, 115–124. doi: 10.1016/j.marpolbul.2018.11.040
Howarth R. W. (2008). Coastal nitrogen pollution: A review of sources and trends globally and regionally. Harmful Algae. 8 (1), 14–20. doi: 10.1016/j.hal.2008.08.015
Huang Y. F. (2008). Nutrient limitation of eutrophication in guangzhou Sea area (Qingdao, Shandong: Ocean University of China).
Huang B. Q., Hong H. S. (1999). Alkaline phosphatase activity and utilization of dissolved organic phosphorus by algae in subtropical coastal waters. Mar. pollut. Bull. 39 (1/12), 205–211. doi: 10.1016/S0025-326X(99)00006-5
Huang X. P., Huang L. M. (2002). Temporal and spatial variation characteristics of inorganic nitrogen and active phosphorus in zhujiang estuary. J. Oceanogr. Taiwan Strait 21 (4), 6. doi: 10.3969/j.issn.1000-8160.2002.04.005
Huang X. P., Huang L. M., Yue W. Z. (2003). The characteristics of nutrients and eutrophication in the pearl river estuary, south China. Mar. pollut. Bull. 47 (1), 30–36. doi: 10.1016/S0025-326X(02)00474-5
Huang F., Lin X., Hu W., Zeng F., He L., Yin K. (2021). Nitrogen cycling processes in sediments of the pearl river estuary: Spatial variations, controlling factors, and environmental implications. Catena 206, 105545. doi: 10.1016/j.catena.2021.105545
Hume T. M., Herdendorf C. E. (1988). A geomorphic classification of estuaries and its application to coastal resource management a new Zealand example. Ocean Shoreline Manage. 11 (3), 294–274. doi: 10.1016/0951-8312(88)90022-7
Huo S. L., Chen Q., Xi B. D., Guo X. J., Chen Y. Q., Liu H. L. (2009). A literature review for lake nutrient criteria development. Ecol. Environ. Sci. 18 (2), 743–748.
Huo S. L., Ma C. Z., Xi B. D., He Z. S. (2017). Progress in research on lake nutrient criteria. J. Environ. Eng. Technol. 7 (2), 125–133.
Huo S., Ma C., Xi B., He Z., Su J., Wu F. (2015). Nonparametric approaches for estimating regional lake nutrient thresholds. Ecol. Indic. 58, 225–234. doi: 10.1016/j.ecolind.2015.05.065
Huo S. L., Ma C. Z., Xi B. D., Zhang Y. L., Wu F. C., Liu H. L. (2018). Development of methods for establishing nutrient criteria in lakes and reservoirs: A review. J. Environ. Sci. 67 (05), 54–66. doi: 10.1016/j.jes.2017.07.013
Hu Q., Qu L., Huang B. G., Li Q., You Q. M. (2016). Status and evaluation on nutrients for the adjacent sea water of the yellow river estuary in autumn of 2014. Mar. Environ. Sci. 35 (05), 732–738.
Hu Y. Y., Wang J. Y., Zhang Z. F., Zong H. M., Chen S. M. (2011). Approach of nutrient criteria establishment and application in coastal area of liaohe estuary. China Environ. Sci. 31 (6), 996–1000. doi: 10.3724/SP.J.1011.2011.00468
Hu P., Yan S. Q., Shi P., Zheng Z. Y., Lin L. R. (2020). The situation and protection suggestions of marine ecological environment in guangdong province. Ocean Dev. Manage. 37 (06), 115–120.
Jin J., Liu S. M. (2013). Advances in studies of phosphorus utilization by marine phytoplankton. Adv. Earth Sci. 28 (02), 253–261. doi: 10.11867/j.issn.1001-8166.2013.02.0253
Ke S., Zhang P., Ou S. J., Zhang J. X., Chen J. Y., Zhang J. B. (2022). Spatiotemporal nutrient patterns, composition, and implications for eutrophication mitigation in the pearl river estuary, China. Estuar. Coast. Shelf Sci. 266, 107749. doi: 10.1016/j.ecss.2022.107749
Lai Z. N., Wang C., Gao Y., Zeng Y. Y., Liu Q. F., Peng S. Y., et al. (2018). Aquatic ecological environment of pearl river estuary (Beijing: China Agricultural Press), 29–30.
Lan W. L., Li T. S., Han L. J. (2014). Distribution and seasonal variation of nutrient in the adjacent waters of tieshangang bay in guangxi. Mar. Sci. 38 (7), 64–69.
Liang Z. Y., Xu Y. Y., Qiu Q. L. L., Liu Y., Lu W. T., Wagner T. (2021). A framework to develop joint nutrient criteria for lake eutrophication management in eutrophic lakes. J. Hydrol. 594, 125883. doi: 10.1016/j.jhydrol.2020.125883
Li K. Q., He J., Li J., Guo Q., Liang S. K., Li Y. B., et al. (2018). Linking water quality with the total pollutant load control management for nitrogen in jiaozhou bay, China. Ecol. Indic. 85, 57–66. doi: 10.1016/j.ecolind.2017.10.019
Li R. H., Liu S. M., Li Y. W., Zhang G. L., Ren J. L., Zhang J. (2014). Nutrient dynamics in tropical rivers, lagoons, and coastal ecosystems of eastern hainan island, south China Sea. Biogeosciences 11 (2), 481. doi: 10.5194/bg-11-481-2014
Li R. H., Liu S. M., Zhang G. L., Ren J. L., Zhang J. (2013). Biogeochemistry of nutrients in an estuary affected by human activities: The wanquan river estuary, eastern hainan island, China. Cont. Shelf Res. 57, 18–31. doi: 10.1016/j.csr.2012.02.013
Li Y. D., Lu C. C., Li H. L., Chang L., Lin J., Shen M. (2022). Distribution and diurnal variation of main nutrients in the Yangtze river estuary and its adjacent based on GOCI. Mar. Forecasts 39 (02), 1–13.
Lin X. J., Gao S., Zhang T. Y., Liu G. M. (2018). Researching progress and application status of eutrophication evaluation method of seawater. Adv. Earth Sci. 33 (04), 373–384.
Lin G. M., Lin X. B. (2022). Bait input altered microbial community structure and increased greenhouse gases production in coastal wetland sediment. Water Res. 218, 118520. doi: 10.1016/j.watres.2022.118520
Li M. M., Pang B. J., Lan W. L., Fu J. X. (2020). Study on estuarine mixed zone delimitation and nutrient standard limits construction method. Environ. Monit. China 36 (03), 74–82.
Liu B. L., Cao W. Z., Huang Z., Chen W. H., Chen H. H., Liu L. S. (2018). Developing nutrient criteria for the jiulong river estuary, southeast China. Acta Oceanol. Sin. 37 (2), 1–13. doi: 10.1007/s13131-017-1121-0
Liu C. L., Jin S. L., Ma Y. F., Li S. (2020). Nutrient concentrations and distribution characteristics in the Yangtze river estuary adjacent sea are in summer. J. Xiamen Univ. (Natural Science) 59 (S1), 75–80. doi: 10.19316/j.issn.1002-6002.2020.03.09
Liu J., Liu L. S., Zheng B. H. (2017). Problems and countermeasures of water environmental management in estuaries. Res. Environ. Sci. 30 (5), 645–653. doi: 10.13198/j.issn.1001-6929.2017.02.28
Liu S. M., Li R. H., Zhang G. L., Wang D. R., Du J. Z., Herbeck L. S., et al. (2011). The impact of anthropogenic activities on nutrient dynamics in the tropical wenchanghe and wenjiaohe estuary and lagoon system in East hainan, China. Mar. Chem. 125 (1), 49–68. doi: 10.1016/j.marchem.2011.02.003
Liu L. S., Zheng B. H., Meng W., Cai W. Q. (2011). Sub-Areas compartmentalization of changjiang estuary based on the natural geographical characteristics. Acta Ecol. Sin. 31 (17), 5042–5054.
Li R., Xu J., Li X., Shi Z., Harrison P. J. (2017). Spatiotemporal variability in phosphorus species in the pearl river estuary: Influence of the river discharge. Sci. Rep. 7 (1), 649–648. doi: 10.1038/s41598-017-13924-w
Li Z.Y., Yu R.C., Liu Z.T., Li A.F., Hu H., Wang L., et al (2019). Technical guide for nutrient criteria in estuarine water bodies. Chinese Society for Oceanology and Limnology. Available at: http://csol.qdio.ac.cn/xhdtDetail.aspx?id=2640
Long Y. X., Sun Q., Yang K. (2020). Research on trend of nutrients and its response to human activities in the pearl river estuary. E3S Web Conf. 145, 02081. doi: 10.1051/e3sconf/202014502081
Lu Z., Gan J., Dai M., Liu H., Zhao X. (2018). Joint effects of extrinsic biophysical fluxes and intrinsic hydrodynamics on the formation of hypoxia west off the pearl river estuary. J. Geophys. Res.: Oceans 123 (9), 6241–6259. doi: 10.1029/2018JC014199
Lu F. H., Ni H. G., Liu F., Zeng E. Y. (2009). Occurrence of nutrients in riverine runoff of the pearl river delta, south China. J. Hydrol. 376 (1), 107–115. doi: 10.1016/j.jhydrol.2009.07.018
Luo Y. (2017). Spatial and temporal variations of dissolved organic nitrogen in typical seas and theirs effects on phytoplankton communities (Xiamen, Fujian: Third Institute of Oceanography, Ministry of Nature Resources). Available at: https://xueshu.baidu.com/usercenter/paper/show?paperid=53a334552d4d5254155a8f2b115e3741&site=xueshu_se
Luo Y., Chen B. H., Lin H., Sun X. W., Chen W. F., Dong X., et al. (2017). Spatial and temporal distribution of dissolved organic nitrogen and composition of total dissolved nitrogen in xiamen waters in autumn and winter. J. Appl. Oceanogr. 36 (02), 210–220.
Lu D. L., Yang N. N., Liang S. K., Li K. Q., Wang X. L. (2016). Comparison of land-based sources with ambient estuarine concentrations of total dissolved nitrogen in jiaozhou bay (China). Estuar. Coast. Shelf Sci. 180, 82–90. doi: 10.1016/j.ecss.2016.06.032
Ma Y., Wei W., Xia H. Y., Yu B., Wang. D., Ma Y., et al. (2009). History change and influence factor of nutrient in lingdingyang sea area of zhujiang river estuary. Acta Oceanol. Sin. 31 (02), 69–77. doi: 10.3321/j.issn0253-4193.2009.02.010
Ma B., Zhao H. (2021). Distribution characteristics of chlorophyll a and nutrients in the pearl river estuary in summer and their relationship with environmental factors. Mar. Environ. Sci. 40 (5), 707–716.
McLaughlin D. B. (2014). Maximizing the accuracy of field-derived numeric nutrient criteria in water quality regulations. Integr. Environ. Assess. Manage. 10 (1), 133–137. doi: 10.1002/ieam.1485
Ménesguen A. (2014). “Eutrophication of the marine environment,” in The land-Sea interactions, 71–191. John Wiley & Sons, Inc.
Meng W., Wang L. J., Zheng B. H., Lei K. (2008). Methods for developing nutrient criteria in estuarine waters. Acta Ecol. Sin. 28 (10), 5133–5140. doi: 10.3321/j.issn:1000-0933.2008.10.061
Ministry of Ecology and Environment of the People’s Republic of China (1997). Sea Water quality standard (GB 3097-1997). China: Ministry of Ecology and Environment of the People’s Republic of China.
Ministry of Ecology and Environment of the People’s Republic of China (2002). Environmental quality standards for surface water (GB 3838-2002). China: Ministry of Ecology and Environment of the People’s Republic of China.
Ministry of Ecology and Environment of the People’s Republic of China (2022a). Action plan for comprehensive management of key sea areas. China: Ministry of Ecology and Environment of the People’s Republic of China.
Ministry of Ecology and Environment of the People’s Republic of China (2022b). The “14th five-year plan” for marine ecological environmental protection. China: Ministry of Ecology and Environment of the People’s Republic of China.
Ministry of Environmental Protection of the PRC (2009). Specification for offshore environmental monitoring: HJ 442–2008 (China: China Environment Science Press), 19.
Niu L., Luo X., Hu S., Liu F., Cai H., Ren L., et al. (2020a). Impact of anthropogenic forcing on the environmental controls of phytoplankton dynamics between 1974 and 2017 in the pearl river estuary, China. Ecol. Indic. 116, 106484. doi: 10.1016/j.ecolind.2020.106484
Niu L., van Gelder P., Luo X., Cai H., Zhang T., Yang Q. (2020b). Implications of nutrient enrichment and related environmental impacts in the pearl river estuary, China: Characterizing the seasonal influence of riverine input. Water 12 (11), 3245. doi: 10.3390/w12113245
Peng H. H., Geng H. Y., Mao X. Y., Shi J., Lv X. Q. (2021). Study on total control of total nitrogen in the laizhou bay. Water 13 (17), 2439–2439. doi: 10.3390/w13172439
Qiu D., Huang L., Zhang J., Lin S. (2010). Phytoplankton dynamics in and near the highly eutrophic pearl river estuary, south China Sea. Cont. Shelf Res. 30 (2), 177–186. doi: 10.1016/j.csr.2009.10.015
Raymond P., Morgan I., Kathleen M. (2011). Nutrient concentrations in Maryland non-tidal streams. Environ. Monit. Assess. doi: 10.1007/s10661-010-1684-0
Redfield A. C., Ketchum B. H., Richards F. A. (1963). “The influence of organisms on the composition of sea-water,” in The Sea. Ed. Hill M. N. (New York: Interscience), 26–77.
Ryther J. H., Dunstan W. M. (1971). Nitrogen, phosphorus, and eutrophication in the coastal marine environment. Science 171 (3975), 1008–1013. doi: 10.2307/1731314
Schlitzer R. (2002). Interactive analysis and visualization of geoscience data with ocean data view. Comput. Geosci. 28 (10), 1211–1218. doi: 10.1016/S0098-3004(02)00040-7
Smith V. H., Tilman G. D., Nekola J. C. (1999). Eutrophication: impacts of excess nutrient inputs on freshwater, marine, and terrestrial ecosystems. Environ. Pollut. 100 (1), 179–196. doi: 10.1016/S0269-7491(99)00091-3
Song S., Guo L. F., Zhang H., Zhang H. (2021). Research on pollution control mechanism of watershed, estuary and coastal sea areas. Mar. Environ. Sci. 40 (06), 838–842.
South China Sea Branch of the State Oceanic Administration (2017). South China Sea marine environment bulletin in 2016. 29. China: South China Sea Branch of S.O.A.
State of Oceanic Administration (2018). Bulletin of China marine ecological environment status in 2017. 7–8. China: State Oceanic Administration.
Strokal M., Kroeze C., Wang M., Ma L. (2017). Reducing future river export of nutrients to coastal waters of China in optimistic scenarios. Sci. Total Environ. 579, 517–528. doi: 10.1016/j.scitotenv.2016.11.065
Su J., Ji D. F., Lin M., Chen Y. Q., Sun Y. Y., Huo S. L., et al. (2017). Developing surface water quality standards in China. Res. Conserv. Recy 117, 294–303. doi: 10.1016/j.resconrec.2016.08.003.
Su J., Yang F. X., Su R. G., Yao Q. Z. (2016). Approach of nutrient criteria establishment and application in the liaohe estuary. Periodical Ocean Univ. China 46 (9), 78–84.
Tong Y., Zhao Y., Zhen G., Chi J., Liu X., Lu Y., et al. (2015). Nutrient loads flowing into coastal waters from the main rivers of china, (2006-2012). Sci. Rep. 5, 16678. doi: 10.1038/srep16678
US EPA (1998). National strategy for the development of regional nutrient criteria (Washington, DC: USEPA).
US EPA (2000). “Nutrient criteria technical guidance manual lakes and reservoirs,” in Water quality criteria for the protection of human health. Washington, DC: U.S. Environmental Protection Agency, Office of Water.
US EPA (2001). Nutrient criteria technical guidance manual: Estuarine and coastal marine waters (Washington, DC: U.S. Environmental Protection Agency, Office of Water).
US EPA (2009). National recommended water quality criteria (USA: United States Environmental Protection Agency, Office of Water, Office of Science and Technology).
Wang L., Chan Y. Y., Bian J. C., Li Z. Y. (2020). Study on derivation of nutrient for the daliaohe estuary. Mar. Sci. 44 (12), 1–13.
Wang B. D., Xin M., Wei Q. S., Xie L. P. (2018). A historical overview of coastal eutrophication in the China seas. Mar. pollut. Bull. 136, 394–400. doi: 10.1016/j.marpolbul.2018.09.044
Wei M. X., Fang H. Q., He B. M., Cao Q., Li Z., Pan L. H. (2014). Biogeochemical characteristics of nitrogen in seawater and its ecological effect at mangrove areas in bays, guangxi. Wetland Sci. 12 (04), 441–450. doi: 10.13248/j.cnki.wetlandsci.2014.04.006
Wei G. Q., Wang H., Cai W. X., Yi B. (2012). 10-year retrospective analysis on harmful algal blooms in the pearl river estuary. Mar. Sci. Bull. 31 (04), 466–474. doi: 10.1007/s11783-011-0280-z
Wu D. (2007). Comprehensive eutrophication assessment for estuaries and coastal waters based on the PSR framework (Dalian Maritime University).
Wu G., Cao W., Wang F., Su X., Yan Y., Guan Q. (2019). Riverine nutrient fluxes and environmental effects on china’s estuaries. Sci. Total Environ. 661, 130–137 China. doi: 10.1016/j.scitotenv.2019.01.120
Wu G. J., Cao W. Z., Zheng H., Kao C. M., Chang C. T., Chiang P. C., et al. (2017). Decadal changes in nutrient fluxes and environmental effects in the jiulong river estuary. Mar. pollut. Bull. 124 (2), 871–877. doi: 10.1016/j.marpolbul.2017.01.071
Xia W., Zhou Z. Q. (2021). Analysis of meteorological and hydrological elements in the sea around the pearl river estuary based on observed data in summer. Trans. Oceanol. Limnol. 43 (5), 60–65.
Xu H. Y. (2020). Regime shift of trophic status and nutrient criteria in the bohai Sea (China: The First Institute of Oceanography, Ministry of Nature Resources).
Yang F. X. (2015). Approaches of nutrient criteria establishment and its influencing factors in the daliaohe estuary (Qingdao, Shandong: Ocean University of China).
Yang F. X., Mi. T. Z., Chen H. T., Yao Q. Z. (2019). Developing numeric nutrient criteria for the Yangtze river estuary and adjacent waters in China. J. Hydrol. 579, 124188. doi: 10.1016/j.jhydrol.2019.124188
Yan S. H., Li T. (2018). Assessment of the pearl river estuary by water comprehensive pollution index. China Resour. Compr. Util. 36 (7), 173–175. doi: CNKI:SUN:ZWZS.0.2018-07-059
Yin K., Qian P. Y., Chen J. C., Hsieh D. P. H., Harrison P. J. (2000). Dynamics of nutrients and phytoplankton biomass in the pearl river estuary and adjacent waters of Hong Kong during summer: preliminary evidence for phosphorus and silicon limitation. Mar. Ecol.-Prog. Series. 194, 295–305, England. doi: 10.3354/meps194295
Yin K., XU J., Lai Z., Harrison P. J. (2013). “Dynamics of phytoplankton blooms and nutrient limitation in the pearl river (Zhujiang) estuarine coastal waters,” in Biogeochemical dynamics at major river-coastal interfaces. Eds. Bianchi T., Allison M., Cai W. (Cambridge University Press), 274–295.
Yuan G. M. (2005). The effect of economic development of zhujiang delta on the water environment at zhujiang estuary (Qingdao, Shandong: Ocean University of China).
Zeng D. N., Niu L. X., Tao W., Fu L. X., Yang Q. S. (2020). Nutrient dynamics in pearl river estuary and their eutrophication evaluation. J. Guangdong Ocean Univ. 40 (3), 73–82. doi: 10.3969/j.issn.1673-9159.2020.03.010
Zhang P., Chen Y., Peng C., Dai P., Lai J., Zhao L., et al. (2020b). Spatiotemporal variation, composition of DIN and its contribution to eutrophication in coastal waters adjacent to hainan island, China. Reg. Stud. Mar. Sci. 37, 101332. doi: 10.1016/j.rsma.2020.101332
Zhang P., Peng C. H., Zhang J. B., Zhang J. X., Chen J. Y., Zhao H. (2022). Long-term harmful algal blooms and nutrients patterns affected by climate change and anthropogenic pressures in the zhanjiang bay, China. Front. Mar. Sci. 9, 849819. doi: 10.3389/fmars.2022.849819
Zhang P., Peng C. H., Zhang J. B., Zou Z. B., Shi Y. Z., Zhao L. R., et al. (2020c). Spatiotemporal urea distribution, sources, and indication of DON bioavailability in zhanjiang bay, China. Water 12 (3). doi: 10.3390/w12030633
Zhang P., Ruan H., Dai P., Zhao L., Zhang J. (2020a). Spatiotemporal river flux and composition of nutrients affecting adjacent coastal water quality in hainan island, China. J. Hydrol. 591, 125293. doi: 10.1016/j.jhydrol.2020.125293
Zhang P., Su Y., Liang S. K., Li K. Q., Li Y. B., Wang X. L. (2017). Assessment of long-term water quality variation affected by high-intensity land-based inputs and land reclamation in jiaozhou bay, China. Ecol. Indic. 75, 210–219. doi: 10.1016/j.ecolind.2016.12.035
Zhang W., Sun J., Nie H. T., Jiang G. Q., Tao J. H. (2015). Seasonal and spatial variation of nutrient and the response of phytoplankton in PRE and adjacent sea areas. Acta Ecol. Sin. 35 (12), 4034–4044. doi: 10.5846/stxb201308262158
Zhang J. H., Wang D., Liu G. X., Wang Y., Dong H. Z., Han X. Y., et al. (2020). Phosphorus species in the Yangtze river estuary adjacent sea area in summer of 2016. J. Xiamen Univ. (Natural Science) 59 (S1), 99–92. doi: 10.6043/j.issn.0438-0479.202007113
Zhang P., Wei L. R., Lai J. Y., Dai P. D., Chen Y., Zhang J. B. (2019b). Concentration, composition and fluxes of land-based nitrogen and phosphorus source pollutants input into zhanjiang bay in summer. J. Guangdong Ocean Univ. 39 (4), 63–72.
Zhang J. B., Zhang P., Dai P. D., Lai J. Y., Chen Y. (2019a). Spatiotemporal distributions of DIP and the eutrophication in hainan island adjacent coastal water. China Environ. Sci. 39 (6), 2541–2548. doi: 10.19674/j.cnki.issn1000-6923.2019.0303
Zhang J. B., Zhang Y. C., Zhang P., Li Y., Li J. X., Xu J. L., et al. (2021). Seasonal phosphorus variation in coastal water affected by the land-based sources input in the eutrophic zhanjiang bay, China. Estuar. Coast. Shelf Sci. 252, 107277. doi: 10.1016/j.ecss.2021.107277
Zhao H. T. (1989). Hydrological and sedimentary characteristics of the pearl river estuary. Trop. Geogr. 9 (3), 201–212.
Zhou F. X., Chen F. J., Li Z. Y., Zhu Q. M., Meng Y. F., Zhang S. W. (2018). Environmental characteristics of nutrients in the pearl river estuary in spring 2014. J. Guangdong Ocean Univ. 38 (3), 42–48. doi: 10.3969/j.issn.1673-9159.2018.03.007
Zhou Y., Wang L. L., Zhou Y. Y., Mao X. Z. (2020). Eutrophication control strategies for highly anthropogenic influenced coastal waters. Sci. Total Environ. 705, 135760. doi: 10.1016/j.scitotenv.2019.135760
Keywords: coastal eutrophication, nutrient criteria, water quality, assessment, Pearl River estuary
Citation: Zhang P, Ou S, Zhang J, Zhao L and Zhang J (2022) Categorizing numeric nutrients criteria and implications for water quality assessment in the Pearl River Estuary, China. Front. Mar. Sci. 9:1004235. doi: 10.3389/fmars.2022.1004235
Received: 27 July 2022; Accepted: 26 August 2022;
Published: 23 September 2022.
Edited by:
Meilin Wu, South China Sea Institute of Oceanology, (CAS), ChinaReviewed by:
Wen-zhuo Zhu, Zhejiang Ocean University, ChinaCopyright © 2022 Zhang, Ou, Zhang, Zhao and Zhang. This is an open-access article distributed under the terms of the Creative Commons Attribution License (CC BY). The use, distribution or reproduction in other forums is permitted, provided the original author(s) and the copyright owner(s) are credited and that the original publication in this journal is cited, in accordance with accepted academic practice. No use, distribution or reproduction is permitted which does not comply with these terms.
*Correspondence: Jibiao Zhang, emhhbmdqYkBnZG91LmVkdS5jbg==
Disclaimer: All claims expressed in this article are solely those of the authors and do not necessarily represent those of their affiliated organizations, or those of the publisher, the editors and the reviewers. Any product that may be evaluated in this article or claim that may be made by its manufacturer is not guaranteed or endorsed by the publisher.
Research integrity at Frontiers
Learn more about the work of our research integrity team to safeguard the quality of each article we publish.