 Sheng Ke1
 Peng Zhang
 Junxiao Zhang
 Jibiao Zhang
94% of researchers rate our articles as excellent or good
Learn more about the work of our research integrity team to safeguard the quality of each article we publish.
Find out more
ORIGINAL RESEARCH article
Front. Mar. Sci., 28 February 2023
Sec. Marine Biogeochemistry
Volume 10 - 2023 | https://doi.org/10.3389/fmars.2023.1129712
This article is part of the Research TopicNutrient Biogeochemistry in the Land-Sea ContinuumView all 9 articles
The increasing riverine nutrient sources have significantly affected the ecological environment of estuaries and coastal waters, resulting in deteriorating land-sea water quality and intensified eutrophication. However, the effects of river input flux on spatiotemporal patterns of total nitrogen (TN) and total phosphorus (TP) were poorly understood in the Pearl River Estuary (PRE). In this study, the spatiotemporal patterns of TN and TP concentrations and river input flux of PRE were studied based on the seasonal nutrients monitoring data obtained for the rivers and estuary in 2019. The results showed the spatiotemporal patterns of the TN and TP concentrations in the eight rivers of the PRE were different, and the annual average concentrations of TN and TP in the rivers entering the PRE were 207.18 ± 105.13 and 3.51 ± 1.70 μmol/L, respectively. The annual river TN and TP fluxes discharged into the PRE were 8.61 × 10¹⁰ and 1.55 × 10⁹ mol/year, respectively. In addition, the significantly decreasing trends in of TN and TP concentrations from upper estuary to offshore seawater were observed in the PRE, which implied TN and TP showed conservative behaviour in all season and only the dry season, respectively. Moreover, the annual average concentrations of TN and TP in the estuary were 70.64 ± 10.10 and 1.67 ± 0.78 μmol/L, respectively. The annual average ratios of TN/TP for rivers, freshwater, mixed and seawater were 59.31 ± 5.98, 59.45 ± 3.75, 45.73 ± 21.27 and 330.94 ± 434.71 respectively, which were higher than the Redfield ratios. These results indicated that the water quality in most areas of the PRE is significantly polluted and that the TN and TP in seawater were significantly influenced by river inputs. Therefore, monitoring and management of unified TN and TP nutrient indicators discharge from rivers entering the sea can be strengthened in the PRE, and eutrophication mitigation strategy should be established and implemented across river-estuary-coast continuum systems in the Great Bay Area.
The biogeochemical cycles of nutrients play an important role in maintaining the ecological balance of the river-estuary-coastal system. Nitrogen and phosphorus are important biogenic elements in water, which provide an important material base for marine phytoplankton life activities and are the main limiting factors for phytoplankton growth (Conley et al., 2009; Zhang et al., 2009; Yu, 2014). The appropriate concentration and speciation of nitrogen and phosphorus in seawater are conducive to phytoplankton growth (Davidson et al., 2014; Ma and Zhao, 2021; Zhou et al., 2022). In recent years, with the rapid development of human society, many pollutants produced from human activities have entered coastal waters through rivers, causing coastal water pollution (Strokal et al., 2014; Zhang et al., 2019). In particular, the excessive discharge of anthropogenic nitrogen and phosphorus has led to widespread eutrophication of coastal waters (Painting et al., 2007; Lu et al., 2009; Paerl et al., 2018).
Estuaries are important areas between river and coastal water system, which can alter nutrient fluxes to the coastal sea (Froelich, 1988; Lin et al., 2022). Estuaries are usually regarded as traps for nutrients affected by the complex hydrodynamics and biogeochemistry process (Chen et al., 2018; Slomp, 2011; Ke et al., 2022). For example, the riverine and coastal wetland can reduce land-based nutrients sources discharge into estuary and coastal water. However, under human activities and climate change perturbations, the estuaries systems are facing with eutrophication affected by the land-based nitrogen and phosphorus in recent decades, such as Yangtze River Estuary, Yellow River Estuary, Liaohe Estuary, Jiulong Estuary. (Liu et al., 2012; Wu et al., 2019; Lin et al., 2022; Xu et al., 2022). However, the river watersheds and estuary were traditionally regarded as two separate systems (Chen et al., 2018; Tong et al., 2017; Lin et al., 2022). At present, total nitrogen (TN) and total phosphorus (TP) are the water quality indicators used for river freshwater system in China (Ministry of Ecology and Environment, PRC, 2002; Ministry of Ecology and Environment, PRC, 1997). In contrast, the water quality in estuary and seawater systems were mainly assessed by dissolved inorganic nitrogen (DIN) and dissolved inorganic phosphorus (DIP) (Ministry of Ecology and Environment, PRC, 1997). Thus, the mismatch monitoring indicators in nutrients were independently performed in the river and estuary-coast systems (Zhang et al., 2020a; Zhang et al., 2022), resulting in poor knowledge of the nutrients flux through the river to the estuary in spatiotemporal scale.
As one of the three main estuaries in China, the Pearl River Estuary (PRE) is composed of the Pearl River Delta network river and residual estuaries, which cover a large sea area (1526 km2) and contain abundant natural resources (Dupra et al., 2000). The adjacent delta region plays an important role in China’s economic and social development (Zhang, 2013; Dang et al., 2019). In recent years, with the rapid economic development of the Pearl River Delta region, various pollutants produced by human activities have been discharged into the Pearl River system through rivers and atmospheric deposition, and eventually into the PRE, resulting in increasingly significant water pollution problems, especially eutrophication (Cai et al., 2014; Dang et al., 2019; Liu et al., 2021; Xu et al., 2022). This has led to the proliferation of plankton, such as algae, a decline of dissolved oxygen in water, the death of many marine organisms, and the deterioration of coastal water quality (Glibert et al., 2018; Liu et al., 2020; Ke et al., 2022). The inputs of freshwater and anthropogenic nutrients are important reasons for the seasonal eutrophication of coastal water bodies (Paerl, 2006; Paerl et al., 2018; Wang et al., 2018). In recent years, all aspects of nutrients, such as N and P, have been studied for coastal waters. These studies indicated that coastal water eutrophication is mainly caused by land-based river input, such as urban domestic, industrial, agricultural wastewater, and other sewage discharge (Ma et al., 2009; Zhou et al., 2018). With the input of terrestrial pollutants, such as organic matter, nitrogen, and phosphorus, the composition and distribution of nutrients in coastal estuaries have significantly changed, resulting in the aggravation of coastal water pollution (Liu, 2006; Chen et al., 2022). Though previous studies have conducted the DIN and DIP in the estuaries, the spatiotemporal pattern TN and TP were still limited in the estuary system at present (Ke et al., 2022). In addition, owing to the mismatch of nutrients monitoring indicators between rivers and seawater, the hydrologic transport and biogeochemistry of TN and TP in the land-sea zone were scarcely. Therefore, we examined the response of the spatiotemporal pattern of TN and TP to the river input flux in the PRE, which is critical for managing the nutrient pollution in estuary and coastal waters.
Based on the climate and rainfall in the Pearl River Delta region, this study divides the seasons in the PRE sea into dry, wet and normal season. We collected the latest water quality monitoring data from January to December 2019 for rivers and three seasons coastal water adjacent to the PRE. This study mainly investigated the responses of coastal water quality in the PRE to the TN and TP input fluxes of eight rivers entering the sea. The objectives of the study were (1) to evaluate the spatial pollution status of TN and TP concentrations and fluxes in the rivers of the PRE; (2) to understand the spatiotemporal patterns of TN and TP, DIN and DIP concentrations in the coastal waters of the PRE; (3) to clarify the seasonal variation characteristics of TN/TP and DIN/DIP in the PRE and (4) to identify the mixed behaviours of TN and TP in the PRE. Such an understanding will help monitor river-estuary-coast system nutrients, prevent, and control water eutrophication, and provide an important basis for mitigating coastal water pollution in the PRE.
The PRE is located in the south-central coastal area of Guangdong Province, located in the northern part of the South China Sea (Figure 1). Its primary water source is the Pearl River and several rivers in the Pearl River Delta.The Pearl River is China’s third-longest and second-largest river, as well as the largest water system in the country’s south. It originates in the west of Yunnan-Guizhou Plateau and flows through northern Vietnam and six provinces in China (Guo, 2016). The Pearl River is mainly formed by the convergence of three major rivers, the East, North, and West rivers, and it finally enters the South China Sea at the Eight Gates of the PRE, with a total length of approximately 2320 km and a total drainage area of 453690 km2 (Yuan, 2005; Department of Water Resources in Guangdong Province, 2021; Luo, 2021). In 2019, the average annual rainfall in Guangdong province was 1993.6 mm (Department of Water Resources in Guangdong Province, 2020). The PRE is the frontier of the Pearl River Delta, which includes Guangzhou, Dongguan, Shenzhen, Hong Kong, Zhongshan, Zhuhai, Macao, and other coastal cities (Geeraert et al., 2021; Ke et al., 2022). With the reform and opening up in Guangdong, the economy of the Pearl River Delta has rapidly developed, and the river wastewater discharge from coastal cities has become the main source of nutrients entering the coastal waters of the PRE (Pang and Li, 2001; Huang et al., 2003). Basic information on the rivers entering the sea in the major coastal cities of the PRE in Guangdong Province is presented in Table 1.
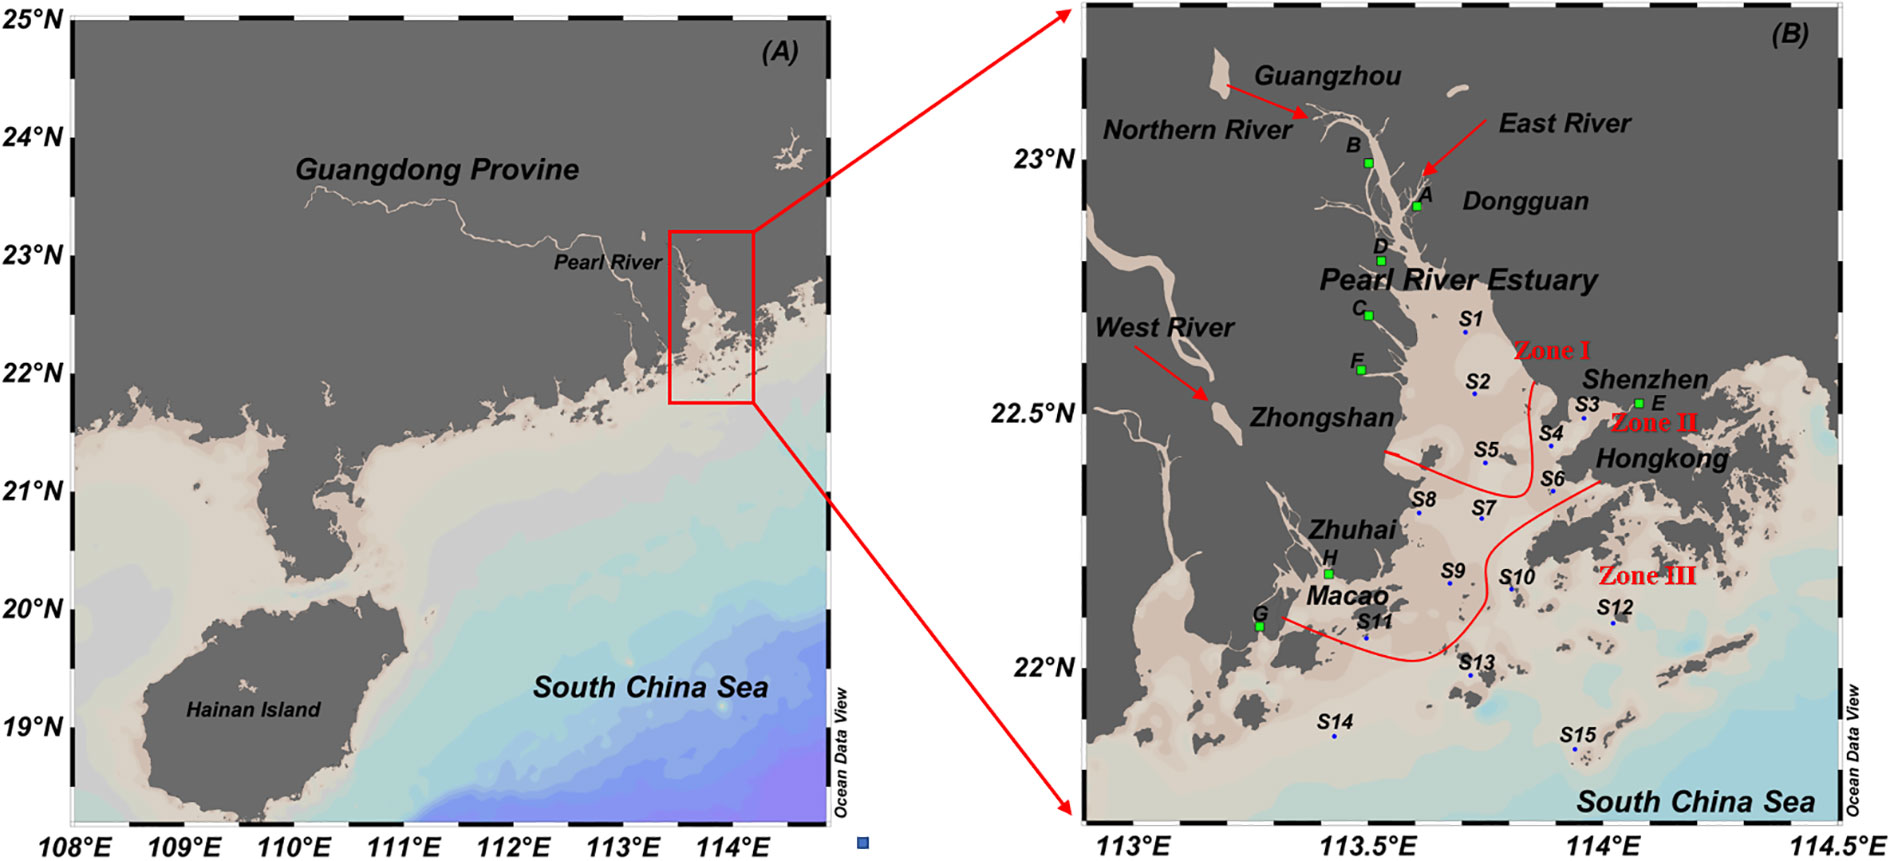
Figure 1 Geographical location of the PRE (A) and monitoring stations (B).
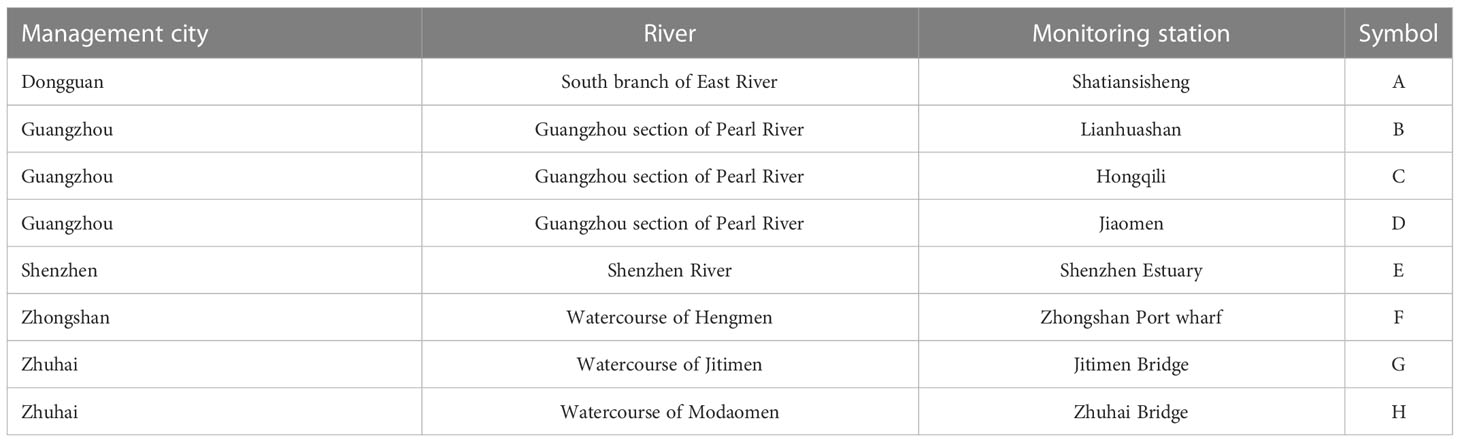
Table 1 Information on the rivers entering the sea flowing into the coastal waters of the PRE.
The locations of the water quality monitoring stations in the PRE and its coastal waters were shown in Figure 1. Based on the different salinity of seawater, the PRE marine monitoring stations can be divided into three zones: Zone I, Zone II and Zone III (Zhang et al., 2022). The Zone I was freshwater zone (S1, S2, and S5), the Zone II was mixed zone (S3, S4, S6, S7, S8, S9, and S11), and the Zone III was seawater zone (S10, S12, S13, S14, and S15) (Figure 1). The data for this study were obtained from the Department of Ecology and Environment of Guangdong Province. The seawater monitoring data of the PRE for the three seasons of 2019, namely dry season (May), wet season (August) and normal season (October), were selected separately, and data from fifteen marine monitoring stations S1-S15 were collected for each month, for a total of 45 seawater monitoring data. The chemical oxygen demand (COD), DO, and total suspended particles (TSP) the method specified in the Specification of Oceanographic Survey (China National Standardization Management Committee, 2007).The COD was determined by alkaline potassium permanganate method. DO was measured by iodine quantity method. The TSP was measured by weight method. In addition, the concentrations of TN and TP were directly determined using potassium persulfate oxidation method. The collected seawater samples were first filtered through a 0.45 μm membrane, and then the concentrations of NH4+-N, NO2–-N, NO3–-N and PO43–-P were determined using indophenol blue spectrophotometry, naphthalene ethylenediamine spectrophotometry, cadmium column reduction method and phosphomolybdenum blue spectrophotometry, respectively, according to the methods specified in (GB17378.4-2007) specification of oceanographic survey part IV: seawater analysis (China National Standardization Management Committee, 2007). Freshwater samples from estuaries were collected according to the methods specified in (HJ91-2002) the technical specifications for monitoring surface water and sewage (Ministry of Ecology and Environment, PRC, 2003).
As per the monitoring data of the rivers entering the sea obtained from the Guangdong Provincial Department of Ecology and Environment and the monthly flow data of the main rivers entering the PRE obtained from the Pearl River Water Resources Commission of the Ministry of Water Resources, the nutrient fluxes of the rivers entering the sea of the PRE in Guangdong Province were quantified. In this study, the TN and TP fluxes of the rivers entering the sea were estimated by referring to the calculation method of nutrient fluxes of eight estuaries entering the sea in the Pearl River Delta of Lu et al. (2009). The specific calculation procedure is presented in the supplementary supporting materials of this study.
Ocean Data View (4.0) software was used to draw the spatiotemporal distribution maps of the PRE and its seawater monitoring stations, as well as TN and TP. The Origin 2021 software was used to draw a box diagram of the spatial distribution patterns of TN and TP in the estuary of the PRE, the spatiotemporal fluxes and contribution patterns of TN and TP in the estuary, and the seasonal variations in TN/TP and DIN/DIP in the estuary of the PRE. Microsoft Excel 2016 was used for the statistical analysis of the monitoring data. SPSS 22 software was used to analyse the significant seasonal differences in the TN and TP concentrations of the rivers and seawater entering the PRE, and Spearman correlation significance level analysis was conducted on the environmental factors affecting the coastal water quality. The Origin 2021 software was also used to perform linear regression analysis on nutrients and salinity (S) at a significant level (P < 0.05).
The spatial patterns of the TN and TP concentrations in the eight rivers of the PRE were significantly different (P < 0.05) (Figure 2). The concentrations of TN and TP in river E were found to be the highest among the eight rivers, and concentrations of TN and TP in river E were also found to be the highest for each season (Table S1). The concentration of TN in the river of the PRE ranged from 117.86 to 750.00 μmol/L, with the annual average concentration being 207.18 ± 105.13 μmol/L. The highest and lowest concentrations of TN appeared in March for river E and November for river H, respectively (Figure 2A). According to the Environmental Quality Standards for Surface Water of China (Table S2), the water qualities of all rivers entering the sea exceeded standard IV, and the water qualities observed at six river monitoring stations exceeded standard V, accounting for 75.0% of eight river monitoring stations entering the sea. The water quality of two river monitoring stations G and H was found to be between standard IV and V, with an average annual concentration of 142.50 and 137.08 μmol/L, respectively. Among the 12 months, the highest monthly average TN concentration was recorded in March in the PRE, while the lowest monthly average TN concentration was recorded in September, at 257.41±190.25 and 166.43±52.50 respectively, and the average TN concentration in each month exceeded the V standard (Figure 2B). The annual average concentration of TP was 3.51 ± 1.70 μmol/L, with concentrations ranging from 0.65 to 12.26 μmol/L. The highest and lowest concentrations of TP appeared in April for river E and in October for rivers G and H, respectively (Figure 2C). The water qualities of 87.5% of river monitoring stations was between standards I and II, with only one river monitoring station, E, having a higher average annual concentration than standard II. In the 12 months, the highest and lowest monthly average TP concentrations in the PRE occurred in March and January with 4.23 ± 1.40 and 2.90 ± 1.27 respectively, and the average TP concentration in the PRE in each month was between the I and II standards (Figure 2D).
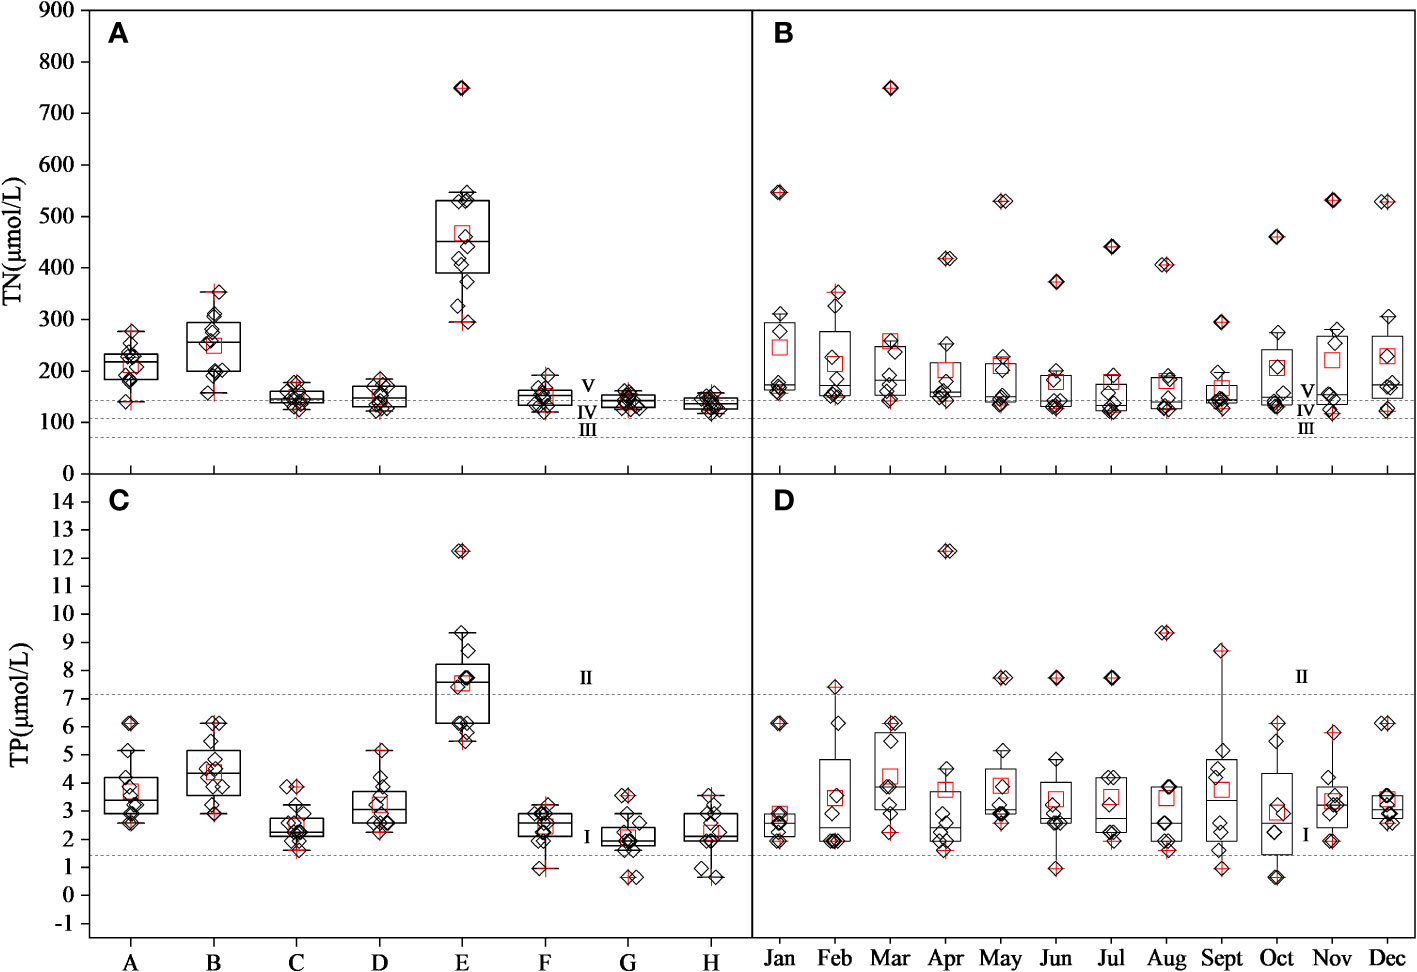
Figure 2 Spatiotemporal distribution patterns of TN (A, B) and TP (C, D) in rivers of the PRE from January to December. The black lines and red boxes, upper and lower edges, black lines, red crosses inside and outside the box and dotted lines represent the median and mean, 25th percentile and 75th percentile, < 99 the percentile and > 1th percentile, minimum and maximum values and water quality standard grades for all data, respectively.
The fluxes of TN and TP from the rivers entering the sea of the PRE had different spatial and temporal patterns (Figure 3). The annual fluxes of TN and TP pollutants discharged from the rivers into the coastal waters of the PRE were 8.61 × 10¹⁰ and 1.55 × 10⁹ mol/year, respectively (Table S3). The monthly TN and TP fluxes of the East, North, and West rivers entering the PRE exhibited similar temporal trends. The maximum monthly fluxes of TN and TP into the sea in the PRE were found to occur in July during the wet season, accounting for 17.8% and 20.1% of the annual fluxes, respectively. The minimum monthly fluxes of TN and TP into the sea occurred in November during the normal season, accounting for only 2.7% and 2.6% of the annual fluxes, respectively. In the 12 months, the maximum monthly flux of TN into the sea of the North River was found in June, whereas the maximum monthly flux of TN into the sea of the East and West rivers was found in July. In December, the monthly flux from TN of the East River into the sea was found to be the smallest, whereas the minimum monthly fluxes of the North and West rivers were found in November. The maximum monthly fluxes of TP into the sea from the three rivers occurred in July. The minimum monthly fluxes of TP from the East and North Rivers appeared in December, while the minimum monthly fluxes of TP for the West River appeared in October. In addition, the spatial flux patterns of TN and TP in the rivers entering the sea in the PRE were defined in this study (Figure 3). Among the three rivers entering the sea, the West River contributed the most to the annual flux of TN for the PRE, which was 3.70 × 10¹⁰ mol/year, accounting for 43.0% of the annual flux. The contributions of the North and West rivers to the annual flux of TP into the sea of the PRE were found to be similar, at 5.93 × 10⁸ and 5.92 × 10⁸ mol/year, both accounting for 38.3% of the annual flux of TP. East River had the smallest contribution to the sea flux of the PRE, contributing only 1.89 × 10¹⁰ mol TN and 3.63 × 10⁸ mol TP, with contribution rates of 22.0% and 23.4%, respectively.
Figure 3 Spatiotemporal fluxes and contribution patterns of TN and TP into major rivers (East, North, and West rivers) of the PRE.
The spatiotemporal distribution patterns of TN and TP concentrations in the coastal waters of the PRE were clarified by investigating the water quality of the coastal waters of the PRE in 2019 (Figures 4A, B). The seasonal variation in TN concentration was not found to be significant (P > 0.05), and the spatial distributions of TN and TP concentrations in the PRE were significantly different (Figure 4). The annual average concentration of TN in the PRE was 70.64 ± 10.10 μmol/L, with the concentration ranging from 2.73 to 191.00 μmol/L. In all three seasons, the concentration was high in the middle of the wet season and low in the dry and normal seasons. During the dry season, the average concentration of TN was 67.86 ± 35.87 μmol/L, which fluctuated from 8.14 to 119.29 μmol/L. TN concentrations fluctuated between 2.73 and 191.00 μmol/L during the wet season, with an average of 84.16 ± 47.04 μmol/L. The TN concentration in the normal season ranged between 8.54 and 125.57 μmol/L, with the average concentration being 59.89 ± 36.34 μmol/L. In all three seasons and year, the distribution of TN concentration was characterised as Zone I > Zone II > Zone III, while the TN concentration near the S2 monitoring station of Zone I was lower than Zone II during the dry season (Figure 4A). The concentration of TN in the PRE was generally higher in the estuary and coastal waters, gradually decreasing from the estuary to the open ocean.
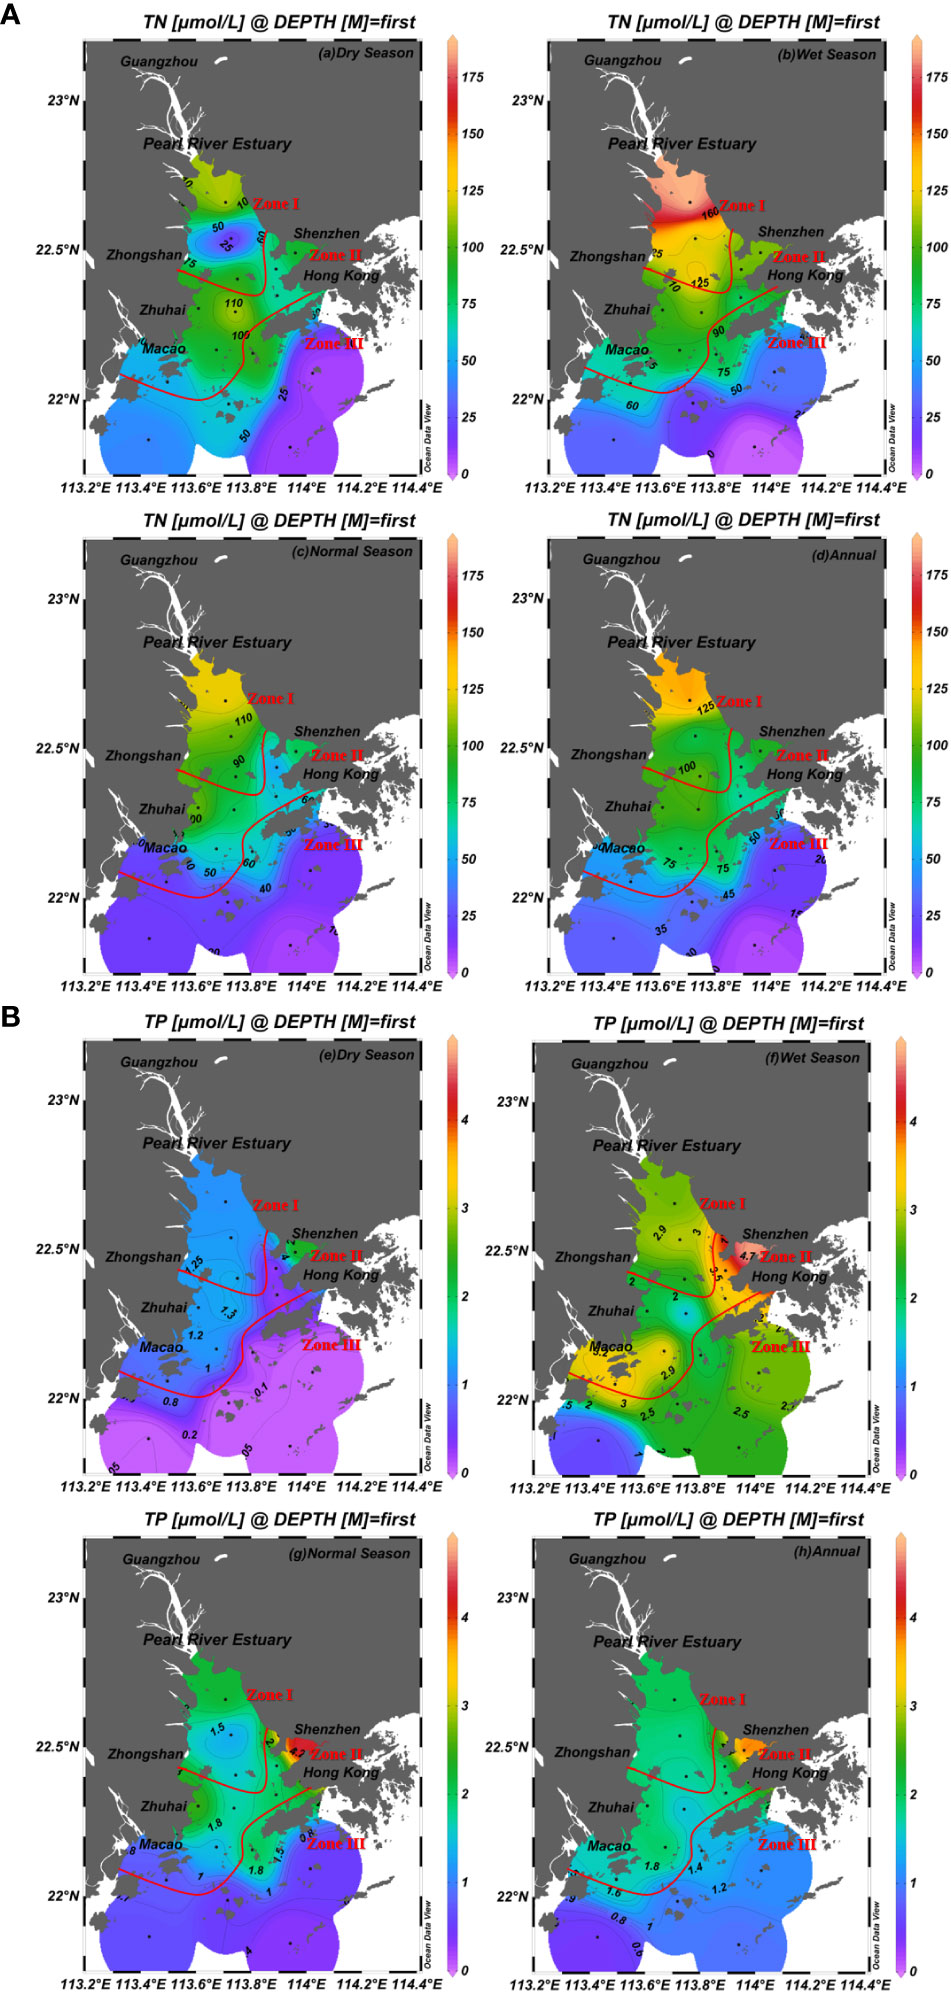
Figure 4 Spatiotemporal pattern of TN (A) and TP (B) in the PRE.
The variation in TP concentration was found to be significant in the three seasons (P < 0.01). The annual average concentration of TP in the PRE was 1.67 ± 0.78 μmol/L, with the concentration varying between 0.045 and 4.84 μmol/L. Among the three seasons, the TP concentration in the PRE during the wet season was higher than that during the dry season, normal seasons, and the TP concentration in the dry season was the lowest. The average TP concentration was 0.77 ± 0.73μmol/L, and it varied from 0.045 to 2.56 μmol/L during the dry season in the PRE. TP concentration in PRE fluctuated from 0.32 to 4.55 μmol/L in the normal season, with an average of 1.58 ± 1.04 μmol/L. TP concentration ranged from 0.60 to 4.84 μmol/L, with an average of 2.68 ± 0.95 μmol/L in the wet season. During the dry season, normal season, the distribution of TP concentration was characterized as Zone I > Zone II > Zone III, while the concentration of TP was relatively high near the S3 monitoring station in Shenzhen Bay. In the wet season, the distribution of TP concentrations is characterised by Zone II > Zone I > Zone III, with higher TP concentrations were found in coastal waters of Shenzhen Bay and Macau of Zone II, especially at the S3 monitoring station near Shenzhen Bay where TP concentrations was at their highest. Overall, the TP concentration in the PRE decreased from the estuary to the open ocean.
The spatial distribution of DIN and DIP concentrations in the PRE was significantly different (Figures 5A, B). The annual average concentration of DIN in the PRE was 60.98 ± 13.88 μmol/L, with concentration ranged from 1.47 to 178.41 μmol/L. In all seasons, the concentration of DIN in the PRE was higher during the wet season than during the dry and normal seasons. The average DIN concentration in the PRE during the dry season was 55.86 ± 33.40 μmol/L, with the concentration varied between 1.47 and 99.06 μmol/L. During the wet season, the concentration of DIN in the PRE fluctuated from 2.71 to 178.41 μmol/L, with the average concentration of 79.94 ± 44.57 μmol/L. While in the normal season, the concentration of DIN ranged from 3.17 to 121.11 μmol/L, with the average concentration of 47.13 ± 33.13 μmol/L. In the three seasons and year, the spatial distribution of DIN concentrations was characterised by Zone I > Zone II > Zone III.
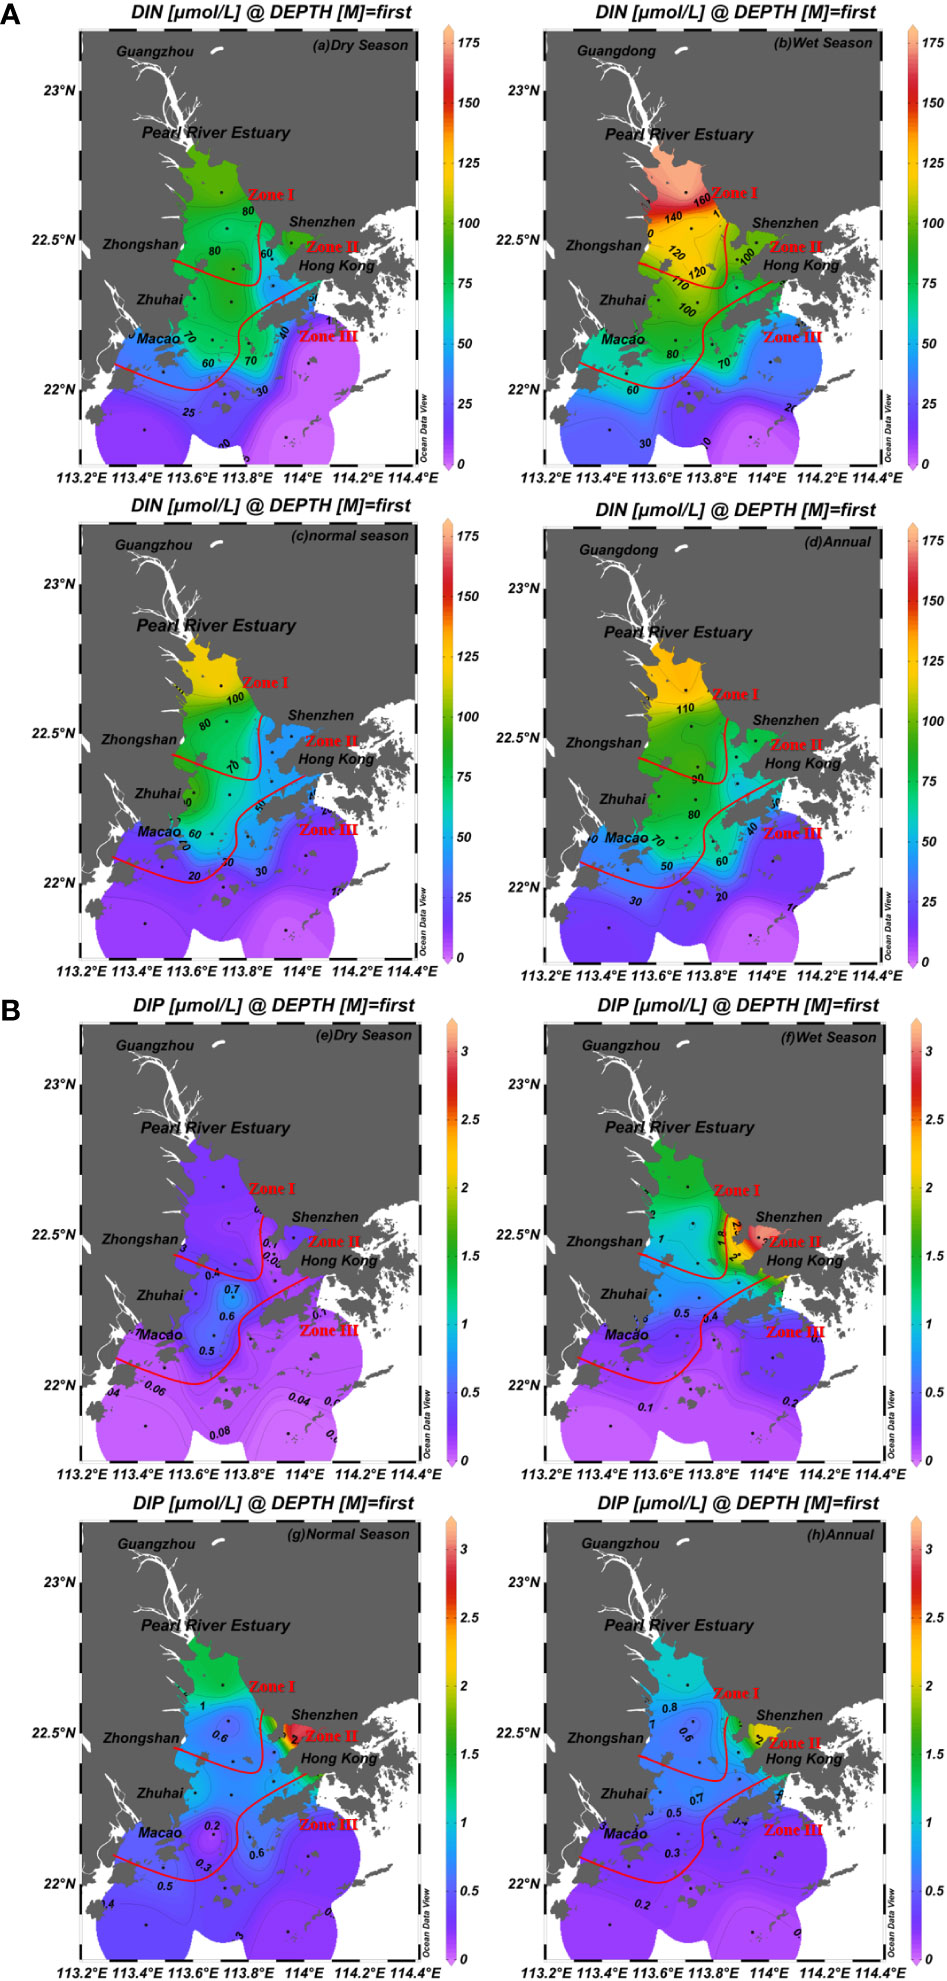
Figure 5 Spatiotemporal pattern of DIN (A) and DIP (B) in the PRE.Spatiotemporal variation in TN/TP in the PRE.
The average annual concentration of DIP in the PRE was 0.59 ± 0.26 μmol/L, and the concentration varied between 0.016 and 3.16 μmol/L. In all three seasons, the DIP concentrations in the PRE were higher during the wet and normal season than during the dry season, with the lowest DIP concentrations during the dry season. The average concentration of DIP during the dry season was 0.22 ± 0.22 μmol/L, with concentrations fluctuating between 0.016 and 0.84 μmol/L. During the wet season, the concentration of DIP fluctuated from 0.048 to 3.16 μmol/L with an average concentration of 0.80 ± 0.86 μmol/L. In normal season, the DIP concentration ranged from 0.097 to 3.16 μmol/L, with the average concentration being 0.74 ± 0.72 μmol/L. In the wet season, normal season and year, the spatial distribution of DIP concentration was characterized as Zone I > Zone II > Zone III, while the distribution of DIP concentration in the dry season was characterized as Zone II > Zone I > Zone III. The highest DIP concentrations were found near monitoring station S3 in Zone II during each season. In summary, the concentration distribution of DIN and DIP in the PRE was characterised by the decreasing trends from the estuary to the coastal water.
The spatial variation of TN/TP in the PRE in different seasons was shown (Figure 6). In dry and wet seasons, only the TN/TP ratio of river was significantly different from those of seawater (P < 0.05). In the annual, the TN/TP ratios of rivers, freshwater and mixed zones were all significantly different from those of seawater (P < 0.01, P < 0.05). Regarding the average annual TN/TP ratio of PRE, the seawater zone (330.94 ± 434.71) was significantly higher than the river (59.31 ± 5.98), freshwater zone (59.45 ± 3.75) and mixed zone (45.73 ± 21.27). The TN/TP ratios were significantly higher in seawater zone (945.66 ± 728.89) than in the river (53.55 ± 7.95), freshwater zone (61.61 ± 38.73), and mixed zone(75.79 ± 288.89) during the dry season. The TN/TP ratios were higher in the river (51.96 ± 12.72) and freshwater zone (54.17 ± 12.08) than in mixed zone (29.96 ± 18.85) and seawater zone (16.48 ± 19.65) during the wet season. In the normal season, the TN/TP ratios were higher in the river (69.73 ± 62.05) and freshwater zone(62.56 ± 11.40) than in mixed zone (31.43 ± 9.59) and seawater zone (30.69 ± 5.55). Except for the TN/TP ratio of seawater zone(16.48), which was close to 16 during the wet season, the TN/TP ratios of different regions in all seasons were significantly higher than the Redfield ratio, with the highest ratio (945.66) observed in seawater zone during the dry season (Redfield et al., 1963). In general, the spatial trends of TN/TP in the different seasons of the PRE were approximately the same. The spatial regional variation of TN/TP ratio in the wet and normal seasons decreased from the river to seawater zone. TN/TP in the spatial area during the dry season and annual increased from the river to seawater zone.
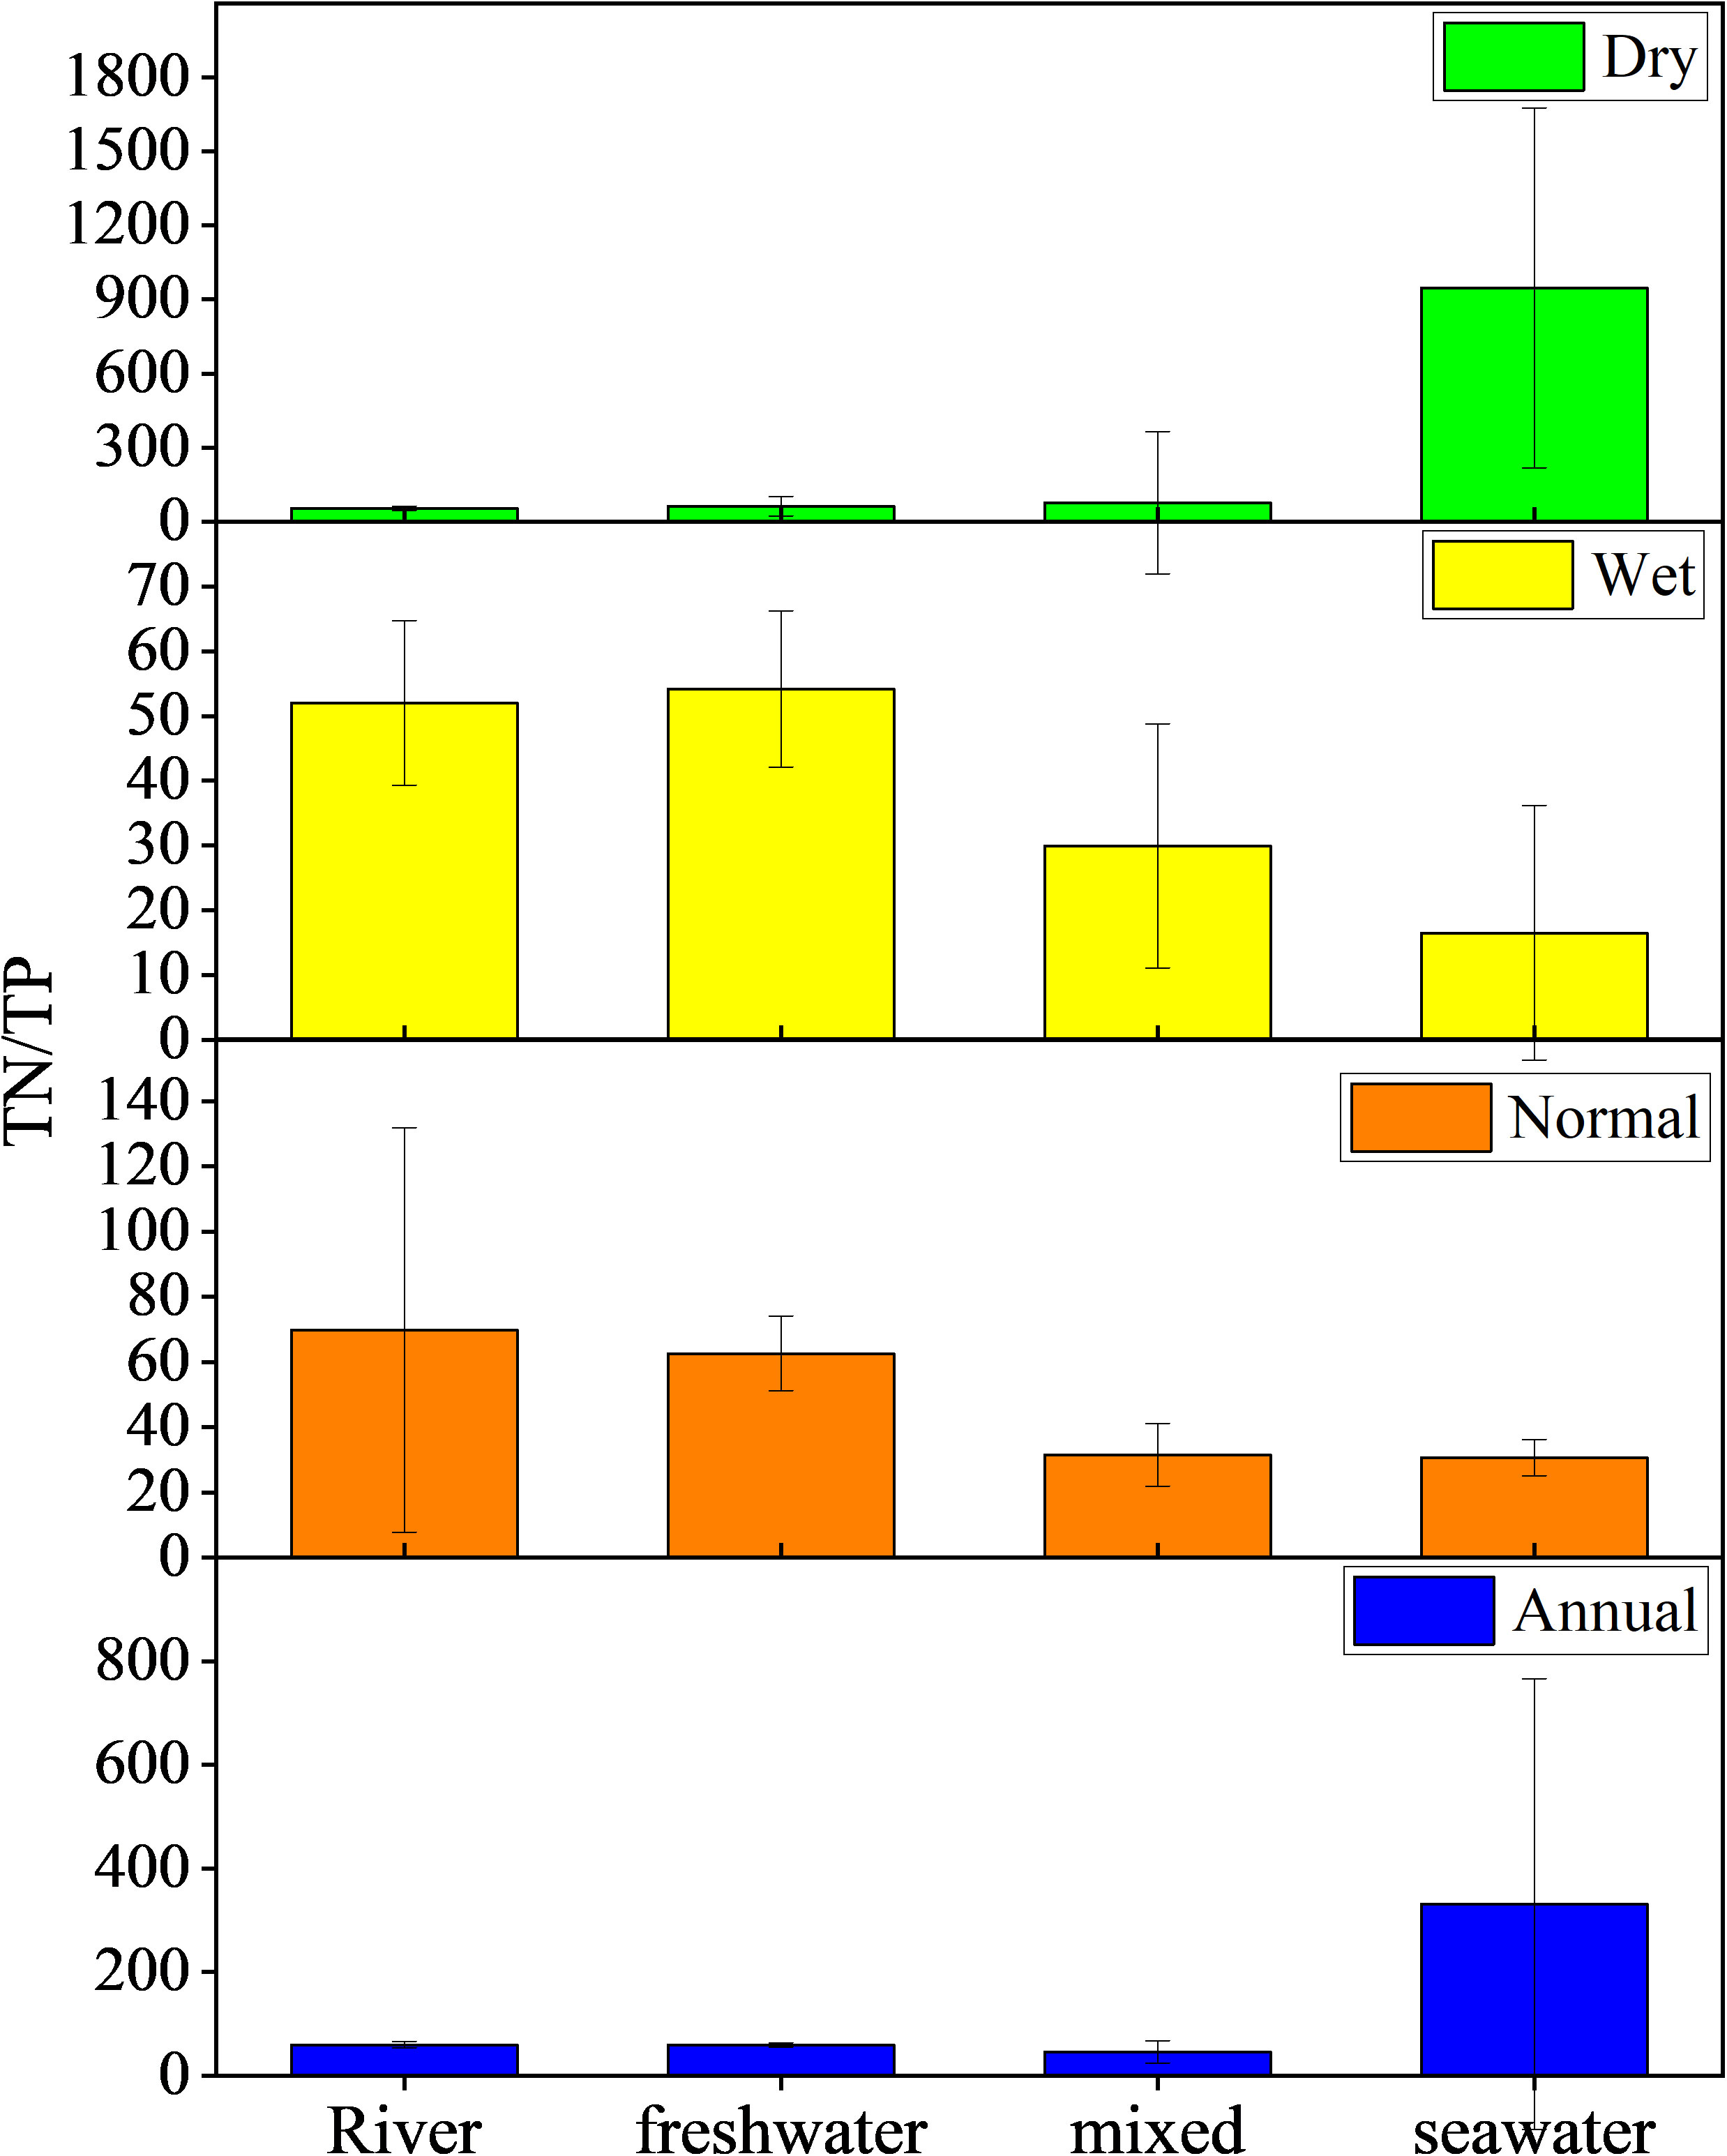
Figure 6 Spatiotemporal variation in TN/TP in the PRE.
The S of seawater, like temperature and pressure, is a basic parameter for studying the physical and chemical processes of seawater and has an impact on the changes in its biogeochemical properties, such as nutrient distribution and primary production (Bharathi et al., 2022; Howarth et al., 2011). The variations of TN and TP concentrations significantly decreased with increasing S in the PRE (Figure 7). Significant negative correlations were observed between TN concentration and S in the three seasons and year (R2 = 0.926, 0.870, 0.648 and 0.619, P < 0.05, respectively), which implied that TN showed conservative behaviours in all seasons. In addition, the TP concentrations were negatively correlated with S only during the dry season (R2 = 0.321; P < 0.05). However, there were no significant correlation between TP concentrations and S in the wet season normal season annual (P > 0.05). It dedicated that the TP behaved conservative only in dry seasons.
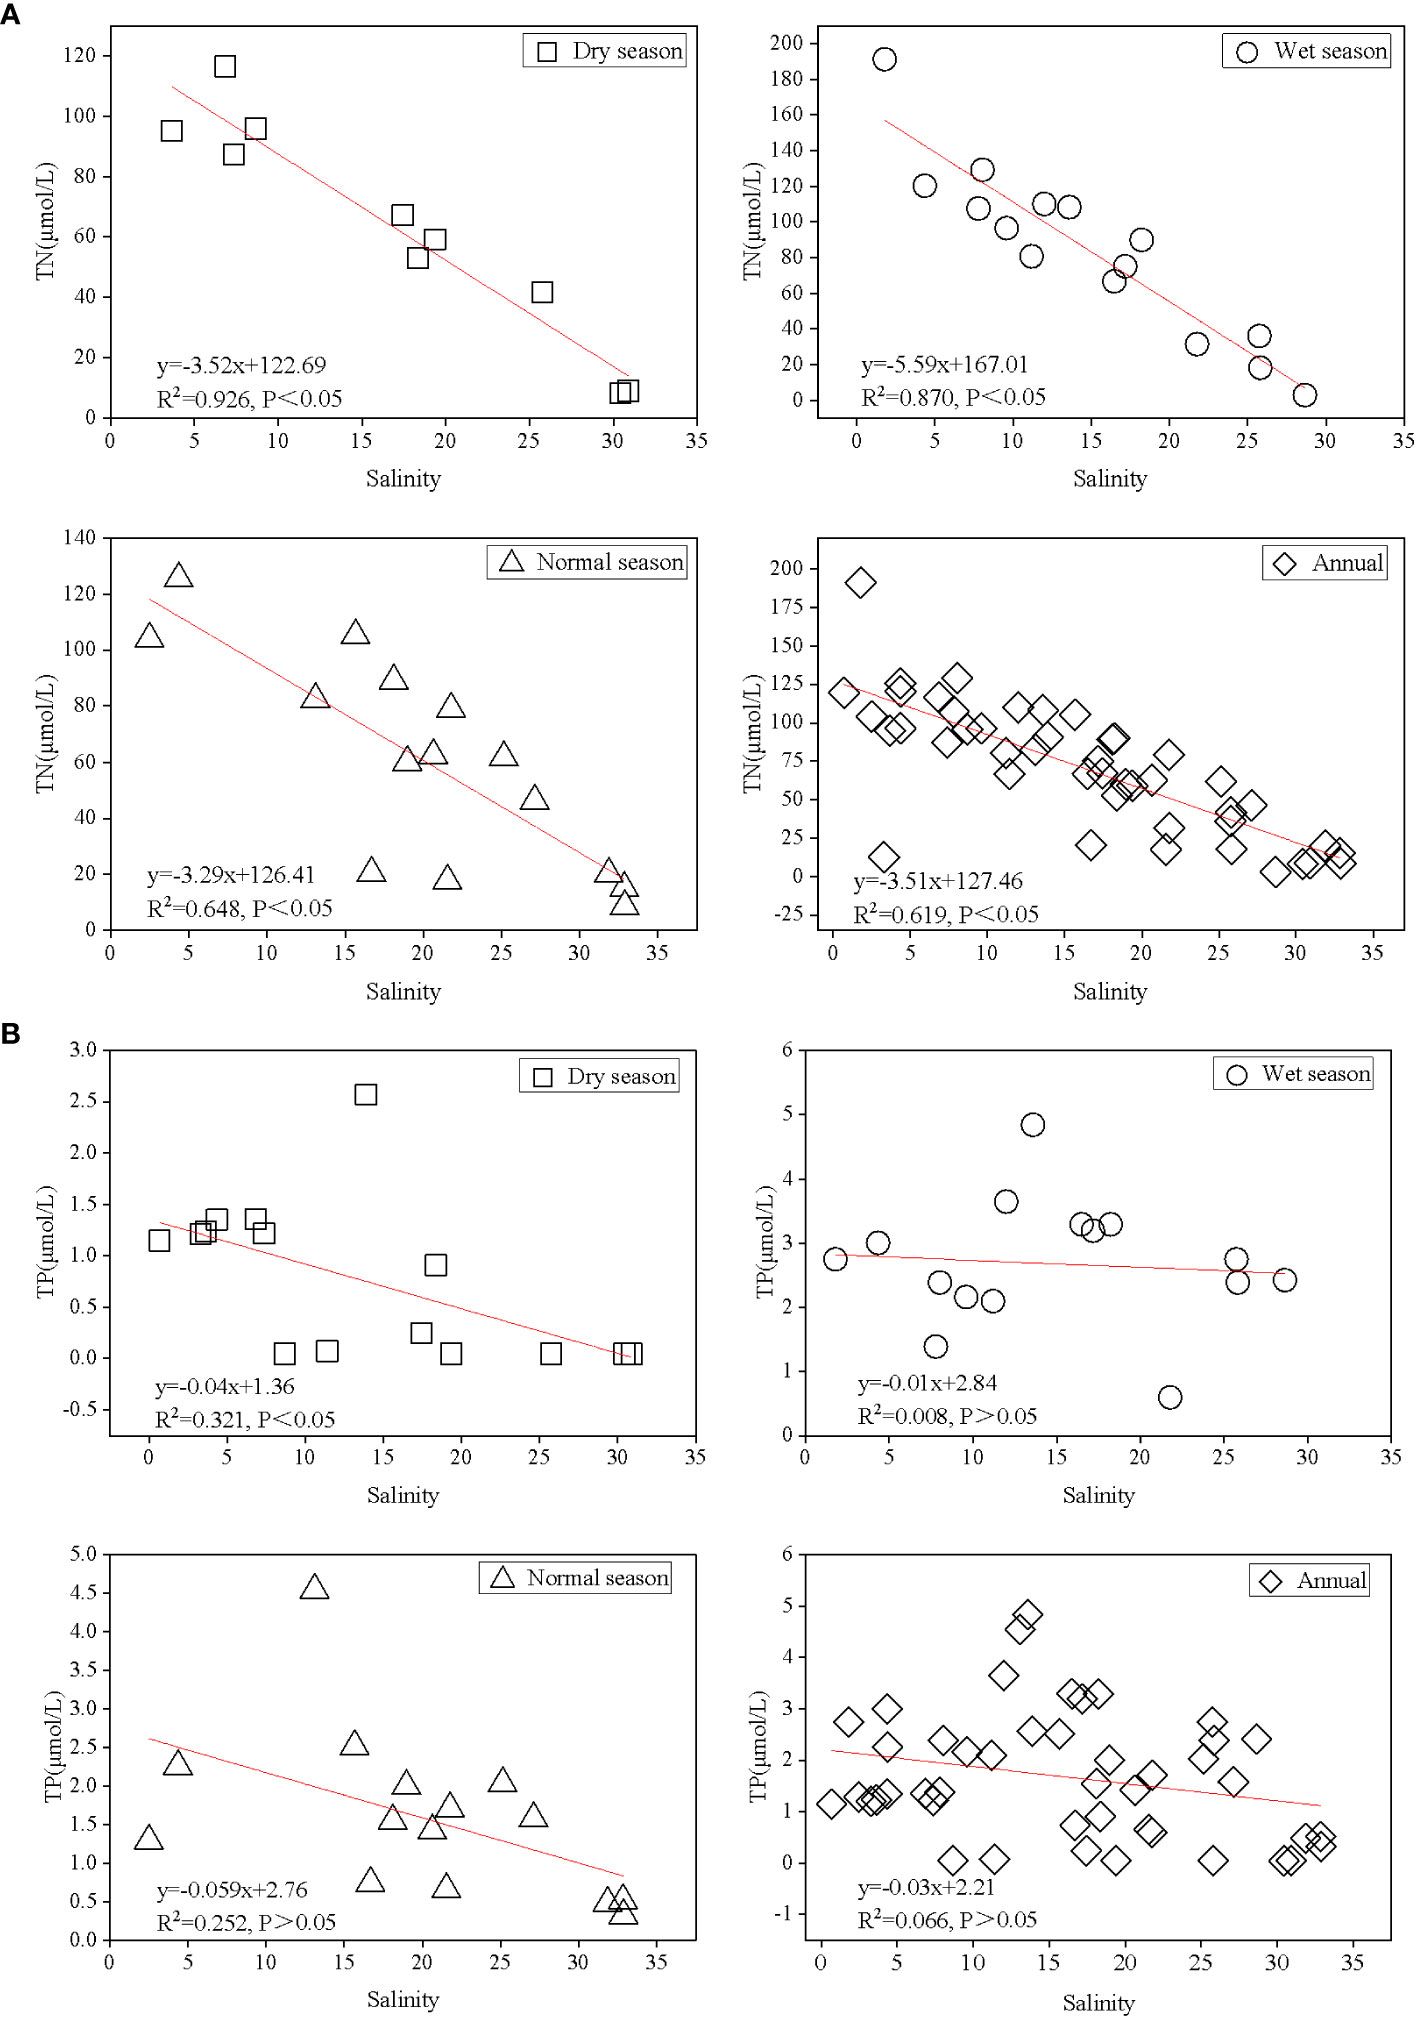
Figure 7 Linear regression analysis of TN (A) and TP (B) concentrations and salinity in the PRE.
In comparison with the previous investigation in the rivers of PRE from 2005 to 2006, the TN concentration increased from 164.40 μmol/L to 207.18μmol/L, and TP concentration increased from 3.20 μmol/L to 3.51 μmol/L (Lu et al., 2009). Therefore, the increasing speed of TN concertation increased more faster than the TP in the riverine nutrient’s sources input. In addition, the TN, TP, DIN, and DIP concentrations in the PRE and most estuaries and bays were shown (Table 2). The TN, TP, DIN, and DIP concentrations of the seawater observed in this study were approximately comparable to those found in most estuaries and bays (Table 2). the average concentrations of TN, TP, DIN, and DIP in the PRE were lower than those in the Daliao River estuary, Jiulong River estuary, Yangtze River estuary, and adjacent sea areas, and higher than those in the Yellow River estuary, Dongshan Bay (Guo et al., 2012; Hu et al., 2016; Jiang et al., 2016; Wang et al., 2016; Zhang et al., 2016). The high nitrogen and phosphorus nutrient in the seawater along the PRE may have been influenced by the output of a large amount of nutrients in the Pearl River Basin. Alternatively, they may have been influenced by human sewage discharge, especially the industrial, agricultural, and domestic sewage discharge of coastal cities, such as Guangzhou, Shenzhen, and Zhuhai (Tang et al., 1996; Dong and Huang, 2021; Ke et al., 2022). As per the Seawater Quality Standard of China (GB3007-1997), the DIN concentrations at most monitoring stations in the PRE exceeded the national fourth-class seawater standards, and DIP concentrations reached the national second-class seawater standards (Table S2). This indicated that the water bodies along the PRE were significantly polluted with nutrients (Zhang et al., 2015; Zeng et al., 2020). This may be due to the frequent human activities occurring in the economically developed areas of the Pearl River Delta. These activities include forestry cultivation, farmland cultivation, livestock breeding, aquaculture, residential life, and industrial production, which generate large amounts of nitrogen nutrients that are discharged into the coastal waters with rivers, thus leading to high exceedances of DIN concentrations and high TN concentrations in seawater in most areas of the PRE (Dong and Huang, 2021; Liu, 2006; Lu et al., 2009). In terms of nutrient composition, the annual average ratio of TN/TP of seawater in the PRE was greater than that of the Dongshan Bay, and the annual average ratio of DIN/DIP was lower than that of the Daliao River estuary but greater than that of the Dongshan Bay (Zhang et al., 2015; Jiang et al., 2016). The high DIN/DIP ratios mainly occurred in the coastal waters. A high DIN/DIP ratio in seawater will affect the composition of marine biological communities, limit the growth of phytoplankton, and destroy the balance of the marine ecosystem (Wei et al., 2019; Zhang et al., 2020a). However, the ratios of TN/TP and DIN/DIP in the seawater along the PRE examined in this study were significantly higher than the Redfield ratio, and all three seasons showed the characteristics of nutrients unbalance, which was caused by the relatively high concentrations of TN and DIN in the seawater relative to TP and DIP. This may be because the flux of TN into the sea of the PRE was significantly larger than that of TP (Figure 3). The TN/TP ratio of seawater was higher in the dry and normal seasons than in the wet seasons (Figure 6). This may be related to the flux of nutrient inputs from the river, and in these two seasons, the seawater temperature is low, the light duration is short, the growth rate of marine phytoplankton is not fast, and the consumption of nutrients in the seawater is not sufficiently high (Zhang et al., 2021). On one hand, the different mixed behaviour of TN and TP from rivers input may lead to the lower TN/TP ratio in seawater, which was caused by the TN concentration decreased faster than the TP during the transport and biogeochemical process. On the other hand, in summer, the daytime is long, sunlight is sufficient, the temperature is high, the growth rate of phytoplankton in the ocean is high, and more nutrients are consumed, which reduces the TN/TP ratio of seawater (Zhang et al., 2021).
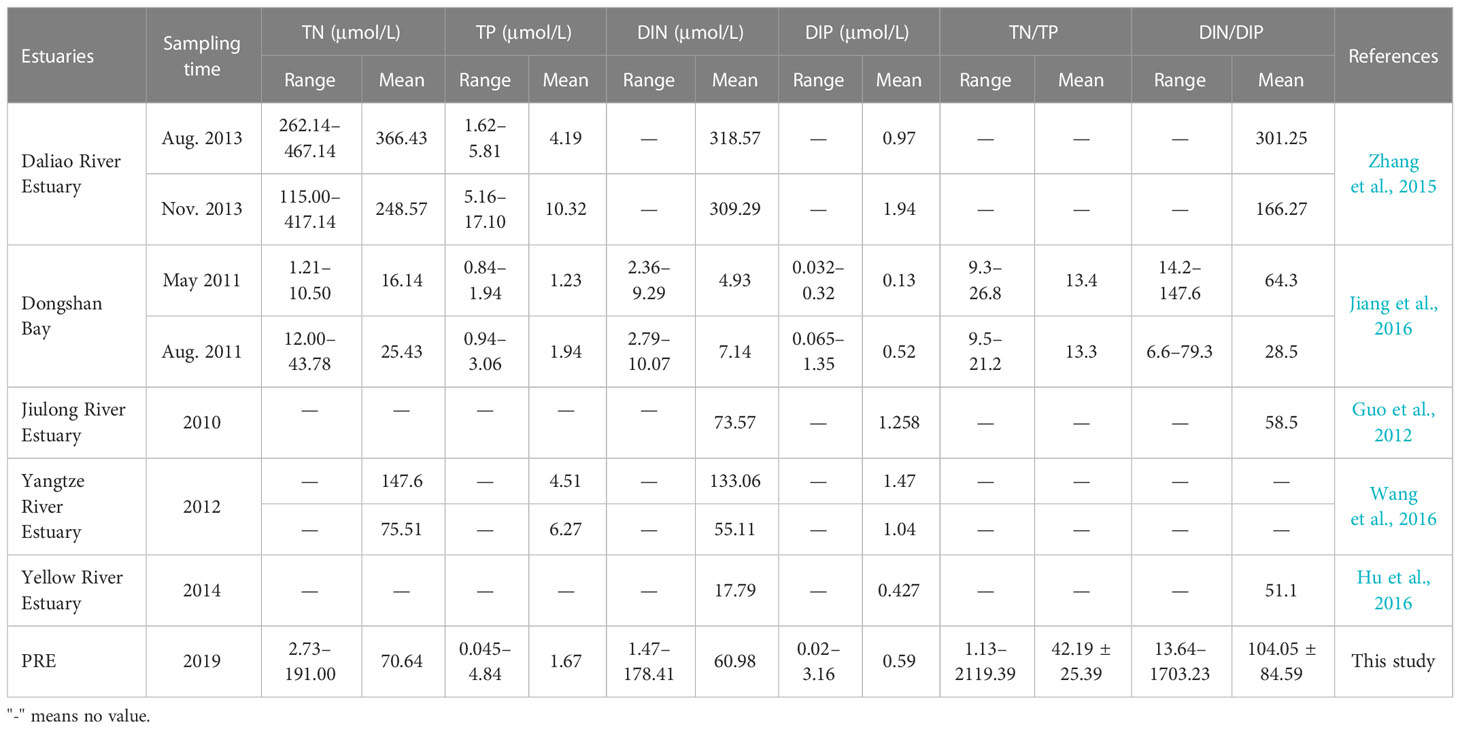
Table 2 Comparison of nutrient concentrations, TN/TP, and DIN/DIP in the PRE with other estuaries and bays of China.
The discharge of municipal sewage and industrial wastewater, livestock breeding, and excessive use of agricultural fertiliser in the Pearl River Delta are the main reasons for the high concentrations of TN and TP in the estuary (Huang et al., 2010; Tan et al., 2014; Tang et al., 2018). As per the Surface Water Environmental Quality Standard, TN concentrations at six of the eight estuary monitoring stations exceeded the national class V surface water quality standard, and TN concentrations in the remaining two estuaries also exceeded the national class IV surface water quality standard. The TP concentrations of most monitored estuaries reached the national class II surface water quality standard, and only one monitored estuary of Shenzhen river exceeded the national class II surface water quality standard (Figure 2). This indicated that nitrogen and phosphorus nutrient pollution were prevalent in the PRE, particularly when nitrogen nutrient content was significantly exceeded and nitrogen pollution was extremely high. TN and TP in the estuary flow into the ocean along with the river, which may be the key factor leading to the high concentrations of TN and TP in the coastal waters of the PRE and creating prominent nitrogen pollution problems (Niu et al., 2020a). In addition, compared to the TN concentrations, TP concentrations in the estuary of the PRE were relatively lower, which may be one of the reasons for the nutrients unbalance in the coastal waters of the PRE (Shi et al., 2019; Niu et al., 2020). Human activities play an important role in coastal water pollution. Shenzhen River flowed through densely populated and industrially developed Shenzhen, bringing a large amount of industrial and domestic sewage with high nutrient content, which resulted in high concentrations of TN and TP in the water near Shenzhen river estuary (Xie et al., 2017). The PRE gets its water from the Pearl River, which is fed by the East, West, North, and many smaller rivers. It flows through Yunnan, Guangxi, Hunan, Guangdong, and six other provinces of China (Ke et al., 2022), carrying a large number of nutrients produced by human life, farmland planting, livestock and poultry breeding, and other activities into the coastal waters of the PRE. It contributes many terrigenous nutrients to the coastal waters of the PRE (Wu et al., 2019). In addition, industrial wastewater and domestic sewage from coastal cities of the Pearl River Delta, as well as mariculture, also significantly contribute to the excess nitrogen and phosphorus nutrients in coastal waters of the PRE (Yao and Chen, 2021).
According the spearman correlation analysis, the factors affecting TN and TP concentrations in the coastal waters of the PRE showed obvious seasonal variation (Table 3). Table 3 shows that TN and S in the coastal waters of the PRE were significantly negatively correlated in dry season, wet season, normal season and annual (P < 0.01). This indicated that the factors affecting the spatial variation of TN concentrations in seawater may be the freshwater input from rivers and nearshore water dynamics (Li et al., 2017; Ma and Zhao, 2021; Ke et al., 2022). A significant negative correlation was observed between TP and S in the dry and normal seasons (P < 0.01 and < 0.05, respectively), indicating that TP concentration in the PRE was mainly affected by river nutrient inputs. However, no significant correlation was observed between TP and S during the wet season and annual. This could be because P is the limiting element in the PRE, and phytoplankton growth and absorption, biological activities, and biological assimilation consumes large amounts of DIP (Wu et al., 2016; Zhang et al., 2020a). Another reason could be the dilution of freshwater inputs to the rivers or the adsorption of P by suspended solids in the estuaries during the wet seasons (Lu et al., 2009; Slomp, 2011; Li et al., 2017), resulting in the non-conservative behaviour of TP in the coastal waters of the PRE. TN and TP concentrations were positively correlated in the dry season, normal season and annual (P < 0.05 and <0.01, respectively) (Table 3), indicating that TN and TP in the PRE had the same source and similar biological cycles (Yuan et al., 2018; Zhang et al., 2020a). However, no significant correlation was observed between the TN and TP concentrations in the wet season, indicating that the source of TP may be different from that of TN. DIN, NO3–-N and NO2–-N were positively correlated with TN concentrations (P < 0.01). This indicated that DIN was the main form of nitrogen found in the coastal waters of the PRE and that NO3–-N and NO2–-N were also important components of TN. TP was positively correlated with DIP (P < 0.01 and < 0.05), indicating that the main form of phosphorus in the PRE seawater was DIP. TN was positively correlated with DIP (P < 0.01 and < 0.05). Except the wet season, TP was significantly and positively correlated with DIN, NO3–-N and NO2–-N concentrations in other seasons and annual (P < 0.01 and < 0.05).
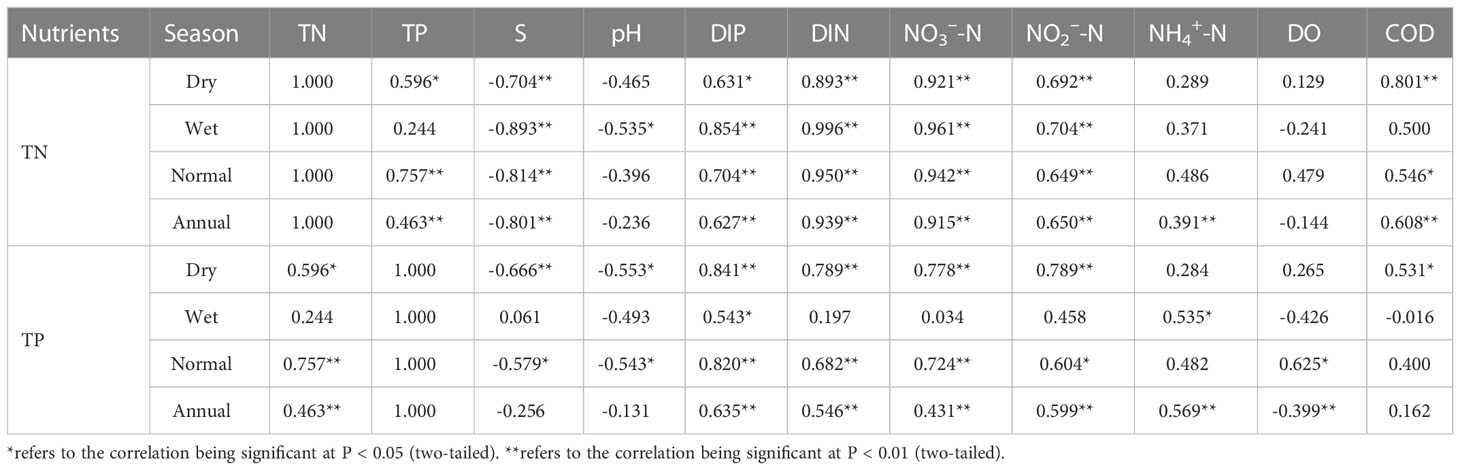
Table 3 Spearman correlation relationships between TN and TP and environmental factors in the PRE.
Spatiotemporal differences in the nutrient distribution of the coastal waters of the PRE were related to seasonal changes and human activities. TN and TP concentrations in the estuary and TN and TP fluxes in the PRE were both highest in the wet season when the annual rainfall was the highest (Figure 3). At this time, TN and TP concentrations in the coastal waters of the PRE were the highest for the entire year (Figure 4), which were 84.16 ± 47.04 and 2.68 ± 0.95μmol/L, respectively. In the dry and normal seasons, TN and TP concentrations and fluxes from the rivers of the PRE to the sea were relatively low, as were the TN and TP concentrations in the coastal waters of the PRE. It can be seen that the nutrient concentrations in the coastal waters of the PRE were mainly related to the fluxes of TN and TP in the rivers. This indicated that nutrient concentrations in the coastal waters of the PRE were generally affected by the input of wastewater from terrestrial rivers, such as wastewater from human life and agricultural production activities (Yao and Chen, 2021; Ke et al., 2022). In addition, during the wet season, a high rainfall will bring the nitrogen and phosphorus fertilisers into the coastal area of the river basin and into the sea, which is also the reason for the high concentrations of TN and TP in the coastal waters of the PRE (Xu, 2003; Li et al., 2017; Ke et al., 2022). The effects of human activities on the nutrient distribution characteristics of coastal water bodies cannot be ignored. First, the excessive application of agricultural fertilisers and livestock breeding in the Pearl River Basin produces a large number of pollutants in the basin, which contributes significantly to the TN and TP fluxes of the PRE into the sea (Jia et al., 2002; Lin et al., 2004). Second, Dongguan, Guangzhou, Shenzhen, and other coastal cities were economically developed and densely populated cities of the Pearl River Delta, and the concentrations of TN and TP in estuaries A, B, D, and E of these coastal cities were relatively high (Figure 2). The TN and TP fluxes may also be influenced by the discharge of municipal sewage, industrial wastewater, and coastal aquaculture wastewater (Dai et al., 2009; Xie et al., 2017). In addition, atmospheric deposition and submarine groundwater discharge are also sources of seawater nutrients, which may also impact the concentrations of TN and TP in the coastal waters of the PRE (Wang et al., 2021).
Coastal water pollution in China is mainly caused by land-based pollutants, and TN and TP carried by rivers into the sea are the main sources of the presence of nitrogen and phosphorus nutrients in coastal waters (Dai et al., 2019). Since the reform and opening up, the economy of the Pearl River Delta region has been rapidly developing, and the input flux of pollutants from land-based sources in the watershed has annually increased the pollution of seawater near the PRE (Tang et al., 1996). According to the Bulletin on the State of China’s Marine Ecological Environment, in 2021, the seawater quality in the PRE was categorised as poor category four, and the nitrogen nutrients in the seawater were found to significantly exceed the standard. Additionally, the PRE was listed as one of the three major areas in the “14th five-year plan” for the comprehensive management of key national waters (Ministry of Ecology and Environment of PRC, 2022a; Department of Ecological Environment in Guangdong Province, 2022). Therefore, to improve the water pollution situation of the coastal waters of the PRE, monitoring the nitrogen and phosphorus discharges from rivers entering the sea and taking corresponding measures to reduce nitrogen pollutant discharges from land-based rivers at the source are key measures to take (Dong and Huang, 2021; Huang et al., 2021). First, we should conduct simultaneous and long-term monitoring of nutrient input and seawater quality in the PRE, connect the improvement of coastal water quality with the reduction in nutrient input flux from land-based sources, strengthen the control of total pollutant load from land-based sources in the watershed for coastal areas with high TN and TP concentrations, and reduce the nutrient discharge of nitrogen and phosphorus from land-based rivers (Zhang et al., 2020b; Zhang et al., 2020c). Second, in areas with high TN and TP concentrations, such as estuaries and waters near coastal cities, the discharge of human domestic sewage, industrial sewage, and aquaculture sewage from coastal cities must be considered, and effective measures, such as establishing sewage treatment plants, creating estuarine protection zones, reconstructing coastal wetland, and cleaning-up sediment, should be taken to reduce land-source nitrogen and phosphorus nutrients for reducing land-source river pollutants (Li et al., 2018; Yu et al., 2020; Zhang et al., 2020c; Dong and Huang, 2021). In addition, for monitoring and managing TN and TP fluxes in the land-source rivers of the PRE, monitoring the nutrient input fluxes of the West River and North River is critical because the larger contribution of seawater TN and TP in the PRE was made by the West River and North River tributaries of the Pearl River Basin. As per the Environmental Quality Standard for Surface Water and the Standard for Seawater Quality, the monitoring index of nutrients in the rivers entering the sea and the testing index of seawater were inconsistent, and monitoring and evaluating the water quality conditions of estuarine areas where freshwater and seawater are mixed is not effective. To improve the coastal water quality of the PRE and respond to the national goal of building a beautiful bay and improving the quality of the marine ecological environment in the “14th five-year plan”, integrated nutrient monitoring standards for land and sea should be established to realise the input of nitrogen and phosphorus nutrients from land-based rivers and comprehensive management of seawater pollution (Department of Ecology and Environment of Guangdong Province, 2022; Ministry of Ecology and Environment of PRC, 2022b; Zhang et al., 2020b). Integrated land- sea monitoring standards connect coastal water quality with total river nitrogen and phosphorus pollutant control, thus, providing a scientific basis for the detection, evaluation, and management of estuarine nutrient salts, which is conducive to strengthening the control of nutrient fluxes from land-based rivers and reducing the discharge of river nitrogen and phosphorus nutrients into the sea.
In summary, this study mainly examined the concentrations, fluxes, and spatiotemporal distributions of TN and TP in the river estuaries and seawater of the PRE in 2019, revealing the response of TN and TP in the PRE to the spatiotemporal fluxes of TN and TP in river. The spatial patterns of TN and TP concentrations in the PRE river estuaries revealed that these were significantly varied at different times. The annual average concentrations of TN and TP were 207.18 ± 105.13 and 3.51 ± 1.70μmol/L, respectively. The annual TN and TP fluxes of the pollutants discharged into coastal waters were 8.61 × 10¹⁰ and 1.55 × 10⁹ mol/year, respectively. The main factor affecting the TN and TP fluxes of the rivers entering the sea was the seasonal river freshwater flux. During the wet season, the river input fluxes were significantly higher than those during the dry and normal seasons. In addition, the responses of TN and TP in the coastal waters of the PRE to TN and TP input from the rivers to the sea were different. The concentrations of TN and TP were the highest in the wet season and relatively lower in the dry and normal seasons. These results indicated that TN and TP concentrations in the surface seawater of the PRE were mainly affected by the input of the terrigenous rivers. Furthermore, the coastal hydrodynamic process influenced the seasonal variation in the seawater nutrients of the PRE. TN showed conservative behaviour in each season, and TP showed conservative behaviour in the dry season. The concentrations of TN in most rivers reaching the sea exceeded the national surface water standard of Grade 5, and the concentrations of TP reached the national surface water standard of Grade 2. DIN at most monitoring stations exceeded the national seawater standard of Grade 4, while the DIP concentration met the national seawater standard of Grade 2. These results indicated that the water nutrients in the coastal waters of the PRE were mainly affected by the input of terrigenous river nutrients, and the eutrophication of the PRE estuary and seawater was prominent, especially when N nutrient concentration significantly exceeded. Overall, the nitrogen concentration in the PRE coastal water was relatively higher than that of phosphorus, showing the characteristics of nutrients unbalance. These findings are useful for effectively controlling water pollution from river discharge into the estuary and coastal waters.
The original contributions presented in the study are included in the article/Supplementary Material. Further inquiries can be directed to the corresponding author.
Conceptualization: PZ. Methodology: PZ and SK. Software: ZC. Validation: ZC, JXZ, and JBZ. Formal analysis: ZC, PZ and SK. Writing-original draft preparation: PZ, SK and ZC. Writing review and editing: PZ, SK and ZC. Visualization: PZ and JBZ. Supervision: PZ and JBZ. Project management: PZ and JXZ. Funding acquisition: PZ and JBZ. All listed authors made substantial, direct, and intellectual contributions to the work and are approved for publication.
This research was financially supported by Research and Development Projects in Key Areas of Guangdong Province (2020B1111020004); Key Laboratory of Marine Environmental Survey Technology and Application, Ministry of Natural Resource, P.R. China (MESTA-2020-B014); the Guangdong Basic and Applied Basic Research Foundation (2020A1515110483); Guangdong Ocean University Fund Project (R18021); Guangxi Key Research and Development Program (GuiKeAB22035065), First-class Special Fund (231419018); Innovation Strong School Project of Guangdong Ocean University (230420021).
Thanks for the financial support provided by the Research and Development Projects in Key Areas of Guangdong Province (2020B1111020004); Key Laboratory of Marine Environmental Survey Technology and Application, Ministry of Natural Resource, P.R. China (MESTA-2020-B014); the Guangdong Basic and Applied Basic Research Foundation (2020A1515110483); Guangxi Key Research and Development Program (GuiKeAB22035065), Guangdong Ocean University Fund Project (R18021); Science and Technology Special Project of Zhanjiang City (2019B01081); First-class Special Fund (231419018); Innovation Strong School Project (230420021) of Guangdong Ocean University. Special thanks to Dr. Qian Zhang from University of Maryland Center for Environmental Science and reviewers for their careful review and constructive suggestions. Thanks to all members of the research team and others involved in this study.
The authors declare that the research was conducted in the absence of any commercial or financial relationships that could be construed as a potential conflict of interest.
All claims expressed in this article are solely those of the authors and do not necessarily represent those of their affiliated organizations, or those of the publisher, the editors and the reviewers. Any product that may be evaluated in this article, or claim that may be made by its manufacturer, is not guaranteed or endorsed by the publisher.
The Supplementary Material for this article can be found online at: https://www.frontiersin.org/articles/10.3389/fmars.2023.1129712/full#supplementary-material
Bharathi M. D., Venkataramana V., Sarma V. V. S. S. (2022). Phytoplankton community structure is governed by salinity gradient and nutrient composition in the tropical estuarine system. Continental Shelf Res. 234, 104643. doi: 10.1016/j.csr.2021.104643
Cai Y. Y., Cen J. Y., Ou L. J., Lu S. H. (2014). Distribution characteristics and eutrophication evaluation of COD, DO and nutrients in the pearl river estuary in summer and autumn. J. Jinan Univ. (Natural Sci. Medicine). 35 (03), 221–227.
Chen N., Krom M. D., Wu Y., Yu D., Hong H. (2018). Storm induced estuarine turbidity maxima and controls on nutrient fluxes across river-estuary-coast continuum. Sci Total Environ 628, 1108–1120. doi: 10.1016/j.scitotenv.2018.02.060
Chen F., Deng Z., Lao Q., Bian P., Jin G., Zhu Q., et al. (2022). Nitrogen cycling across a salinity gradient from the pearl river estuary to offshore: insight from nitrate dual isotopes. J. Geophysical Research: Biogeosciences 127 (5), e2022JG006862. doi: 10.1029/2022JG006862
China National Standardization Management Committee (2007). Specification of oceanographic survey part IV: Seawater analysis. China: Standards Press of China
Conley D. J., Paerl H. W., Howarth R. W., Boesch D. F., Seitzinger S. P., Havens K. E., et al. (2009). Controlling eutrophication on: nitrogen and phosphorus. Science 323 (5917), 1014–1015. doi: 10.1126/science.1167755
Dai J. C., Gao X. W., Ni J. R., Yin K. H. (2009). Nutrient status analysis and eutrophication level evaluation in shenzhen offshore waters. Environ. Sci. 30 (10), 2879–2883. doi: 10.13227/j.hjkx.2009.10.009
Dai A. Q., Hao J., Chen Y. N., Zheng X. P., Zuo H., Li K. Q. (2019). Study on the total nitrogen control index system in the circum-jiaozhou bay watershed. Adv. Mar. Sci. 37 (02), 342–354. doi: 10.3969/j.issn.1671-6647.2019.02.018
Dang E. S., Tang J. Y., Zhou L. Y., Ye C., Bao C. G. (2019). Evaluation and eutrophication analysis of water quality in pearl river estuary. J. Dalian Ocean University. 34 (04), 580–587. doi: 10.16535/j.cnki.dlhyxb.2019.04.018
Davidson K., Gowen R. J., Harrison P. J., Fleming L. E., Hoagland P., Moschonas G. (2014). Anthropogenic nutrients and harmful algae in coastal waters. J. Environ. Manage. 146, 206–216. doi: 10.1016/j.jenvman.2014.07.002
Department of Ecological Environment in Guangdong Province (2022). "14th five year plan" for marine ecological environment protection in guangdong province. Guangzhou, Guangdong: Department of Ecology and Environment of Guangdong Province. p1–40.
Department of Water Resources in Guangdong Province (2020). Water resources bulletin of guangdong province 2019.
Department of Water Resources in Guangdong Province (2021). Overview of the pearl river basin. Guangzhou, Guangdong Province: Department of Water Resources in Guangdong Province.
Dong S. Q., Huang C. (2021). Source structure and spatial distribution of terrestrial nitrogen pollution in the guangdong-Hong Kong-Macao greater bay area. Environ. science. 42 (11), 5384–5393. doi: 10.13227/j.hjkx.202102105
Dupra V., Smith S. V., Marshall Crossland J. I., Crossland C. J. (2000). R&S 14. estuarine systems of the south China Sea region: carbon, nitrogen and phosphorus fluxes. Future Earth Coasts IPO, 7–15. doi: 10.13140/RG.2.1.4708.5283
Froelich P. N. (1988). Kinetic control of dissolved phosphate in natural rivers and estuaries- a primer on the phosphate buffer mechanism. Limnol. Oceanogr. 33, 649–668. doi: 10.4319/lo.1988.33.4_part_2.0649
Geeraert N., Archana A., Xu M. N., Kao S. J., Baker D. M., Thibodeau B. (2021). Investigating the link between pearl river-induced eutrophication and hypoxia in Hong Kong shallow coastal waters. Sci. Total Environ. 772, 145007. doi: 10.1016/j.scitotenv.2021.145007
Glibert P. M., Al-Azri A., Icarus Allen J., Bouwman A. F., Beusen A. H., Burford M. A., et al. (2018). Key questions and recent research advances on harmful algal blooms in relation to nutrients and eutrophication. Global Ecol. Oceanograp. Harmful Algal Blooms 232, 229–259. doi: 10.1007/978-3-319-70069-4_12
Guo W. (2016). “Source and biogeochemical characteristics of organic carbon in water and sediment in the pearl river estuary,” in Graduate university of Chinese academy of sciences (Guangzhou institute of geochemistry). Guangzhou, Guangdong Province: Guangzhou Institute of Geochemistry. Available at: https://kns.cnki.net/kcms/detail/detail.aspx?FileName=1016188313.nh&DbName=CDFD2016.
Guo Z. H., Wang C., Yan L., Wang J. K. (2012). Spatiotemporal variations of main pollutants in jiulongjiang estuary. China Environ. Sci. 32 (4), 678–686. doi: 10.3969/j.issn.1000-6923.2012.04.017
Howarth R., Chan F., Conley D. J., Garnier J., Doney S. C., Marino R., et al. (2011). Coupled biogeochemical cycles: eutrophication and hypoxia in temperate estuaries and coastal marine ecosystems front. Ecol. Environ. 9 (1), 16–26. doi: 10.1890/100008
Huang X. P., Huang L. M., Yue W. Z. (2003). The characteristics of nutrients and eutrophication in the pearl river estuary, south China. Mar. pollut. Bulletin. 47, 30–36. doi: 10.1016/S0025-326X(02)00474-5
Huang X. P., Tian L., Peng B., Zhang D. W. (2010). Research progress of environmental pollution in pearl river estuary. J. Trop. Oceanography. 29 (01), 1–7. Available at: https://kns.cnki.net/kcms/detail/detail.aspx?FileName=RDHY201001001&DbName=CJFQ2010.
Huang H., Wu Z. Y., Zhao T., Hou M. C., Liang J. P., Zhang Y. F. (2021). Space and ways to reduce total nitrogen in the pearl river estuary during the “14th five year plan” period. Environ. Prot. 49 (19), 18–20. doi: 10.14026/j.cnki.0253-9705.2021.19.001
Hu Q., Qu L., Huang B. G., Li Q., You Q. M. (2016). Status and evaluation on nutrients for the adjacent sea water of the yellow river estuary in autumn of 2014. Mar. Environ. Sci. 35 (5), 732–738.
Jiang S. C., Lin P. M., Wu L. F., Zheng H. D., Cai J. D., Xi Y. Y., et al. (2016). Analysis of nutrient structure characteristics and influencing factors in dongshan bay. Mar. Dev. Manage. 33 (12), 39–48. doi: 10.20016/j.cnki.hykfygl.2016.12.008
Jia G. D., Peng P. A., Fu J. M. (2002). Sedimentary records of increased eutrophication in the pearl river estuary during the last century. Quaternary Sci. 02), 158–165. Available at: https://kns.cnki.net/kcms/detail/detail.aspx?FileName=DSJJ200202008&DbName=CJFQ2002.
Ke S., Zhang P., Ou S. J., Zhang J. X., Chen J. Y., Zhang J. B. (2022). Spatiotemporal nutrient patterns, composition, and implications for eutrophication mitigation in the pearl river estuary Vol. 266 (China. Estuarine: Coastal and Shelf Science), 107749. doi: 10.1016/j.ecss.2022.107749
Li K. Q., He J., Li J. L., Guo Q., Liang S. K., Li Y. B., et al. (2018). Linking water quality with the total pollutant load control management for nitrogen in jiaozhou bay. China. Ecol. Indicat 85, 57–66. doi: 10.1016/j.ecolind.2017.10.019
Lin J., Krom M. D., Wang F., Cheng P., Yu Q., Chen N. (2022). Simultaneous observations revealed the non-steady state effects of a tropical storm on the export of particles and inorganic nitrogen through a river-estuary continuum. J. Hydrology 606, 127438. doi: 10.1016/j.jhydrol.2022.127438
Lin Y. A., Su J. L., Hu C. Y., Zhang M., Li Y., Guan W. B., et al. (2004). Nitrogen and phosphorus in the pearl river estuary in summer. Acta Oceanologica Sinica. 05), 63–73. Available at: https://kns.cnki.net/kcms/detail/detail.aspx?FileName=SEAC200405007&DbName=CJFQ2004.
Liu J. Q. (2006). Investigation of distribution and influx calculation of nutrients in the eight pearl river openings. Ocean Univ. China. Available at: https://kns.cnki.net/kcms/detail/detail.aspx?FileName=2006181990.nh&DbName=CMFD200.
Liu G. P., He W. H., Cai S. Q. (2020). Seasonal variation of dissolved oxygen in the southeast of the pearl river estuary. Water 12 (9), 2475. doi: 10.3390/w12092475
Liu T. S., Jiang Y. L., Lu Y., Deng H. Q., Zhao M. M. (2021). Spatial distribution characteristics of total nitrogen and total phosphorus in sediments of the pearl river estuary. Guangdong Chem. Industry 48 (16), 148–149. Available at: https://kns.cnki.net/kcms/detail/detail.aspx?FileName=GDHG202116061&DbName=CJFQ2021.
Liu S. M., Li L. W., Zhang G. L., Liu Z., Yu Z., Ren J. L. (2012). Impacts of human activities on nutrient transports in the huanghe (Yellow river) estuary. J. Hydrology 430, 103–110. doi: 10.1016/j.jhydrol.2012.02.005
Li R. H., Xu J., Li X. F., Shi Z., Harrison P. J. (2017). Spatiotemporal variability in phosphorus species in the pearl river estuary: influence of the river discharge. Sci. Rep. 7 (1), 13649. doi: 10.1038/s41598-017-13924-w
Lu F. H., Ni H. G., Liu F., Zeng E. Y. (2009). Occurrence of nutrients in riverine runoff of the pearl river delta, south China. J. Hydrology 376, 107–115. doi: 10.1016/j.jhydrol.2009.07.018
Luo F. (2021). Distribution of redox sensitive elements in a sediments core from seasonal low-oxygen zone of the pearl river estuary and its paleo-environmental implications (Chinese Academy of Sciences: Guangzhou Institute of Geochemistry). doi: 10.27544/d.cnki.gzcds.2021.000036
Ma Y., Wei W., Xia H. Y., Yu B., Wang D., Ma Y., et al. (2009). Historical changes and influencing factors of nutrient salts in the lingdingyang waters of the pearl river estuary. Acta Oceanologica Sin. (Chinese version). 31 (02), 69–77. doi: 10.3321/j.issn0253-4193.2009.02.010
Ma B., Zhao H. (2021). Distribution characteristics of chlorophyll a and nutrients and their relationship with environmental factors in pearl river estuary in summer. Mar. Environ. Science. 40 (05), 707–716. doi: 10.13634/j.cnki.mes.2021.05.008
Ministry of Ecology and Environment of PRC (2022a). 2021 bulletin on the state of china's marine ecological environment. China: Ministry of Ecology and Environment of the People's Republic of China.
Ministry of Ecology and Environment of PRC (2022b). “14th five year plan” for marine ecological and environmental protection. China: Ministry of Ecology and Environment of the People's Republic of China.
Ministry of Ecology and Environment, PRC (2003). Technical specifications for monitoring surface water and sewage. China: Ministry of Ecology and Environment of the People's Republic of China.
Ministry of Ecology and Environment, PRC (1997). Sea Water quality standard. China: Ministry of Ecology and Environment of the People's Republic of China.
Ministry of Ecology and Environment, PRC (2002). Environmental quality standard for surface water. China: Ministry of Ecology and Environment of the People's Republic of China.
Niu L. X., Luo X. X., Hu S., Liu F., Cai H. Y., Ren L., et al. (2020). Impact of anthropogenic forcing on the environmental controls of phytoplankton dynamics between 1974 and 2017 in the pearl river estuary, China. Ecol. Indic. 116, 106484. doi: 10.1016/j.ecolind.2020.106484
Niu L. X., van Gelder P., Luo X. X., Cai H. Y., Zhang T., Yang Q. S. (2020a). Implications of nutrient enrichment and related environmental impacts in the pearl river estuary, China: Characterizing the seasonal influence of riverine input. Water 12 (11), 3245. doi: 10.3390/w12113245
Paerl H. W. (2006). Assessing and managing nutrient-enhanced eutrophication in estuarine and coastal waters: Interactive effects of human and climatic perturbations. Ecol. Eng. 26 (1), 40–54. doi: 10.1016/j.ecoleng.2005.09.006
Paerl H. W., Otten T. G., Kudela R. (2018). Mitigating the expansion of harmful algal blooms across the freshwater-to-marine continuum. Environ. Sci. Technol. 52, 5519–5529. doi: 10.1021/acs.est.7b05950
Painting S. J., Devlin M. J., Malcolm S. J., Parker E. R., Mills D. K., Mills C., et al. (2007). Assessing the impact of nutrient enrichment in estuaries: susceptibility to eutrophication. Mar. pollut. Bull. 55, 74–90. doi: 10.1016/j.marpolbul.2006.08.020
Pang Y., Li X. L. (2001). Calculation of pollutant fluxes in the pearl river delta network into lingdingyang. J. Hydraulic Engineering. 09, 40–44. doi: 10.13243/j.cnki.slxb.2001.09.007
Pearl River Water Resources Commission, Ministry of Water Resources. (2019). earl River Sediment Bulletin.
Redfield A. C., Ketchum B. H., Richards F. A. (1963). “The influence of organisms on the composition of seawater,” in The Sea, vol. 2 . Ed. Hill M. N. (New York: Interscience Publishers, John Wiley), 26–77.
Shi Y. Z., Zhao H., Wang X., Zhang J. B., Sun S. G., Yang G. H. (2019). Spatiotemporal distribution of nutrients and chlorophyll a in the pearl river estuary. J. Guangdong Ocean Univ. 39 (01), 56–65. doi: 10.3969/j.issn.1673-9159.2019.01.009
Slomp C. P. (2011). “Phosphorus cycling in the estuarine and coastal zones: sources, sinks, and transformations,” in Treatise on estuarine and coastal science, vol. 5 . Eds. Wolanski E., McLusky D. S. (Waltham: Academic Press), 201–229.
Strokal M., Yang H., Zhang Y. C., Kroeze C., Li L. L., Luan S. J., et al. (2014). Increasing eutrophication in the coastal seas of China from 1970 to 2050. Mar. pollut. Bulletin. 85 (1), 123–140. doi: 10.1016/j.marpolbul.2014.06.011
Tang J. Y., Chen H. L., Chen Y., Ye C., Zhao Z. Y. (2018). Analysis on the status of land-based pollutants entering the Sea and extraneous pollution in the Western Sea area of shenzhen. Environ. Sci. Guide. 37 (06), 80–85. doi: 10.13623/j.cnki.hkdk.2018.06.019
Tang J. P., Lin N. F., Li S. Z., Xian Yu K. Y. (1996). Effects of terrigenous pollutants on water quality of pearl river ─ analysis of water quality monitoring results in dabakoumen of pearl river in 10 years. People's Pearl River. 03), 35–41. Available at: https://kns.cnki.net/kcms/detail/detail.aspx?FileName=RMZJ603.011&DbName=CJFQ1996.
Tan S. J., Zhu X. S., Zhou J., Cai Z. H. (2014). Trends of environmental conditions in shenzhen nearshore waters in the last 10a. Mar. Environ. Science. 33 (01), 154–160. Available at: https://kns.cnki.net/kcms/detail/detail.aspx?FileName=HYHJ2014010267&DbName=CJFQ2014.
Tong Y. D., Bu X. G., Chen J. Y., Zhou F., Chen L., Liu M. D., et al. (2017). Estimation of nutrient discharge from the Yangtze river to the East China Sea and the identification of nutrient sources. J. Hazard. Mater. 321, 728–736. doi: 10.1016/j.jhazmat.2016.09.011
Wang W. T., Cao X. H., Yuan Y. Q., Song X. X., Yu Z. M. (2016). Seasonal variation and influencing factors of nutrient distribution in the Yangtze river estuary and its adjacent waters in 2012. Oceans lakes. 47 (04), 804–812.
Wang Y. J., Liu D. Y., Xiao W. P., Zhou P., Tian C. G., Zhang C. S., et al. (2021). Coastal eutrophication in China: Trend, sources, and ecological effects. Harmful Algae 107, 102058. doi: 10.1016/j.hal.2021.102058
Wang B. D., Xin M., Wei Q. S., Xie L. P. (2018). A historical overview of coastal eutrophication in the China seas. Mar. pollut. Bull. 136, 394–400. doi: 10.1016/j.marpolbul.2018.09.044
Wei X., Li F., Ma Y. G., Xu Y. D., Chen W., Sun W. (2019). Characteristics and eutrophication evaluation of nitrogen and phosphorus contents in Shandong coastal waters in 2014. J. Oceanology Limnology. 05), 103–109. doi: 10.13984/j.cnki.cn37-1141.2019.05.013
Wu G. J., Cao W. Z., Wang F. F., Su X. L., Yan Y. Y., Guan Q. S. (2019). Riverine nutrient fluxes and environmental effects on china’s estuaries. Sci. Total Environ. 661, 130–137. doi: 10.1016/j.scitotenv.2019.01.120
Wu M. L., Hong Y. G., Yin J. P., Dong J. D., Wang Y. S. (2016). Evolution of the sink and source of dissolved inorganic nitrogen with salinity as a tracer during summer in the pearl river estuary. Sci. Rep. 6, 36638. doi: 10.1038/srep36638
Xie Q., Shi Y. Z., Zhang J. B., Chen C. L., Sun S. L. (2017). Current status and impacts of eutrophication in the pearl river estuary in spring. J. Appl. Oceanography 36 (03), 356–364. doi: 10.3969/J.ISSN.2095-4972.2017.03.008
Xu Z. X. (2003). Practice and technology of riverine pollution treatment (Beijing, China: China Water Power Press), 105.
Xu M. N., Wu Y., Zhang X., Tang J. M., Tan E., Zheng Z. Z., et al. (2022). Diel change in inorganic nitrogenous nutrient dynamics and associated oxygen stoichiometry along the pearl river estuary. Water Res. 222, 118954. doi: 10.1016/j.watres.2022.118954
Yao Y. X., Chen N. S. (2021). Biodiversity of red tide species in the pearl river estuary and its adjacent waters. Mar. Sci. 45 (09), 75–90. doi: 10.11759/hykx20201116002
Yu Z. Y. (2014). Characteristics of nutrient in the southern yellow Sea and northern East China Sea from 2011 to 2013. Ocean Univ. China. Available at: https://kns.cnki.net/kcms/detail/detail.aspx?FileName=1014204213.nh&DbName=CMFD2015.
Yuan G. M. (2005). Effects of economic development on environment of pearl river delta. Ocean Univ. China. Available at: https://kns.cnki.net/kcms/detail/detail.aspx?FileName=2005139926.nh&DbName=CMFD200.
Yuan H. M., Song J. M., Xing J. W., Li X. G., Li N., Duan L. Q., et al. (2018). Spatial and seasonal variations, partitioning and fluxes of dissolved and particulate nutrients in jiaozhou bay. Cont. Shelf Res. 171, 140–149. doi: 10.1016/j.csr.2018.11.004
Yu Y., Song F., Zhao Z. J., Qin H. P., Duan Y. J., Yao L. J., et al. (2020). A study on the changes of typical pollutant fluxes in the shenzhen river estuary in the past 10 years. J. Peking Univ. 56 (03), 460–470. doi: 10.13209/j.0479-8023.2020.015
Zeng D. N., Niu L. X., Tao W., Fu L. X., Yang Q. S. (2020). Distribution characteristics and eutrophication evaluation of nutrients in the pearl river estuary in summer. J. Guangdong Ocean University. 40 (03), 73–82. doi: 10.3969/j.issn.1673-9159.2020.03.010
Zhang Y. N. (2013). Estuarine processes and sediment pollution risk assessment of heavy metals in the yellow river estuary, Yangtze river estuary, pearl river estuary and adjacent sea areas (Third Institute of Oceanography, State Oceanic Administration).
Zhang L., Cao W., Ma Y. G., Han C. N., Qin Y. W., Zhao Y. M., et al. (2016). Distribution and potential eutrophication of nitrogen and phosphorus in tidal reach and estuarine of daliao river. Environ. Sci. 37 (05), 1677–1684. doi: 10.13227/j.hjkx.2016.05.011
Zhang P., Chen Y., Peng C. H., Dai P. D., Lai J. Y., Zhao L. R., et al. (2020c). Spatiotemporal variation, composition of DIN and its contribution to eutrophication in coastal waters adjacent to hainan island, China. Reg. Stud. Mar. Sci. 37, 101332. doi: 10.1016/j.rsma.2020.101332
Zhang Q., Fisher T. R., Trentacoste E. M., Buchanan C., Custafson A. B., Karrh R., et al. (2021). Nutrient limitation of phytoplankton in Chesapeake bay: Development of an empirical approach for water-quality management. Water Res. 188, 116407. doi: 10.1016/j.watres.2020.116407
Zhang P., Ou S. J., Zhang J. X., Zhao L. R., Zhang J. B. (2022). Categorizing numeric nutrients criteria and implications for water quality assessment in the pearl river estuary, China. Front. Mar. Sci. doi: 10.3389/fmars.2022.1004235
Zhang H., Shi X. Y., Zhang C. S., Wang L. S. (2009). Distribution features of nutrients structure and nutrient limitation in the north of yellow Sea. J. Ocean Univ. China (natural Sci. edition) 39 (04), 773–780. doi: 10.16441/j.cnki.hdxb.2009.04.036
Zhang W., Sun J., Nie H. T., Jiang G. Q., Tao J. H. (2015). Effects of nutrients on phytoplankton growth in the pearl river estuary and adjacent waters. Acta ecologica Sin. 35 (12), 4034–4044. doi: 10.5846/stxb201308262158
Zhang P., Yuan H. M., Dai P. D., Zhao L. R., Zhang J. B. (2020a). Spatiotemporal river flux and composition of nutrients affecting adjacent coastal water quality in hainan island, China. J. Hydrology 591, 125293. doi: 10.1016/j.jhydrol.2020.125293
Zhang J. B., Zhang P., Dai P. D., Lai J. Y., Chen Y. (2019). Spatiotemporal distribution and eutrophication of dissolved inorganic phosphorus in the coastal waters of hainan island. Chin. J. Environ. Sci. 39 (06), 2541–2548. doi: 10.19674/j.cnki.issn1000-6923.2019.0303
Zhang J. B., Zhang Y. C., Zhang P., Li Y., Li J. X., Luo X. Q., et al. (2020b). Seasonal phosphorus variation in coastal water affected by the land-based sources input in the eutrophic zhanjiang bay, China. Estuar. Coast. Shelf S. 252, 107277. doi: 10.1016/j.ecss.2021.107277
Zhou F. X., Chen F. J., Li Z. Y., Zhu Q. M., Meng Y. F., Zhang S. W. (2018). Environmental characteristics of nutrients in the Pearl River Estuary in spring 2014. J. Guangdong Ocean University 38 (03), 42–48. doi: 10.3969/j.issn.1673-9159.2018.03.007
Keywords: spatiotemporal pattern, total nitrogen, total phosphorus, riverine flux, coastal water, Pearl River Estuary
Citation: Ke S, Cai Z, Zhang P, Zhang J and Zhang J (2023) Effects of river input flux on spatiotemporal patterns of total nitrogen and phosphorus in the Pearl River Estuary, China. Front. Mar. Sci. 10:1129712. doi: 10.3389/fmars.2023.1129712
Received: 22 December 2022; Accepted: 27 January 2023;
Published: 28 February 2023.
Edited by:
Jiapeng Wu, Guangzhou University, ChinaReviewed by:
Genmei Lin, School of Marine Sciences, Sun Yat-sen University, ChinaCopyright © 2023 Ke, Cai, Zhang, Zhang and Zhang. This is an open-access article distributed under the terms of the Creative Commons Attribution License (CC BY). The use, distribution or reproduction in other forums is permitted, provided the original author(s) and the copyright owner(s) are credited and that the original publication in this journal is cited, in accordance with accepted academic practice. No use, distribution or reproduction is permitted which does not comply with these terms.
*Correspondence: Peng Zhang, emhhbmdwZW5nQGdkb3UuZWR1LmNu
Disclaimer: All claims expressed in this article are solely those of the authors and do not necessarily represent those of their affiliated organizations, or those of the publisher, the editors and the reviewers. Any product that may be evaluated in this article or claim that may be made by its manufacturer is not guaranteed or endorsed by the publisher.
Research integrity at Frontiers
Learn more about the work of our research integrity team to safeguard the quality of each article we publish.