 Eugenia Pasanisi
- 1Marine Turtle Research Group, Department of Marine Animal Conservation and Public Engagement, Stazione Zoologica Anton Dohrn, Napoli, Italy
- 2Centre d’Etudes Biologiques de Chizé, UMR 7372 CNRS - La Rochelle Université, Villiers-en-Bois, France
- 3Filicudi Wildlife Conservation, Lipari, Italy
Many marine megafauna taxa are tied to the sea surface for breathing which makes them vulnerable to vessel collisions. Sea turtles have developed efficient mechanisms to reduce surface time for breathing to a few seconds, but they can extend their surface periods to rest or to rewarm after diving into deep and colder waters. However, knowledge of collision occurrences is limited to data of turtles stranded along the coastline worldwide, whereas events occurring offshore go likely underestimated due to the sinking of carcasses. Here we performed a spatially explicit assessment to identify, for the first time, oceanic areas of higher exposure for sea turtles from maritime traffic in the Tyrrhenian Sea, Western Mediterranean. Satellite-tracking data were used to estimate utilization distributions of loggerhead turtles using Brownian bridge kernel density estimation. Maritime traffic density maps based on Automatic Identification System (AIS) data were extracted from open-access data layers, provided by the European Maritime Safety Agency, summarized, and used for the exposure analysis. Turtle occurrences were also investigated in response to vessel densities and seasonal patterns by fitting a generalized additive model to the data. Our results demonstrated that loggerhead turtles are potentially exposed to maritime traffic across the entire basin, especially in the easternmost part. The exposure varies among spring/summer and autumn/winter months. Highest turtle occurrences were found in regions primarily subjected to cargo, tanker, and passenger transportation. This study represents the first-ever effort to characterize the exposure of oceanic loggerhead turtles to maritime traffic and highlights oceanic areas of higher exposure where research and conservation efforts should be directed to understand the effective impact of this stressor on the species.
Introduction
The Mediterranean Sea is among the world’s busiest waterways. It accounts for 15% of the world’s maritime activity and 20% of seaborne trade, with approximately 200,000 merchant vessels of more than 100 t crossing the Mediterranean Sea each year (Leone, 2017). Maritime activity has steadily increased since the end of the 1990s and during the 2000s in the Mediterranean Sea (Plan Bleu, 2014) and is expected to increase in the coming years in the number of routes, traffic intensity, and vessel size, according to the global seaborne trade growth (Union for the Mediterranean, 2021). The expansion of the maritime transport sector will result in the intensification of several associated impacts on marine biodiversity such as chemical and noise pollution, accidental oil spills, marine litter, the introduction of non-indigenous species, and collisions between ships and marine fauna (di Pepe and Tribe, 2009; Piante and Ody, 2015; Randone et al., 2019).
Vessel collision is a recognized significant threat for large whales (Laist et al., 2001; Panigada et al., 2006; David et al., 2011; Campana et al., 2015; Campana et al., 2017; Cates et al., 2017; Pennino et al., 2017; Winkler et al., 2020; Grossi et al., 2021), but there is increasing evidence that other marine species are affected as well, including dolphins, porpoises, dugongs, manatees, sharks, seals, sea otters, fish, penguins, and sea turtles (Schoeman et al., 2020). Like cetaceans, sea turtles surface or stay close to the surface to breathe, bask, forage, rest, and, in the case of shallow waters, mate; they may also remain at the surface for a prolonged time to reoxygenate and rewarm after deep dives below the thermocline (Hochscheid et al., 2010; Hochscheid 2014), hence becoming exposed to the risk of vessel collisions. When the ship hull or propeller hits a sea turtle, the collisions usually cause major, life-threatening injuries such as massive carapace fractures or deep cuts on the head, flippers, and carapace (Hazel and Gyuris, 2006; Work et al., 2010).
To date, information regarding the impact of vessel collisions on sea turtles is restricted to data derived from stranding events (Cannon, 1998; Jepson, 2005; Orós et al., 2005; Hazel and Gyuris, 2006; Chaloupka et al., 2008; Tomás et al., 2008; Work et al., 2015; Meager, 2016; Foley et al., 2019; Belmahi et al., 2020). In the Mediterranean Sea, a study based on 30-year stranding records reported injuries possibly due to vessel collisions in 6.4% of turtles recovered/stranded along the Italian coast (Casale et al., 2010a). Furthermore, according to the mentioned study, this trend increases during warm seasons when traffic is generally higher, and sea turtles spend more time at the surface and are more susceptible to vessel encounters. However, stranding data are potentially biased. The probability that a dead or distressed sea turtle will drift ashore and become reported is influenced by several factors such as decomposition and scavenging rates, carcass buoyancy, oceanographic and atmospheric conditions, shoreline characteristics, and detection probability, which are highly variable by location and time of year (Cook et al., 2021; Dimitriadis et al., 2022). In this respect, the number of reported onshore strandings may only represent a minimum measure of the overall mortality and, most importantly, may not reflect events occurring in oceanic areas (Hart et al., 2006), where fatal collisions likely go unnoticed due to the sinking of the carcasses. Consequently, the vessel-related impact in oceanic habitats, where turtles are likely to spend more time near the surface (Hochscheid et al., 2010), is largely unknown. Furthermore, large vessels (i.e., cargo, passenger, tanker, cruise ships, etc.) transit the open sea generally at high speeds increasing the probability of collisions and lethal injuries on animals. Indeed, higher speeds may result in a decreased probability that an approaching vessel is perceived by the animal, and in a higher impact force (Schoeman et al, 2020). During systematic monitoring of marine megafauna on board of passenger vessels performed in the open waters of the Mediterranean Sea within the Fixed Line Transect Mediterranean Monitoring Network, sea turtles were observed vanishing under the ship’s hull without reemerging behind, or apparently being taken by the water vortex (A. Arcangeli, Pers. Com., April 15, 2022), indicating a likelihood for collision events in these areas due to high-speed traffic.
In summary, given the intrinsic difficulty of quantifying the mortality rate due to vessel collisions on turtles, especially in oceanic environments, the extent of this human pressure on sea turtles likely goes underestimated. Risk assessment approaches, such as those already implemented in the study of collision events between vessels and large cetaceans (Williams and O’Hara, 2010; Nichol et al., 2017; Pennino et al., 2017; Blondin et al., 2020; Smith et al., 2020; Grossi et al., 2021; Silber et al., 2021; Awbery et al., 2022), or more recently on the study of multiple anthropogenic pressures that potentially impact sea turtles (Dimitriadis et al., 2022), may improve our understanding of maritime traffic consequences in oceanic areas. However, the assessment of collision risk requires preliminary information on animal and vessel distribution patterns and vessel- and animal-related factors, which in the case of Mediterranean sea turtles are still unknown and require targeted research. In this process, one of the key steps is the identification of high-exposure areas, where a high number of vessels and a relatively high number of animals overlap (Cates et al., 2017).
The loggerhead turtle (Caretta caretta) is the most common sea turtle species in the Mediterranean Sea. This species is widely distributed in all the areas of the basin (Casale et al., 2018; Luschi et al., 2018; Almpanidou et al., 2021; Loisier et al., 2021), including the northernmost ones (Hochscheid et al., 2010), and frequents a wide range of habitats throughout its life cycle (Luschi and Casale, 2014). Although the Mediterranean loggerhead population was categorized as “Least Concern” by the last IUCN Red List assessment (Casale, 2015), several rigorous conservation measures are needed to maintain this status and ensure their protection from human activities (Camiñas et al., 2020). Marine turtle populations are acknowledged as a conservation concern in the Mediterranean and have been the subject of Action Plans for their protection, compiled under the direction of the Barcelona Convention, since 1989. According to the updated UNEP MAP Action Plan for the Conservation of Mediterranean Marine Turtles (UNEP/MAP-SPA/RAC, 2019), the most critical threats to sea turtles include the deterioration of critical habitats, incidental captures in fisheries, intentional killing, consumption, egg exploitation, pollution, and vessel collisions (Casale and Margaritoulis, 2010b). Therefore, identifying the spatial and temporal use of the Mediterranean Sea by loggerhead turtles (Casale et al., 2012a) and its overlap with anthropogenic pressures could be crucial to set up proper conservation-related management interventions. In this context, satellite tracking is a promising approach for acquiring detailed knowledge of habitat utilization and supporting conservation measures of these highly migratory species. Thanks to many technological advances in satellite telemetry, our knowledge of loggerhead turtles’ spatial patterns has considerably improved (Casale et al., 2018), and key oceanic and neritic areas for sea turtles have been identified in the Algerian Sea, the Sicilian Strait, the Western and Central Ionian Sea, the Aeolian Archipelago, the North Adriatic, Southeast Turkey, and Egypt (Bentivegna, 2002; Margaritoulis and Demetropoulos, 2003; Zbinden et al., 2008; Schofield et al., 2010; Zbinden et al., 2011; Hays et al., 2014; Blasi et al., 2016; Mingozzi et al., 2016; Blasi and Mattei, 2017; Casale et al., 2018). Furthermore, the Tyrrhenian Sea (Western Mediterranean) has recently been recognized as an important foraging and overwintering area for Mediterranean loggerhead turtles (Luschi et al., 2018; Chimienti et al., 2020; Chatzimentor et al., 2021). In these studies, turtles were tracked while moving in the oceanic waters for extended periods, often close to seamounts and volcanic islands (Fiori et al., 2016) or in the proximity of fishing areas (Blasi et al., 2016; Blasi and Mattei, 2017).
In the current study, we analyzed satellite tracking data collected over a 15-year period on loggerhead turtles primarily moving within the oceanic habitats of the Tyrrhenian Sea to determine their main patterns of movement in the oceanic realm. Then, we performed a spatially explicit assessment of exposure for the species to maritime traffic by using published vessel density data. Our main goals were i) to identify and map high-use oceanic areas frequented by loggerhead turtles in the Tyrrhenian Sea; ii) to investigate vessel density distributions in the basin according to different vessel categories; and iii) to assess the exposure to the risk of collision for sea turtles from maritime traffic and identify high-exposure areas.
Materials and methods
Study area
The geographical area considered in this study is the Tyrrhenian Sea (TYS hereafter), in the Western Mediterranean Sea, from 8.6° to 16.2° E and from 37.8° to 44.1° N. This triangular basin has a surface of 275,000 km2 (or 182,000 km2 if we exclude the neritic zones from 0- to 200-m depth). It has a complex structure and bathymetry, with a mean and a maximum depth of 2,000 and 3,780 m, respectively. The TYS large-scale circulation is strongly affected by the complex exchanges which take place through the three main openings: the Corsica and Sardinia channels (to the north and southwest, respectively), connecting the TYS to the westernmost part of the Mediterranean Sea, and the Sicily Strait (to the south), through which the TYS communicates with the eastern basin (Danovaro and Boero, 2018).
Turtle tracking
Tracking data of 22 loggerhead sea turtles were collected over 15 years, from 2006 to 2021 (T1 to T22, Table 1) using both ARGOS- and GPS-derived locations. Turtles with IDs T1 to T4 corresponded to individuals published in Luschi et al. (2018), T5 to individuals in Uçar et al. (2018), and T6 to T16 to individuals in Chimienti et al. (2020) and Hochscheid (2010). Turtles from T17 to T22 were presented here for the first time. Some turtles considered in this study (n = 7) were recovered from various TYS areas after being accidentally caught by bottom trawlers, found floating or entangled in nets, kept in captivity for a variable period to be rehabilitated, and then released at different locations. Other turtles (n = 15) were deliberately caught, equipped with satellite tags, and then released immediately at the same location where they were caught. The overall mean curved carapace length (CCL) was 66 ± 7.2 cm (range 55–81 cm). According to the approximate size at maturity reported for loggerhead turtles in the Mediterranean, which is >70 cm CCL (Margaritoulis and Demetropoulos, 2003; Casale, 2005), our turtles can be assumed to be primarily large juveniles with some adults (n = 7) (Table 1). All turtles were equipped with satellite tags just before their release, by gluing the tag directly on the second vertebral scute of the carapace, as described in detail by Chimienti et al. (2020). Over the years that the data for this study were collected, various models of telemetry tags operating with different data relay platforms and geolocation methods were used (see Table S1). Depending on the platform and method used, location data were subject to different measurement errors, temporal irregularity, and space–time resolutions. ARGOS error estimates are assigned to one of seven location classes (LC 3, 2, 1, 0, A, B, Z in descending order of quality) or characterized by ellipsis errors (semi-major axis, semi-minor axis, and orientation). The accuracy of Fastloc GPS positioning depends on the number of receiving satellites, ranging from 10 to 70 m when more than five satellites are used to calculate the location (Dujon et al., 2014). The QFP (Quick Fix Pseudoranging) error estimate is virtually the same as standard GPS (typically better than 25 m). It varies according to number and spatial arrangements of GPS satellites and is assigned to four quality classes (“Succeeded,” “Resolved QFP,” “Resolved QFP-Uncertain,” and “Unresolved QFP”). The data analysis presented in this study was performed in both R statistical computing software (version 4.0.4, R Development Core Team, 2009) and QGIS (version 3.10.11).
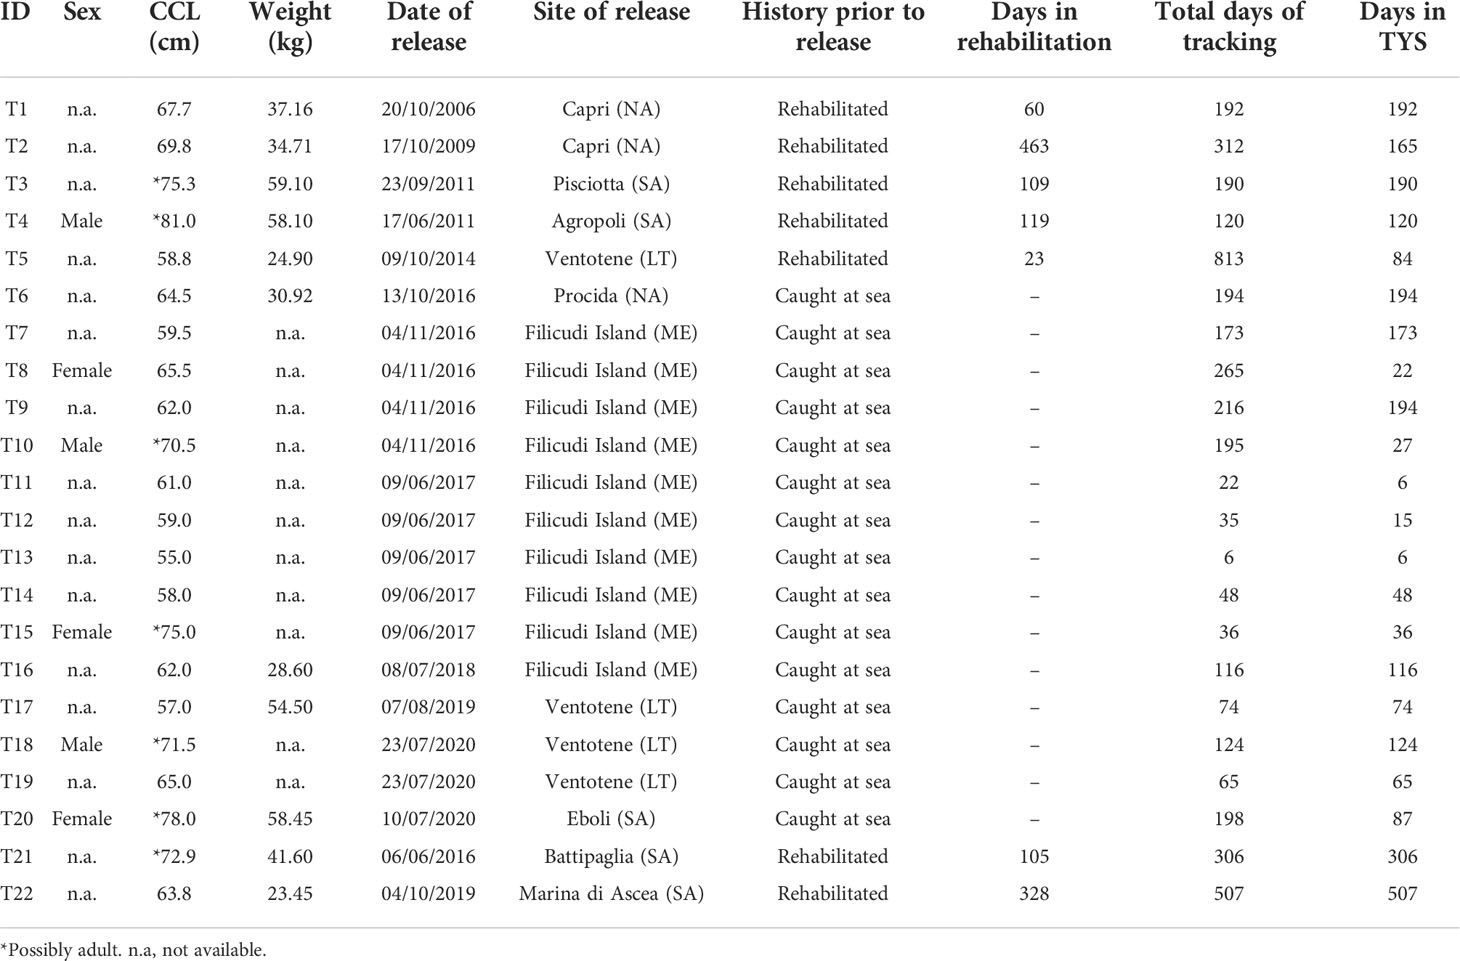
Table 1 Turtle ID, sex, curved carapace length (CCL) and weight, and total days of tracking and number of days tracked in the Tyrrhenian basin.
Preparing tracking data and standardizing locations
Prior to any analysis, locations were visually inspected and the first 24 h after the release of the turtle was omitted. For ARGOS tags, locations with no estimable location accuracy (i.e., location class Z) were excluded. In order to also eliminate the low-accuracy locations (location classes A and B) associated with unrealistic speeds, a 200-km/day speed filter (Dujon et al., 2017) was also applied to raw ARGOS datasets. Filtering was performed by using the function “vmask” (algorithm by McConnell et al., 1992) within the “argosfilter” package (Freitas, 2012). For QFP positioning, only the quality classes “Succeded” and “Resolved QFP” were considered. Finally, for Fastloc-GPS, only positions calculated with more than five satellites were included in the analysis. “The “CrawlWrap” function from the momentuHMM R package (McClintock and Michelot, 2018) was then applied to speed-filtered data to fit continuous-time-correlated random walk models (CTCRW), predict temporally regular locations at 12-h steps, and improve location estimates considering location errors. The function was called separately for locations including the ARGOS location quality classes, or ARGOS location ellipse errors, or GPS errors, in order to incorporate different measurement errors into the analysis. For ARGOS data, we referred to the “bearded seal” or “harbor seal” examples of Johnson et al. (2008) assuming a bivariate normal measurement error model that accounts for ARGOS estimated error ellipses or the errors associated with ARGOS location quality classes. On the other hand, for Fastloc GPS and QFP-GPS, we followed the “harbor seal” example of McClintock et al. (2013) by assuming an isotropic error ellipse with a 50-m semi-major error and including it in the function. Turtle positions were then merged into a single data frame with turtle IDs, relocations, and errors associated with the estimates. Loggerhead turtles showing a marked preference for coastal habitats and with a tracking duration of less than 28 consecutive tracking days in the TYS (n = 6) were discarded and not included in the following analysis.
Utilization distribution estimates
Animals’ utilization distributions (UDs) were estimated using the Brownian bridge approach of the Kernel method for auto-correlated relocations (Bullard, 1991; Horne et al., 2007) applying the function “kernelbb” within the AdehabitatHR R package (Calenge, 2006; Calenge, 2019). Instead of simply smoothing the relocation pattern as the classic kernel function does, the method considers that the animal has moved through a continuous path, which is not necessarily linear, between two successive relocations. The Brownian bridge model estimates the probability density that this path passed through any point of the study area, given that the animal was located at the point r1 at time t1 and at the point r2 at time t2, with a certain amount of inaccuracy. The estimation relies on two smoothing parameters, sig1 and sig2: the first measure is based on the inaccuracy of the relocations, and the second was computed following the maximum likelihood approach described in Horne et al. (2007) by using the function “liker” of the package. The function’s output is the probability density to relocate the animal at a given place (UD) which was then multiplied by cell area (1 km2) to standardize it over the area of interest, so that the volume under the UD is equal to 1. The function “getvolumeUD” was then used to estimate the home range distributions (HRs) of individuals and function “rasterize” of the raster package to compute the mean HR and the mean UD for all animals.
The same procedure was followed to estimate densities over different periods of the year, partitioning data in two semesters in order to allow the comparison with ship density data: from October to March (autumn/winter, n. relocations: 2,904) and from April to September (spring/summer, n. relocations: 1,781). It is worth clarifying that such a division of the year was done to be able to compare turtles’ distribution with vessel density data; hence, by using the term “season” here onward, we refer essentially to the seasonality based on dynamics of human activity and not of turtles. The seasonal kernel analysis excluded turtles with a tracking duration of less than 28 days for season. We were obligated to consider turtle T22 monitored for two successive semesters as two different animals since the kernel function does not permit the partitioning of an animal trajectory into sub-tracks.
To exclude potential differences in spatial use between rehabilitated turtles (n = 6) and those caught at sea (renamed as “wild” from now onward, n = 10), we used Bhattacharyya’s affinity (BA) (Bhattacharyya, 1943). The affinity index ranges from 0, meaning no overlap, to 1, meaning identical UDs. This was done using the “kerneloverlap” function in the R package “adehabitatHR” (Calenge, 2006) to measure the overlap of the two populations (wild versus rehabilitated) in both core (50% kernel) and general use (95% kernel) areas. Due to the different sample sizes between the two subgroups, we considered all the six rehabilitated turtles and randomly selected six out of ten wild turtles and repeated this procedure 10 times. According to our results for randomized samples (BA index 95% = 0.82 ± 0.03; BA index 50% = 0.33 ± 0.02) and for observed samples (BA index 95%: 0.84, BA index 50%: 0.33), we concluded that there is no evidence of spatial segregation between rehabilitated/wild turtles in our sample (see Supplementary Material for more details, Figures S1, S2). Therefore, we decided to include them all in our exposure analysis.
To display in a map the overall utilization distribution of turtles with respect to the presence of Tyrrhenian seamounts, the shapefile of these submerged structures was retrieved at the EMODnet Geology website (Geology Submerged Landscapes, https://www.emodnet-geology.eu/) and used in GIS environment.
Summarizing maritime traffic AIS-based data
Vessel density maps were provided by the European Maritime Safety Agency (EMSA) and retrieved at the EMODnet Human Activities website. Here, data are provided as the density (h/km2) of vessels of certain type (cargo, passenger, fishing, etc.) in a given period (month or year) within a grid cell of 1-km2 resolution, from January 2017 to 2020. Vessel density maps were based on Automatic Identification Systems (AIS) data. AIS is an automatic tracking system that uses transceivers installed on vessels by automatically broadcasting critical information, including the vessel’s identity and real-time position, course, and speed, using VHF frequencies. European law requires AIS to be fitted aboard all ships of 300 gross tonnage and upward engaged on international voyages, cargo ships of 500 gross tonnage and upward not engaged on international voyages, and all passenger ships irrespective of size. Furthermore, since May 2014, all European fishing vessels exceeding 15-m length overall are required to carry and operate an AIS device (EU Dir 2011/15/EU).
Traffic densities were gathered and manipulated with the “raster” package to obtain both total and seasonal (October–March and April–September) average maps for the period 2017–2020 sorted by four selected vessel types (Cargo, Fishing, Passenger, Tanker, and an additional category combining “All traffic”). Due to the lack of data anterior to 2017, it was not possible to match the entire tracking period (2006–2021). Yearly vessel densities were compared to understand the degree of the yearly variation. Kruskal–Wallis tests were performed to identify significant differences in (i) total ship density among subareas, (ii) total ship density among two seasons, and (iii) total densities among ship categories. In case of statistical significance in group medians, post-hoc testing was conducted using the “Bonferroni” p-adjusted method to determine which groups are different from others and avoid potential errors.
Maritime traffic exposure analysis
In order to identify oceanic areas with relatively high exposure to maritime traffic, we estimated separately both the probability of turtle occurrence and the probability of vessel occurrence across all grid cells of 1 km2 and relatively to the oceanic TYS (>200-m depth) utilizing the above-described yearly and seasonally averaged maps. The assessment was performed adapting the approach followed by Vanderlaan et al. (2008) and Nichol et al. (2017). For the estimate of the relative turtle occurrence probability [Prel(Turtle)], we used the output from the Kernel analysis (UD) and standardized it over the area of interest (oceanic area), so that the volume under the UD and over the area is equal to 1. We likewise standardized the ship traffic intensity values to determine the relative probability of vessel occurrence [Prel(Vessel)] in the area. All the computations were executed on raster layers using the Raster Calculator tool in QGIS for all the considered vessel and seasonal categories on a grid of 1 × 1 km2 and then rescaled to 15 × 15-km2 resolution using the “r.resamp.stats” function in QGIS and setting the new values as the sum of the values in the original cells. Finally, we multiplied Prel(Turtle) by Prel(Vessel) and standardized the resulting value over the area to estimate the probability of a turtle being exposed to maritime traffic [Prel(Exposure)]. High-exposure thresholds were defined as the 90th percentiles of the Prel(Exposure) distributions and used to identify most exposed areas.
Generalized Additive Model (GAM) analysis
The aim of the GAM was to investigate relationships between loggerhead turtles and vessel occurrence in the oceanic TYS. In this regard, we fit the GAM to our data using the “mgcv” package (Wood, 2011). The dataset was obtained by rescaling from 1- to 15-km2 resolution the raster of turtles’ seasonal UDs and vessel densities and setting the new values as the sum of the values in the original cells using the “r.resamp.stat” function. A grid of points of 15 km2 was then used to sample raster values using the “Point Sampling Tool” in QGIS. This grid size was chosen among other resolutions (5 km2, 10 km2, and 30 km2) as the best option to reduce spatial autocorrelation effects to acceptable level and maintaining the finest possible scale. The model used the seasonal UD as the response variable (UD_season) and the log-transformed vessel density (logVD_season) as the explanatory variable. To test whether Season had an effect on the shape of the relationship, we modeled the log-transformed vessel density with and without the “by” term within the spline. Location data (latitude and longitude) were added to account for spatial autocorrelation and season ID (spring/summer vs. autumn/winter) as fixed effect (Season).
We also considered the null model and selected the best model using the model.sel() function of the “MuMIn” package. The formula used for each model is reported below.
Models were run using the gamma distribution family and checked for violations of model assumptions in terms of residual autocorrelation, heterogeneity, and normality using the gam.check(), acf(), and pacf() functions. The model with the lowest Akaike information criterion (AIC) was selected as best.
Results
Turtle utilization distribution analysis
The majority of turtles (n = 14) remained in the TYS or its adjacent waters throughout transmission (range: 6–507 days) (Table 1; Figure 1). Only eight turtles moved to other areas of the Mediterranean Sea, such as Northern Tunisia (T9), the Balearic Sea (T20), or the central and eastern parts of the basin (T2, T5, T8, T10, T11, T12, T5). The overall UD analysis was performed on 16 out of the 22 loggerhead turtles monitored (4,979 location data), as six turtles (T2, T8, T10, T11, T12, T13) were excluded (see Section 2.3). Similarly, the seasonal UD analysis was performed on 11 turtles for the spring/summer (1,781 locations) and 12 for the autumn/winter (2,904 locations), excluding turtles with less than 28 consecutive tracking days per season. As a result, the period of tracking in the TYS was on average 152 ( ± 116 std. dev.) days in total or 74 ( ± 41 std. dev.) days during the spring/summer and 132 ( ± 51 std. dev.) during the autumn/winter season. The average home range distribution referring to the overall dataset indicated three main core areas (75% HR) in the southeastern and partially the central-eastern parts of the TYS (Figure 2) sized 909, 488, and 261 km2. Seasonal mean home ranges indicated that the overall area used is greater over autumn/winter, with core areas identified again in the eastern TYS (the largest sized 1,247 km2), whereas during the spring/summer (Figure 3A) turtles seem to use smaller patches and disperse more widely over the basin, without a common core area (Figure 3B).
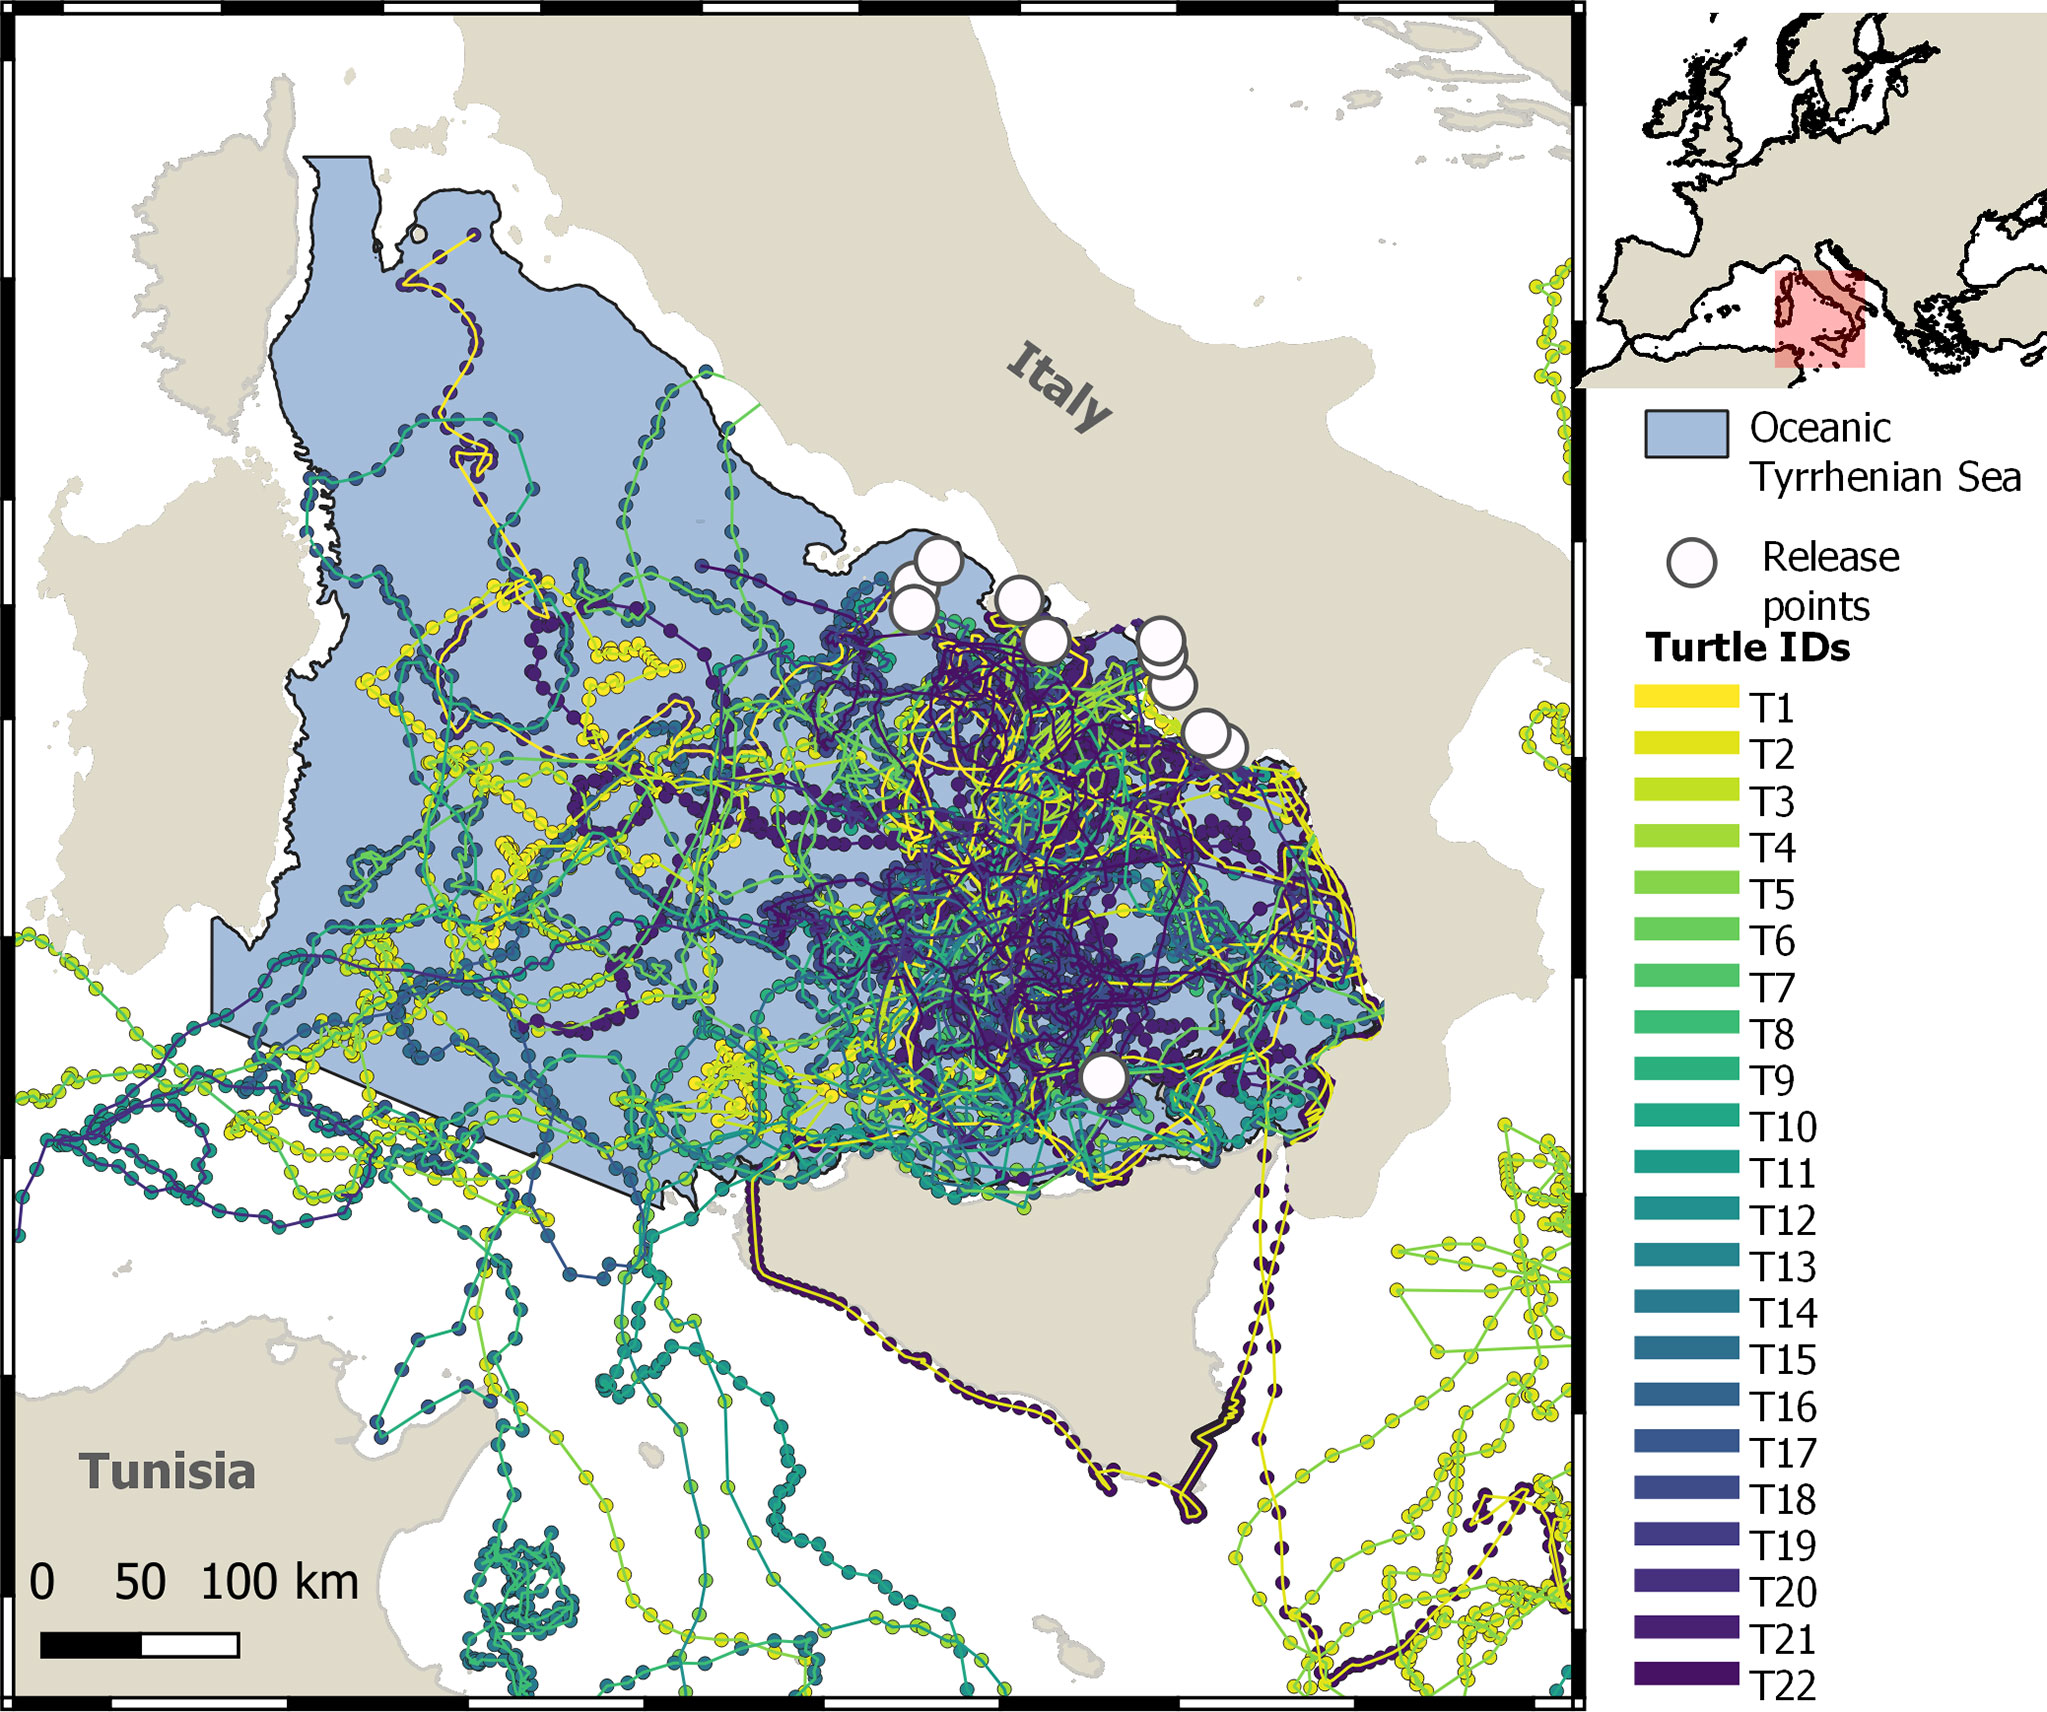
Figure 1 Overview of the fixed-time trajectories of 22 large juvenile and adult loggerhead turtles in the Tyrrhenian Sea, obtained by fitting the CTCRW model to satellite location data.
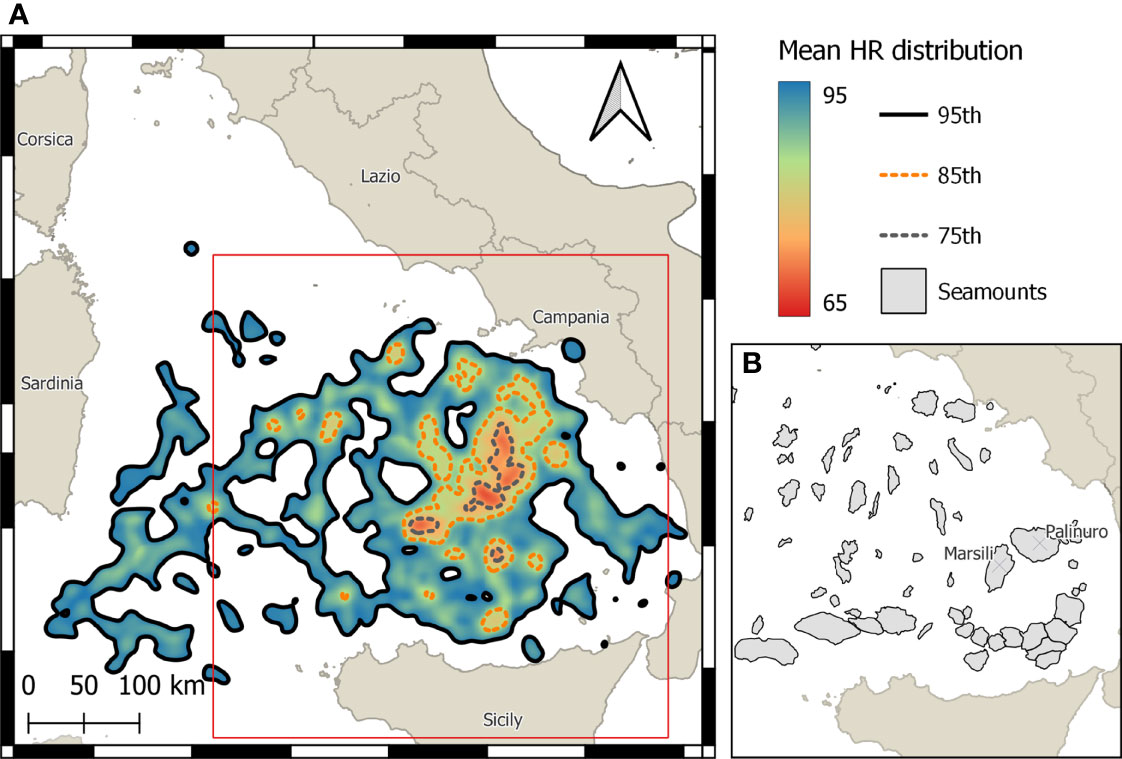
Figure 2 (A) Average home range distribution of 16 loggerhead turtles during the whole period of tracking (4,979 observations) and (B) location of major seamounts in the Tyrrhenian Sea (right panel referring to the area confined by the red rectangular in the left panel).
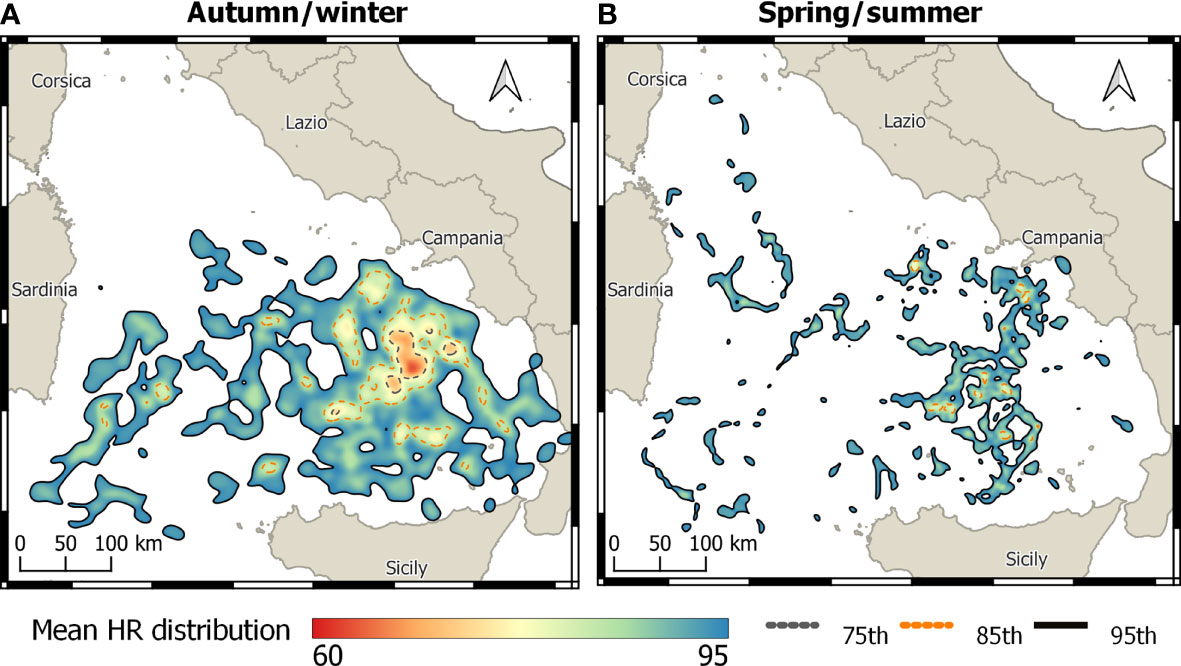
Figure 3 Seasonal average home range distributions of loggerhead turtles during (A) autumn/winter (n = 11) and (B) spring/summer (n = 12) semesters (number of observations of 2,904 and 1,781, respectively).
Maritime traffic distributions and composition
No large variations in vessel density were observed in the TYS over 4 years (mean values ± SD for 2017: 0.34 ± 1.98 h/km2/month; 2018: 0.34 ± 1.71 h/km2/month; 2019: 0.40 ± 4.05 h/km2/month; 2020: 0.33 ± 2.79 h/km2/month). Densities varied significantly among sectors (Kruskal–Wallis chi-squared, H = 27,708, df = 4, p-value <0.001), and all of the pairwise tests of mean rank difference were statistically significant after controlling for multiple tests (adjusted p-value <0.001). The northern Tyrrhenian Sea and the central-eastern and south-eastern Tyrrhenian (N-TYS, CE-TYS, and SE-TYS, respectively, hereafter) were the sectors with the higher mean values of total traffic densities (Figure S3; Table S2). Seasonal average vessel densities were significantly higher during spring/summer than during autumn/winter months (Kruskal–Wallis chi-squared, H = 44,796, df = 1, p-value <0.001). Density also significantly differed with respect to the vessel type (Kruskal–Wallis chi-squared, H = 95,595, df = 3, p-value <0.001) in all pairwise comparisons (adjusted p-value <0.001). Mean densities in the basin were 0.10 ± 0.23, 0.08 ± 0.52, 0.06 ± 0.42, and 0.03 ± 0.23 h/month/km2 for Cargo, Fishing, Passenger, and Tanker vessels, respectively. Mean vessel densities were also reported according to vessel type and different TYS sectors (Figure S4).
High-exposure areas
The SE-TYS and CE-TYS presented the highest mean values of relative probability of turtle-vessel co-occurrence (exposure) (Table S3). The overall cumulative probability of exposure over the entire TYS was approximately 60% for the SE-TYS alone (Figure 4). Notably, during the spring/summer semester, three main high-exposure areas were identified: off the Campanian continental shelf, at the center of the eastern basin, and off the continental shelf of Sicily (north of Palermo) (Figure 5, at the bottom center). During autumn/winter, in contrast, a main area of high exposure extends from the Strait of Messina (Figure 5, at the bottom right) up to the central part of the eastern TYS. Probabilities of turtle exposure to specific vessel categories (passenger, cargo, tanker, fishing) were also computed (Figure 6). In particular, we found areas of relatively high exposure to passenger ships along the route connecting Naples (Campania) and Palermo. In contrast, the exposure distributions for cargo and tankers were spatially similar, with the highest values along the corridors connecting northern and southern parts of the TYS, and in the proximity of the Port of Gioia Tauro. Finally, oceanic areas with relatively high exposure to fishing vessels were in the proximities of Ustica Island, off the northwest coast of Sicily and off the Gulf of Salerno.
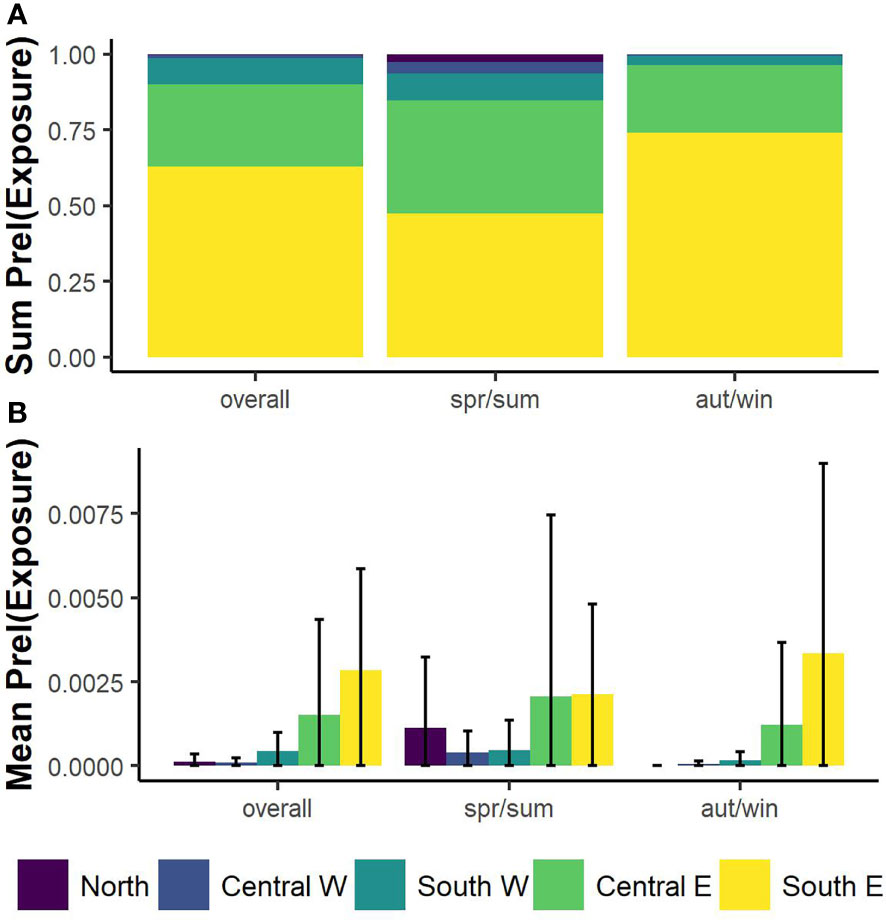
Figure 4 Bar plots of summed values (A) and mean values with error bars (B) of relative probabilities of vessel-turtle co-occurrences (prel(Exposure)) according to TYS subareas; N-TYS, northern Tyrrhenian Sea; CW-TYS, central-western Tyrrhenian Sea; CE-TYS, central eastern Tyrrhenian Sea; SW-TYS, southwestern Tyrrhenian Sea; SE-TYS, south Eastern Tyrrhenian Sea.
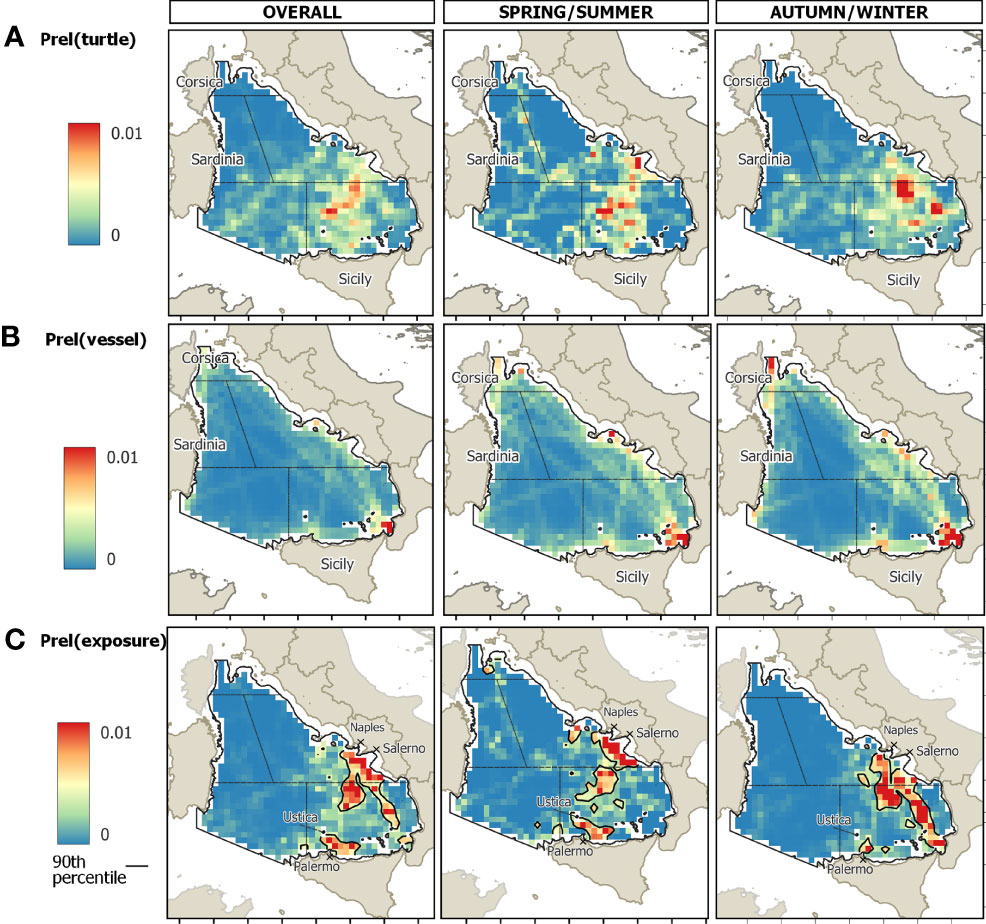
Figure 5 The oceanic TYS study area divided into cells of 15 km2 (688 cells); colors indicate the relative probability of (A) loggerhead turtle occurrence (obtained through the application of the Brownian bridge kernel method to satellite data, see methods for details), (B) vessel occurrence, (C) and total vessel and turtle co-occurrence (exposure), calculated over the yearly average (1) or according to spring/summer (2) or autumn/winter (3) averages.
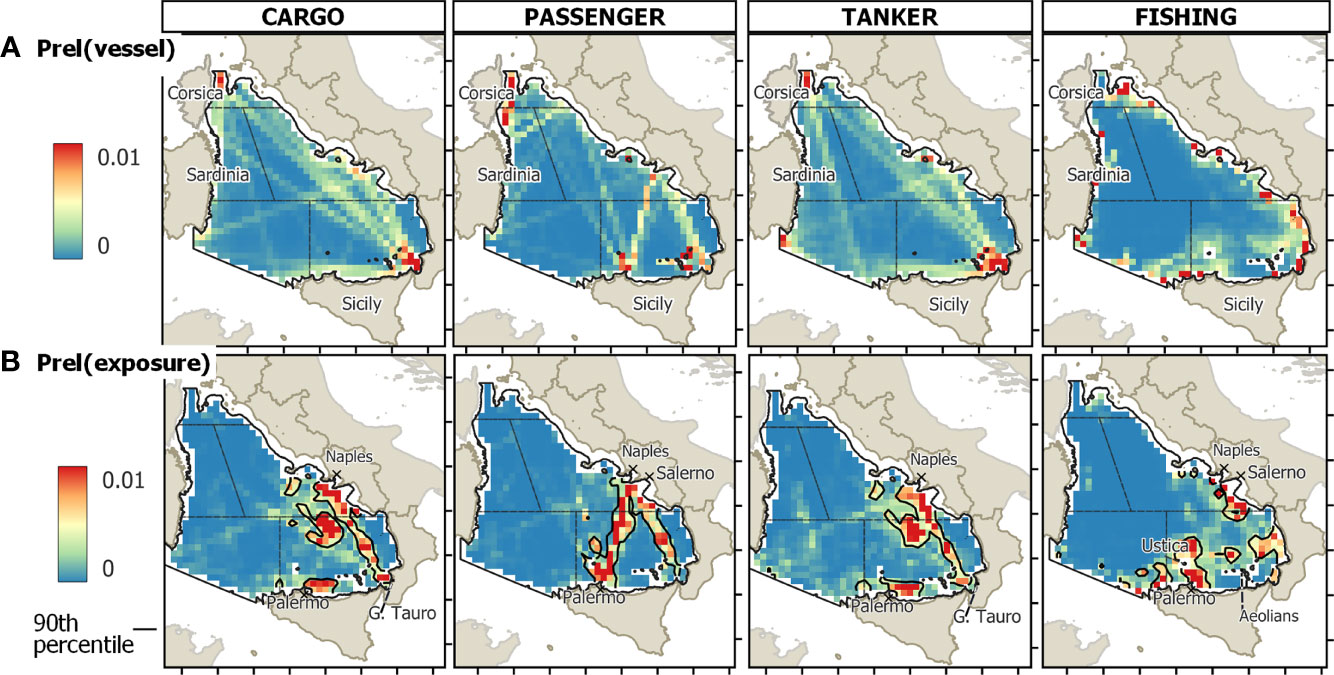
Figure 6 The oceanic TYS study area divided into cells of 15 km2 (688 cells); colors indicate the relative probability (A) vessel occurrence, (B) total vessel and turtle co-occurrence, calculated over the yearly average sorted by the type of vessel (Cargo, Passenger, Tanker, and Fishing). The loggerhead turtle occurrences included in the risk analysis correspond to that already reported in Figure 5 and referred to the whole year.
GAM output
The best model selected the formula accounting for seasonal differences within the spline (see Table S4). The seasonality had a significant effect on turtle distribution (R-adj sq = 0.474, p-value <0.001, Table 2). The higher probability of turtle occurrences was also associated with higher vessel density for the spring/summer period (Figure 7A), up to values of 100 h/cell/month. Within the same range, the probability of turtle occurrences was lower for the autumn/winter period at increasing vessel densities (Figure 7B). Most of the data points are within 200 h/cell/month value; hence, prediction above these values is highly uncertain. Outliers (>200 h/cell/month) were associated with vessel density hotspots in the oceanic proximity of both mainland and islands, particularly off the Messina Strait, the Aeolian Islands, and Campania. Diagnostic and autocorrelation plots of the fitted GAM are reported in Figures S5 and S6. The model with the lowest AIC was selected as best.
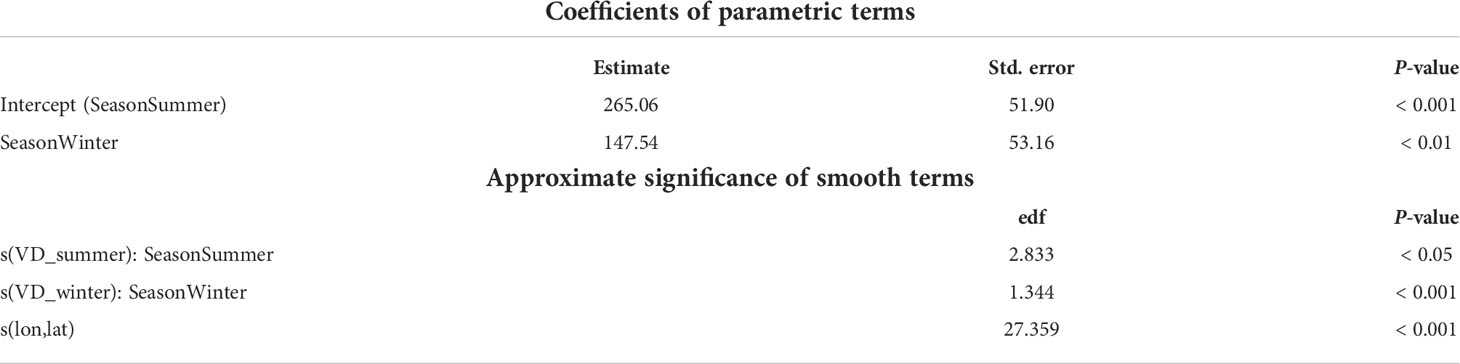
Table 2 Summary of the selected GAM model; edf=estimated degrees of freedom. Results -> log scale.
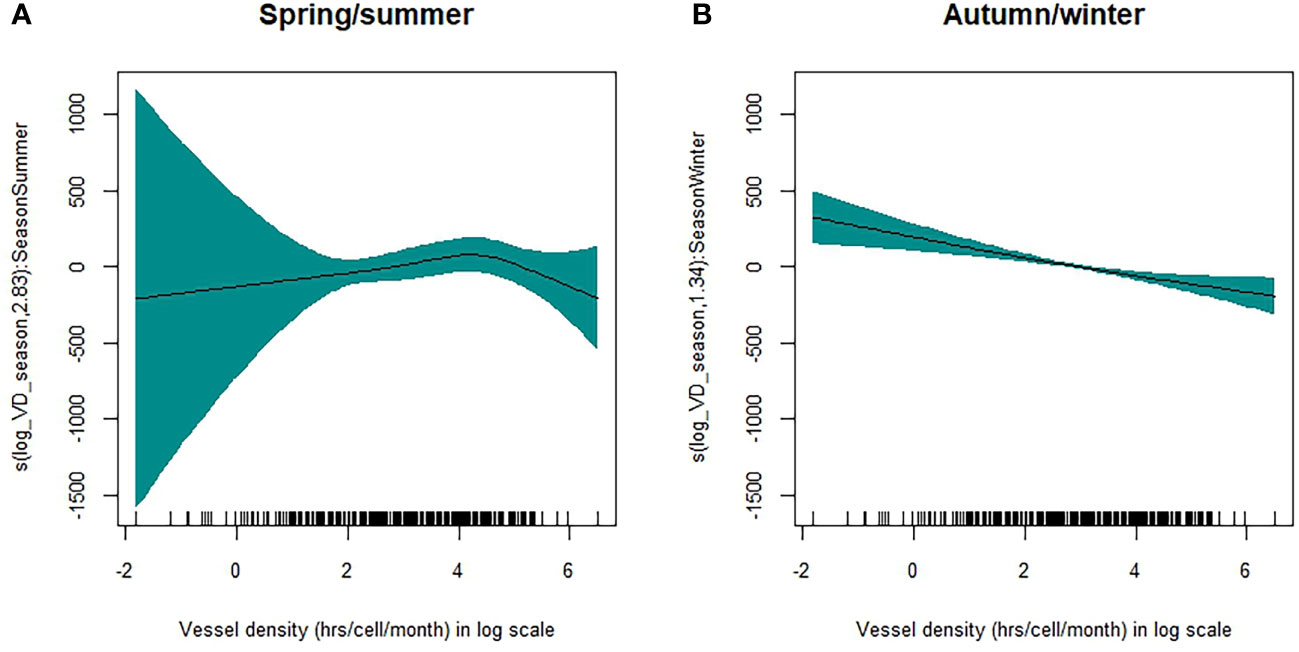
Figure 7 GAM plots show the effect of the smooth terms (vessel densities) and linear terms (seasonality) in the model, with reference to Spring/summer (A) and Autumn/winter (B) seasons. Results are in log scale. The blue shades show the 95% confidence interval for the mean shape of the effect. Data points are represented by the black vertical lines at the bottom of the plot.
Discussion
Maritime activity poses serious threats to sea turtles by potentially killing or injuring them in case of vessel collision. Our study shows that loggerhead turtles are extensively exposed to maritime traffic in the oceanic areas of the TYS, particularly in its eastern side, where we identified the main high-exposure areas. We also found that the exposure (co-occurrence) varies spatially according to different periods of the year and that it is mainly due to passenger ships, cargo, and tanker traffic. These vessel categories, due to their large size and high traveling speeds, are indeed worthy of particular concern in the area.
Movement patterns of sea turtles
The data presented in this paper confirmed that loggerhead turtles are regular habitants in the TYS, because tracked turtles spent a significant amount of time in the area across different seasons and years. In fact, most of them (>70%) remained in the TYS for the whole tracking period comprising even 2 consecutive years for one individual, which thus highlights the importance of TYS as foraging and overwintering area. This result is coherent with previous findings, already indicating the presence of sea turtles in the eastern TYS, which emerged in our study as the most frequented sector (Figure 2). Chimienti et al. (2020) reported high-intensity diving and movement patterns characteristic of “area-restricted search” for loggerhead turtles in the same area evidenced also by our kernel analysis, suggesting that the utilization of this site is likely linked to foraging activities. Loggerhead occurrences within the oceanic TYS significantly differed according to the two semesters of the year. Indeed, during spring/summer small patches are used by sea turtles over a wider area, without a main identifiable spatial pattern, whereas during the autumn/winter turtles mainly frequent the eastern TYS. The strong seasonality of the TYS circulation, and the formation of more active anticyclonic eddies during summer months (Iacono et al., 2021), could play a role in determining loggerhead movements by influencing the availability and distribution of prey in different TYS sectors.
Intriguingly, in our study, the areas with the higher mean values of turtle occurrences were in the northwestern surroundings within 50 km from the peak of the Marsili volcano (Figure 2), the biggest seamount of the TYS characterized by active hydrothermal activity (Italiano et al., 2011). Frequent occurrences of sea turtles in the proximity of Tyrrhenian seamounts were also reported by other previous studies (Luschi et al., 2018; Sparks and DiMatteo, 2020). Seamounts have been recognized as possible biodiversity hotspots for pelagic predators (Morato et al., 2008; Morato et al., 2010), including cetaceans and sea turtles. The attraction exerted by seamounts may be associated with their possible role in shaping local or mesoscale water circulation through eddy formation, local upwelling or downwelling, or closed circulation patterns called Taylor columns which form when water is trapped over the crest of a seamount, creating turbulence and mixing the upper layers of water. All these oceanic features, in turn, may determine the accumulation or flow of nutrients and increase offshore ecosystems’ overall productivity (Boehlert and Genin, 1987). Improving our understanding of how seamounts influence sea turtle movements may be critical for successful conservation plans. Therefore, further research is urgently needed in the area.
We acknowledge that the analysis of loggerhead turtle distribution implemented in this study did not account for the interannual environmental variability. Other approaches such as ecological niche and spatial distribution modeling (Melo-Merino et al., 2020; Smith et al., 2020; Chatzimentor et al., 2021; Zampollo et al., 2022) should be enhanced to further investigate the distribution of this species in the area in response to environmental variables (i.e., sea surface temperatures, chlorophyll-a concentration, distance to seamounts, bathymetry, etc.), in order to identify mechanisms and variability in habitat utilization, and to predict future distribution patterns.
Maritime traffic and its composition
Our study provided evidence that the TYS is a busy waterway with maximum vessel densities in the oceanic proximity of both mainland and islands. Overall traffic densities were greater than 0 across almost every cell in the study domain and seasons, indicating that the whole area was intensively used by vessels of all kinds. Contrary to the global trend toward increasing vessel traffic (Union for the Mediterranean, 2021), mean total vessel densities did not vary significantly between 2017 and 2020, possibly due to the short time window considered. The higher densities in spring/summer across all the subareas of the basin are consistent with the seasonal trend observed in the Western Mediterranean Sea (Campana et al., 2015). The fact that the eastern TYS emerged as the busiest sector is not so surprising considering the presence of some of the major landing harbors for cargo and passenger transportation in the area, such as Naples, Salerno, and particularly Gioia Tauro, the largest transshipment terminal in Italy and one of the most crucial cargo container traffic hubs in the whole Mediterranean basin (Lloyd’s Marine Intelligence Unit, 2008). Indeed, looking at the detailed traffic composition (Figure S4), cargo was the vessel type contributing most (38%) to all-traffic densities, presenting the highest values in the northern and southeastern parts of the basin due to the important global route passing through the Messina Strait that connects the western and eastern areas of the Mediterranean. Fishing can also contribute considerably to the overall traffic in the oceanic TYS (28%, in our dataset) (Coomber et al., 2016). However, we acknowledge that fishing activity is not represented completely in our analysis, as we excluded areas on the continental shelf where most of the fishing activity, including artisanal fishery, is expected to occur (Mangano et al., 2014).
High-exposure areas
Relatively high-exposure areas for loggerhead turtles to maritime activity are concentrated in the SE and CE TYS, along main shipping routes for cargo, tanker, and passenger transportation. Higher loggerhead turtle occurrences are associated with higher vessel densities during the spring/summer semester with high-exposure areas localized along the passenger transport linking the Campania Region to Sicily (Figure 5). This is likely due to the general increase in marine traffic and the fact that many passenger companies double their runs during the spring and summer months. In autumn/winter, turtles use areas with lower associated traffic, being mostly exposed to cargo and tanker transportation.
Hence, passenger, cargo, and tankers are vessel types of particular concern as they generally travel at high speeds, especially when moving in the open sea. Indeed, higher speeds potentially reduce the chance for the animal to notice the approaching vessel and dive or move away from its course and imply heavier consequences in case of collision (Schoeman et al., 2020). Studies in coastal regions suggested that green turtles are unlikely to take effective evasive action when approached by small-medium vessels at speeds exceeding 4 km/h (Hazel et al., 2007), and that vessels had to slow down to decrease the probability of severe injuries also on loggerhead turtles (Work et al., 2010). It is possible to expect that passenger ships, cargo, and tankers, which travel approximately around 28, 21, and 16 km/h, respectively (Coomber et al., 2016), have a greater likelihood for collision events compared to other vessels. Additionally, larger vessels have deeper drafts which may exceed 10 m (for cargo vessels, data from Marine Traffic–Global Ship Tracking Intelligence), implying a large potential collision zone for turtles, which might be easily pulled underneath the vessel by the suction of the huge propeller. A study based on whale vessel collisions indicated a drawing of the animal toward the hull and an increased probability of propeller strikes when the animal is below the surface at one to two times the ship’s draft at the time of the encounter (Silber et al., 2010). These forces are likely of more significance for small and slow-moving species, such as sea turtles, although details of these interactions with sea turtle species were poorly investigated, and to our knowledge reported only the study by Work et al. (2010).
Important knowledge is still missing to be able to complete a collision risk assessment of sea turtles in the Mediterranean Sea. Our seasonal exposure maps are aggregated over several years not taking into account interannual variability. Therefore, it would be appropriate to gather further long-term tracking data on sea turtle distributions to enhance the spatiotemporal analysis. Our exposure analysis illustrated where loggerhead turtles are most likely to be exposed to maritime traffic. However, it did not consider the probability that loggerhead turtles are at the surface when a vessel passes and that they are injured or killed by the collision. The dynamics of surfacing behavior in sea turtles are influenced by several factors such as life stages, habitats, and feeding strategies. Oceanic turtles which sometimes use the surface for extended periods (Hochscheid et al., 2010), may be more prone to vessel collision risk compared to turtles foraging on benthic prey in shallow waters. Interestingly, turtle C06 in Hochscheid et al., (2010), i.e., turtle T1 in this study, showed an extended surface behavior in many areas we identified as highly frequented by turtles and more exposed to vessel traffic. In this regard, a detailed surface interval assessment on a vast number of oceanic loggerhead turtles is required to investigate whether there are periods and areas of increased surface activity that might lead to a greater collision risk assessment.
Conclusions and final remarks
Our study represented a first important step to increase our knowledge of the consequences of maritime activity on oceanic loggerhead turtles in the Mediterranean Sea. Further research is urgently needed to characterize the risk of collision and the probability that collision results in lethal injuries in the high-exposure areas evidenced by our analysis.
The novelty of our study resides on the estimates of vessel exposure for sea turtles in oceanic areas where the problem has not been addressed before. In contrast, for some Mediterranean coastal areas, vessel collision incidence was already assessed by analyzing stranding data (Casale et al., 2010a), which however may contain certain biases as already explored in the introduction. Therefore, a similar approach based on tracking data could be very useful if extended to coastal areas. Indeed, coastal areas are crossed by many vessels (e.g., recreational boats and artisanal fishing boats <15 m), which are not required to carry AIS. Therefore, AIS data alone would not be adequate to describe coastal marine traffic data.
The core areas highlighted by our KDE analysis may be suitable candidates as Important Marine Turtle Areas (IMTAs) due to its role as oceanic foraging area for both large juveniles and adults, which are considered a priority conservation target for their high reproductive value (Casale et al., 2012b). Indeed, IMTAs were defined by the IUCN Marine Turtle Specialist Group as “discrete areas within existing marine turtle regional management units that are of particular biological significance for the persistence of sea turtles” (Bandimere et al., 2021).
Finally, our study also outlined the remarkable power of bio-logging technology and animal movement modeling in identifying high-use areas and potential risks for their conservation. By combining further knowledge of individual behavior and energetics, with higher-resolution environmental data (both biological and human derived), these types of modeling techniques can be used to detect individual responses to environmental disturbance and their consequences at the population level. Indeed, quantifying how, where, when, and why marine megafauna are exposed to potential threats from anthropogenic activities is considered a key goal for research to optimize management and conservation strategies (Hays et al., 2016).
Data availability statement
The datasets presented in this study can be found in online repositories. The names of the repository/repositories and accession number(s) can be found below: https://www.datarepository.movebank.org/handle/10255/move.1099 https://www.emodnet-humanactivities.eu/view-data.php Some raw data from satellite tracking of turtles are not included in the public database but can be made available upon request.
Ethics statement
This study was carried out under the authorizations notwithstanding the regulation 357/97 implementing the European Habitats Directive (92/43/EEC): Prot. 0042848/PNM of 09/08/2013, Prot. 0024471/PNM of 22/11/2016, Prot. 9033 of 03/05/2017, Prot. 0012046.05-06-2018, and Prot. 0000992.22-01-2020 of the “Ministero della Transizione Ecologica” (Ministry of the Environment) which were issued to SH for the handling and tagging of sea turtles, and was performed in accordance with the national “Guidelines for the recovery, rescue, custody and management of sea turtles forthe purposes of rehabilitation and for manipulation for scientific purposes” (ISPRA MLG 89/2013).
Author contributions
EP, MC, SH conceived the study. EP organized the database, wrote the first draft of the manuscript and produced the tables and figures. EP and MC conducted statistical analysis. SH, FM and MB conducted fieldwork. FM, MC and SH wrote sections of the manuscript. All authors contributed to the article and approved the submitted version.
Funding
Satellite tags were purchased from funds made available by the European Regional Development Fund for the CAMPANIA Region (2007/2013, D.D. n.182 29/07/2015) (tags from T6-T21), by a grant from the Natural Environment Research Council of the UK (NERC) (tag T1), and by funds made available by the Stazione Zoologica Anton Dohrn (T2-T5).
Acknowledgments
Logistics during fieldwork were supported by Filicudi Wildlife Conservation and the Marine Protected Area of the islands of Ventotene and Santo Stefano, whereas travel to and from the Aeolian field site for SH as well as satellite transmission fees were funded by personal research funds of SH made available by the Stazione Zoologica Anton Dohrn. Special thanks are due to the Director of Marine Protected Area Antonio Romano for supporting travel, subsistence, and accommodation at Ventotene island, to Gianluca Treglia, Annarita Matrone, and Chiara Bruno for their support in the fieldwork, and to the staff of the SZN marine turtle rescue center for their assistance during rehabilitation and preparation of the release of turtles. The authors are also grateful for the insightful and constructive comments offered by Dr. Clay and the 3 reviewers that greatly improved the manuscript.
Conflict of interest
The authors declare that the research was conducted in the absence of any commercial or financial relationships that could be construed as a potential conflict of interest.
Publisher’s note
All claims expressed in this article are solely those of the authors and do not necessarily represent those of their affiliated organizations, or those of the publisher, the editors and the reviewers. Any product that may be evaluated in this article, or claim that may be made by its manufacturer, is not guaranteed or endorsed by the publisher.
Supplementary material
The Supplementary Material for this article can be found online at: https://www.frontiersin.org/articles/10.3389/fmars.2022.924532/full#supplementary-material
References
Almpanidou V., Tsapalou V., Cardona L., Claro F., Hostetter P., Kaska Y., et al. (2021). Foraging grounds of loggerhead sea turtles across the Mediterranean Sea: key sites and hotspots of risk. Biodivers Conserv 31, 143–160. doi: 10.1007/s10531-021-02326-0
Awbery T., Akkaya A., Lyne P., Rudd L., Hoogenstrijd G., Nedelcu M., et al. (2022). Spatial distribution and encounter rates of delphinids and deep diving cetaceans in the Eastern Mediterranean Sea of Turkey and the extent of overlap with areas of dense marine traffic. Front. Mar. Sci 9, 860242. doi: 10.3389/fmars.2022.860242
Bandimere A., Brenner H., Casale P., Dimatteo A., Hurley B., Hutchinson B., et al. (2021). “Important marine turtle areas GUIDELINES 1.0 (August 2021),” in Prepared for the 7th burning issues workshop (BI-7) by the important marine turtle area (IMTA) working group. Available at: https://static1.squarespace.com/static/5e4c290978d00820618e0944/t/61e0557f9c2cdd4c4bec8037/1642091906570/.
Belmahi A. E., Belmahi Y., Benabdi M., Bouziani A. L., Darna S. A., Bouslah Y., et al. (2020). First study of sea turtle strandings in Algeria (western Mediterranean) and associated threats: 2016–2017. Herpetozoa 33, 113. doi: 10.3897/HERPETOZOA.33.E48541
Bentivegna F. (2002). Intra-Mediterranean migrations of loggerhead sea turtles (Caretta caretta) monitored by satellite telemetry. Mar. Biol. 141, 795–800. doi: 10.1007/s00227-002-0856-z
Bhattacharyya A. (1943). On a measure of divergence between two statistical populations defined by their probability distributions. Bull. Cal. Math. Soc. 35, 99–109.
Blasi M. F., Mattei D. (2017). Seasonal encounter rate, life stages and main threats to the loggerhead sea turtle (Caretta caretta) in the aeolian archipelago (southern thyrrenian Sea). Aquat Conserv. 1–14, 617–630. doi: 10.1002/aqc.2723
Blasi M. F., Roscioni F., Mattei D. (2016). Interaction of loggerhead turtles (Caretta caretta) with traditional fish aggregating devices (FADs) in the Mediterranean Sea. Herpetol Conserv. Biol. 11, 386–401.
Blondin H., Abrahms B., Crowder L. B., Hazen E. L. (2020). Combining high temporal resolution whale distribution and vessel tracking data improves estimates of ship strike risk. Biol. Conserv. 250, 108757. doi: 10.1016/j.biocon.2020.108757
Boehlert G. W., Genin A. (1987). “A review of the effects of seamounts on biological processes” in the seamounts, islands and atolls, ed. Wiley 43, 319–334. doi: 10.1029/GM043P0319
Bullard F. (1991). “Estimating the home range of an animal: a Brownian bridge approach,” in Master of science (Chapel Hill: University of North Carolina).
Calenge C. (2006). The package “adehabitat“ for the r software: A tool for the analysis of space and habitat use by animals. Ecol. Modell 197, 516–519. doi: 10.1016/j.ecolmodel.2006.03.017
Calenge C. (2019). “Home range estimation in r: the adehabitatHR package,” in Office national de la classe et de la faune sauvage saint benoist (France). Available at: https://cran.rproject.org/web/packages/adehabitatHR/vignettes/adehabitatHR.pdf
Camiñas J. A., Kaska Y., Hochscheid S., Casale P., Panagopoulou A., Báez J. C. (2020). “Conservation of marine turtles in the Mediterranean Sea,” in [brochure]- (Malaga, Spain: IUCN). Available at: https://www.iucn.org/sites/default/files/2022-08/conservation-of%20mediterranean_turtles_in_the_mediterranean_sea_-en-factsheet.pdf
Campana I., Angeletti D., Crosti R., Luperini C., Ruvolo A., Alessandrini A., et al. (2017). Seasonal characterisation of maritime traffic and the relationship with cetacean presence in the Western Mediterranean Sea. Mar. pollut. Bull. 115, 282–291. doi: 10.1016/j.marpolbul.2016.12.008
Campana I., Crosti R., Angeletti D., Carosso L., David L., Di-M Eglio N., et al. (2015). Cetacean response to summer maritime traffic in the Western Mediterranean Sea. Mar. Environ. Res. 109, 1–8. doi: 10.1016/j.marenvres.2015.05.009
Cannon A. C. (1998). Gross necropsy results of Sea turtles stranded on the upper Texas and Western Louisiana coasts, 1 January-31 December 1994. NOAA 143, 81–85.
Casale P. (2005). Size at Male maturity, sexing methods and adult sex ratio in loggerhead turtles (Caretta caretta) from Italian waters investigated through tail measurements. Herpetol J. 15, 145–148.
Casale P. (2015) Caretta caretta (Mediterranean subpopulation). the IUCN red list of threatened species 2015 (Accessed April 19, 2022).
Casale P., Affronte M., Insacco G., Freggi D. (2010a). Sea Turtle strandings reveal high anthropogenic mortality in Italian waters. Aquat Conserv 20, 611–620. doi: 10.1002/aqc.1133
Casale P., Affronte M., Scaravelli D., Lazar B., Vallini C., Luschi P. (2012a). Foraging grounds, movement patterns and habitat connectivity of juvenile loggerhead turtles (Caretta caretta) tracked from the Adriatic Sea. Mar. Biol. 159, 1527–1535. doi: 10.1007/s00227-012-1937-2
Casale P., Broderick A. C., Camiñas J. A., Cardona L., Carreras C., Demetropoulos A., et al. (2018). Mediterranean Sea turtles: Current knowledge and priorities for conservation and research. Endanger Species Res. 36, 229–267. doi: 10.3354/esr00901
Casale P., Broderick A. C., Freggi D., Mencacci R., Fuller W. J., Godley B. J., et al. (2012b). Long-term residence of juvenile loggerhead turtles to foraging grounds: A potential conservation hotspot in the Mediterranean. Aquat Conserv. 22, 144–154. doi: 10.1002/aqc.2222
Casale P., Margaritoulis D. (2010b). “Sea Turtles in the Mediterranean: Distribution, threats and conservation priorities,” (Gland, Switzerland: IUCN). Available at: .
Cates K., Brownell R., Silber G., Ritter F., Cates K., Demaster D. P., et al. (2017). “Strategic plan to mitigate the impacts of ship strikes on cetacean populations: 2017-2020,” Report SC/66/CC20 presented to the Scientific Committee of the International Whaling ommission (IWC). Available at: https://www.researchgate.net/publication/332539367.
Chaloupka M., Work T. M., Balazs G. H., Murakawa S. K. K., Moris. R. (2008). Cause-specific temporal and spatial trends in green sea turtle strandings in the Hawaiian archipelag-2003). Mar. Biol. 154, 887–898. doi: 10.1007/s00227-008-0981-4
Chatzimentor A., Almpanidou V., Doxa A., Dimitriadis C., Mazaris A. D. (2021). Projected redistribution of sea turtle foraging areas reveals important sites for conservation. Climate Change Ecol. 2, 100038. doi: 10.1016/j.ecochg.2021.100038
Chimienti M., Blasi M. F., Hochscheid S. (2020). Movement patterns of large juvenile loggerhead turtles in the Mediterranean Sea: Ontogenetic space use in a small ocean basin. Ecol. Evol. 10, 6978–6992. doi: 10.1002/ece3.6370
Cook M., Reneker J. L., Nero R. W., Stacy B. A., Hanisko D. S., Wang Z. (2021). Use of drift studies to understand seasonal variability in Sea turtle stranding patterns in Mississippi. Front. Mar. Sci. 8. doi: 10.3389/fmars.2021.659536
Coomber F. G., D’Incà M., Rosso M., Tepsich P., Notarbartolo di Sciara G., Moulins A. (2016). Description of the vessel traffic within the north pelagos sanctuary: Inputs for marine spatial planning and management implications within an existing international marine protected area. Mar. Policy 69, 102–113. doi: 10.1016/j.marpol.2016.04.013
Danovaro R., Boero F. (2018). “Italian Seas,” in World seas: An environmental evaluation: Volume I: Europe, the americas and West Africa. Ed. Sheppard C. (London: Elsevier, Academic Press), 283–305.
David L., Alleaume S., Guinet C. (2011). Evaluation of the potential of collision between fin whales and maritime traffic in the north-western Mediterranean Sea in summer, and mitigation solutions. JMATE 4, 17–28. doi: 10.1371/journal.pone.0063396
Dimitriadis C., Mazaris A. D., Katsanevakis S., Iosifakis A., Spinos E., Kalli E., et al. (2022). Stranding records and cumulative pressures for sea turtles as tools to delineate risk hot spots across different marine habitats. Ocean Coast. Manag 217, 106017. doi: 10.1016/j.ocecoaman.2021.106017
di Pepe L. S., Tribe C. J. (2009). Risks from maritime traffic to biodiversity in the Mediterranean Sea identification of issues and possible responses (IUCN).
Dujon A. M., Lindstrom R. T., Hays G. C. (2014). The accuracy of fastloc-GPS locations and implications for animal tracking. Methods Ecol. Evol. 5 (11), 1162–1169. doi: 10.1111/2041-210X.12286
Dujon A. M., Schofield G., Lester R. E., Esteban N., Hays G. C. (2017). Fastloc-GPS reveals daytime departure and arrival during long-distance migration and the use of different resting strategies in sea turtles. Mar. Biol. 164, 187. doi: 10.1007/s00227-017-3216-8
EMODnet Human Activities. Available at: https://www.emodnet-humanactivities.eu/ (Accessed April 19, 2022).
Fiori C., Paoli C., Alessi J., Mandich A., Vassallo P. (2016). Seamount attractiveness to top predators in the southern tyrrhenian Sea (central Mediterranean). J. Mar. Biolog Assoc. UK 96, 769–775. doi: 10.1017/S002531541500171X
Fixed Line Transect Mediterranean monitoring Network- marine species and threats (FLT med net) — italiano. Available at: https://www.isprambiente.gov.it/it/attivita/biodiversita/ispra-e-la-biodiversita/attivita-e-progetti/flt-mediterranean-monitoring-network-marine-species-and-threats (Accessed April 19, 2022).
Foley A. M., Stacy B. A., Hardy R. F., Shea C. P., Minch K. E., Schroeder B. A. (2019). Characterizing watercraft-related mortality of sea turtles in florida. J. Wild 83, 1057–1072. doi: 10.1002/jwmg.21665
Freitas C. (2012) Argosfilter: Argos locations filter. Available at: https://CRAN.R-project.org/package=argosfilter (Accessed September 15, 2022).
Grossi F., Lahaye E., Moulins A., Borroni A., Rosso M., Tepsich P. (2021). Locating ship strike risk hotspots for fin whale (Balaenoptera physalus) and sperm whale (Physeter macrocephalus) along main shipping lanes in the north-Western Mediterranean Sea. Ocean Coast. Manag 212. doi: 10.1016/j.ocecoaman.2021.105820
Hart K. M., Mooreside P., Crowder L. B. (2006). Interpreting the spatio-temporal patterns of sea turtle strandings: Going with the flow. Biol. Conserv. 129, 283–290. doi: 10.1016/J.BIOCON.2005.10.047
Hays G. C., Christensen A., Fossette S., Schofield G., Talbot J., Mariani P. (2014). Route optimisation and solving zermelo’s navigation problem during long distance migration in cross flows. Ecolo Lett. 17, 137–143. doi: 10.1111/ELE.12219
Hays G. C., Ferreira L. C., Sequeira A. M. M., Meekan M. G., Duarte C. M., Bailey H., et al. (2016). Key questions in marine megafauna movement ecology. Trends Ecol. Evol. 31, 463–475. doi: 10.1016/j.tree.2016.02.015
Hazel J., Gyuris E. (2006). Vessel-related mortality of sea turtles in Queensland, Australia. Wild Res. 33, 149–154. doi: 10.1071/WR04097
Hazel J., Lawler I., Marsh H., Robson S. (2007). Vessel speed increases collision risk for the green turtle chelonia mydas. Endanger Species Res. 3, 105–113. doi: 10.3354/esr003105
Hochscheid S. (2014). Why we mind sea turtles’ underwater business: A review on the study of diving behavior. J. Exp. Mar. Biol. Eco 450, 118–136. doi: 10.1016/J.JEMBE.2013.10.016
Hochscheid S., Bentivegna F., Hamza A., Hays G.C. (2010) When surfacers do not dive: Multiple significance of extended surface times in marine turtles. J. Exp. Biol. 213, 1328–1337. doi: 10.1242/jeb.037184
Horne J. S., Garton E. O., Krone S. M., Lewis J. S. (2007). Analyzing animal movements using Brownian bridges. Ecol 88, 2354–2363. doi: 10.1890/06-0957.1
Iacono R., Napolitano E., Palma M., Sannino G. (2021). The tyrrhenian sea circulation: A review of recent work. Sustainability (Switzerland) 13. doi: 10.3390/su13116371
Italiano F., Caso C., Cavallo A., Favali P., Fu C., Iezzi G., et al. (2011). “Geochemical features of the gas phase extracted from sea-water and rocks of the marsili seamount,” i(Tyrrhenian sea, Italy): Implications for geothermal exploration projects. In Proceedings of the ICGG11, International Conference on Gas Geochemistry, San Diego, CA, USA, 28 November–4 December 2011.
Jepson P. D. (2005) Trends in cetacean strandings around the U.K. coastline and cetacean and marine turtle post-mortem investigation To 2004. inclusive (Contract CRO 238). department for environment, food and rural affairs, Bristol. Available at: https://www.scirp.org/(S(351jmbntvnsjt1aadkozje))/reference/referencespapers.aspx?referenceid=2197878 (Accessed April 19, 2022).
Johnson D. S., London J. M., Lea M. A., Durban J. W. (2008). Continuous-time correlated random walk model for animal telemetry data. Ecol 89, 1208–1215. doi: 10.1890/07-1032.1
Laist D. W., Knowlton A. R., Mead J. G., Collet A. S. (2001). Collisions between ships and whales. Mar. Mamm Sci. 17, 35–75. doi: 10.1111/j.1748-7692.2001.tb00980.x
UNEP/MAP (2017). “Mediterranean Quality status report,” Available at: https://www.medqsr.org/sites/default/files/inline-files/2017MedQSR_Online_0.pdf.
Lloyd’s Marine Intelligence Unit (2008). Study of maritime traffic flows in the Mediterranean Sea. Regional marine pollution emerg. Response Cent. Mediterr. Sea. 1-39. Available at: http://mmla.org.mt/wp%20content/uploads/2015/07/Study-of-Maritime-Traffic-Flows-in-the-Mediterranean-Sea.pdf
Loisier A., Savelli M. P., Arnal V., Claro F., Gambaiani D., Sénégas J. B., et al. (2021). Genetic composition, origin and conservation of loggerhead sea turtles (Caretta caretta) frequenting the French Mediterranean coasts. Mar. Biol. 168, 52. doi: 10.1007/S00227-021-03855-6
Luschi P., Casale P. (2014). Movement patterns of marine turtles in the Mediterranean Sea: a review. Ital J. Zool 81, 478–495. doi: 10.1080/11250003.2014.963714
Luschi P., Mencacci R., Cerritelli G., Papetti L., Hochscheid S. (2018). Large-Scale movements in the oceanic environment identify important foraging areas for loggerheads in central Mediterranean Sea. Mar. Biol. 165, 4. doi: 10.1007/s00227-017-3255-1
Mangano M. C., Kaiser M. J., Porporato E. M. D., Lambert G. I., Rinelli P., Spanò N. (2014). Research papers. Cont. Shelf Res. 76, 25–35. doi: 10.1016/J.CSR.2013.12.014
Margaritoulis D., Demetropoulos A. (2003). Proceedings of the first Mediterranean conference on marine turtles (Nicosia, Cyprus: Barcelona Convention – Bern Convention – Bonn Convention (CMS), 270.
Marine Traffic Global Ship Tracking Intelligence | AIS marine traffic. Available at: https://www.marinetraffic.com/en/ais/home/centerx:9.9/centery:41.5/zoom:6 (Accessed April 19, 2022).
McClintock B. T., Michelot T. (2018). momentuHMM: R package for generalized hidden Markov models of animal movement. Methods Ecol. Evol. 9 (6), 1518–1530. doi: 10.1111/2041-210X.12995
McClintock B. T., Russell D. J. F., Matthiopoulos J., King R. (2013). Combining individual animal movement and ancillary biotelemetry data to investigate population-level activity budgets. Ecol 94, 838–849. doi: 10.1890/12-0954.1
McConnell B.J., Chambers C., Fedak M. A. (1992). Foraging ecology of southern elephant seals in relation to the bathymetry and productivity of the Southern Ocean. Antarct. Sci. 4, 393–398. doi: 10.1017/S0954102092000580
Meager J. J. (2016). “Marine wildlife stranding and mortality database annual report 2013-2015,” in Dugong. conservation technical and data report, vol. 2. , 1–22. Available at: https://www.qld.gov.au/__data/assets/pdf_file/0016/202336/dugong-report-2013-15.pdf.
Melo-Merino S. M., Reyes-Bonilla H., Lira-Noriega A. (2020). Ecological niche models and species distribution models in marine environments: A literature review and spatial analysis of evidence. Ecol. Model. 415, 108837. doi: 10.1016/j.ecolmodel.2019.108837
Mingozzi T., Mencacci R., Cerritelli G., Giunchi D., Luschi P. (2016). Living between widely separated areas: Long-term monitoring of Mediterranean loggerhead turtles sheds light on cryptic aspects of females spatial ecology. J. Exp. Mar. Biol. Ecol. 485, 8–17. doi: 10.1016/j.jembe.2016.08.007
Morato T., Hoyle S. D., Allain V., Nicol S. J. (2010). Seamounts are hotspots of pelagic biodiversity in the open ocean. Proc. Nat. Acad. Sci. 107 (21), 9707–9711. doi: 10.1073/pnas.0910290107
Morato T., Varkey D. A., Damaso C., Machete M., Santos M., Prieto R., et al. (2008). Evidence of a seamount effect on aggregating visitors. Mar. Ecol. Prog. Ser. 357, 23–32. doi: 10.3354/MEPS07269
Nichol L. M., Wright B. M., O’Hara P., Ford J. K. B. (2017). Risk of lethal vessel strikes to humpback and fin whales off the west coast of Vancouver island, Canada. Endang Species Res. 32, 373–390. doi: 10.3354/esr00813
Orós J., Torrent A., Calabuig P., Déniz S. (2005). Diseases and causes of mortality among sea turtles stranded in the canary islands, spai–2001). Dis. Aquat Org 63, 13–24. doi: 10.3354/DAO063013
Panigada S., Pesante G., Zanardelli M., Capoulade F., Gannier A., Weinrich M. T. (2006). Mediterranean Fin whales at risk from fatal ship strikes. Mar. pollut. Bull. 52, 1287–1298. doi: 10.1016/J.MARPOLBUL.2006.03.014
Pennino M. G., Arcangeli A., Prado Fonseca V., Campana I., Pierce G. J., Rotta A., et al. (2017). A spatially explicit risk assessment approach: Cetaceans and marine traffic in the pelagos sanctuary (Mediterranean Sea). PLoS One 12, e0179686. doi: 10.1371/JOURNAL.PONE.0179686
Piante C., Ody D. (2015). “Blue growth in the Mediterranean Sea: the challenge of good environmental status,” in MedTrends project (WWF-France), 192. Available at: https://d2ouvy59p0dg6k.cloudfront.net/downloads/medtrends_regional_report.pdf.
Plan Bleu (2014). “Economic and social analysis of the uses of the coastal and marine waters in the Mediterranean,” in Characterization and impacts of the fisheries, aquaculture, tourism and recreational activities, maritime transport and offshore extraction of oil and gas sector (Valbonne: Technical Report, Plan Bleu), 137. Available at: https://planbleu.org/sites/default/files/publications/esa_ven_en.pdf.
Randone M., Bocci M., Castellani C., Laurent C., Piante C. (2019). Safeguarding marine protected areas in the growing Mediterranean blue economy-recommendations for the maritime transport sector. Int. J. @ Des. Nat. Ecodynamics 14, 264–274. doi: 10.2495/DNE-V14-N4-264-274
Schoeman R. P., Patterson-Abrolat C., Plön S. (2020). A global review of vessel collisions with marine animals. Front. Mar. Sci. 7. doi: 10.3389/fmars.2020.00292
Schofield G., Hobson V. J., Fossette S., Lilley M. K. S., Katselidis K. A., Hays G. C. (2010). Biodiversity research: Fidelity to foraging sites, consistency of migration routes and habitat modulation of home range by sea turtles. Divers. Distrib 16, 840–853. doi: 10.1111/J.1472-4642.2010.00694.X
Silber G. K., Slutsky J., Bettridge S. (2010). Hydrodynamics of a ship/whale collision. J. Exp. Mar. Biol. Ecol. 391, 10–19. doi: 10.1016/j.jembe.2010.05.013
Silber G. K., Weller D. W., Reeves R. R., Adams J. D., Moore T. J. (2021). Co-Occurrence of gray whales and vessel traffic in the north pacific ocean. Endanger Species Res. 44, 177–201. doi: 10.3354/ESR01093
Smith J. N., Kelly N., Childerhouse S., Redfern J. V., Moore T. J., Peel D. (2020). Quantifying ship strike risk to breeding whales in a multiple-use marine park: the great barrier reef. Front. Mar. Sci. 7. doi: 10.3389/fmars.2020.00067
Sparks L. M., DiMatteo A. D. (2020). Loggerhead Sea turtle density in the Mediterranean Sea. NUWC-NPT Tech. Rep. 12 360, 77.
Tomás J., Gozalbes P., Raga J., Godley B. (2008). Bycatch of loggerhead sea turtles: insights from 14 years of stranding data. Endanger Species Res. 5, 161–169. doi: 10.3354/ESR005161
Uçar A. H., Maffucci F., Ergene S., Ergene M., Katılmış Y., Başkale E., et al. (2018) A stranded loggerhead turtle tracked by satellite in mersin bay, Eastern Mediterranean Sea, Turkey (Accessed April 19, 2022).
UNEP-MAP RAC/SPA (2019). Guidelines for the establishment and management of marine protected areas for cetaceans. Ed. Notarbartolo di Sciara G. (Tunis: ACCOBAMS-RAC/SPA), 36.
Union for the Mediterranean (2021) Towards a sustainable blue economy in the Mediterranean region. Available at: https://ufmsecretariat.org/wp-content/uploads/2021/07/21.7.19-2021UfM.studydefEN-web.pdf.
Vanderlaan A. S. M., Taggart C. T., Serdynska A. R., Kenney R. D., Brown M. W. (2008). Reducing the risk of lethal encounters: Vessels and right whales in the bay of fundy and on the scotian shelf. Endanger Species Res. 4, 283–297. doi: 10.3354/ESR00083
Williams R., O’Hara P. (2010). Modelling ship strike risk to fin, humpback and killer whales in British Columbia, Canada. J. Cetacean Res. Manag 11, 1–8.
Winkler C., Panigada S., Murphy S., Ritter F. (2020). Global numbers of ship strikes: An assessment of collisions between vessels and cetaceans using available data in the IWC ship strike database (Report to the International Whaling Commission, IWC/68B/SC HIM09), 33.
Wood S. N. (2011). Fast stable restricted maximum likelihood and marginal likelihood estimation of semiparametric generalized linear models. J. R Stat. Soc. Ser. B Stat. Methodol 73, 3–36. doi: 10.1111/J.1467-9868.2010.00749.X
Work T. M., Balazs G. H., Summers T. M., Hapdei J. R., Tagarino A. P. (2015). Causes of mortality in green turtles from Hawaii and the insular pacific exclusive of fibropapillomatosis. Dis. Aquat Org 115, 103–110. doi: 10.3354/DAO02890
Work P. A., Sapp A. L., Scott D. W., Dodd M. G. (2010). Influence of small vessel operation and propulsion system on loggerhead sea turtle injuries. J. Exp. Mar. Biol. Ecol. 393, 168–175. doi: 10.1016/j.jembe.2010.07.019
Zampollo A., Arcangeli A., Costantino M., Mancino C., Crosti R., Pietroluongo G., et al. (2022). Seasonal niche and spatial distribution modelling of the loggerhead (Caretta caretta) in the Adriatic and Ionian seas. Aquat. Conservation: Mar. Freshw. Ecosyst, 32, 1141–1155. doi: 10.1002/aqc.3815
Zbinden J. A., Bearhop S., Bradshaw P., Gill B., Margaritoulis D., Newton J., et al. (2011). Migratory dichotomy and associated phenotypic variation in marine turtles revealed by satellite tracking and stable isotope analysis Mar. Ecol. Progr Ser. 421, 291–302. doi: 10.3354/MEPS08871
Keywords: Sea turtle, vessel collisions, Mediterranean Sea, satellite tracking, marine traffic, home range, exposure analysis
Citation: Pasanisi E, Chimienti M, Blasi MF, Maffucci F and Hochscheid S (2022) Ocean highways in the Western Mediterranean: Which are the areas with increased exposure to maritime traffic for loggerhead turtles? Front. Mar. Sci. 9:924532. doi: 10.3389/fmars.2022.924532
Received: 20 April 2022; Accepted: 22 August 2022;
Published: 23 September 2022.
Edited by:
Tommy Clay, Environmental Defense Fund, United StatesReviewed by:
Luciana C. Ferreira, Australian Institute of Marine Science (AIMS), AustraliaMarc Fernandez, Agência Regional para o Desenvolvimento da Investigação Tecnologia e Inovação (ARDITI), Portugal
Antonios D. Mazaris, Aristotle University of Thessaloniki, Greece
Copyright © 2022 Pasanisi, Chimienti, Blasi, Maffucci and Hochscheid. This is an open-access article distributed under the terms of the Creative Commons Attribution License (CC BY). The use, distribution or reproduction in other forums is permitted, provided the original author(s) and the copyright owner(s) are credited and that the original publication in this journal is cited, in accordance with accepted academic practice. No use, distribution or reproduction is permitted which does not comply with these terms.
*Correspondence: Sandra Hochscheid, sandra.hochscheid@szn.it