 Mimi W. Tzeng
- 1Institute of Marine Science, University of Auckland, Auckland, New Zealand
- 2Coastal and Freshwater Group, Cawthron Institute, Nelson, New Zealand
Globally, movements of commercial vessels can facilitate the spread of marine non-indigenous species (NIS) beyond their current biogeographic ranges. Authorities at potential destination locations employ a number of biosecurity risk assessment strategies to estimate threat levels from potential origin locations, vulnerability levels of specific destination regions, or the consequences of successful establishment of particular NIS species. Among the many factors and processes that have an influence on the probability that NIS will survive transport and establish successfully at new locations, vessel type has been identified as an important risk factor. Different vessel types have different structural and operational characteristics that affect their overall level of marine biosecurity risk. Several recent studies have examined subsets of vessel types or vessel characteristics for their ability to spread NIS. While high-quality information is available via these endeavors, it is fragmented and not readily available as an integrated resource to support biosecurity regulators or other end-users. In this study, we synthesize available empirical data on a wide range of vessel types and characteristics to develop a framework that allows systematic quantification of the relative risk of NIS transfer by common commercial vessel types. We explain our approach for constructing the framework, from selection of key risk factors for inclusion, to selection of which datasets to use for those risk factors. The framework output is a set of risk scores which denote the relative biosecurity risk of common commercial vessel types. To demonstrate a potential application of our framework, we applied the risk scores to vessel visit data for commercial ports around New Zealand and assigned a relative risk level per port based on the arrival frequencies of different vessel types. The resulting per-port risk levels matched closely with the results of a prior benchmark study that employed state-of-the-art risk modeling approaches. Our framework is based on globally relevant data, is simple to implement, and is adaptable as new empirical information arises. It can serve as a simple tool to determine the relative levels of vessel-related biosecurity risk associated with geographic shipping hubs, or it can be used as a vessel-specific “risk mask” for maritime transport models. It can be applied to any scientific or policy question that requires information on vessel type differences in relation to marine biosecurity risk.
Introduction
Over 90% of global trade is carried out by maritime shipping. As of 2019, the global merchant fleet included 95,402 vessels (mostly tankers, bulk carriers, container and general cargo vessels) with a cargo carrying capacity of 1.97 billion deadweight tons (UNCTAD, 2019).
Along with intended cargo, maritime vessels also provide a means for coastal marine organisms to move to locations beyond their natural ranges (Ruiz et al., 1997), mainly in either the internal ballast water tanks or as biofouling on the submerged external surfaces of the hull (Molnar et al., 2008; Hewitt et al., 2009). Once established at new locations, these non-indigenous species (NIS) can have harmful ecological, economic and cultural impacts (Molnar et al., 2008; Katsanevakis et al., 2014; Ojaveer et al., 2018). To prevent or manage the harmful impacts associated with NIS, national and regional authorities at potential destination locations employ a number of biosecurity risk assessment strategies to identify the level of biosecurity threat associated with various global origin locations, identify “hotspot” areas with higher incursion probabilities nationally or regionally, or estimate the likelihood and potential consequences of introduction and establishment of particular NIS (Hewitt and Campbell, 2007; Bradie and Leung, 2015).
Many factors and processes have an influence on the probability that NIS will survive transport and establish successfully at new locations, including vessel-related factors such as the structural configurations and operational characteristics of the maritime vessels providing transport, voyage-related factors that affect mortality rate during transport from origin to destination due to voyage duration and path (Verling et al., 2005; Zaiko et al., 2020), and environmental similarity between origin and destination (Keller et al., 2011). For the first step of NIS transfer, a number of previous studies, including surveys of expert opinion (Cheng et al., 2019) and analyses of empirical datasets (Kaluza et al., 2010; Clarke et al., 2017), have identified a suite of important vessel-related risk factors, which can be grouped collectively by vessel type.
Dozens of different vessel types are used to transport cargo, as well as for other maritime purposes including research, recreation, fishing, and military (Stopford, 2009). Their technical, structural, operational, and maintenance-related characteristics vary widely and include differences in size and shape, average speed, movement and maintenance patterns, the proportion and configurations of ballast tanks and hull niche areas, ballast discharge behavior, and other relevant factors (Davidson et al., 2018). Individually and combined, these differences affect the rate of entrainment of organisms via ballast water or biofouling, their mortality rates in transit, their release at voyage destinations and, ultimately, the marine biosecurity risk posed by individual vessels.
Efforts have been made to determine and describe key differences among particular vessel types and the implications for their capacity to transport marine organisms. For species transport via biofouling, hull wetted surface area (Davidson et al., 2006; Moser et al., 2016) and hull niche area configuration and extent (Moser et al., 2017) have been quantified for eight common vessel types of the global merchant fleet, as a way to estimate the maximum potential surface area available to biofouling organisms globally. For vessel type biofouling differences in NIS density, diversity, and abundance, an analysis of survey data from ten vessel types was conducted in New Zealand (Inglis et al., 2010), and data are available for sea chests (a particularly high-risk niche area) from seven vessel types that were sampled in Canada (Frey et al., 2014). No significant differentiation of biofouling assemblages were found among vessel types, but the studies provide valuable information on biofouling patterns which can be used in further meta-analyses.
Similar efforts have been made to characterize risks related to species transport via ballast water in different vessel types. Bulkers and tankers have been found to have the highest ballast water discharge frequency and volume, based on data from vessels visiting the United States (Davidson et al., 2018) and New Zealand (Hatami et al., 2021). A compilation of previous literature mentions of ballast capacity by vessel type, dating back to 1985, indicates a long-standing interest in data toward this relationship (David et al., 2012). Qualitative ratings of the relative importance of various risk factors have also been proposed for both biofouling and ballast water, and for both vessel type independent and dependent risk factors (Davidson et al., 2018).
Given the increasing importance of marine biosecurity in coastal policy and conservation, there is need for a synthesis of all known, reliable information about vessel-based marine biosecurity risk into a universal quantification system. The development and application of such a tool would allow expedience to regulatory and policy decisions that require risk information based on vessel type. Here we propose a framework, which integrates the best available empirical knowledge of biosecurity risk factors associated with different vessel types across the two main transport mechanisms of marine NIS by ocean-going vessels, i.e., ballast water and hull biofouling, using data from the above-mentioned studies. The framework could be used in conjunction with other risk assessment tools or strategies that account for non-vessel-based marine biosecurity risk factors, such as those related to specific origins, destinations, voyage paths, or NIS species, to estimate total marine biosecurity risk in any given scenario.
To assess the robustness of the framework and demonstrate a potential application, we used it to examine relative biosecurity risk associated with commercial ports around New Zealand, and compared our results to “benchmark” data from a preceding state-of-the-art risk assessment based on complex statistical models.
Methods
The framework for quantifying vessel type dependent marine biosecurity risks was developed considering three main constituents: vessel types, marine biosecurity risk factors, and data sources that include data on one or more risk factors by vessel type. To construct the framework, we: (a) selected vessel types, (b) selected risk factors, (c) selected data values for each combination of vessel type and risk factor, (d) rescaled data values for each risk factor from 0 to 1 by standardizing to the maximum value, (e) multiplied the rescaled data values by an importance rating, and (f) added together the weighted rescaled data values for all risk factors to derive an overall vessel type risk score (Figure 1). In the following subsections, we explain in detail how each of these steps were handled.
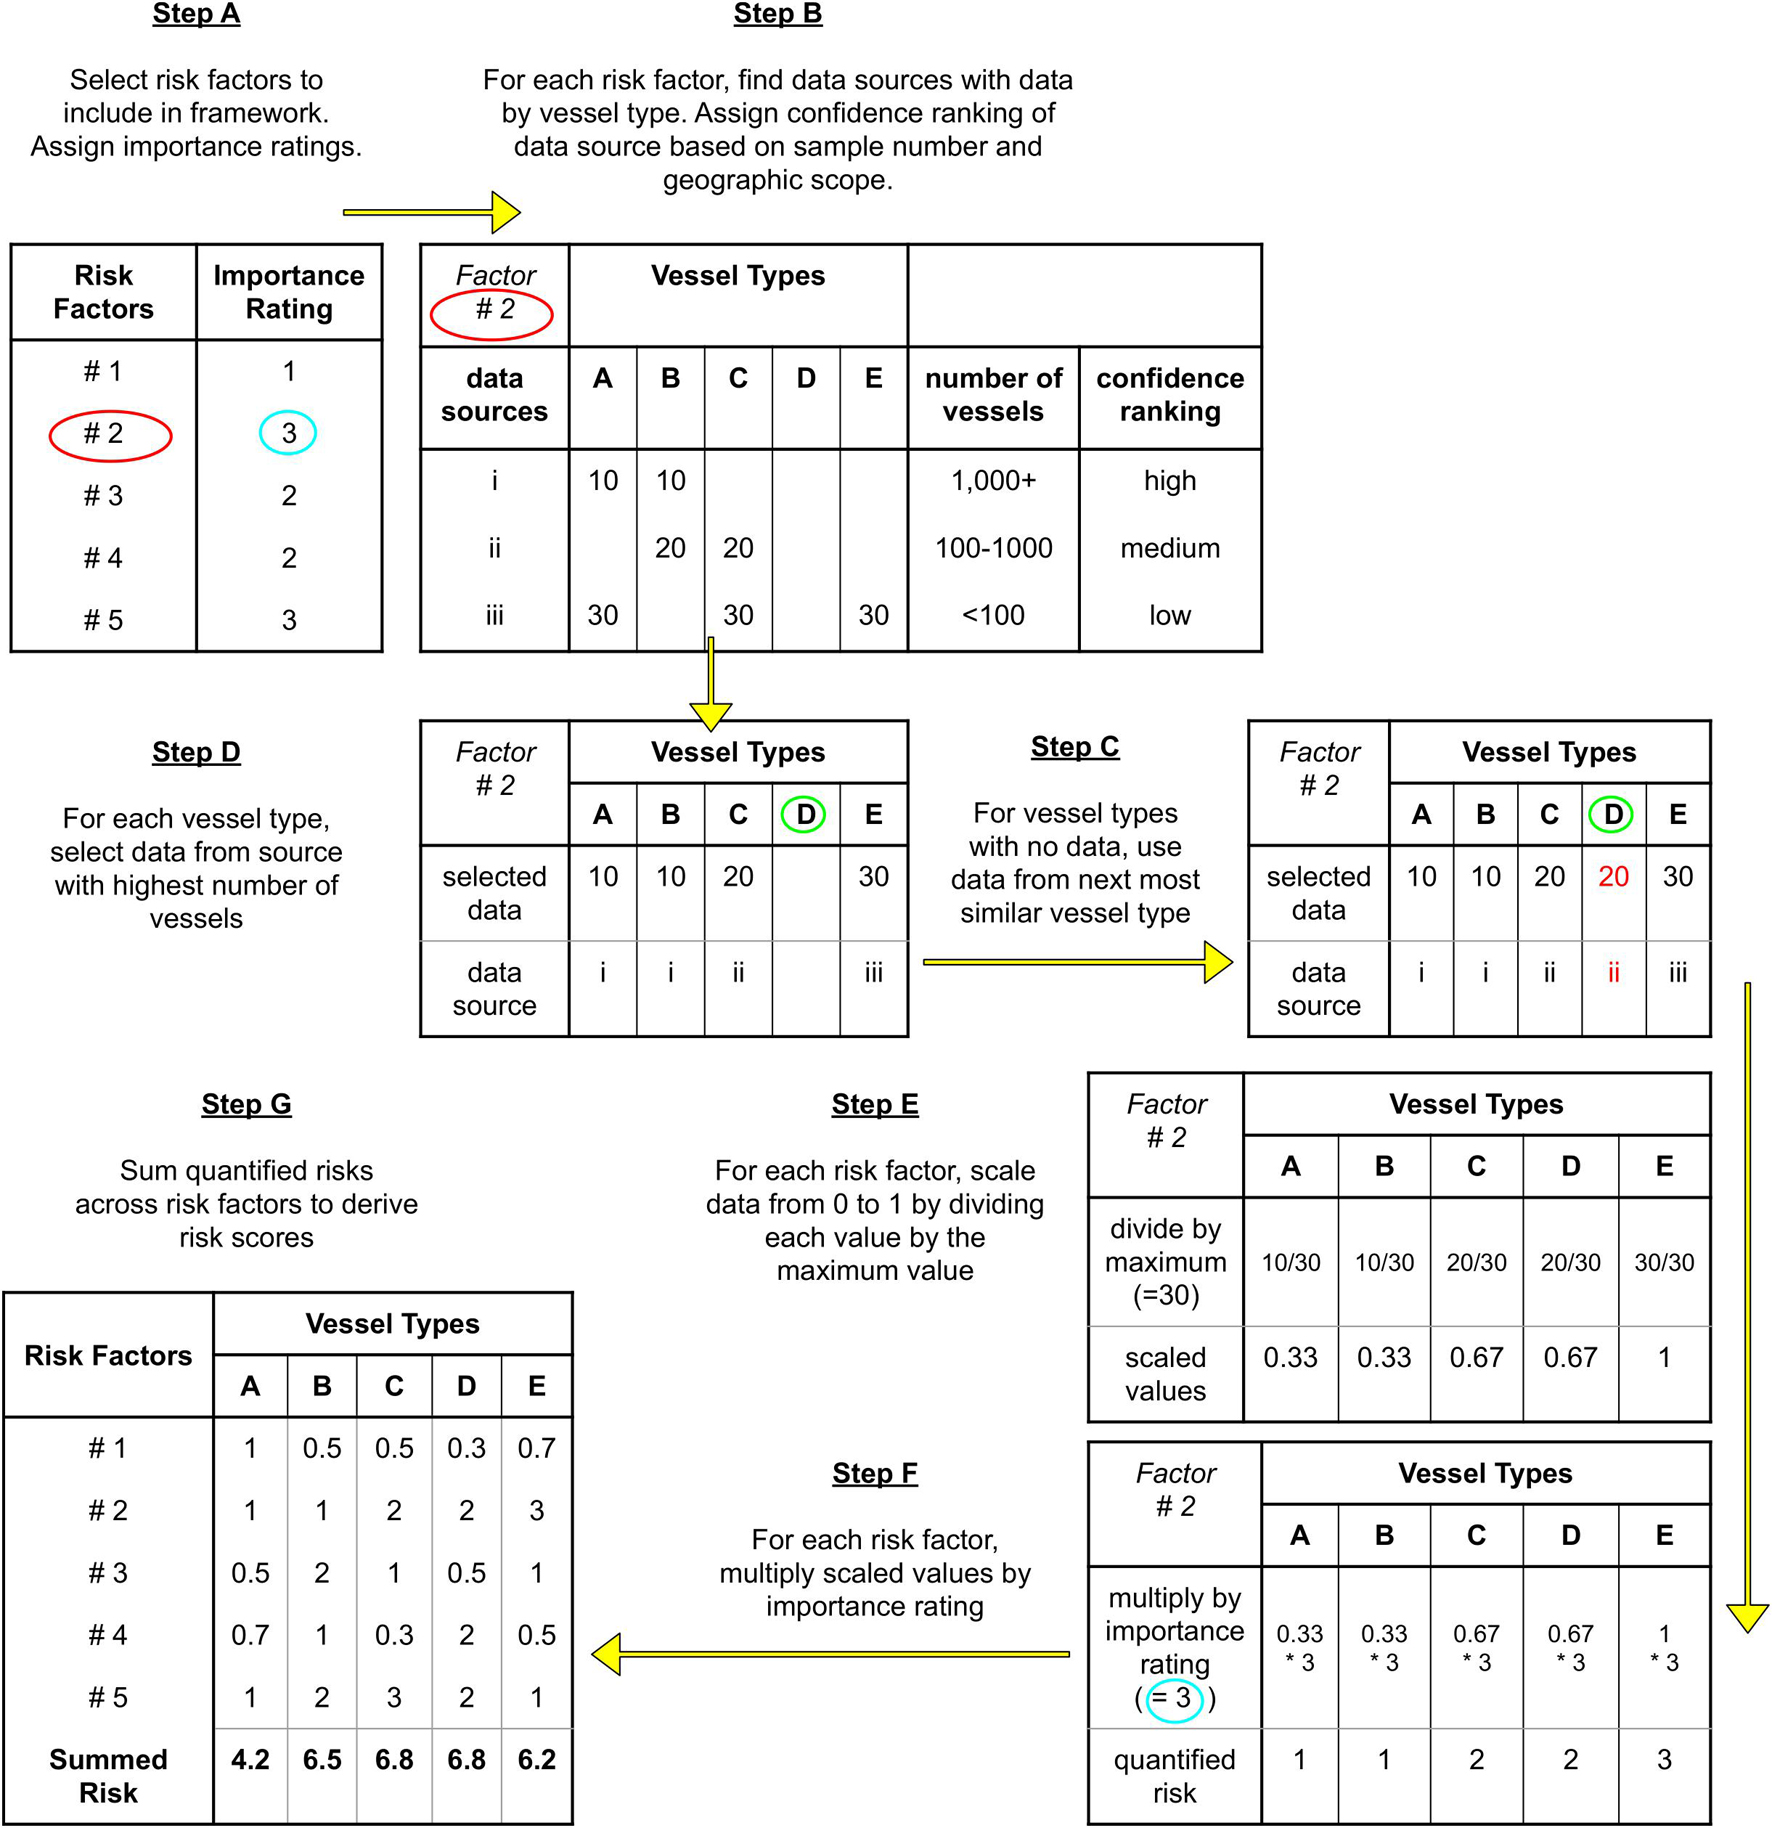
Figure 1. An overview of the seven-step methodology that we used to populate the vessel biosecurity risk framework with data from empirical sources. Numbers in this overview are examples only, to demonstrate the data selection process and calculations. Colored circles are provided to help with tracking links between the steps. Individual steps (A–F) are described in detail in the main text.
Selection of Vessel Types
We selected vessel types to include in the framework with an aim to be comprehensive of the global merchant fleet. Our selections were based partly on the merchant vessel classification of Stopford (2009, Figure 14.1) and partly on which vessel types were included in our data sources. The finalized selection includes 11 vessel types for which we could find data: general cargo (GEN), bulk carriers (BLK), general tankers (TNK), container vessels (CON), roll-on roll-off (RRO), refrigerated bulk carriers or reefers (RFR), liquified gas tankers (LQG), heavy lift vessels (HVY), passenger vessels (PSS), livestock carriers (LSC), and fishing vessels (FSN).
Selection of Marine Biosecurity Risk Factors
To select risk factors (Figure 1A), we modified the list of vessel type dependent factors from those proposed in Davidson et al. (2018). In the following subsections on Biofouling Risk Factors and Ballast Water Risk Factors, we describe each risk factor we selected in more detail.
Biofouling Risk Factors
Hull wetted surface area (WSA) is a measure of the total underwater surfaces of a vessel’s hull. For biofouling organisms, it directly represents the amount of substrate available for colonization. Mathematical equations incorporating a range of vessel dimensions (e.g., total length, beam, draft) have been established in previous studies for calculating WSA for all major vessel types (Davidson et al., 2006; Inglis et al., 2010; Moser et al., 2016).
Complexity of hull WSA is the proportion of hull niche areas relative to overall WSA. Hull niche areas tend to have higher rates of biofouling than the main parts of the hull due to reduced exposure to the hydrodynamic effects of a moving vessel or the inability to apply antifouling coatings to some types of niche areas, such as drydock support areas (Coutts and Taylor, 2004; Davidson et al., 2009; Inglis et al., 2010). The most comprehensive assessment of hull WSA complexity in the global merchant fleet to date (Moser et al., 2017) was used as our primary data source.
Port duration is the amount of time between arrival and departure of a vessel from the vicinity of a port, much of it spent docked while loading or unloading cargo. Port duration is partly based on the type of cargo carried by the vessel, and is therefore vessel type dependent (Davidson et al., 2018). Longer port durations allow organisms more opportunity both to colonize the hull and to recruit from the hull to surrounding waters and port structures. Data for port duration by vessel type are available from Inglis et al. (2010); Frey et al. (2014), and Davidson et al. (2018).
Typical speed is the average speed of the vessel at sea. Different vessel types are optimized for different speeds based on cargo type (Stopford, 2009). Higher speed increases the magnitude of hydrodynamic forces, which reduces retention and survival rates of attached organisms during the voyage (e.g., Coutts et al., 2009, 2010). Our main data sources for typical speed by vessel type were Inglis et al. (2010) and Davidson et al. (2018).
Amount of biofouling can be considered a direct measurement of the associated biosecurity risk, as it is presumed proportional to the amount of potential NIS accumulated on a vessel hull (Inglis et al., 2010), although this will also depend on the vessel’s voyage history. It is often related to other factors, such as type and age of antifouling coatings, hull maintenance practices, length of lay-up periods, and other structural and operational vessel characteristics. Direct sampling of biofouling extent and distribution has been undertaken by various studies using scuba divers, underwater drones, or drydock surveys (e.g., Coutts and Taylor, 2004; Davidson et al., 2009). Comprehensive biofouling data by vessel type are available from Inglis et al. (2010) and Frey et al. (2014).
Ballast Water Risk Factors
Ballast water capacity is the maximum volume of ballast water that a vessel can carry. For organisms transported in ballast tanks, ballast water capacity is more relevant than overall vessel size because larger volumes of ballast water can carry more organisms. Although general vessel size parameters are easy to obtain and therefore often used in risk assessments, ballast capacity data are also available from large databases, such as the National Ballast Information Clearinghouse (National Ballast Information Clearinghouse, 2021).
For ballast water capacity by vessel type, we collected vessel data from NBIC for the first 100 visits to each port of the United States in 2014, resulting in data for 4,802 unique vessels (based on IMO number). The year 2014 was chosen because some of the ballast discharge frequency and volume data used in this study (see below) were also from NBIC for 2014. Data include vessel type, ballast capacity in metric tons (mt), and gross tonnage (GT) for each vessel, from which we calculated average ballast capacity per vessel type (see Supplementary Material).
It has not previously been established with systematic evidence whether ballast water capacity is proportional to vessel size, or whether and how the proportion varies by vessel type. To ascertain whether proportion variations are consistent by vessel type, we calculated ballast capacity as a proportion of tonnage (BCPT) for each vessel. We then grouped the vessels by vessel type and calculated an average BCPT for each vessel type.
Ballast discharge frequency is the percentage of vessel visits where the vessel discharged any amount of ballast water. Ballast discharge volume is the total amount discharged. Both are directly related to propagule pressure, which is a function of the frequency and volume of NIS arrival to destination locations, although the amount of potential NIS discharged at any particular port-of-call will also depend on the vessel’s voyage history. Ballast discharge frequency and volume data are available from Davidson et al. (2018), who compiled and analyzed data from NBIC for the year 2014. Additional data were approximated from Hatami et al. (2021), who combined data from Lloyd’s Maritime Intelligence Unit (LMIU) with data collected by the New Zealand government (Ministry for Primary Industries, MPI). Data from Hatami et al. (2021) include annual number of vessel visits and annual average deadweight tonnage (DWT) to visit by vessel type in 2000–2005 and 2016 (LMIU), and separately, data for annual number of vessels that discharged ballast and annual discharge volume from 1999 to 2007 (MPI), which did not also include vessel visit data. For an approximation of ballast discharge frequency, we divided (by vessel type) vessels that discharged ballast from the latter dataset by visits from the former dataset, for the overlapping data years of 2000–2005. For ballast discharge volume by vessel type, we averaged data from the latter dataset for 2000–2005.
Assignment of Importance Ratings
Importance ratings give more weight to risk factors that have a greater impact on the probability of successful marine NIS transfer, and range from 1 (lowest importance) to 3 (highest importance). Our importance rating assignments were based on those proposed in Davidson et al. (2018). Importance ratings are further used in the risk quantification process at Step 2.5.
The final list of selected risk factors and their importance ratings are in Table 1.
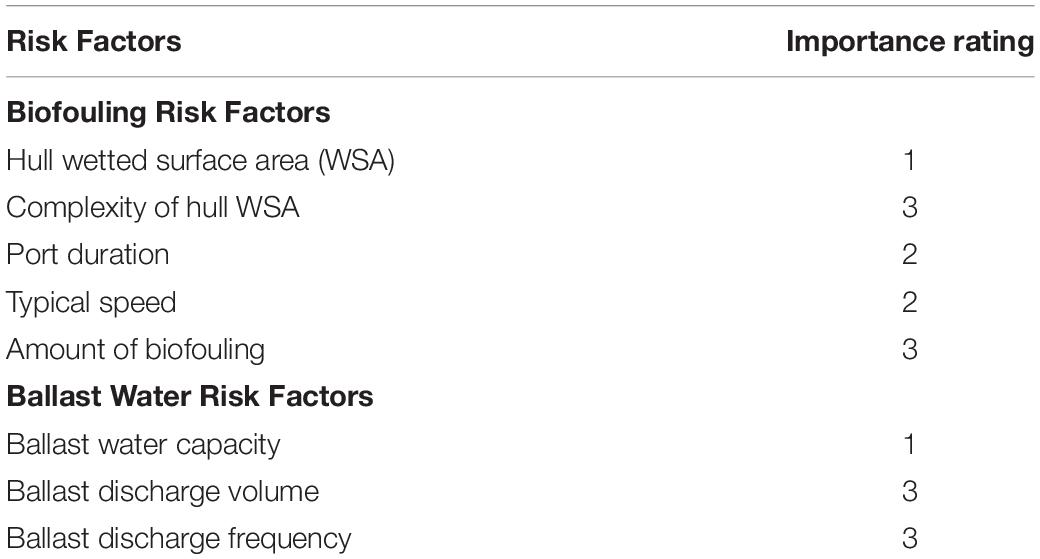
Table 1. Vessel type dependent risk factors selected in Step One of populating the vessel biosecurity risk framework (Figure 1), along with their assigned importance ratings.
Selection of Data Values for Each Combination of Vessel Type and Risk Factor
Data sources with quantitative information for each combination of vessel type and risk factor were compiled, and a confidence rank was assigned (Figure 1B, Table 2). Quantitative data from all available sources were then assembled (Figure 1B, Table 3). If there were no risk factor data for a vessel type, data from the most likely similar vessel type were used based on presumed similar physical configuration and behavior due to cargo type (Figure 1C). If there were multiple data sources for the same risk factor, data were selected from the data source with the highest number of vessels for each vessel type (Figure 1D). If multiple data sources for the same risk factor were not in the same units, data from each data source were first standardized before data selection. Confidence ranks were also assigned to each combination of vessel type and risk factor (see Supplementary Table 2). In the following subsections, we describe how we applied these methods to specific situations that arose while constructing the framework.
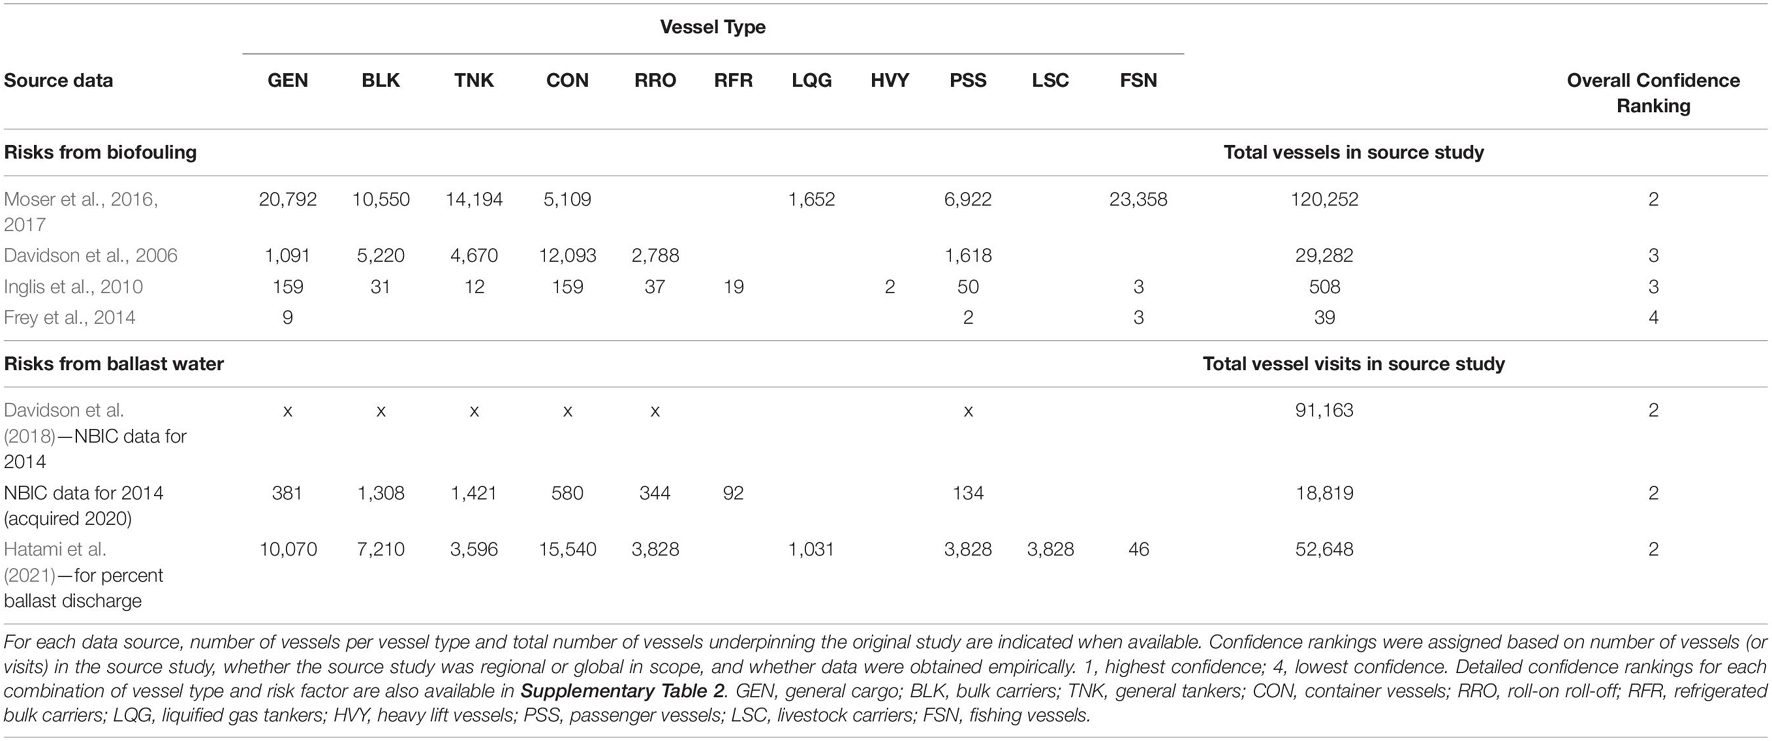
Table 2. Overview of data sources included in the vessel biosecurity risk framework.
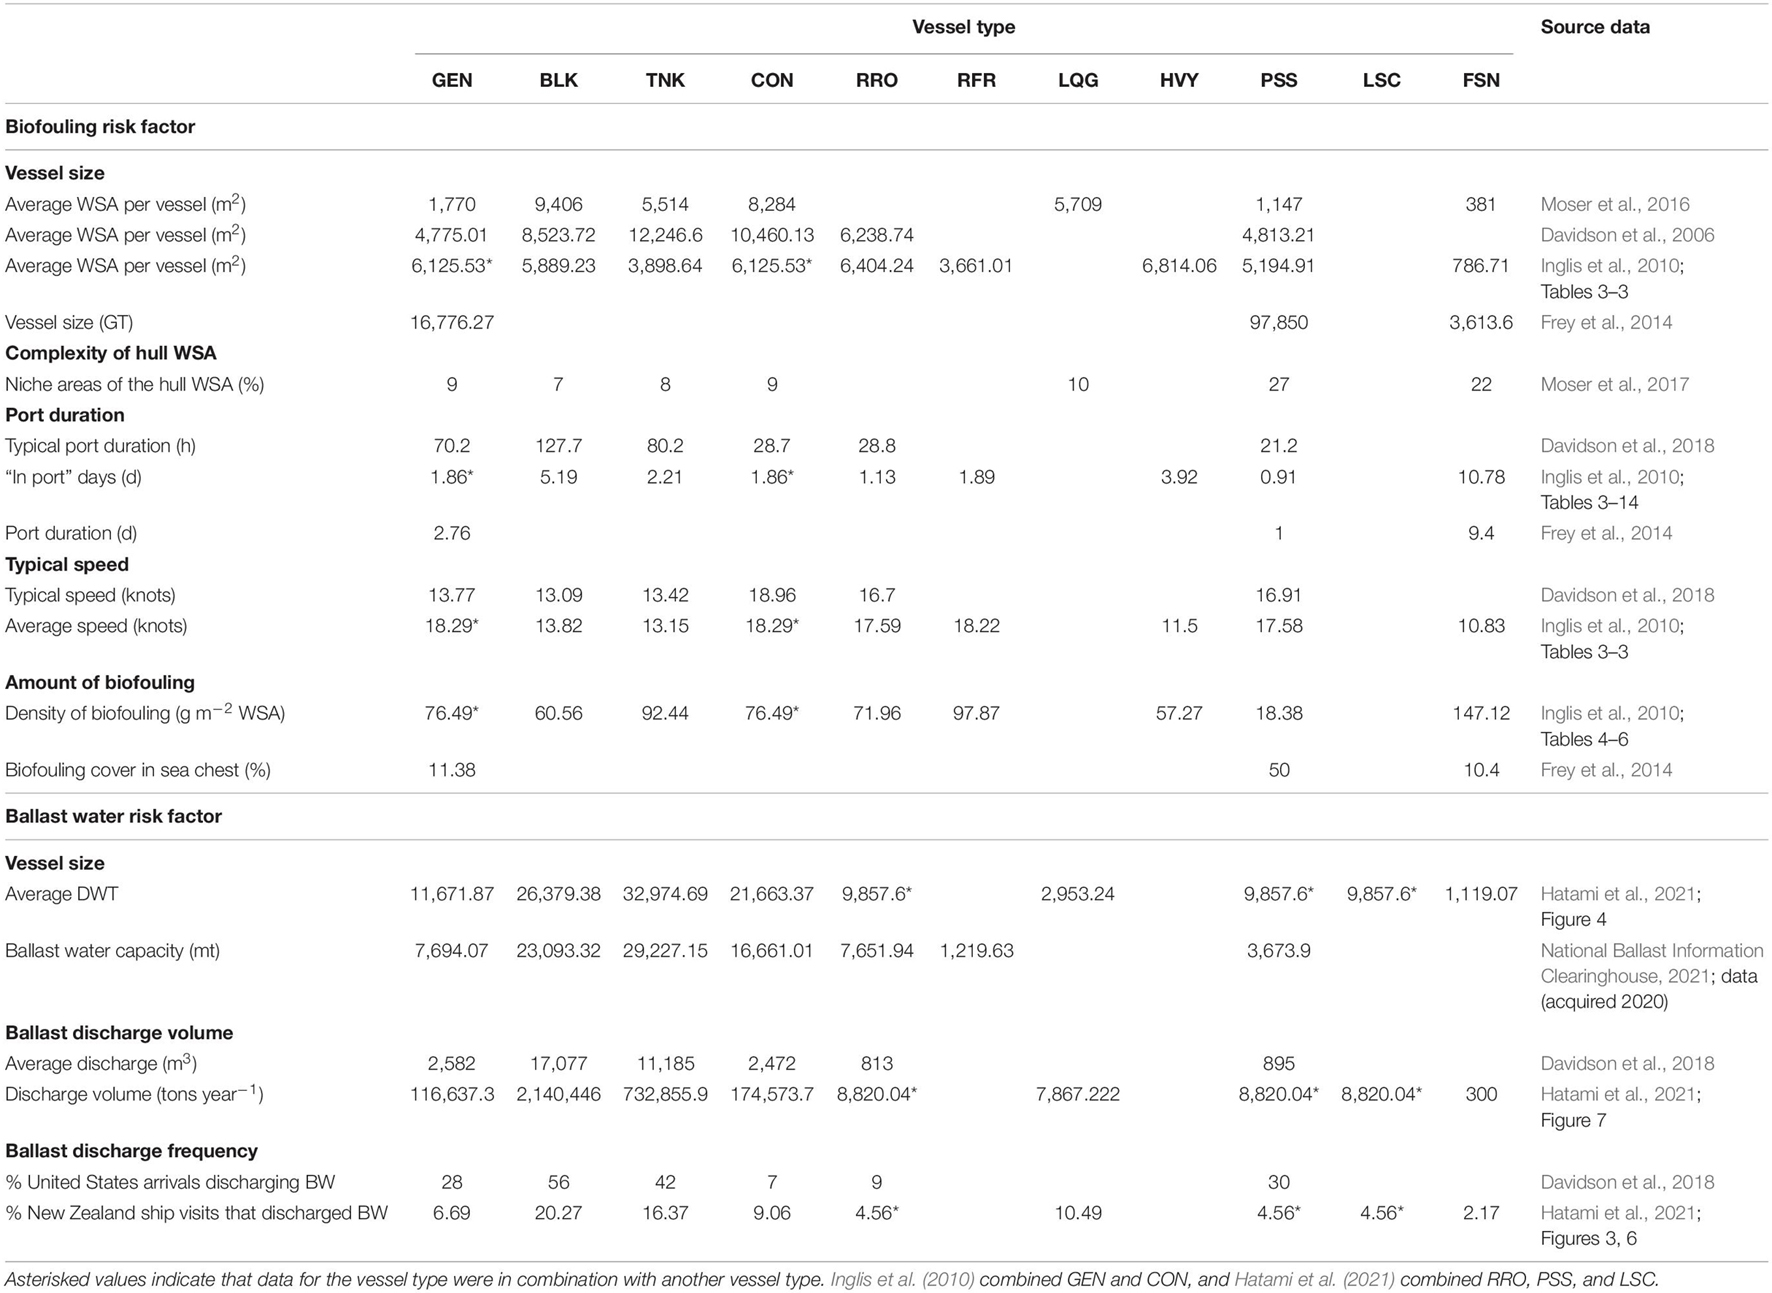
Table 3. Data from each data source for each combination of risk factor and vessel type.
Data Sources and Confidence Ranks
Although many studies have been conducted over the past few decades on marine biosecurity risk due to transport by maritime vessels, relatively few provide data by vessel type. To construct the framework, we aimed to include datasets that were global in scope, both as individual datasets (Moser et al., 2016, 2017; Davidson et al., 2018) and as multiple sources that were regional in scope but from different regions (Davidson et al., 2006, 2018; Inglis et al., 2010; Frey et al., 2014; Hatami et al., 2021; National Ballast Information Clearinghouse, 2021). Hull WSA and complexity of hull WSA were calculated rather than measured in each data source with hull WSA data, while data for all other selected risk factors were empirical.
Several risk factors had data available from multiple sources for the same vessel types. For each such factor, we calculated Kendall rank correlation of vessel types to assess concordance of data between the sources. Seven comparisons were made for five factors (see Supplementary Table 1). High concordance would have justified averaging together data from multiple sources to maximize the amount of data upon which risk quantifications could be based, and meant that datasets based on particular regions or nations could be extrapolated to apply globally. However, in all cases, concordance was low, indicating that data for the same risk factor from multiple sources should not be pooled, that each dataset should be considered separately, and a confidence ranking of each data source was warranted.
Confidence ranks were assigned to each data source as a number from 1 to 4 (Table 2). High confidence (1) was assigned if the data source included 1,000 + vessels, medium confidence (2) between 100–1,000 vessels, and low confidence (3) for fewer than 100 vessels. Confidence was then reduced by a step (increased by 1) if the study was of regional rather than global scope, and if the data were calculated or derived from models rather than obtained empirically.
Missing Data
Five of our chosen vessel types did not have data for at least one risk factor, and data from another vessel type were used as a proxy based on similarity of cargo type. For RRO, RFR, LQG, HVY, and LSC, the assumed closest proxies were CON, GEN, TNK, BLK, and PSS, respectively. RRO are most similar to CON for the weight and volume of cargo types. RFR, which carry perishable items similar to the non-perishable items carried in general cargo and container cargo, tend to be closer in size to GEN than CON. LQG is a type of TNK. HVY carry very heavy cargos and move relatively slowly, like BLK. LSC and PSS are generally large vessels that carry living beings and must provide them with food, cleanliness, and other similar requirements.
Multiple Data Sources
For risk factors that had data available from multiple sources, we selected data from the data source with the highest number of vessels of the vessel type.
Data Standardization Across Multiple Data Sources for the Same Risk Factor With Different Units
For two risk factors, ballast discharge volume and ballast water capacity, data from different sources were not in the same units and could not be easily converted. For ballast discharge volume, data from Davidson et al. (2018) were in cubic meters per vessel while data from Hatami et al. (2021) were in tons per vessel type per year. For ballast water capacity, the comparison was between ballast water capacity in metric tons (mt) from NBIC data, and overall vessel size in DWT from Hatami et al. (2021).
To allow comparison between datasets for the same risk factor in order to select values to use in the framework, we first rescaled each dataset from 0 to 1 by standardizing each dataset to their maximum values, i.e., by dividing the data value for each vessel type by the maximum data value for all vessel types. An example of the arithmetic to do this is shown in Figure 1E.
For ballast discharge volume, rescaled values were then selected for each vessel type based on highest number of vessels of the vessel type. For ballast water capacity, the data for ballast water capacity was prioritized over DWT as the more accurate measure when selecting rescaled values for each vessel type despite lower vessel numbers in the dataset.
Confidence Ranks for Each Combination of Vessel Type and Risk Factor
To allow assessment of the overall robustness of the data in the framework, confidence ranks were assigned to each combination of vessel type and risk factor as a number from 1 to 4 (see Supplementary Table 2). As with confidence ranks for the overall study, high confidence (1) was assigned to risk factors with data from 1,000 + vessels of a given vessel type, then medium confidence (2) for 100–1,000 vessels, and low confidence (3) for fewer than 100 vessels. In addition, confidence was reduced by a step (increased by 1) if data for the vessel type were part of a combination with another vessel type, e.g., GEN and CON from Inglis et al. (2010) were combined, as were RRO, PSS, and LSC from Hatami et al. (2021). Confidence was also reduced by a step if data were missing for a particular combination of risk factor and vessel type, and data from a proxy vessel type were used instead.
Data Standardization Across All Risk Factors
Each risk factor has different units from the other risk factors. To allow comparison among risk factors, after selecting values to use from the data sources, we standardized them by their maximum values (Figure 1E). Higher numbers indicate higher risk relative to other vessel types for a given risk factor.
For the vessel speed risk factor, higher average speed is associated with lower risk, so an inverted scale was applied. We first rounded up the maximum value to the next highest integer so that the highest vessel speed (lowest risk) would still have a risk of more than 0. Then we standardized all speed values to the rounded up maximum value and subtracted the result from 1. The rescaled values were 1 for lowest speed and > 0 for highest speed.
Importance Ratings and Summed Total Risk Values
The importance ratings assigned in 2.2.3 were multiplied to the rescaled values from 2.4 (Figure 1F). This produced a final risk value for each combination of risk factor and vessel type. All risk values related to biofouling were then summed for a total risk from biofouling for each vessel type. The same was done for ballast water related risks. Finally, biofouling risk and ballast water risk were summed to derive the overall vessel type risk score (Figure 1G).
Risk scores have no intrinsic value in and of themselves. They are mainly used as a comparative measure among vessel types. If another vessel type were added to the framework, its associated data for the various risk factors would alter the absolute risk scores but not change the order of existing vessel types (other than slotting into its own appropriate place in the ordering).
Framework Application Case Study: New Zealand
To demonstrate a potential use for the vessel biosecurity risk framework, we applied the vessel type risk scores to vessel visit data for New Zealand ports in 2015 and 2016. For each of seven vessel types in the visit data (BLK, CON, FSN, GEN, PSS, RRO, and TNK), we multiplied the risk score for that vessel type by the number of visits per year to each of 13 ports (Auckland, Bluff, Gisborne, Lyttelton (Christchurch), Napier, Nelson, New Plymouth, Picton, Port Chalmers (Dunedin), Tauranga, Timaru, Wellington, Whangarei). We derived a total risk score for each port per year by adding together the risk scores for all vessel types, followed by averaging across both years. We also derived proportional risk scores per vector for each port by adding together the biofouling risk scores and ballast water risk scores for all vessel types separately.
To assess the performance of our framework, we compared our port risk scores to the results from a recently published, state of the art statistical risk model developed for the New Zealand government by Hatami et al. (2021). Their study quantified the relative levels of marine biosecurity risk associated with domestic shipping ports based on total ballast water discharge and total biofouling exposure per port, using K Nearest Neighbors (KNN) and random forests algorithms. This represents a very different and more complex methodological approach than ours. Hatami et al.’s (2021) final risk metric is the “allocation weight”—the proportion of total available biosecurity management effort that should be allocated to each port given its relative risk level. These weights are calculated by dividing the risk exposure for each port by the sum of risk exposure for all ports, and sum to 1 across all ports.
Hatami et al. (2021) calculated allocation weights based on vessel visits to 14 New Zealand ports in 2015–2017. We calculated allocation weights based on the port risk scores from our vessel biosecurity risk framework. To make the results of both studies directly comparable, we recalculated Hatami et al.’s (2021) allocation weights to include only 2015–2016 and the 13 ports for which we had data, before comparing our allocation weights to theirs.
Data Visualization and Statistical Analyses
For the ballast capacity analysis, data were extracted from the NBIC with a python script, followed by data processing and visualization using the programming software R (R-project, 2014). A Kruskal-Wallis test (Kruskal and Wallis, 1952) test with Bonferroni adjustment and pairwise tests (Dunn, 1961, 1964) was implemented using the dunn test package (Dinno, 2017) to determine whether BCPT for any vessel types were significantly different from each other.
For the New Zealand case study, we calculated a distribution free Kendall’s rank correlation to assess strength of association between risk scores assigned for 13 New Zealand ports based on the current framework and those from Hatami et al. (2021).
Results
Analysis of Ballast Water Capacity by Vessel Type
Out of 4,802 vessels recorded by the NBIC database to have visited the United States in 2014, 4,294 were one of the seven vessel types included in both the NBIC database and this study. Average ballast water capacity for each vessel type ranged from 1,219.63 ± 908.48 (mean ± SD) mt for RFR to 29,227.15 ± 22,930.52 mt for TNK (Figure 2A and Supplementary Table 3).
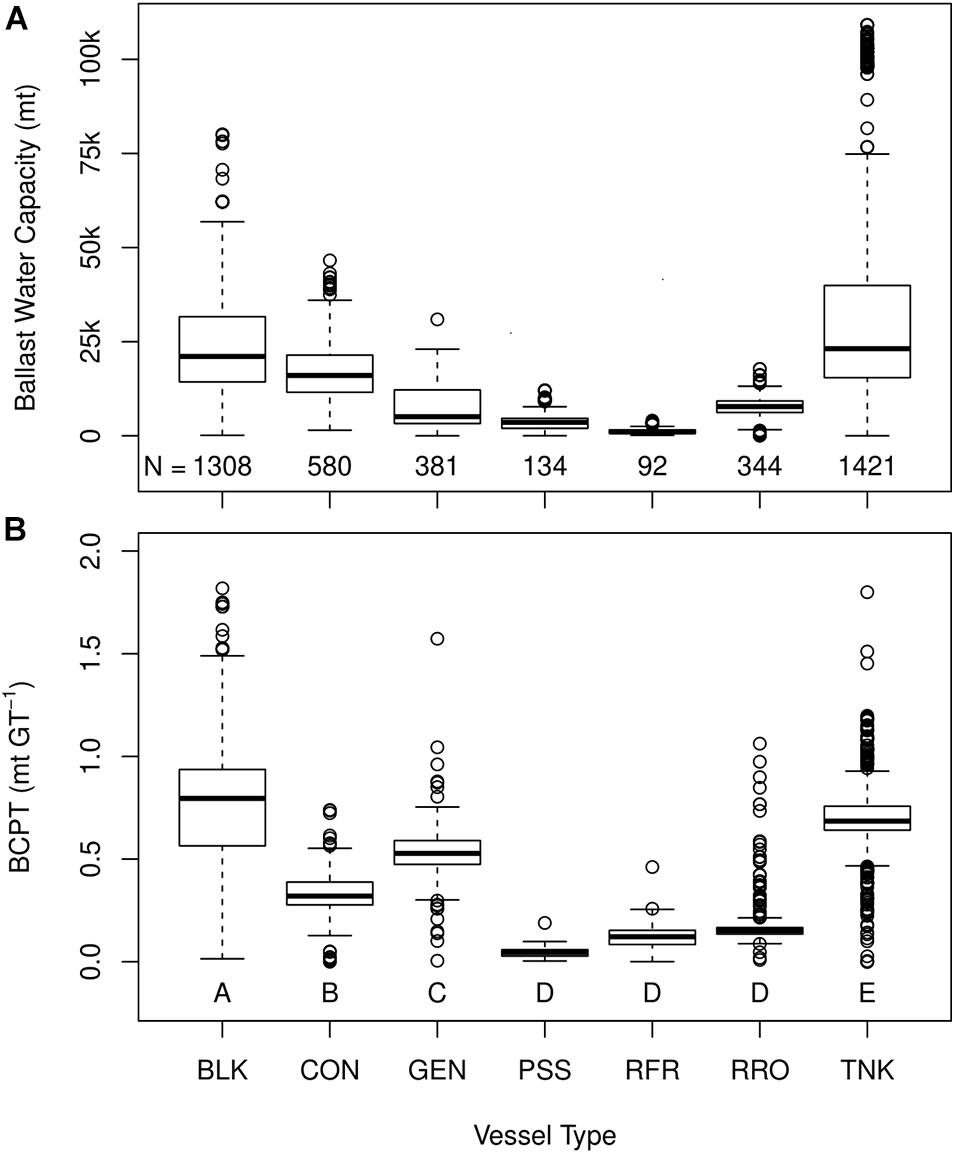
Figure 2. Boxplots showing ballast water capacity (A) and proportion of ballast water capacity to overall vessel size (B) for seven common vessel types. Numbers across the bottom of panel (A) represents the numbers of vessels for each vessel type. Different letters across the bottom of panel (B) indicates which vessel types were significantly different from one another: PSS, RFR, and RRO were not significantly different from each other (Dunn pairwise tests, adjusted p > 0.05), while all other pairs were (Dunn pairwise tests, adjusted p < 0.001).
Most vessels (4,260 of the 4,294) had a calculated BCPT of less than 2 mt GT–1. We assumed that the remaining 34 vessels (0.8% of the dataset) with BCPT greater than 2 mt GT–1 were either highly specialized vessels or outliers most likely due to data entry errors. Average BCPT values ranged from 0.05 ± 0.03 mt GT–1 for PSS to 0.76 ± 0.22 mt GT–1 for BLK (Figure 2B and Supplementary Table 3). BCPT varied significantly between all combinations of vessel types (p < 0.001, Kruskal–Wallis test followed by Dunn pairwise tests) with the exception of comparisons among PSS, RFR, and RRO (adjusted p > 0.05, see Supplementary Table 4).
Overview of the Input Data
Six of our 11 vessel types (GEN, CON, TNK, BLK, PSS, and FSN) had data for every risk factor from at least one source. Three vessel types (RFR, RRO, and LQG) had data missing for at least one risk factor but did have data for at least one risk factor in both the biofouling and ballast water categories. HVY only had biofouling data, which was based on two vessels. Therefore, ballast water risk for HVY was approximated from BLK and resulted in identical values for these two vessel types. LSC only had ballast water data, which was from a data source that combined LSC with PSS and RRO. Therefore, biofouling risk for LSC was approximated from and identical to PSS.
The final data selected for the framework from referenced sources is in Table 4. To summarize, average hull WSA per vessel ranged from 381 to 10,460 m3 (FSN and CON, respectively). Complexity of hull WSA ranged from 7% for BLK to 27% for PSS. PSS spent the least amount of time in port at an average of 0.88 days per call, while FSN were docked longest at an average of 10.78 days. Typical vessel speeds ranged from 10.83 knots for FSN to 18.96 knots for CON. Amount of biofouling ranged from 18.38 g m–2 for PSS to 147.12 g m–2 for FSN. Ballast discharge frequency ranged from 2.17% for FSN to 56% for BLK. Ballast discharge volume in the United States ranged from 813 m3 per discharge for RRO to 17,077 m3 for BLK (and therefore also HVY), while in New Zealand it ranged per vessel type from 300 tons year–1 for FSN to 2,140,446 tons year–1 for BLK (and HVY).
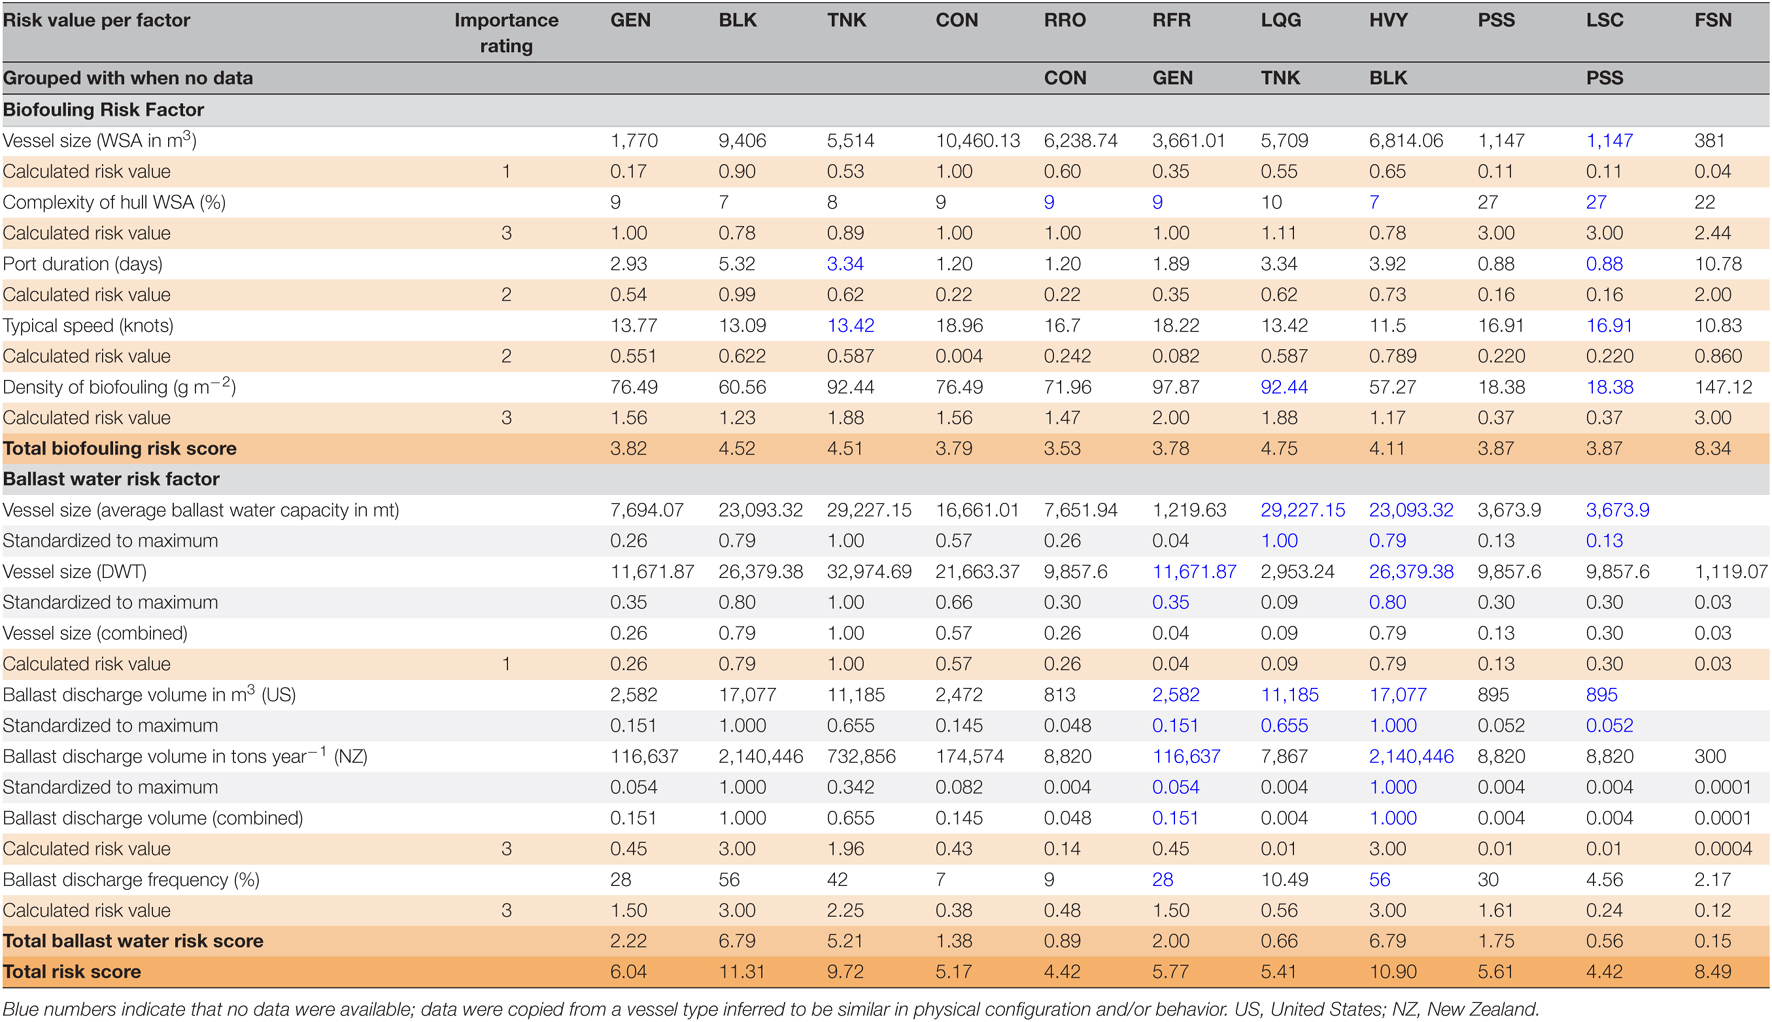
Table 4. Vessel type risk scores.
Vessel size as a ballast water risk factor was measured as either ballast water capacity or DWT, depending on which type of data were available for each vessel type. ballast water capacity data were available for BLK, CON, GEN, PSS, RFR, RRO, TNK, and ranged from 1,219.63 to 29,227 mt (RFR and TNK). Vessel size in DWT were available for LQG, LSC, and FSN: 2,953.24, 9,857.6, and 1,119.07 DWT, respectively.
Biosecurity Risk Profiles by Vessel Type
The final cumulative risk scores per vessel type ranged from 4.42 for LSC and RRO to 11.31 for BLK (Table 4). The relative importance of biofouling versus ballast water related risk factors varied between vessel types. For biofouling risk factors, FSN had by far the highest risk at 8.34, including the maximum risk values for both port duration and density of biofouling (Figure 3A). For all other vessel types, although the proportions of each risk factor varied, their overall totals were similar, ranging from 3.53 to 4.75. For ballast water risk factors, the vessel types with highest risk were BLK, and therefore also HVY, at 6.79, followed by TNK as the third highest at 5.21 (Figure 3B). Risk from ballast discharge frequency and volume for these types were generally individually higher than the total ballast water risk for other vessel types. At the low end, risk from FSN was only 0.15. Overall, BLK were the highest risk vessel type across both vectors at 11.31 (Figure 3C), followed by HVY (10.90) and TNK (9.72), while LSC, RRO, and CON were at the low end (4.42, 4.42, and 5.17).
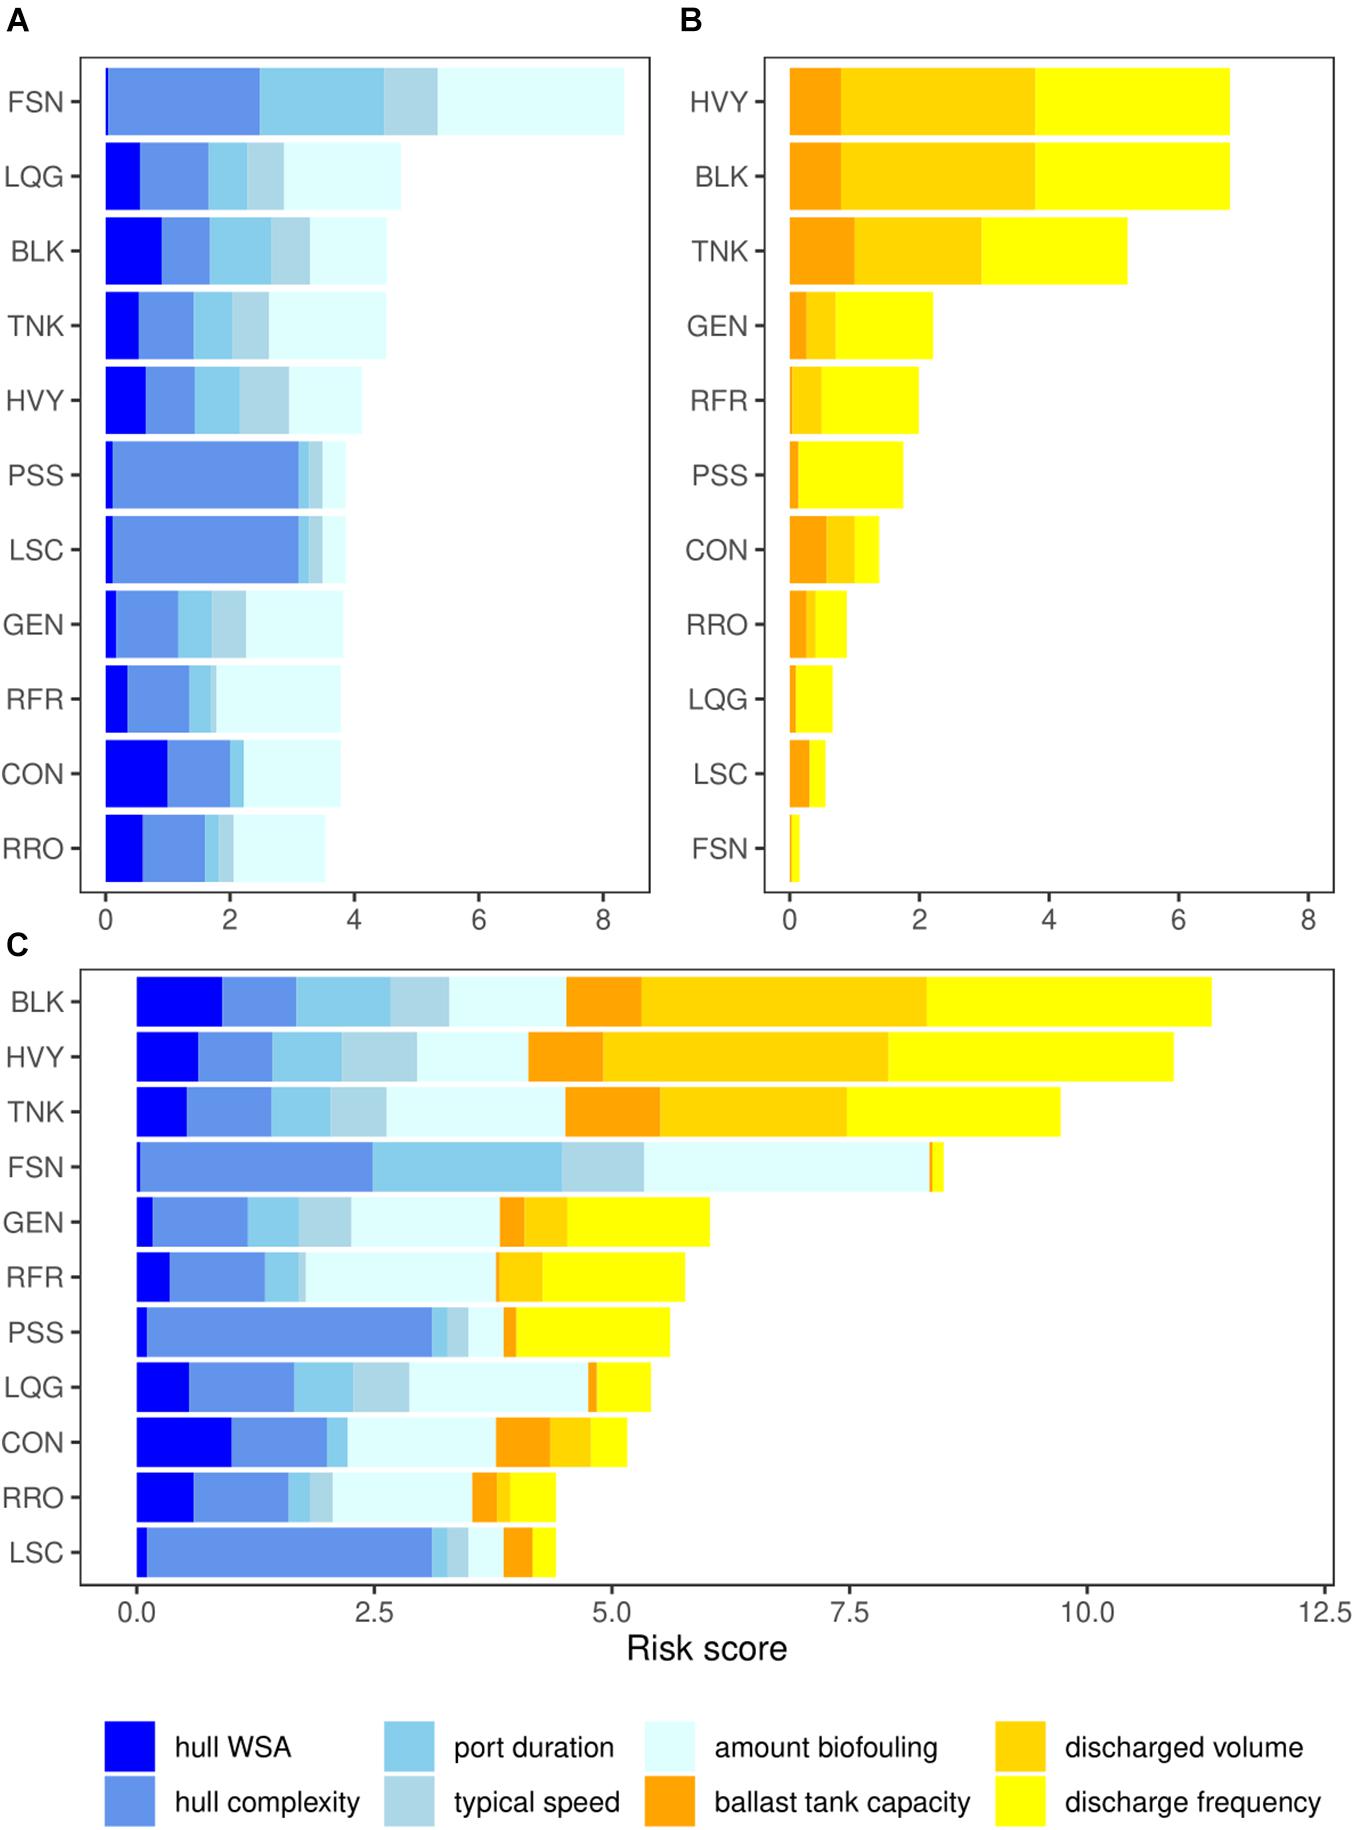
Figure 3. Comparative marine biosecurity risk scores by vessel type. (A) Five biofouling risk factors (blue shaded stacks). (B) Three ballast water risk factors (orange to yellow stacks). (C) Total risk scores across both vectors.
New Zealand Case Study—Biosecurity Risk Allocation by Port
There was considerable variation in the number of vessel visits to ports located around New Zealand. The ports of Tauranga and Auckland received the highest number of arrivals (average of 1,277.5 and 1,233 per year in 2015–2016, respectively) while smaller, regional ports like Picton and Gisborne had the lowest arrival numbers (Figure 4A). The overall broad pattern of risk associated with the various ports appears to correspond to the total number of vessel visits (Figure 4 and Supplementary Table 5). However, the proportion of vessel visits per type also had a strong influence on the total risk score for a port. For example, although Tauranga and Auckland had similar numbers of total vessel visits (mean difference per year of 44 vessels), Tauranga had proportionally more visits by BLK vessels, resulting in a greater port risk score than Auckland (Figure 4B). Similarly, New Plymouth had fewer vessel visits than Nelson or Timaru, but a much larger proportion of the vessels were TNK, resulting in overall elevated port risk scores. Whangarei had fewer visits than Port Chalmers (mean difference per year of 78 vessels), but more of them were BLK and TNK, resulting in a higher port risk score for Whangarei. The relative contributions of the two transport vectors (biofouling and ballast water) were rather consistent across ports, ranging from approximately 40 to 60% (Figure 4C). However, in some cases, the relative importance of either ballast water or biofouling risk factors have had a strong influence on the port rankings. For example, Tauranga’s greater port risk score over Auckland was largely due to risks associated with ballast water, while Dunedin’s higher ranking over New Plymouth, Bluff, and Timaru was determined by biofouling risk factors.
Figure 4. (A) Number of vessel visits per vessel type to each port of New Zealand in 2015 and 2016. (B) Relative biosecurity risk of each port, showing proportion of total risk per vessel type. (C) Relative biosecurity risk of each port, showing proportion of total risk due to ballast water (BW) or biofouling (BF).
The allocation weights we calculated based on the port risk scores derived from our vessel biosecurity risk framework matched closely with the revised allocation weights from Hatami et al. (2021) (Kendall rank correlation tau of 0.72, p < 0.001; Figure 5). The four ports with the greatest allocation weights (Tauranga, Auckland, Lyttelton, and Napier) were in the same rank order in both studies, as were three of the four ports with the lowest allocation weights (see Supplementary Table 6). On average, there was a 0.013 ± 0.008 (mean ± SD) difference between allocation weights derived in each study.
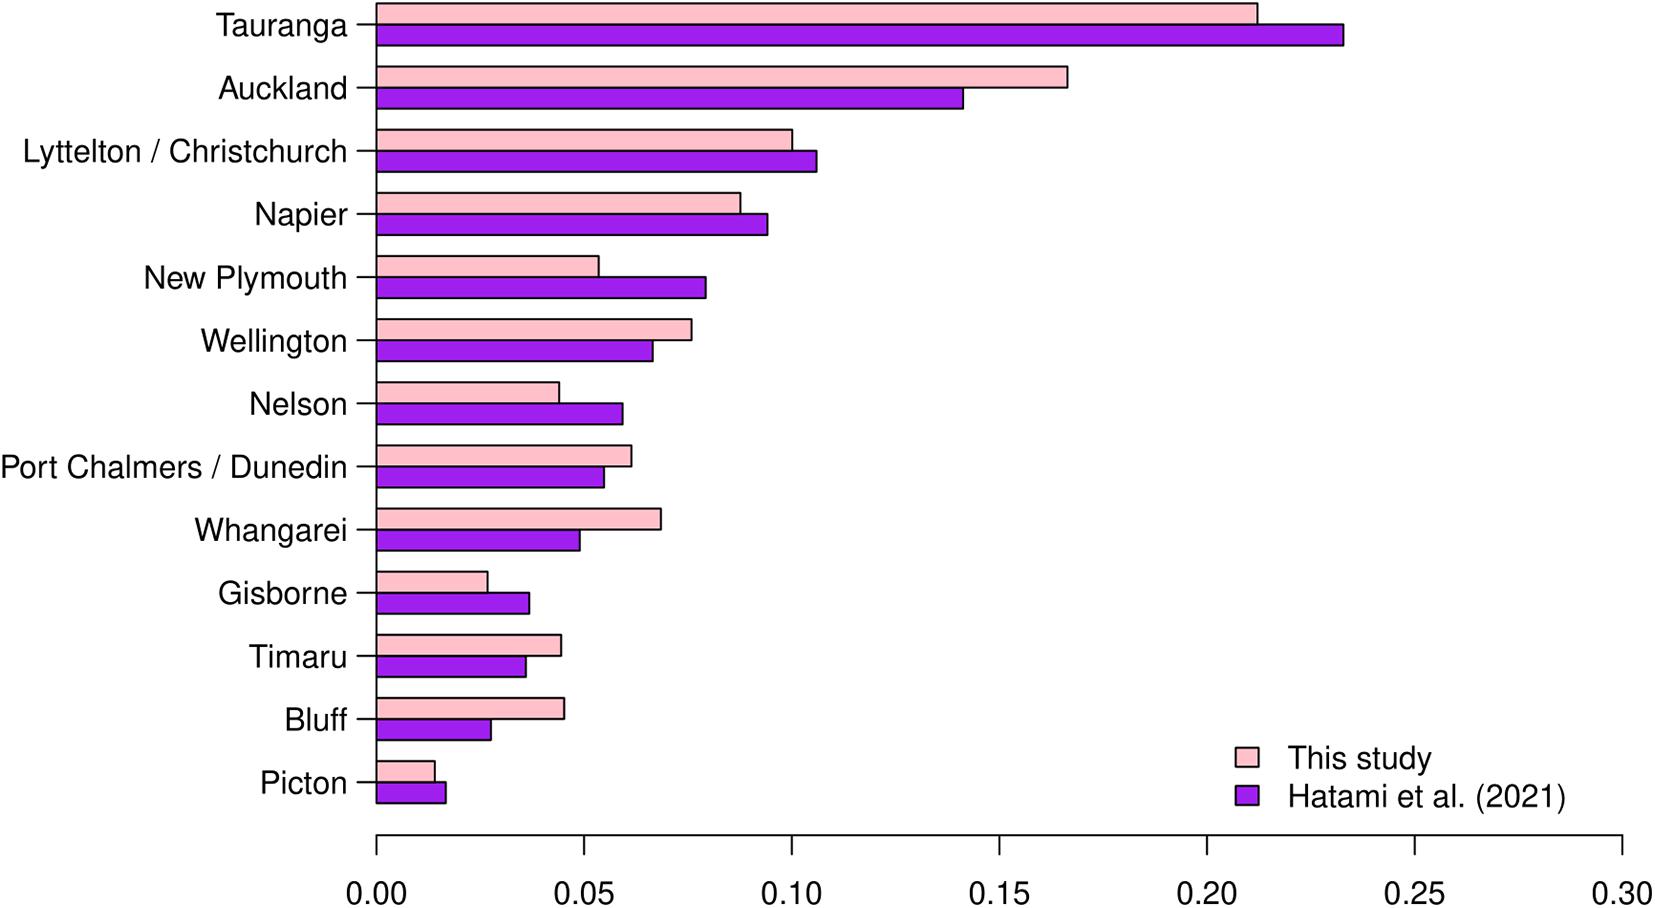
Figure 5. A comparison of port allocation weights for New Zealand ports, as derived from our framework and from Hatami et al. (2021).
Discussion
Framework Overview and Potential Uses
The primary purpose of this study was to integrate the considerable volume of existing knowledge on various risk factors related to NIS transfer by ocean-going vessels into a single, evidence-based vessel type biosecurity risk framework. The framework presented here provides a means for organizing available empirical data on marine biosecurity risk by vessel type based on global data on biofouling and ballast water risk factors. This results in a unified and adaptable quantification system that can be used to understand the relative risk associated with common vessel types, along with the components of that risk. The framework can then support scientists and decision makers in their development of marine biosecurity risk mitigation measures for their study systems or jurisdictions. It can be used in combination with other risk assessment tools that account for voyage-related factors, environmental similarity between origin and destination, or other factors affecting post-introduction probability of NIS survival and establishment.
A virtue of our framework is that it requires very little computational effort compared to more sophisticated modeling approaches (e.g., Saebi et al., 2020; Hatami et al., 2021), and is easy to implement by simple arithmetic application of the final vessel type risk scores. The risk factors we included are broad, with readily available data that do not require extensive effort to collect, as would be the case for risk assessments that investigate and summarize patterns of individual ship transits (David and Gollasch, 2019). Although the risk scores derived in our framework may not apply perfectly to every situation globally, the method we outlined can be customized to fit specific local or regional scenarios by adding or removing individual risk factors or vessel types as appropriate, depending on their relevance.
Our framework can be applied to several important aspects of marine biosecurity management. It can be used to help identify higher-risk vessels, which enables authorities to better focus their efforts and resources regarding interventions. For example, Clarke et al. (2017) noted that ballast water management was one of the most common reasons to not pass vessel inspections in Australia, while inspection failure due to biofouling was uncommon. However, in-water hull inspections were also rarely conducted due to logistic difficulties. By integrating the risk scores from our framework into their existing profiling tools, authorities could more accurately choose the high-risk vessels where direct hull inspections would be most needed, i.e., FSN, or they could target BLK or TNK that intend to discharge ballast water.
The framework can be used to determine the relative biosecurity risk associated with shipping ports or other defined areas of shipping activity. As demonstrated in our case study, biosecurity risk scores for ports, when calculated from the numbers of different types of vessels visiting a port, are likely to be more accurate than looking at vessel visit numbers alone. While port risk scores do not represent absolute measures of risk, they can be used to rank ports or geographic areas according to relative risk. This in turn can inform prioritization for vector-based management and the allocation of usually limited biosecurity or enforcement resources.
The framework can be used to determine the relative biosecurity risk associated with different types of internationally traded commodities based on the vessel types that transport them (Verna et al., 2021). Commodity risk scores could be used to analyze the global movement patterns of NIS based on the movement patterns of the commodities as they are transported on the various vessel types. With sufficient maritime economics data, this could potentially eliminate the need to track individual vessel movements while tracking the movement of NIS.
Risk factors could also be added to the framework for particular research questions. For questions that are not directly about port-based marine biosecurity risk, vessel traffic (Davidson et al., 2018), or frequency of calling port (Cheng et al., 2019), or voyage history i.e., the number and locations of ports a vessel may have visited before arriving at the current port (Clarke et al., 2017), might be appropriate risk factors to include. Time since ballast water uptake might be another important risk factor, since organism viability within a ballast tank generally decreases over time regardless of treatments (Verling et al., 2005; Zaiko et al., 2020).
The framework has the flexibility to add additional shipping vectors as well as risk factors if they are deemed in the future to be important, and as data become available. Relative weighting of the various risk factors can also be changed by manipulating the importance ratings. Vessel types could be added or removed depending on whether they are relevant to particular research questions or regions, and whether data are available. While our study focused on cargo vessels, the framework could also be adapted to apply to other types of maritime vessels. For example, recreational vessels such as yachts and launches are another category of concern (Inglis et al., 2010; Clarke et al., 2017).
Consistency of the Case Study Results With a Benchmark Port Risk Profiling Approach
In 2002, New Zealand began a long-term monitoring program to detect arrivals of marine NIS in its coastal waters called the Marine High Risk Site Surveillance programme (MHRSS). The program’s sampling locations were chosen based on number of international vessel visits or tonnage of imports from potential source locations of target NIS, volume of discharged ballast water from potential source locations, availability of habitat suitable for target NIS, and local hydrodynamics affecting retention in or dispersal from the local area. The purpose tasked to Hatami et al. (2021) by the New Zealand government was to reassess the sampling locations established at the beginning of the program, based on changes in risk levels at the sampling locations since 2002 due to changes in traffic patterns of international shipping.
Some of the input data we used to develop our framework were the same as those used by Hatami et al. (2021) to develop their comprehensive risk models. Both studies used biofouling data from Inglis et al. (2010), and data collated by the New Zealand government on ballast water discharge patterns from vessel visits to New Zealand in 2000–2005. We acquired the latter via several figures from Hatami et al. (2021) after they had done some initial data processing (Table 2). However, after data acquisition and initial processing, the methodological approaches of the two studies were very different. Their approach was to develop a systematic statistical likelihood-based methodology based on KNN and random forests algorithms, which is more labor intensive and requires a higher level of technical expertise than our framework approach.
When we applied our framework to the same 2015–2016 vessel visit data to which Hatami et al. (2021) applied their models, there was a close match of results from the two studies. Given the benchmark status of Hatami et al. (2021)’s quantitative risk modeling exercise, this confirms our framework’s utility as a robust method for assessing port-based marine biosecurity risk. Our results also support Hatami et al. (2021)’s conclusions on how to re-allocate sampling effort among New Zealand’s ports for MHRSS based on changes in international shipping arrivals over the past two decades.
Ballast Capacity as a Proxy of Vessel Size for Risks From the Ballast Water Vector
Vessel size is commonly measured in GT or DWT within the shipping industry for the purposes of determining port charges and cargo carrying capacity, respectively (Stopford, 2009). For determining marine biosecurity risk associated with biofouling transport, hull WSA is well established as a more appropriate measure of vessel size than GT or DWT (Moser et al., 2016, 2017; Miller et al., 2018). For determining marine biosecurity risk associated with ballast water transport, ballast water capacity has likewise been noted as more appropriate than GT or DWT. For example, Seebens et al. (2013) considered volume of origin ballast water as an important factor in their model, and derived an equation for approximating ballast water capacity based on DWT by vessel type, which they partially based on general information from the American Bureau of Shipping (ABS, 2014). Cheng et al. (2019) did not consider overall vessel size as a potential risk factor while developing their model from expert opinion, but ballast water capacity became one of their ten finalized risk factors.
To date there have not been globally comprehensive studies on the influence of differences among vessel types in ballast water capacity on marine biosecurity risk. David et al. (2012) compiled a list of studies that mentioned ballast water capacity by vessel type, which seem to arrive at a consensus of 30–60% of a vessel’s DWT. However, of the five studies, four are gray literature (AQIS, 1993; Walters, 1996; Hay and Tanis, 1998; Suban, 2006) and the fifth would be over 35 years out of date on the characteristics of the modern global merchant fleet if that had been the study’s focus (Carlton, 1985). Carlton (1985) and Hay and Tanis (1998) only mention ballast water capacity as a speculative comment in their introductions. Our analysis of ballast water capacity by vessel type was based on a quick survey for the purposes of acquiring evidence-based data for the development of the framework. Our calculations demonstrate significant differences in BCPT among vessel types, which should be accounted for in risk quantifications. A comprehensive review of data from all known vessels in active service globally was beyond the scope of this study, however, but might be warranted to fine tune the exact proportions by vessel type, should higher precision of ballast water-related risk scores be required.
Selection of Risk Factors
One could argue that it is unnecessary to include both amount of biofouling as a risk factor, and all of the other biofouling risk factors, because the latter risk factors aim to predict the former. This would be true if globally relevant datasets of high confidence were available for amount of biofouling by vessel type. However, although our primary data source (Inglis et al., 2010) is adequately comprehensive for data by vessel type, it is low in confidence due to both number of vessels in the overall study (Table 2) and number of vessels per vessel type (Supplementary Table 2). We speculate that as more datasets become available in the future that include data on amount of biofouling by vessel type, a time will come when amount of biofouling could be used in our framework as the only biofouling risk factor.
Similarly, one could argue that ballast discharge volume supersedes ballast water capacity as a ballast water risk factor. If the level of risk associated with ballast discharge volume were based on empirical discharge data rather than an average per vessel type, it would be the more accurate approach (although less accurate than directly measuring the number of viable organisms per discharged volume). The same would be true for ballast discharge frequency. However, specific discharge statistics vary by region and ports within a region. Because our framework is intended to be a template that can be applied globally, we use an average per vessel type rather than statistics from any specific port. Since this reduces the overall accuracy of risk assessment, we compensate by including ballast water capacity to provide additional information.
Hull WSA and ballast water capacity both represent the maximum space that NIS could potentially occupy, while amount of biofouling and ballast discharge volume are a smaller proportion of the maximum space (usually). Our importance ratings of 1 (hull WSA, ballast water capacity) and 3 (amount of biofouling, ballast discharge volume) reflect their relative importance as risk factors.
Considerations of Treatment Measures
The risk scores calculated with our framework assume no particular treatment measures were applied to mitigate ballast water or biofouling risks of individual vessels. In practice, the International Maritime Organization [IMO], 2004 Ballast Water Management Convention, which went into force globally in 2017, requires that internationally sourced ballast water can only be discharged following approved treatment procedures or mid-ocean exchange. Also, The International Maritime Organization [IMO], 2011 Guidelines for the Control and Management of Ships’ Biofouling to Minimize the Transfer of Invasive Aquatic Species provides guidance on hull cleaning, anti-fouling systems, and in-water inspections, and a number of individual nations, regions, and states of the United States have implemented biofouling management standards and guidelines for international vessels, e.g., New Zealand (New Zealand Government, 2014), California (California State Lands Commission, 2015), Hawaii for the Papahanaumokuakea Marine National Monument (PMNM, 2009), and Ecuador for the Galapagos Marine Reserve (Ministerio del Ambiente, 2014), while Australia has standards in development (Australian Government, 2013).
At present, enforcement of IMO ballast water guidelines is not yet consistent throughout the world, the optimal use of various ballast water management strategies is still being established (Bradie et al., 2021), and standards for biofouling guidelines that apply globally are still in development. As a result, it is not possible to account for the mitigation of risks due to ballast water and biofouling in a global-scale framework. We therefore apply a conservative approach of assuming the worst-case scenario where no ballast water exchange has occurred and no treatments were applied. Individual authorities could customize the framework by adding their own local and regional factors if sufficient data by vessel type are available for their particular situations. Risk factors related to treatment measures might be worth considering in future iterations of the framework when assumptions regarding their use can reliably be made on a global scale. This would further improve the accuracy of vessel-related risk assessment when using the framework.
The ability to consider ballast water treatment measures within the framework would also refine the development of port-level risk scores such as those calculated in our case study (Figure 4). For example, within a nation with multiple ports where some ports primarily import while others primarily export, ballast-related risk would be lower for the former and higher for the latter. Port risk scores could be adjusted with a correction factor accordingly. For another example, domestic ballast water transfer is not currently considered a biosecurity risk in most nations. When using our framework to calculate the relative biosecurity risk scores of ports (or geographic areas) receiving both international and domestic vessels, the arrival frequencies of each group could be treated separately and adjustments to ballast water related risk factors made to either group as necessary.
Limitations of Data Sources
In developing our framework, we had a number of challenges to overcome regarding combinations of vessel types in two of our data sources. Inglis et al. (2010) combined GEN with CON. Hatami et al. (2021) had various combinations of RRO, PSS, and LSC that did not match perfectly between their source datasets. These combinations were reasonable within the context of their studies; however, it became more difficult to relate their data to that of other studies we included in our framework. Partly because of these combinations, Kendall rank correlations (see Supplementary Table 1) resulted in low concordance for three biofouling risk factors (hull WSA, port duration, vessel speed) between data from Inglis et al. (2010) with data from Davidson et al. (2006); Moser et al. (2016), and Davidson et al. (2018), and two ballast water risk factors (ballast discharge frequency and volume) between data from Hatami et al. (2021) and Davidson et al. (2018). This restricted our ability to effectively pool data from these sources.
We had also hoped to assess whether NBIC data, which is specific to vessel arrivals in the United States, can be extrapolated to apply globally. A number of studies that have created global models use ballast data from NBIC and extrapolate it to apply to the rest of the globe (e.g., Xu et al., 2014; Wang et al., 2018; Sardain et al., 2019; Saebi et al., 2020) because NBIC data are readily available, reliable, and plentiful. However, ballast discharge frequency and volume would depend on the type and quantity of cargo being imported and exported, which differs by nation and often also ports within a nation. Data for ballast water operations of vessels arriving in New Zealand were available via Hatami et al. (2021), but because of the vessel type grouping, which confounded the Kendall rank correlations, we were unable to determine whether United States data and NZ data are comparable. It may be worthwhile to conduct a larger, more comprehensive study with ballast data from a variety of other nations to determine the accuracy of using NBIC data for studies with global purposes.
Likewise, although we aimed to construct a framework that can be applied globally, the total volume of available data by vessel type is presently limited. In particular, the regional data sources, even in combination with data sources from other regions, are not necessarily representative of the global merchant fleet and might not be extrapolatable to apply globally. Therefore, for the purpose of assembling a universal quantification system that synthesizes all known empirical data, the currently derived vessel type risk scores (Table 4) should be considered preliminary. Additional data as they become available will increase the overall accuracy of relative risk by vessel type that can be derived with the framework.
Conclusion
The vessel type biosecurity risk framework developed in this study can be applied to many scientific or policy questions that resource management agencies and other end-users might need to address for managing marine biosecurity risk. The framework is based on globally relevant data, simple to implement, and easily adaptable as new empirical information arises. Over the coming decades, shipping traffic related to trade and tourism is expected to vastly increase in most coastal regions of the world—but with important changes in dynamics related to vessel types and distribution of trading partners (Sardain et al., 2019). The development of effective biosecurity risk mitigation and intervention measures will be important. Two particularly important dimensions to support the efficacy and uptake of such tools are wide geographic relevance and user-friendliness. Our vessel type biosecurity risk framework meets both objectives.
Data Availability Statement
The original contributions presented in the study are included in the article/Supplementary Material, further inquiries can be directed to the corresponding authors.
Author Contributions
MT did the data synthesis and analysis with strong guidance from AZ and OF. All authors contributed to the article and approved the submitted version.
Funding
This study was supported by funding from the University of Auckland and the New Zealand Ministry of Business Innovation and Employment funding CAWX1904—“A toolbox to underpin and enable tomorrow’s marine biosecurity system.”
Conflict of Interest
The authors declare that the research was conducted in the absence of any commercial or financial relationships that could be construed as a potential conflict of interest.
Publisher’s Note
All claims expressed in this article are solely those of the authors and do not necessarily represent those of their affiliated organizations, or those of the publisher, the editors and the reviewers. Any product that may be evaluated in this article, or claim that may be made by its manufacturer, is not guaranteed or endorsed by the publisher.
Acknowledgments
The authors would like to thank Jessica Schattschneider for extracting data from the National Ballast Information Clearinghouse (NBIC) for the ballast capacity analyses. The New Zealand Ministry for Primary Industries (MPI) and the University of Melbourne Centre of Excellence for Biosecurity Risk Analysis (CEBRA) provided data used to develop and validate the framework. Ian Davidson, Andrew Jeffs, Gretchen Rasch, Abraham Growcott, and Rezvan Hatami provided constructive comments on early drafts. The manuscript was substantially improved due to feedback from Sarah Bailey and Kamal Ranatunga during peer review.
Supplementary Material
The Supplementary Material for this article can be found online at: https://www.frontiersin.org/articles/10.3389/fmars.2021.723782/full#supplementary-material
Abbreviations
NIS, non-indigenous species; GT, gross tonnage, a measure of vessel size; DWT, deadweight tonnage, a measure of a vessel’s cargo hauling capacity; WSA, wetted surface area of a vessel hull; BCPT, ballast water capacity as a proportion of gross tonnage; NBIC, National Ballast Information Clearinghouse; LMIU, Lloyd’s Maritime Intelligence Unit; MPI, New Zealand Ministry for Primary Industries; CEBRA, University of Melbourne Centre of Excellence for Biosecurity Risk Analysis; BLK, bulk carrier; TNK, tanker; GEN, general cargo; CON, container vessel; FSN, fishing vessel; RRO, roll on roll off; RFR, refrigerated cargo carrier (reefer); HVY, heavy lift vessel; PSS, passenger vessel; LSC, livestock carrier; LQG, liquified gas carrier.
References
ABS (2014). Ballast Water Treatment Advisory 2014. American Bureau of Shipping. Available online at: https://ww2.eagle.org/content/dam/eagle/advisories-and-debriefs/ABS_BWT_Advisory14312.pdf (accessed March 23, 2021).
AQIS (1993). Ballast Water Management, Ballast Water Research Series Report No. 4. Canberra: Australian Quarantine and Inspection Service.
Australian Government (2013). Antifouling and in-Water Cleaning Guidelines. Canberra: Department of Agriculture, Fisheries, and Forestry.
Bradie, J., and Leung, B. (2015). Pathway-level models to predict non-indigenous species establishment using propagule pressure, environmental tolerance and trait data. J. Appl. Ecol. 52, 100–109. doi: 10.1111/1365-2664.12376
Bradie, J. N., Drake, D. A. R., Ogilvie, D., Casas-Monroy, O., and Bailey, S. A. (2021). Ballast water exchange plus treatment lowers species invasion rate in freshwater ecosystems. Environ. Sci. Technol. 55, 82–89. doi: 10.1021/acs.est.0c05238
California State Lands Commission (2015). Article 4.8: Biofouling Management to Minimize the Transfer of Nonindigenous Species from Vessels Operating in California Waters. Proposed Regulatory Notice, July 31, 2015. Sacramento CA: California State Lands Commission Marine Facilities Division.
Carlton, J. T. (1985). Transoceanic and interoceanic dispersal of coastal marine organisms: the biology of ballast water. Oceanogr. Mar. Biol. Annu. Rev. 23, 313–374.
Cheng, M., Liu, T. K., Olenin, S., and Sua, P. X. (2019). Risk assessment model based on expert’s perspective for ballast water management. Ocean Coast. Manage. 171, 80–86. doi: 10.1016/j.ocecoaman.2019.01.009
Clarke, S., Hollings, T., Liu, N., Hood, G., and Robinson, A. (2017). Biosecurity risk factors presented by international vessels:a statistical analysis. Biol. Invasions 19, 2837–2850. doi: 10.1007/s10530-017-1486-1
Coutts, A. D. M., Piola, R. F., Hewitt, C. L., Connell, S. D., and Gardner, J. P. A. (2009). Effect of vessel voyage speed on survival of biofouling organisms: implications for translocation of non-indigenous marine species. Biofouling 26, 1–13. doi: 10.1080/08927010903174599
Coutts, A. D. M., Piola, R. F., Taylor, M. D., Hewitt, C. L., and Gardner, J. P. A. (2010). The effect of vessel speed on the survivorship of biofouling organisms at different hull locations. Biofouling 26, 539–553. doi: 10.1080/08927014.2010.492469
Coutts, A. D. M., and Taylor, M. D. (2004). A preliminary investigation of biosecurity risks associated with biofouling on merchant vessels in New Zealand. N. Z. J. Mar. Freshw. Res. 38, 215–229. doi: 10.1080/00288330.2004.9517232
David, M., and Gollasch, S. (2019). Risk assessment for ballast water management - learning from the Adriatic Sea case study. Mar. Pollut. Bull. 147, 36–46. doi: 10.1016/j.marpolbul.2018.02.003
David, M., Perkoviè, M., Suban, V., and Gollasch, S. (2012). A generic ballast water discharge assessment model as a decision supporting tool in ballast water management. Decis. Support Syst. 53, 175–185. doi: 10.1016/j.dss.2012.01.002
Davidson, I. C., Brown, C. W., Sytsma, M. D., and Ruiz, G. M. (2009). The role of containerships as transfer mechanisms of marine biofouling species. Biofouling 25, 645–655. doi: 10.1080/08927010903046268
Davidson, I. C., Ruiz, G. M., and Sytsma, M. D. (2006). The Implications of Maritime Vessel Traffic, Wetted Surface Area, and Port Connectivity for Hull-Mediated Marine Bioinvasions on the US West Coast. Report to the California State Lands Commission, Marine Invasive Species Program. Sacramento, CA: California State Lands Commission.
Davidson, I. C., Scianni, C., Minton, M. S., and Ruiz, G. M. (2018). A history of ship specialization and consequences for marine invasions, management and policy. J. Appl. Ecol. 55, 1799–1811. doi: 10.1111/1365-2664.13114
Dinno, A. (2017). Dunn’s Test of Multiple Comparisons Using Rank Sums. The Comprehensive R Archive Network (CRAN). Available online at: https://cran.r-project.org/web/packages/dunn.test/dunn.test.pdf (accessed March 08, 2021).
Dunn, O. J. (1964). Multiple comparisons using rank sums. Technometrics 6, 241–252. doi: 10.1080/00401706.1964.10490181
Frey, M. A., Simard, N., Robichaud, D. D., Martin, J. L., and Therriault, T. W. (2014). Fouling around: vessel sea-chests as a vector for the introduction and spread of aquatic invasive species. Manage. Biol Invasions 5, 21–30. doi: 10.3391/mbi.2014.5.1.02
Hatami, R., Lane, S., Robinson, A., Inglis, G., Todd-Jones, C., and Seaward, K. (2021). Improving New Zealand’s Marine Biosecurity Surveillance Programme: A Statistical Review of Biosecurity Vectors. Biosecurity New Zealand Technical Paper No: 2021/01. (Wellington: Ministry for Primary Industries), 93.
Hay, C., and Tanis, D. (1998). Mid Ocean Ballast Water Exchange: Procedures, Effectiveness and Verification, Cawthron Report No. 468. Nelson: Cawthron Institute.
Hewitt, C. L., and Campbell, M. L. (2007). Mechanisms for the prevention of marine bioinvasions for better biosecurity. Mar. Pollut. Bull. 55, 395–401. doi: 10.1016/j.marpolbul.2007.01.005
Hewitt, C. L., Gollasch, S., and Minchin, D. (2009). “The vessel as a vector - biofouling, ballast water and sediments,” in Biological Invasions in Marine Ecosystems, Vol. 204, eds G. Rilov and J. A. Crooks (Berlin: Springer-Verlag), 117–129. doi: 10.1007/978-3-540-79236-9_6
Inglis, G. J., Floral, O., Ahyong, S., Cox, S., Unwin, M., Ponder-Sutton, A., et al. (2010). The Biosecurity Risks Associated with Biofouling on International Vessels Arriving in New Zealand: Summary of the Patterns and Predictors of Fouling. Wellington: Ministry of Agriculture and Forestry.
International Maritime Organization [IMO] (2004). International Convention for the Control and Management of Ships’ Ballast Water and Sediments. London: International Maritime Organization.
International Maritime Organization [IMO] (2011). Guidelines for the Control and Management of Ships’ Biofouling to Minimize the Transfer of Invasive Aquatic Species. Marine Environment Protection Committee, Annex 26, Resolution MEPC.207 (62). London: International Maritime Organization.
Kaluza, P., Kölzsch, A., Gastner, M., and Blasius, B. (2010). The complex network of global cargo ship movements. J. R. Soc. Interface 7, 1093–1103. doi: 10.1098/rsif.2009.0495
Katsanevakis, S., Wallentinus, I., Zenetos, A., Leppakoski, E., Cinar, M. E., Ozturk, B., et al. (2014). Impacts of invasive alien marine species on ecosystem services and biodiversity: a pan-European review. Aquat. Invasions 9, 391–423. doi: 10.3391/ai.2014.9.4.01
Keller, R., Drake, J., Drew, M., and Lodge, D. (2011). Linking environmental conditions and ship movements to estimate invasive species transport across the global shipping network. Divers. Distrib. 17, 93–102. doi: 10.1111/j.1472-4642.2010.00696.x
Kruskal, W. H., and Wallis, W. A. (1952). Use of ranks in one-criterion variance analysis. J. Am. Stat. Assoc. 47, 583–621. doi: 10.1080/01621459.1952.10483441
Miller, A. W., Davidson, I. C., Minton, M. S., Steves, B., Moser, C. S., Drake, L. A., et al. (2018). Evaluation of wetted surface area of commercial ships as biofouling habitat flux to the United States. Biol. Invasions 20, 1977–1990. doi: 10.1007/s10530-018-1672-9
Ministerio del Ambiente (2014). No. D-ABG-013-12-2013: El Directorio de la Agencia de Regulación y Control de la Bioseguridad y Cuarentena para Galápagos. Registro Oficial N° 193, 32-34. Available online at: http://extwprlegs1.fao.org/docs/pdf/ecu168982.pdf (accessed June 11, 2021).
Molnar, J. L., Gamboa, R. L., Revenga, C., and Spalding, M. D. (2008). Assessing the global threat of invasive species to marine biodiversity. Front. Ecol. Environ. 6, 485–492. doi: 10.1890/070064
Moser, C. S., Wier, T. P., First, M. R., Grant, J. F., Riley, S. C., Robbins-Wamsley, S. H., et al. (2017). Quantifying the extent of niche areas in the global fleet of commercial ships: the potential for “super-hot spots” of biofouling. Biol. Invasions 19, 1745–1759. doi: 10.1007/s10530-017-1386-4
Moser, C. S., Wier, T. P., Grant, J. F., First, M. R., Tamburri, M. N., Ruiz, G. M., et al. (2016). Quantifying the total wetted surface area of the world fleet: a first step in determining the potential extent of ships’ biofouling. Biol. Invasions 18, 265–277. doi: 10.1007/s10530-015-1007-z
National Ballast Information Clearinghouse (2021). NBIC Online Database. Electronic Publication, Smithsonian Environmental Research Center & United States Coast Guard. Available online at: http://dx.doi.org/10.5479/data.serc.nbic (accessed November 27, 2020).
New Zealand Government (2014). Craft Risk Management Standards: Biofouling on Vessels Arriving to New Zealand. Wellington: Ministry for Primary Industries.
Ojaveer, H., Galil, B. S., Carlton, J. T., Alleway, H., Goulletquer, P., Lehtiniemi, M., et al. (2018). Historical baselines in marine bioinvasions: implications for policy and management. PLoS One 13:e0202383. doi: 10.1371/journal.Pone.0202383
PMNM (2009). Marine Alien Species Inspection Standards for Maritime Vessels. Honolulu, HI: Papahânoumakuâkea Marine National Monument.
R-project (2014). R: A Language and Environment for Statistical Computing. Available online at: http://www.R-project.org (accessed May 18, 2021).
Ruiz, G. M., Carlton, J. T., Grosholz, E. D., and Hines, A. H. (1997). Global invasions of marine and estuarine habitats by Non-Indigenous Species: mechanisms, extent, and consequences. Am. Zool. 37, 621–632. doi: 10.1093/icb/37.6.621
Saebi, M., Xu, J., Grey, E. K., Lodge, D. M., Corbett, J. J., and Chawla, N. (2020). Higher-order patterns of aquatic species spread through the global shipping network. PLoS One 15:e0220353. doi: 10.1371/journal.pone.0220353
Sardain, A., Sardain, E., and Leung, B. (2019). Global forecasts of shipping traffic and biological invasions to 2050. Nat. Sustain. 2, 274–282. doi: 10.1038/s41893-019-0245-y
Seebens, H., Gastner, M., and Blasius, B. (2013). The risk of marine bioinvasion caused by global shipping. Ecol. Lett. 16, 782–790. doi: 10.1111/ele.12111
Stopford, M. (ed.) (2009). “Chapter 14: The ships that provide the transport,” in MARITIME Economics, 3rd Edn, (London: Routledge), 815. doi: 10.4324/9780203891742
Suban, V. (2006). Model Določanja Količine Izpuščenega Balasta za Preteklo Obdobje s Pomočjo Izvedenih Podatkov. Master’s thesis. Portorož: University of Ljubljana.
UNCTAD (2019). United Nations Conference on Trade and Development: Review of Maritime Transport 2019. (New York, NY: United Nations Publications), 109.
Verling, E., Ruiz, G. M., Smith, L. D., Galil, B., Miller, A. W., and Murphy, K. R. (2005). Supply-side invasion ecology: characterizing propagule pressure in coastal ecosystems. Proc. R. Soc. B 272, 1249–1257. doi: 10.1098/rspb.2005.3090
Verna, D. E., Minton, M. S., and Ruiz, G. M. (2021). Trade exports predict regional ballast water discharge by ships in San Francisco Bay. Front. Mar. Sci. 8:638955. doi: 10.3389/fmars.2021.638955
Walters, S. (1996). Ballast Water, Hull Fouling and Exotic Marine Organism Introductions via Ships - a Victorian Study. Publication 494. Victoria: Environment Protection Authority.
Wang, S., Wang, C., Wang, S., and Ma, L. (2018). Big data analysis for evaluating bioinvasion risk. BMC Bioinformatics 19, 287:151–159. doi: 10.1186/s12859-018-2272-5
Xu, J., Wickramarathne, T. L., Chawla, N. V., Grey, E. K., Steinhaeuser, K., Keller, R. P., et al. (2014). “Improving management of aquatic invasions by integrating shipping network, ecological, and environmental data: data mining for social good,” in Proceedings of the 20th ACM SIGKDD International Conference on Knowledge Discovery and Data Mining, New York, NY. doi: 10.1145/2623330.2623364(pp.1699-1708
Keywords: marine invasive species, non-indigenous species, commercial shipping, biofouling, ballast water, marine biosecurity risk
Citation: Tzeng MW, Floerl O and Zaiko A (2021) A Framework for Compiling Quantifications of Marine Biosecurity Risk Factors Associated With Common Vessel Types. Front. Mar. Sci. 8:723782. doi: 10.3389/fmars.2021.723782
Received: 11 June 2021; Accepted: 26 August 2021;
Published: 28 September 2021.
Edited by:
Pedro Morais, University of Algarve, PortugalReviewed by:
Sarah Bailey, Great Lakes Laboratory for Fisheries and Aquatic Sciences, Department of Fisheries and Oceans (Canada), CanadaR. R. M. K. P. Ranatunga, University of Sri Jayewardenepura, Sri Lanka
Copyright © 2021 Tzeng, Floerl and Zaiko. This is an open-access article distributed under the terms of the Creative Commons Attribution License (CC BY). The use, distribution or reproduction in other forums is permitted, provided the original author(s) and the copyright owner(s) are credited and that the original publication in this journal is cited, in accordance with accepted academic practice. No use, distribution or reproduction is permitted which does not comply with these terms.
*Correspondence: Mimi W. Tzeng, mtze285@aucklanduni.ac.nz