- 1Theoretical Biology and Biophysics Group, Theoretical Division, Los Alamos National Laboratory, Los Alamos, NM, United States
- 2Physical Chemistry and Applied Spectroscopy Group, Chemistry Division, Los Alamos National Laboratory, Los Alamos, NM, United States
- 3Applied Computer Science Group, Computer, Computational, and Statistical Sciences Division, Los Alamos National Laboratory, Los Alamos, NM, United States
Vaccines have historically played a pivotal role in controlling epidemics. Effective vaccines for viruses causing significant human disease, e.g., Ebola, Lassa fever, or Crimean Congo hemorrhagic fever virus, would be invaluable to public health strategies and counter-measure development missions. Here, we propose coverage metrics to quantify vaccine-induced CD8+ T cell-mediated immune protection, as well as metrics to characterize immuno-dominant epitopes, in light of human genetic heterogeneity and viral evolution. Proof-of-principle of our approach and methods are demonstrated for Ebola virus, SARS-CoV-2, and Burkholderia pseudomallei (vaccine) proteins.
1 Introduction
Vaccines exploit the exceptional ability of the adaptive immune system to respond to, and remember, encounters with pathogens (1). Novel vaccine technologies (e.g., viral vector, DNA, or RNA) enable a “plug and play” approach to immunogen (part of the pathogen that can be recognized by the immune system) design (2). These technical advances inherently raise a number of challenges in vaccine immunology. First, the genetic diversity of highly variable pathogens makes it difficult to identify an immunogen that can be used in a vaccine to protect against infection. Second, in addition to targeting the genetic diversity of the pathogen, the most effective route to vaccine efficacy and protection is to engage multiple arms of the immune system (1). Thus, a first challenge is: given a pathogen, how to optimize the choice of immunogens.
A second challenge relates to the (molecular or cellular) mechanisms that mediate immune protection after vaccination or infection. Finding an immune response that correlates with protection can accelerate the development of new vaccines (3). Unfortunately, there exist significant gaps in our immunological knowledge of correlates of (vaccine- or infection-mediated) protection. Most current vaccine strategies aim to confer protection through antibodies (humoral response), which are produced by B cells. Yet, there exists substantial evidence of protective cellular immunity correlated with CD8+ T cell-mediated responses to conserved regions of the genome of HIV-1 (4), Lassa virus (5), SARS-CoV-2 (6, 7), pandemic influenza (8), and Ebola virus (9). Hence, a third challenge is to quantify the potential of CD8+ T cells to induce vaccine-mediated immune responses, and if possible, to identify viral immuno-dominant epitopes in these responses. CD8+ T cells (or cytotoxic T cells that kill infected cells) express a unique receptor on their surface: the T cell receptor (TCR). The binding of TCRs to immunogens on the surface of infected cells initiates an immune response (see Figure 1). In the case of CD8+ T cells, the immunogen is a bi-molecular complex composed of a viral peptide (a short protein fragment) bound to a major histocompatibility complex (MHC) class I molecule, referred to as a pMHC complex. In humans, the MHC molecule is also called human leukocyte antigen (HLA) (11, 12). This constitutes the MHC-restriction of TCR immunogen pMHC recognition. MHC-restriction brings additional challenges to the study of CD8+ T cell responses, since the HLA locus is the most polymorphic gene cluster of the entire human genome (11), and genome-wide association studies of host and virus genomes have shown that different HLA alleles exert selective pressure, driving in vivo viral evolution (e.g., hepatitis C virus (12, 13) and HIV-1 (14)). Our objective in this manuscript is to define novel metrics to quantify CD8+ T cell-mediated vaccine protein coverage, in light of human HLA heterogeneity, viral evolution, and immuno-dominant epitopes. This objective is rather pressing since we currently do not have accurate assays to link CD8+ T cell ex vivo or in vitro function measurements to in vivo responses (15–17). This knowledge is essential to improve our predictions of immune outcomes in response to pathogenic infection or vaccines (18, 19). Technology-driven advances combining highthroughput single-cell RNA-sequencing, paired TCRαβ-sequencing and high-dimensional flow cytometry have been essential to improve our understanding of CD8+ T cell sensitivity and specificity (20, 21). Current challenges include the detection and quantification of antigen-specific CD8+ T cell responses and TCR diversity, as well as CD8+ T cell function, and single-cell resolution methods (16). Part of this challenge includes dissecting the signals [including antigen (signal 1), co-stimulation (signal 2), and pro-inflammatory cytokines (signal 3)] that control CD8+ T cell memory formation and re-activation to improve vaccination (22), as well as identifying the different CD8+ T-cell subsets which mediate immune protection and quantifying their heterogeneity, functions, and therapeutic potential (23, 24).
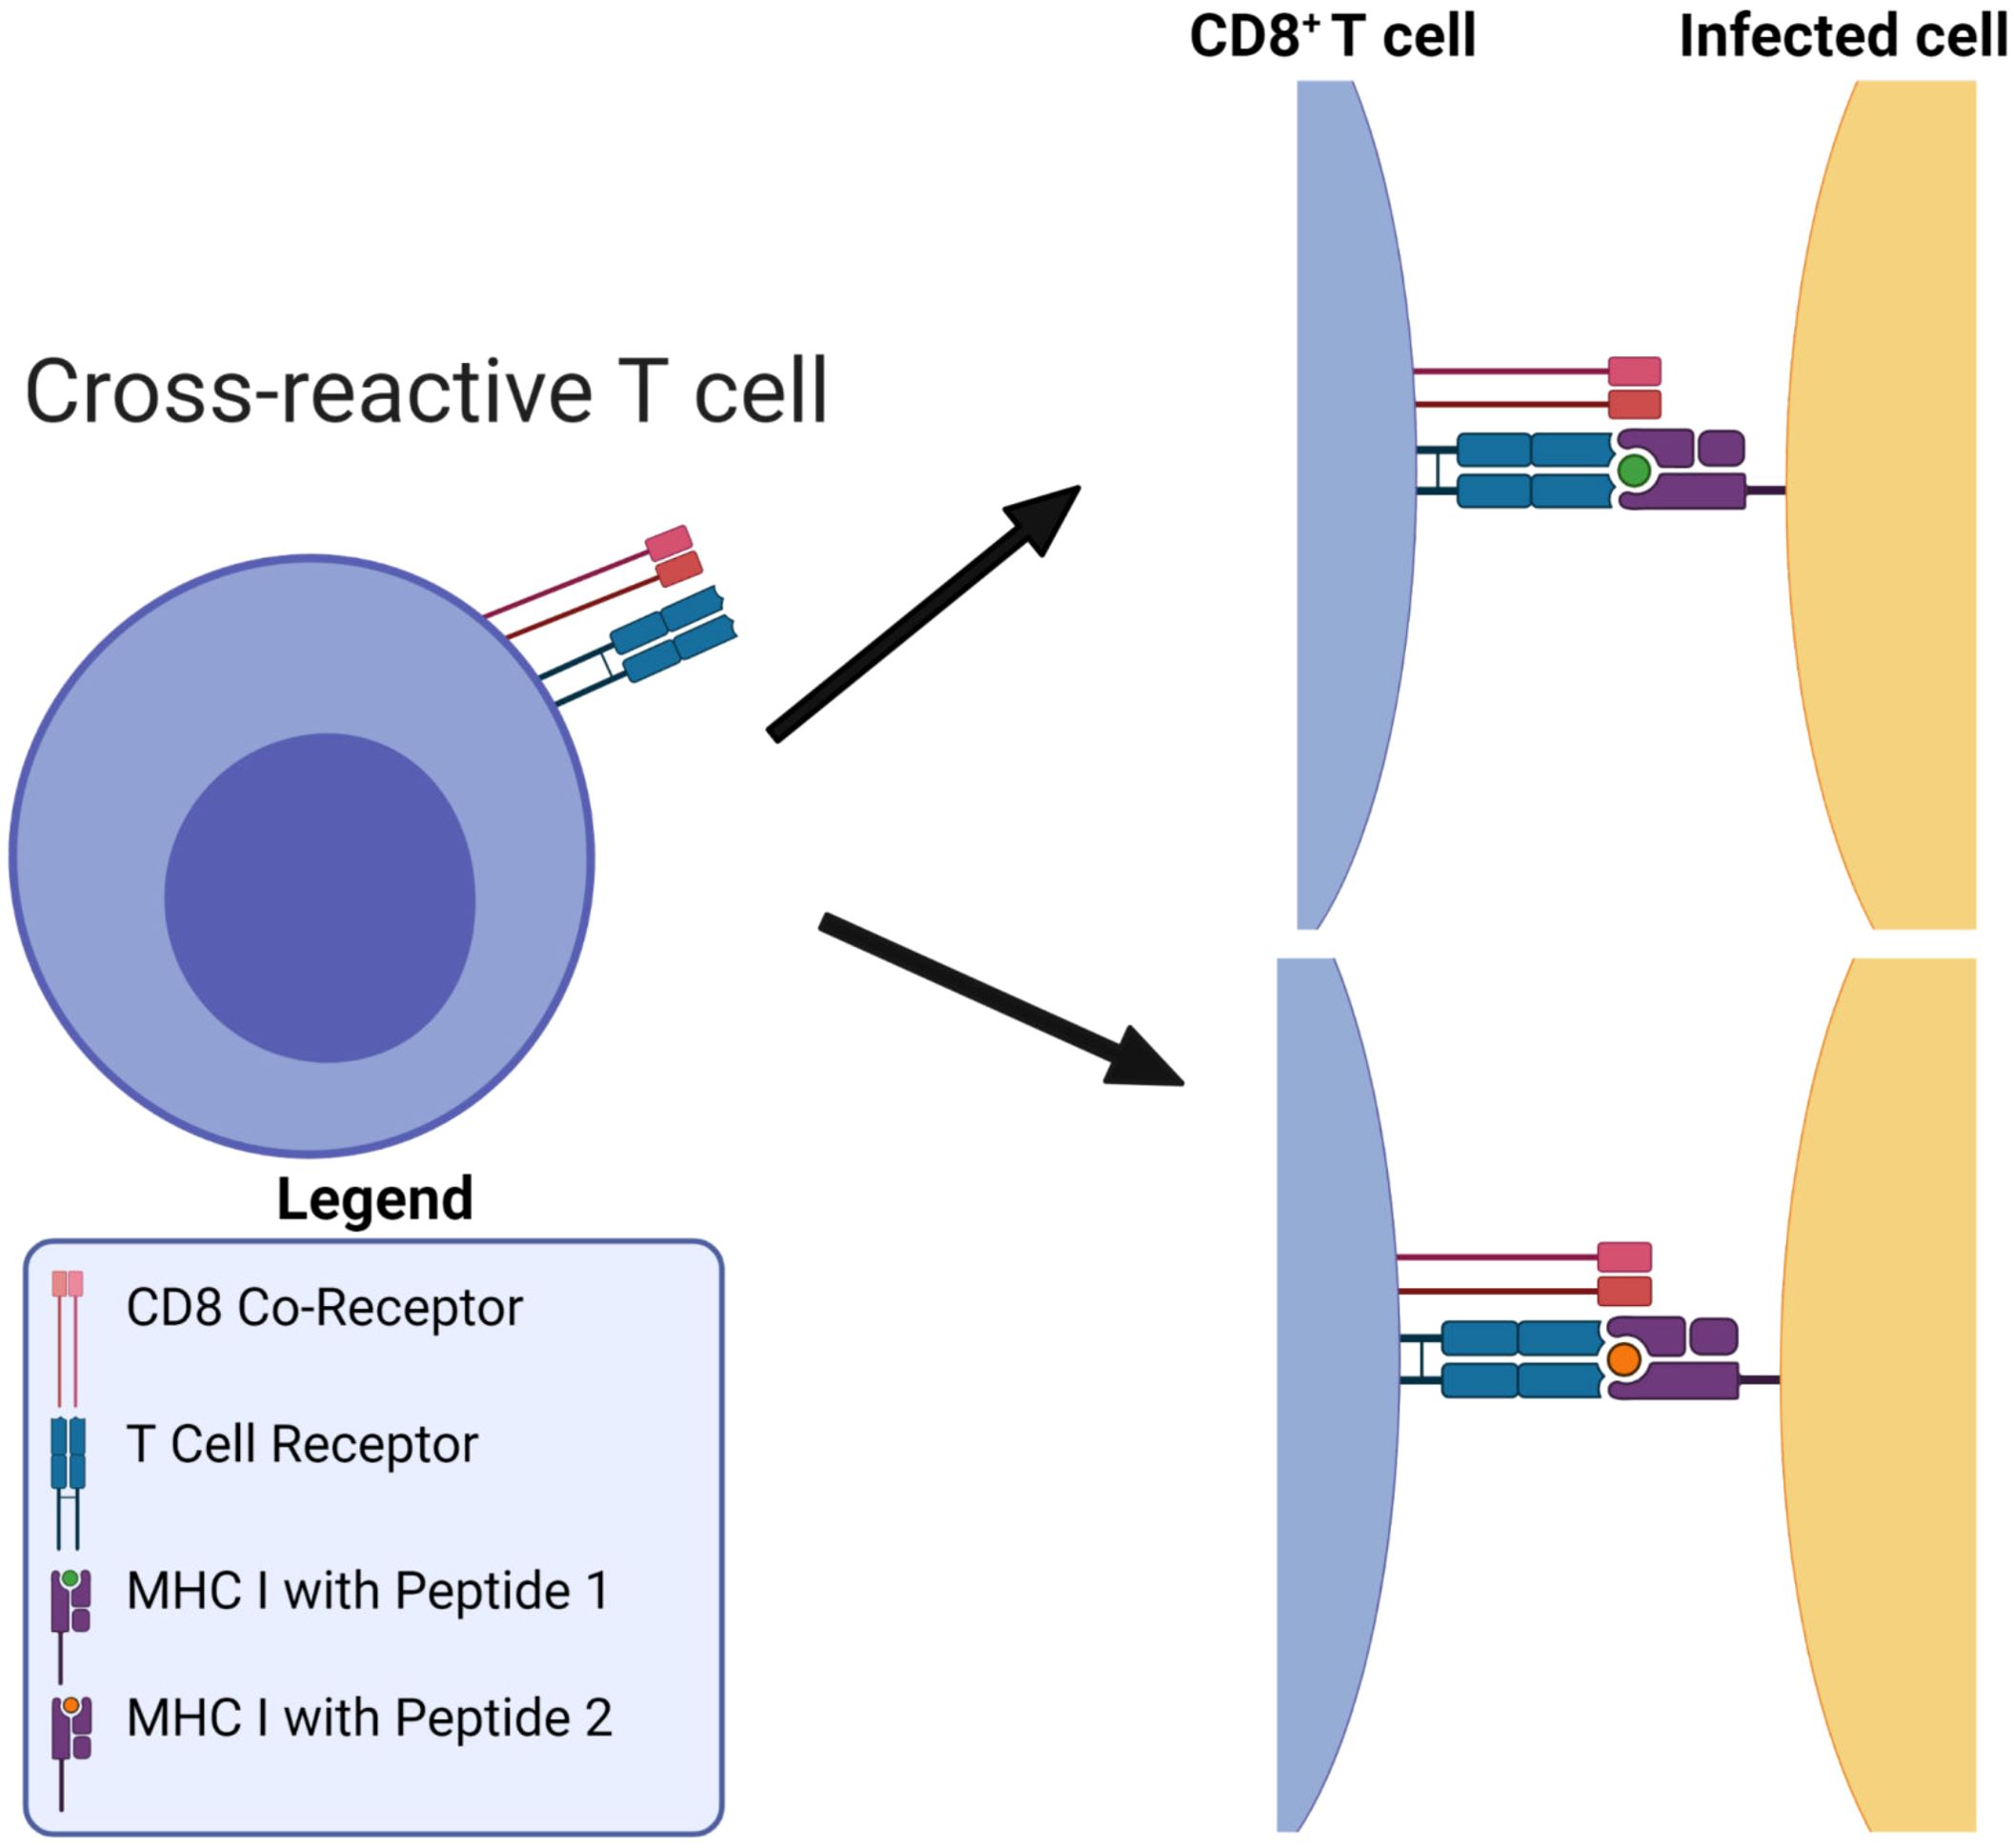
Figure 1. MHC-restriction in T cell receptor recognition of peptide-MHC complexes. T cell receptors are cross-reactive: they can bind to many different viral pMHCs. Figure reproduced from Ref (10, Figure 1) with permission under the terms and conditions of the Creative Commons Attribution license CC BY 4.0.
Desirable in a vaccine-induced CD8+ T cell immune response (25) is for it to be broad and directed against several immunogens, ideally from conserved genome regions, to reduce the possibility of selecting viral escape variants, and to make it more difficult for the virus to exhaust that response. We hypothesize that the problem to i) optimize CD8+ T cell-mediated vaccine coverage across the human population, while ii) minimizing viral escape, is best, and naturally, posed in terms of a multi-partite graph, given the HLA genetic heterogeneity, the bi-molecular (pMHC) nature of T cell immunogens, and that immunogen recognition by TCRs is inherently cross-reactive (see Figure 1). Thus, we propose to represent CD8+ T cell viral immunogen (pMHC) recognition as a multi-partite graph, , with four different sets of nodes (see Figure 2). The first set, , corresponds to eleven geographical regions covering the world’s human population (26), so that (); the second set, , to different HLA alleles in the human population (of a given region), so that ; the third set, , to different peptides (9 amino acids long derived from the vaccine protein of interest), so that ; and the fourth set, , to different possible TCR molecular structures, so that . Edges between nodes (from different sets) are as follows: i) an edge between a geographical region and an HLA allele encodes the frequency of that allele in the region (see section 2.1.1), i.e., is the frequency in r1 of allele a3; ii) an edge between an HLA allele and a peptide encodes the binding score of the HLA allele to the peptide and thus, represents both the affinity of this interaction and the stability of the pMHC complex (see section 2.1.2), i.e., s51 is the binding score of allele a5 to peptide p1; and iii) an edge between a peptide and a TCR encodes the binding score of the peptide to the TCR and thus, represents the immunogenicity of the peptide (see section 2.1.3), i.e., g41 is the immunogenicity of peptide p4 as measured by TCR t1 (see Figure 2). This novel graph approach allows us to address the above challenges: 1) viral genetic diversity of the pathogen is represented in the set of peptides, , so that wild type and all circulating (or predicted) variants can be analyzed, 2) HLA variability is considered with regard to geographical regions , HLA alleles , and their frequencies within each region, and 3) TCR recognition variability and the strength of the interaction with a peptide is accounted for by peptide immunogenicity (27). Finally, the entire multi-partite graph, , straightforwardly provides a metric to quantify vaccine coverage (see section 2.2), and the framework to characterize immuno-dominant peptides (experimentally identified) and to predict viral immune escape from CD8+ T cell recognition (28) (see section 4). Our methods will be applied to Ebola virus, SARS-CoV-2, and Burkholderia pseudomallei vaccine proteins.
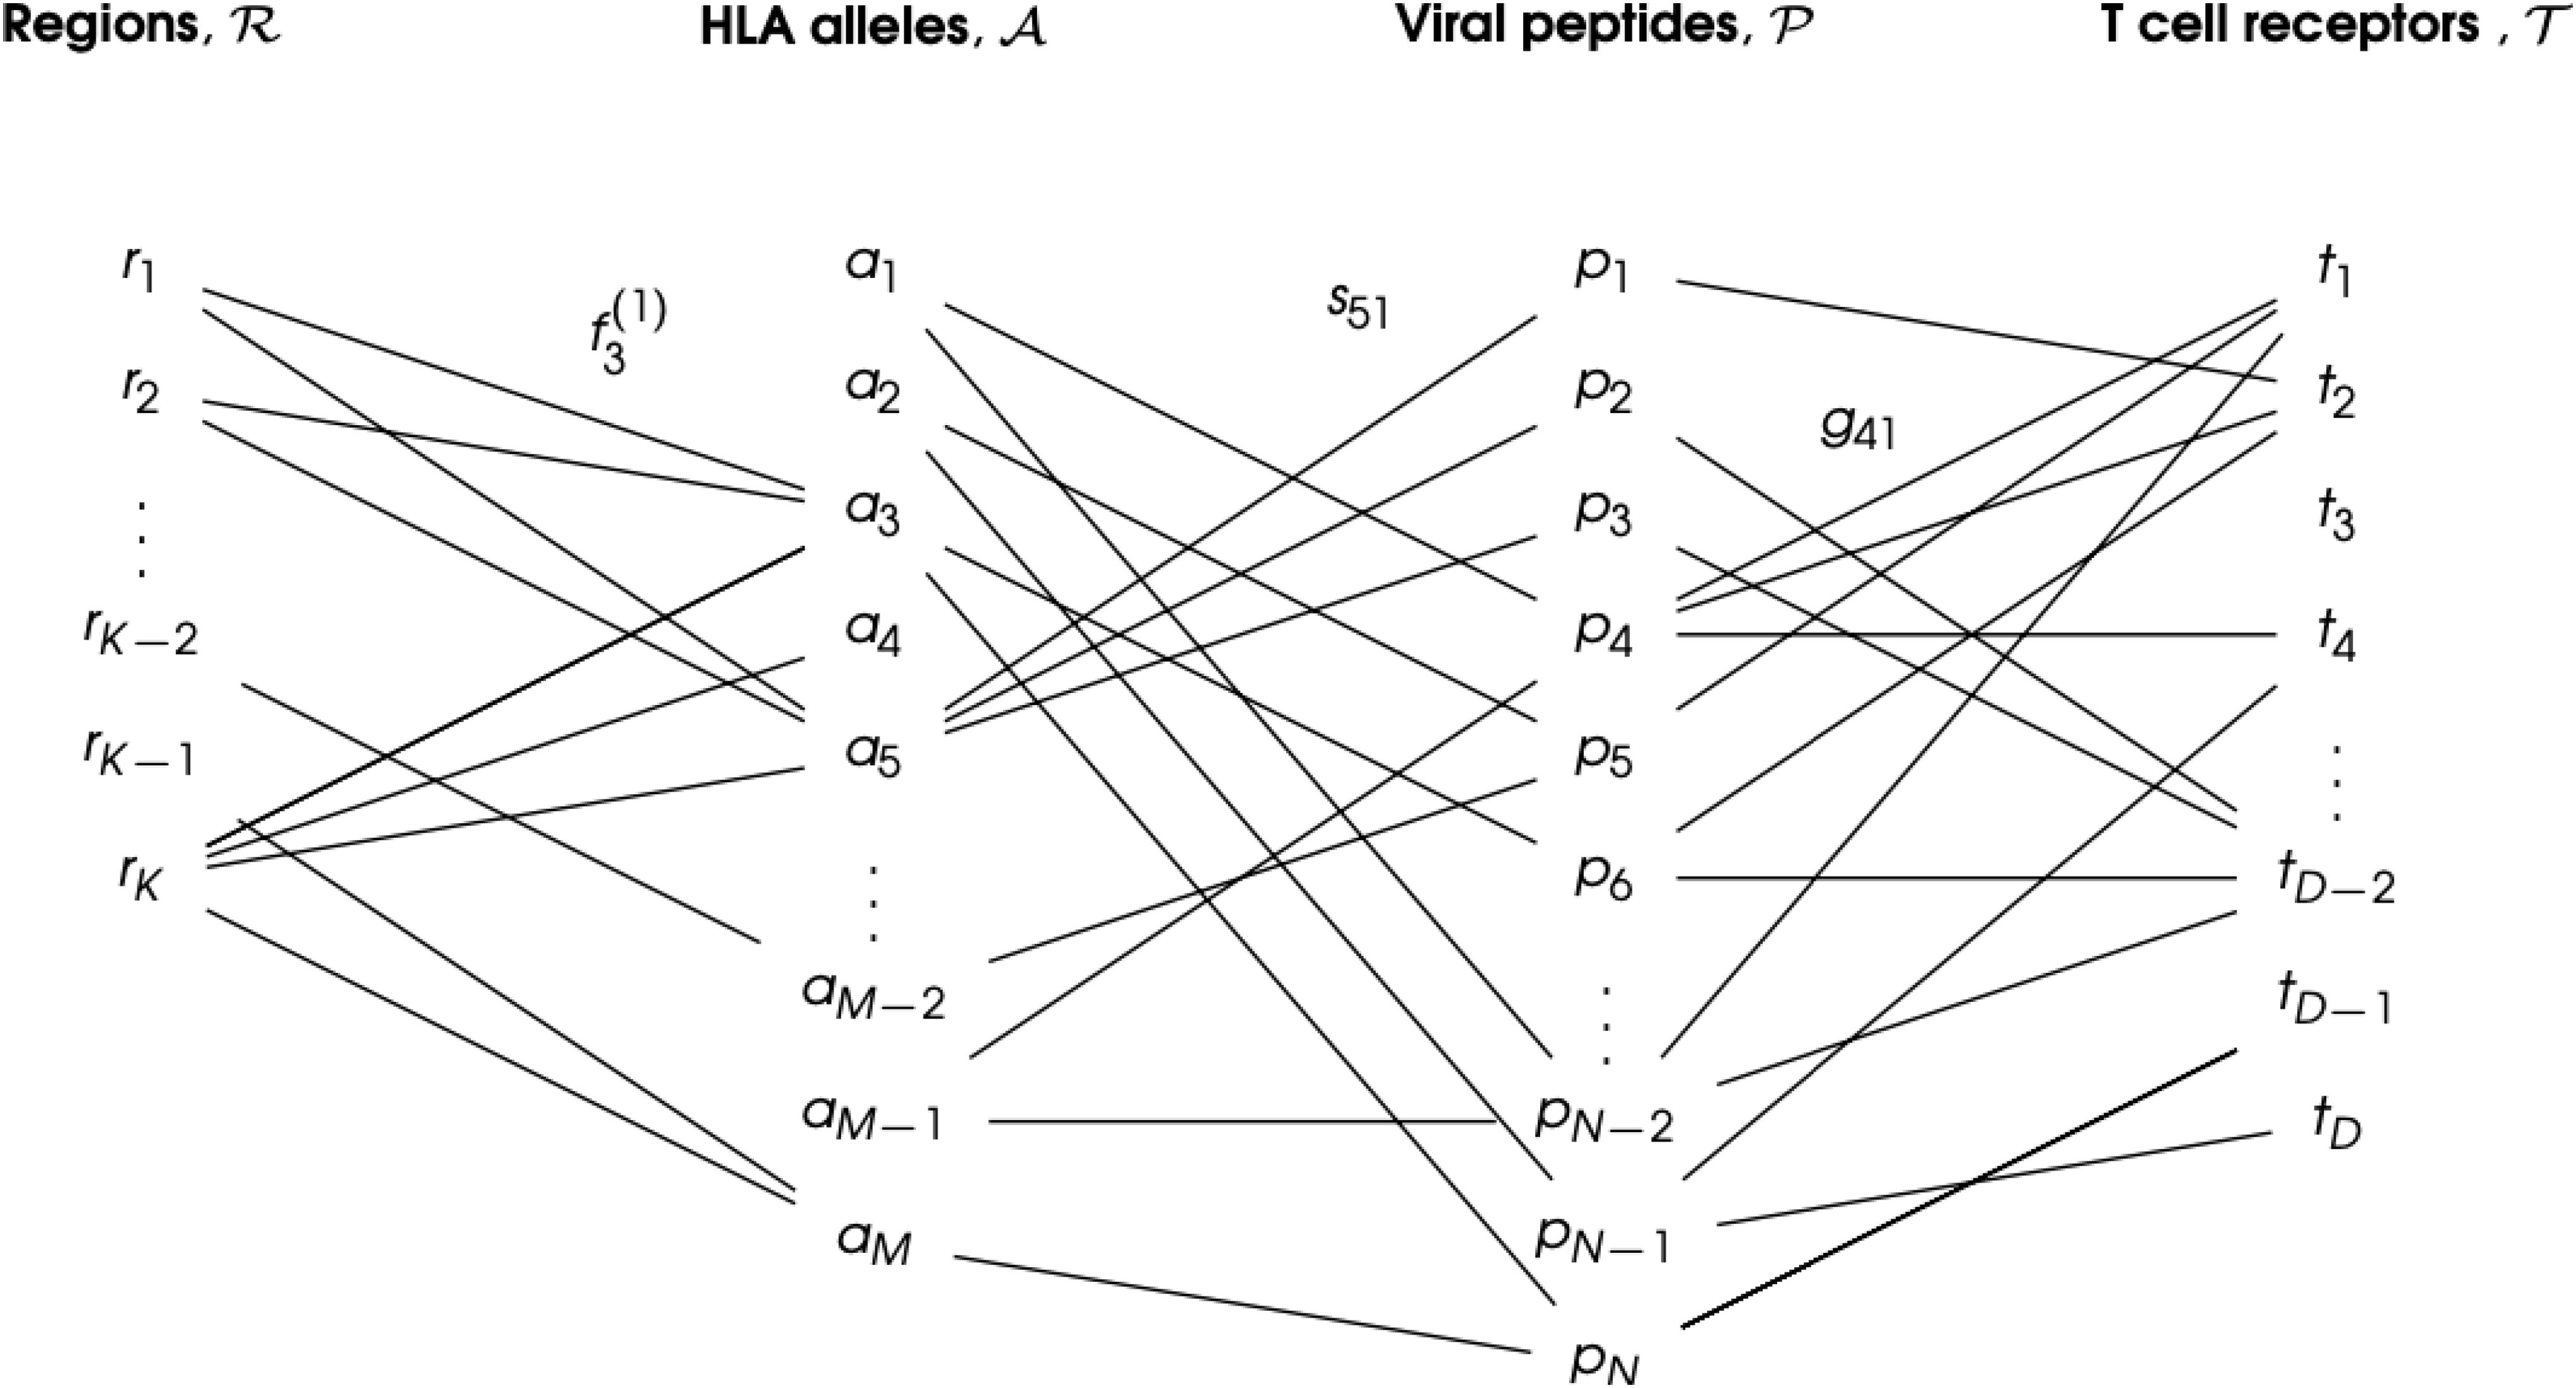
Figure 2. CD8+ T cell immunogen (pMHC) recognition as a multi-partite graph, , to account for geographical HLA allele variation. The set is composed of eleven geographical regions covering the world’s human population: (). The set is composed of the different M HLA class I alleles in the human population: . The set is composed of the N different peptides (9 amino acids long derived from the vaccine protein of interest): . The set is composed of the D possible TCR molecular structures, so that . An edge between a region (rk) and an allele (ai) indicates the human population of that region expresses the given allele, with frequency . An edge between an allele (ai) and a viral peptide (pj) indicates they can form a pMHC complex, with binding score sij. Finally, an edge between a viral peptide (pj) and a T cell receptor (tn) indicates the peptide is a TCR immunogen (or epitope), with immunogenicity gjn. Only a subset of the edges is shown for clarity.
A wide range of extremely valuable computational tools have already been developed to accelerate T cell epitope discovery and vaccine design, e.g., Predivac-3.0, a proteome-wide bioinformatics tool (29), Epigraph, a graph-based algorithm to optimize potential T cell epitope coverage (30), OptiTope, a web server for the selection of an optimal set of peptides for epitope-based vaccines (31, 32), or PEPVAC, a web server for multi-epitope vaccine development based on the prediction of MHC supertype ligands (33). Our interest and objective is slightly different from those of previous studies; we want to capture the contributions of human HLA class I heterogeneity, petide:TCR interaction, and the more often studied HLA allele:peptide interaction, to the magnitude and diversity of CD8+ T cell responses to vaccine proteins. We note that immunogenicity of a peptide as defined in Refs (29, 31, 32) is based on MHC class I binding affinity prediction methods, but not on the contribution of T cell receptor binding as considered in this manuscript (27) (see section 2.1.3). Furthermore, PEPVAC’s predictions of promiscuous epitopes are focused on five HLA I supertypes (HLA-A and HLA-B genes) (33), while we are interested in individual HLA class I allele frequencies in a given human population. Thus, in this paper we present a framework to characterize CD8+ T cell immunogen recognition, based on a multi-partite graph representation (see Figure 2), which can account for geographical variation in HLA class I allele frequencies (for each HLA allele type), HLA allele and peptide interaction, as well as peptide and T cell receptor interaction. The paper is organized as follows. Section 2 describes our methods and approaches; in particular, it presents the details of data acquisition, definition of the coverage metrics, regional and individual, to quantify HLA-driven variability of CD8+ T cell responses, as well as metrics to characterize and compare immuno-dominant CD8+ T cell epitopes. Results are presented in Section 3, where we focus our attention to the North America region. We have analyzed all regions and those results are included as Supplementary Material. We conclude with a discussion and plans for future work.
2 Materials and methods
2.1 Data acquisition
The generation of the multi-partite graph,, requires the following steps. Step I: make use of existing databases, such as Allele Frequency Net Database, to obtain HLA class I allele frequencies for the eleven different geographical regions (see section 2.1.1): Australia, Europe, North Africa, North America, North-East Asia, Oceania, South and Central America, South Asia, South-East Asia, Sub-Saharan Africa, and Western Asia. This will determine the elements in sets and , as well as the edges between them. Step II: choose a vaccine protein and make use of the database, Immune Epitope Database, to obtain binding scores for pairs of HLA class I alleles and 9-mer peptides (or nonamers) (see section 2.1.2 ). This determines the elements in set , as well as the edges between elements of and . Step III: compute the immunogenicity of elements in the set making use of methods described in (27) (see section 2.1.3). In this way, we obtain the edges between elements of and a representative element of . We now describe in greater detail these steps, in particular how we collect data directly from databases (see sections 2.1.1 and 2.1.2), and how mean immunogenicity is computed based on the approach from Ref (27) (see section 2.1.3).
2.1.1 HLA class I allele frequencies
Every individual has a total of six (classical) HLA class I alleles: two HLA-A, two HLA-B, and two HLA-C alleles (11). Here, we are interested in defining coverage metrics for each HLA type, i.e., A, B, or C, so that they can be compared. Thus, in what follows we consider each allele type (A, B, or C) separately.
Allele frequency data were obtained from the Allele Frequency Net Database (34, 35). We have restricted our analysis to studies with a gold or silver population standard 1, and have considered HLA class I alleles with two sets of digits, e.g., HLA-B∗35:05. This nomenclature indicates the HLA molecule of gene B, with the first two numbers representing the serologic assignment, and the last two, the unique sequence (36). No allele suffix has been included in our results to indicate its expression status (37). It is out of the scope of this paper to consider differences in expression levels of the different HLA types (A, B, or C) (38). The HLA database divides its data into eleven geographical regions (34, 35), and each of these regions is subdivided into a number of locations 2. Independent studies (from peer-reviewed publications, HLA and immuno-genetics workshops, individual laboratories, and short publication reports in collaboration with the Human Immunology journal) were conducted to determine allele frequencies at each location. The database contains local (at the location of the study) allele frequencies, calculated using the following equation
where fi,ℓ is the frequency of allele ai at location ℓ, “copies of ai” refers to the total number of copies of allele ai in the population sample at the given location, and nℓ to the sample size of the population in the local study (at location ℓ). The factor two is required since humans are diploids, and thus, there are two alleles for each gene (11). We note that Equation 1 will be used for each HLA type (A, B, or C). To compute the regional allele frequency based on the frequency data provided for each location, we take the weighted average of the local frequencies; that is, if we denote by , with K = 11, the different regions, the frequency of allele ai in rk, , with 1 ≤ k ≤ K, is given by
where is the total number of study locations in region , the frequency of allele at location (defined in Equation 1), and ℓ the sample size at location ℓ. We note that once the regional frequency of each allele is calculated, the sum (over alleles) of their regional frequencies is close to one, but not necessarily equal to one (39). Therefore, we define
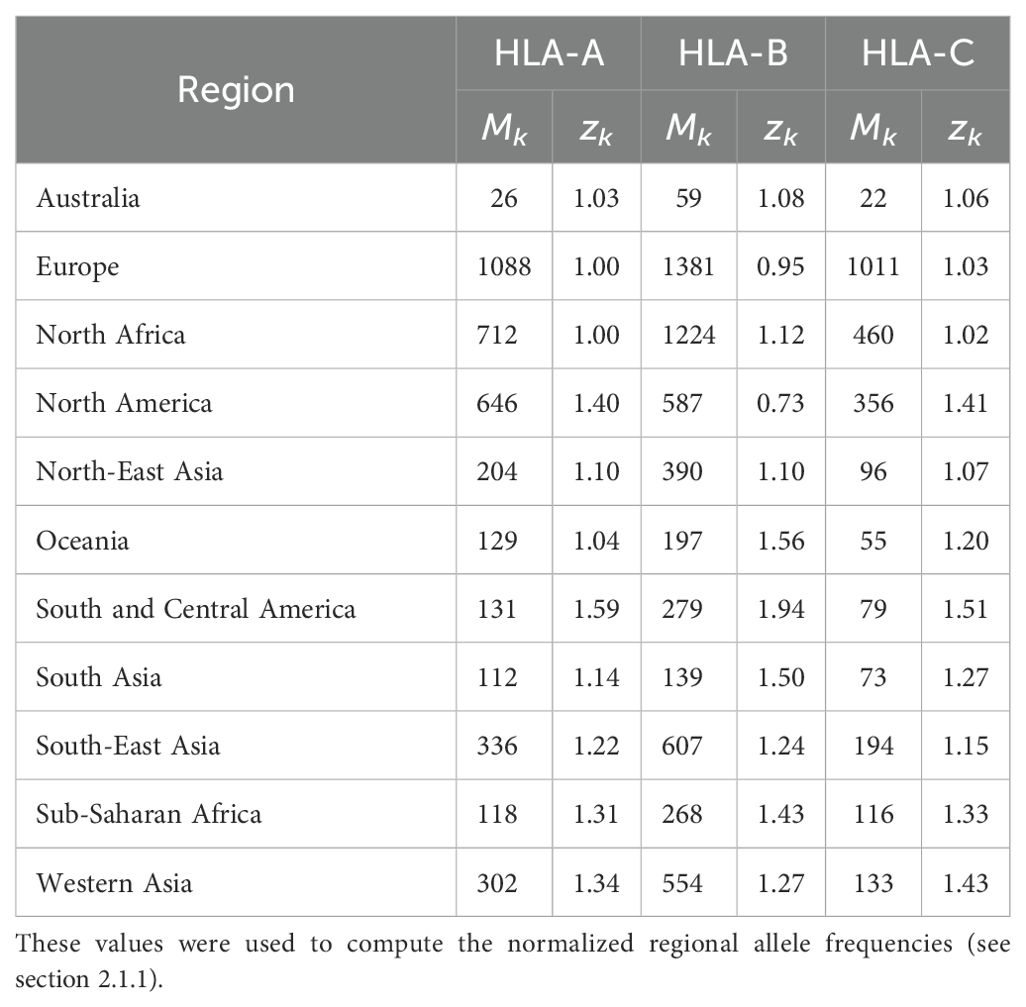
where is the normalized frequency of allele in region , the number of different unique alleles found in region , and we have introduced the variable , the sum of the regional frequencies of all alleles in region . We note that both and depend on the region under consideration, and thus, our choice of notation includes this fact (as a lower index). Table 1 provides the values of Mk and zk for each region and allele type (HLA-A, HLA-B, and HLA-C).
2.1.2 Binding scores of HLA class I alleles to 9-mer peptides
The next step is to choose a protein, under consideration for use in a vaccine, and analyze all its (linear) 9-mer (9 amino acids long) peptides (or nonamers), which can be potential CD8+ T cell epitopes. We note that if the protein is P amino acids long, there will be a total of P −9 + 1(= P −8) 9-mer peptides. For the protein of interest, we denote the set of such nonamers by with N = P − 8. HLA class I allele binding scores (for each HLA type) to CD8+ T cell epitopes can be generated with the Immune Epitope Database (IEDB) (40). Let us consider HLA class I allele ai and epitope pj (from a vaccine protein). Given ai and pj, the IEDB database provides a binding score, sij, for the pair (ai, pj). The predictions are made with the NetMHCpan-4.1 method (41). Binding scores range from 0 to 1, with higher scores correlating with greater affinity (or inverse dissociation equilibrium constant) of the interaction between the HLA class I allele ai and the peptide pj. Thus, for a given peptide pj, we will obtain binding scores for each of the HLA class I alleles: type A, B, and C.
2.1.3 Immunogenicity of CD8+ T cell epitopes
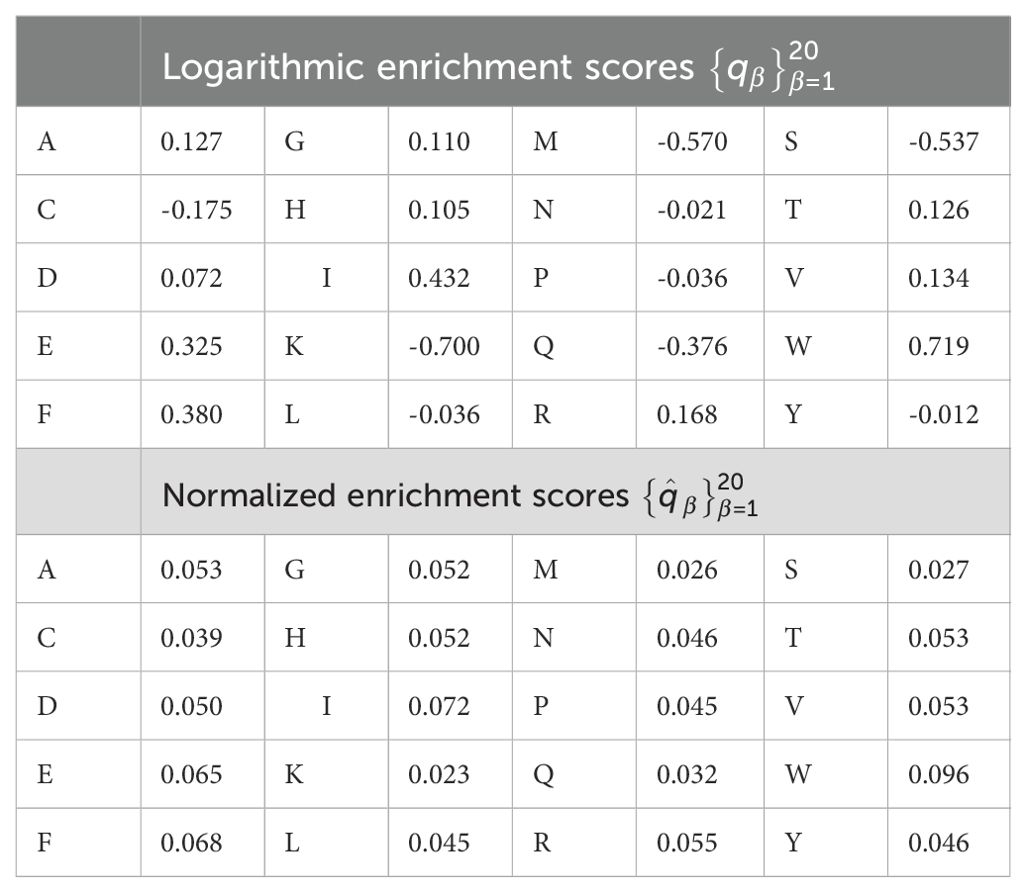
We now discuss the concept of immunogenicity: a variable to quantify the likelihood that a CD8+ T cell receptor will recognize a viral peptide (or nonamer) (27). The authors of Ref (27) argue that a given pMHC complex is only a TCR epitope if it is the target of a specific T cell immune response. Thus, it is important to distinguish between pMHC complexes which are non-epitopes and those which are epitopes, for the purposes of vaccine development. They then propose a theoretical approach to quantify this difference, what they call peptide immunogenicity, and describe how experimental determination via peptide-immunization assays informs and validates their methods. In particular, peptide immunogenicity as proposed in Ref (27) is calculated based on the preference that T cell receptors have for certain amino acids (or enrichment score), and the positions of those amino acids within the nonamer peptide chain. Enrichment scores, as provided in Ref (27) correspond to logarithmic enrichment values per amino acid, which we denote by qβ, with 1 ≤ β ≤ 20. Since our aim is to define a non-negative vaccine coverage metric, it is useful to convert such amino acid logarithmic enrichment scores into non-negative and normalized enrichment scores, , with . Table 2 provides both the set of values and . A second contribution to the mean TCR immunogenicity of a 9-mer peptide comes from the specific positions of its amino acids within the nonamer chain. Ref (27) provides the relative weight (or importance) of position α in the nonamer chain, wα, with 9. Again, since we are interested in defining a non-negative vaccine coverage metric and the binding scores belong to the interval [0,1] (see section 2.1.2), it is appropriate to normalize these weights. We, thus, introduce . Table 3 provides both the set of values and . We note that amino acids in positions 1, 2 or 9 do not contribute to the immunogenicity of the nonamer, since these positions are anchor residues, which interact with the MHC molecule. We now can define the immunogenicity of a nonamer (27). The immunogenicity, , of nonamer , with , is given by
where is the normalized enrichment score of the amino acid of peptide pj in position α, with 1 ≤ α ≤ 9 and , and is given in Table 3.
We conclude this section with a few observations. The normalizations proposed ensure that the immunogenicity of a viral peptide is positive definite, as is the case for the binding scores presented in the previous section. Its values range from 0.023 (when the epitope consists of lysine only) to 0.096 (when the nonamer consists of tryptophan only). We have made use of the concept of immunogenicity as introduced by Ref (27). More recently Bravi et al. have developed a sequence-based approach using transfer learning and Restricted Boltzmann Machines (RBM) to predict antigen immunogenicity and specificity (42). Their proposed method, diffRBM encodes molecular features of immunogenicity with HLA-specific strategies. Finally, we note that current estimates of the human TCR diversity in a given individual are of the order of 107 −108 (43–45), and thus, we do not have precise knowledge of specific TCR sequences; that is, for a given individual, we cannot enumerate the set . Without this enumeration we are unable to define edges elements in the sets and , and the best we can do is to compute the immunogenicity of an element in . It is, then, out of the scope of this paper to consider these edges in the multi-partite graph (see Figure 2). Our analysis will proceed on the basis of a multi-partite graph with sets , , and , with mean immunogenicity of a peptide to a representative T cell receptor as a proxy for the edges to elements in the set .
2.2 Coverage metric to quantify HLA-driven variability of CD8+ T cell responses
We now have all the ingredients to define a coverage metric to quantify HLA-driven variability of CD8+ T cell responses to a (vaccine) protein. We first introduce a mean regional coverage metric, and then we propose, since an individual only expresses two alleles of a given HLA class I, an individual regional coverage metric and a corresponding mean individual regional coverage metric.
2.2.1 Mean regional coverage metric: a definition
We define, for a given (vaccine) protein, its mean regional coverage metric in region , , as follows
where M is the number of alleles considered (M = 25 in what follows, and we note that M ≠ Mk, see section 3), index i and index sum over alleles, is the normalized frequency of allele ai in region rk (defined in Equation 3), N is the total number of nonamer (linear) epitopes that can be formed from the (vaccine) protein under consideration, index j sums over nonamers, sij is the binding score of the interaction between allele ai and nonamer pj (defined in section 2.1.2), and gj is the immunogenicity of pj (defined in Equation 4). We have introduced σi, for , defined by
and which measures how well (on average) allele ai binds to the nonamers from the vaccine protein of interest, with binding score weighted by nonamer immunogenicity to CD8+ T cell receptors. Equation 5 and Equation 6 will be used for each HLA class I allele type separately; that is, for a given region and vaccine protein, we will obtain three different values for HLA-A, HLA-B, and HLA-C alleles. We note that our choice for M is discussed in section 3.
2.2.2 Individual regional coverage metric: two definitions
We note that , as defined by Equation 5, does not consider the fact that an individual only presents two alleles of each type, and not M. In order to properly account for this fact, we now turn to define an individual regional coverage metric. To this end, each individual in a region will be described by an allele pair (for each type), drawn out of the M different alleles in the region. For the purposes of this study, we have chosen M = 25 for each region and allele type (see section 3). This implies that we confine our analysis to individuals whose alleles are drawn from a list of the top M (most frequent) alleles (of each type) in their region. We note that for each allele type (A, B, or C), there are a total of different allele pairs, each of them representing an individual in region . We define the individual regional coverage metric, , for an individual of region and where , with allele pair , as follows
where we have assumed that each of the alleles in the pair q, drawn from region rk, contributes equally and linearly (in the variable σ) to the individual coverage metric (see Supplementary Material for a discussion on different possible and educated choices for ). Next, making use of the regional frequencies for each allele (see section 2.1.1), we compute the regional frequency of each individual; that is, the regional frequency of each allele pair (for a given type). Let represent the regional frequency (in region ) of an individual with allele pair . If the individual has two copies of a given allele, , with , then we have . If the two alleles are different, , with , and , then we have , since an individual with allele pair is equivalent to one with allele pair . We note that this analysis does not account for potential correlations between HLA alleles, or allele associations (see Supplementary Material for a discussion on allele associations, and how they can be incorporated in our analysis). With these considerations, we can now define the mean individual regional coverage metric, , in region as the weighted average of the coverage metric for each individual in the population; that is, we can write
where we have introduced the variable , which is the sum of the frequencies of allele pairs, and a measure of the fraction of allele pairs represented in the different M alleles for a given region. We show in the Supplementary Material that with the definition (and choice) of Equation 7 for , in the absence and presence of correlations between HLA alleles, the mean regional and the mean individual regional coverage metrics are the same; that is, with the choice of Equation 7, one has , even when there exist associations between HLA alleles. We note that Equation 7 corresponds to an individual coverage metric, , with equal and linear contributions ( and ) from each allele in the pair ( and ), and thus, the process of averaging over the different allele pairs (see Equation 8), with frequencies , will erase any trace of potential allele correlations.
From now on, we will compute for the different regions, HLA alleles, and vaccine proteins of interest, since it is simpler than , and we have shown that is equal to , under the assumption of no HLA allele associations and a choice for . Were we to be provided with true allele pair frequencies, then those could be directly introduced in Equation 8 to obtain . It is interesting to observe that the difference between and will encode inherent HLA allele associations, and thus, it is a measure of such correlations (12). In the Supplementary Material we provide further quantitative details on how allele associations will modify for two different choices of the individual regional coverage metric, .
2.3 Metrics to characterize and compare immuno-dominant CD8+ T cell epitopes
In the previous section we have defined two coverage metrics (mean regional and mean individual regional) to quantify CD8+ T cell responses to (vaccine) proteins and their linear 9-mer peptides, as well as their HLA class I heterogeneity based on regional allele frequency differences. As described and reviewed in Ref (11) not only is the quality of a CD8+ T cell response a strong correlate of immune protection, but the relative contribution from the different potential 9-mer peptides (derived from a single protein) can be important to identify immune protection. In fact, it is well known that CD8+ T cell responses are generally characterized by an immuno-dominance hierarchy of the different nonamers (11), which leads to CD8+ T cell responses focused on a small subset of epitopes. A wide range of factors regulate these hierarchies for a given (vaccine) protein: from antigen processing and presentation, to the affinity of the nonamer for MHC class I molecules and the stability of these pMHC complexes, the expression levels of MHC molecules, the affinity of the pMHC complex for TCR molecules and the stability of these complexes, and to CD8+ T cell competition (11, 12, 38). It is clearly out of the scope of this manuscript to consider all of these factors. Our aim here is to investigate i) the contribution of known immuno-dominant epitopes to the coverage metrics defined earlier, and ii) where the known immuno-dominant epitopes fall in suitably defined distributions. In what follows we restrict our study to the SARS-CoV-2 spike protein and Ebola glycoprotein (GP) immuno-dominant nonamers found in Refs (46, 47), respectively. SARS-CoV-2 spike protein immuno-dominant nonamers [obtained from Table 2 of Ref (46)] are presented in Table 4 and those for Ebola GP protein [obtained from Table 2 of Ref (47)] in Table 5.

Table 4. SARS-CoV-2 spike protein immuno-dominant epitopes from Table 2 of Ref (46) and their presence (or absence) in five different SARS-CoV-2 strains.
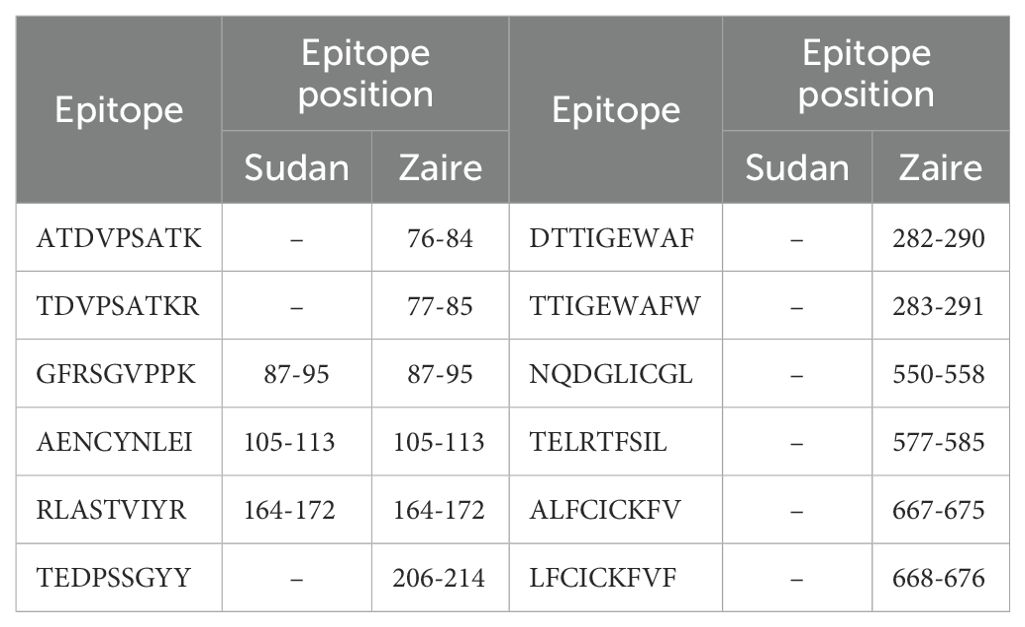
Table 5. Ebola GP protein immuno-dominant epitopes from Table 2 of Ref (47) and their presence (or absence) in two different Ebola strains (Sudan and Zaire).
We notice that different viral strains have a different number, η, of immuno-dominant epitopes. We have η = 6, 5, 5, 6, 6, 12, 3 for SARS-CoV-2 Wuhan-Hu-1, SARS-CoV-2 Delta AY.4, SARS-CoV-2 Omicron BA.1, SARS-CoV-2 Omicron BA.2, SARS-CoV-2 Omicron BA.5 spike, Ebola (Zaire) GP, and Ebola (Sudan) GP, respectively. We first evaluate the contribution of known immuno-dominant epitopes to the coverage metrics defined earlier, by defining (for a given protein) the immuno-dominant mean regional coverage metric, , as follows
We are, in fact, interested in the ratio
where we have introduced the notation , which is the contribution to from the immuno-dominant epitopes. The previous approach can be (easily) extended to the individual regional coverage metric, to evaluate the contribution to this variable from the subset of immuno-dominant epitopes. Let us define for an allele pair q (see notation in section 2.2.2), , as follow
We now introduce the immuno-dominant mean individual regional coverage metric, , given by
and the ratio , with , defined as
We note that , and , since we have assumed no HLA allele associations. Yet, we point out that if frequencies of allele pairs were available, it would be valuable to compute and to characterize and quantify the role of HLA allele correlations in the contribution of the immuno-dominant CD8+ T cell epitopes to the mean individual regional coverage. The contribution of immuno-dominant nonamers to the mean regional coverage metric is presented in section 3.4.
We now turn to show that the known immuno-dominant epitopes (for the vaccine proteins considered in this section) belong to the tail of suitably defined distributions (these results are provided in section 3). We, thus, define for any , the following variables (averaging over the top alleles in a given region)3:
and gj given by Equation 4, with 1 ≤ j ≤ N. We call Sj the mean MHC-binding score of peptide pj, and ϕj, its mean TCR-MHC combined immunogenicity. We note that gj only depends on the vaccine protein of interest and is independent of the geographical region considered. On the other hand, Sj and ϕj depend on the geographical region considered, since the sum over alleles is different for each region, and on HLA class I allele type. Thus, for a given vaccine protein, we have generated the probability distributions for the variables , , and , and evaluated where in these distributions the corresponding immuno-dominant epitopes fall (see section 3.5).
3 Results
As a demonstration of the methods introduced and discussed in Section 2, we apply them to exemplar pathogens and corresponding proteins. We chose one bacterium (Burkholderia pseudomallei) and two viruses (a widespread virus, SARS-CoV-2, and a geographically restricted one, Ebola) to explore different and interesting cases. Specifically, we will analyze the following proteins: i) Burkholderia pseudomallei Hcp1 (A5PM44), ii) Ebola (Zaire) GP (Q05320), iii) Ebola (Sudan) GP (Q7T9D9), iv) Ebola (Zaire) NP (P18272), v) Ebola (Sudan) NP (A0A6M2Y086), vi) SARS-CoV-2 Wuhan-Hu-1 spike (EPI_ISL_402124), vii) SARS-CoV-2 Delta AY.4 spike (EPI_ISL_1758376), viii) SARS-CoV-2 Omicron BA.1 spike (EPI_ISL_6795848), ix) SARS-CoV-2 Omicron BA.2 spike (EPI_ISL_8135710), and x) SARSCoV-2 Omicron BA.5 spike (EPI_ISL_411542604). In brackets we have provided UniProt accession numbers for the first five proteins, and GISAID accession numbers for the last five. The values of P (see section 2.1.2) are given by P = 169, 676, 676, 739, 738, 1273, 1271, 1270, 1270, and 1268, respectively. In our HLA analysis, we have chosen M to be equal to 25 (the top 25 most frequent alleles per region) for all regions and HLA class I types, except for HLA-C in Australia, where M = 22, since that was the total number of alleles available in the database. The values of Mk and zk are provided in Table 1. The top 25 alleles per region and per HLA class I type are provided in Table 6 for HLA-A, Table 7 for HLA-B, and Table 8 for HLA-C, respectively.
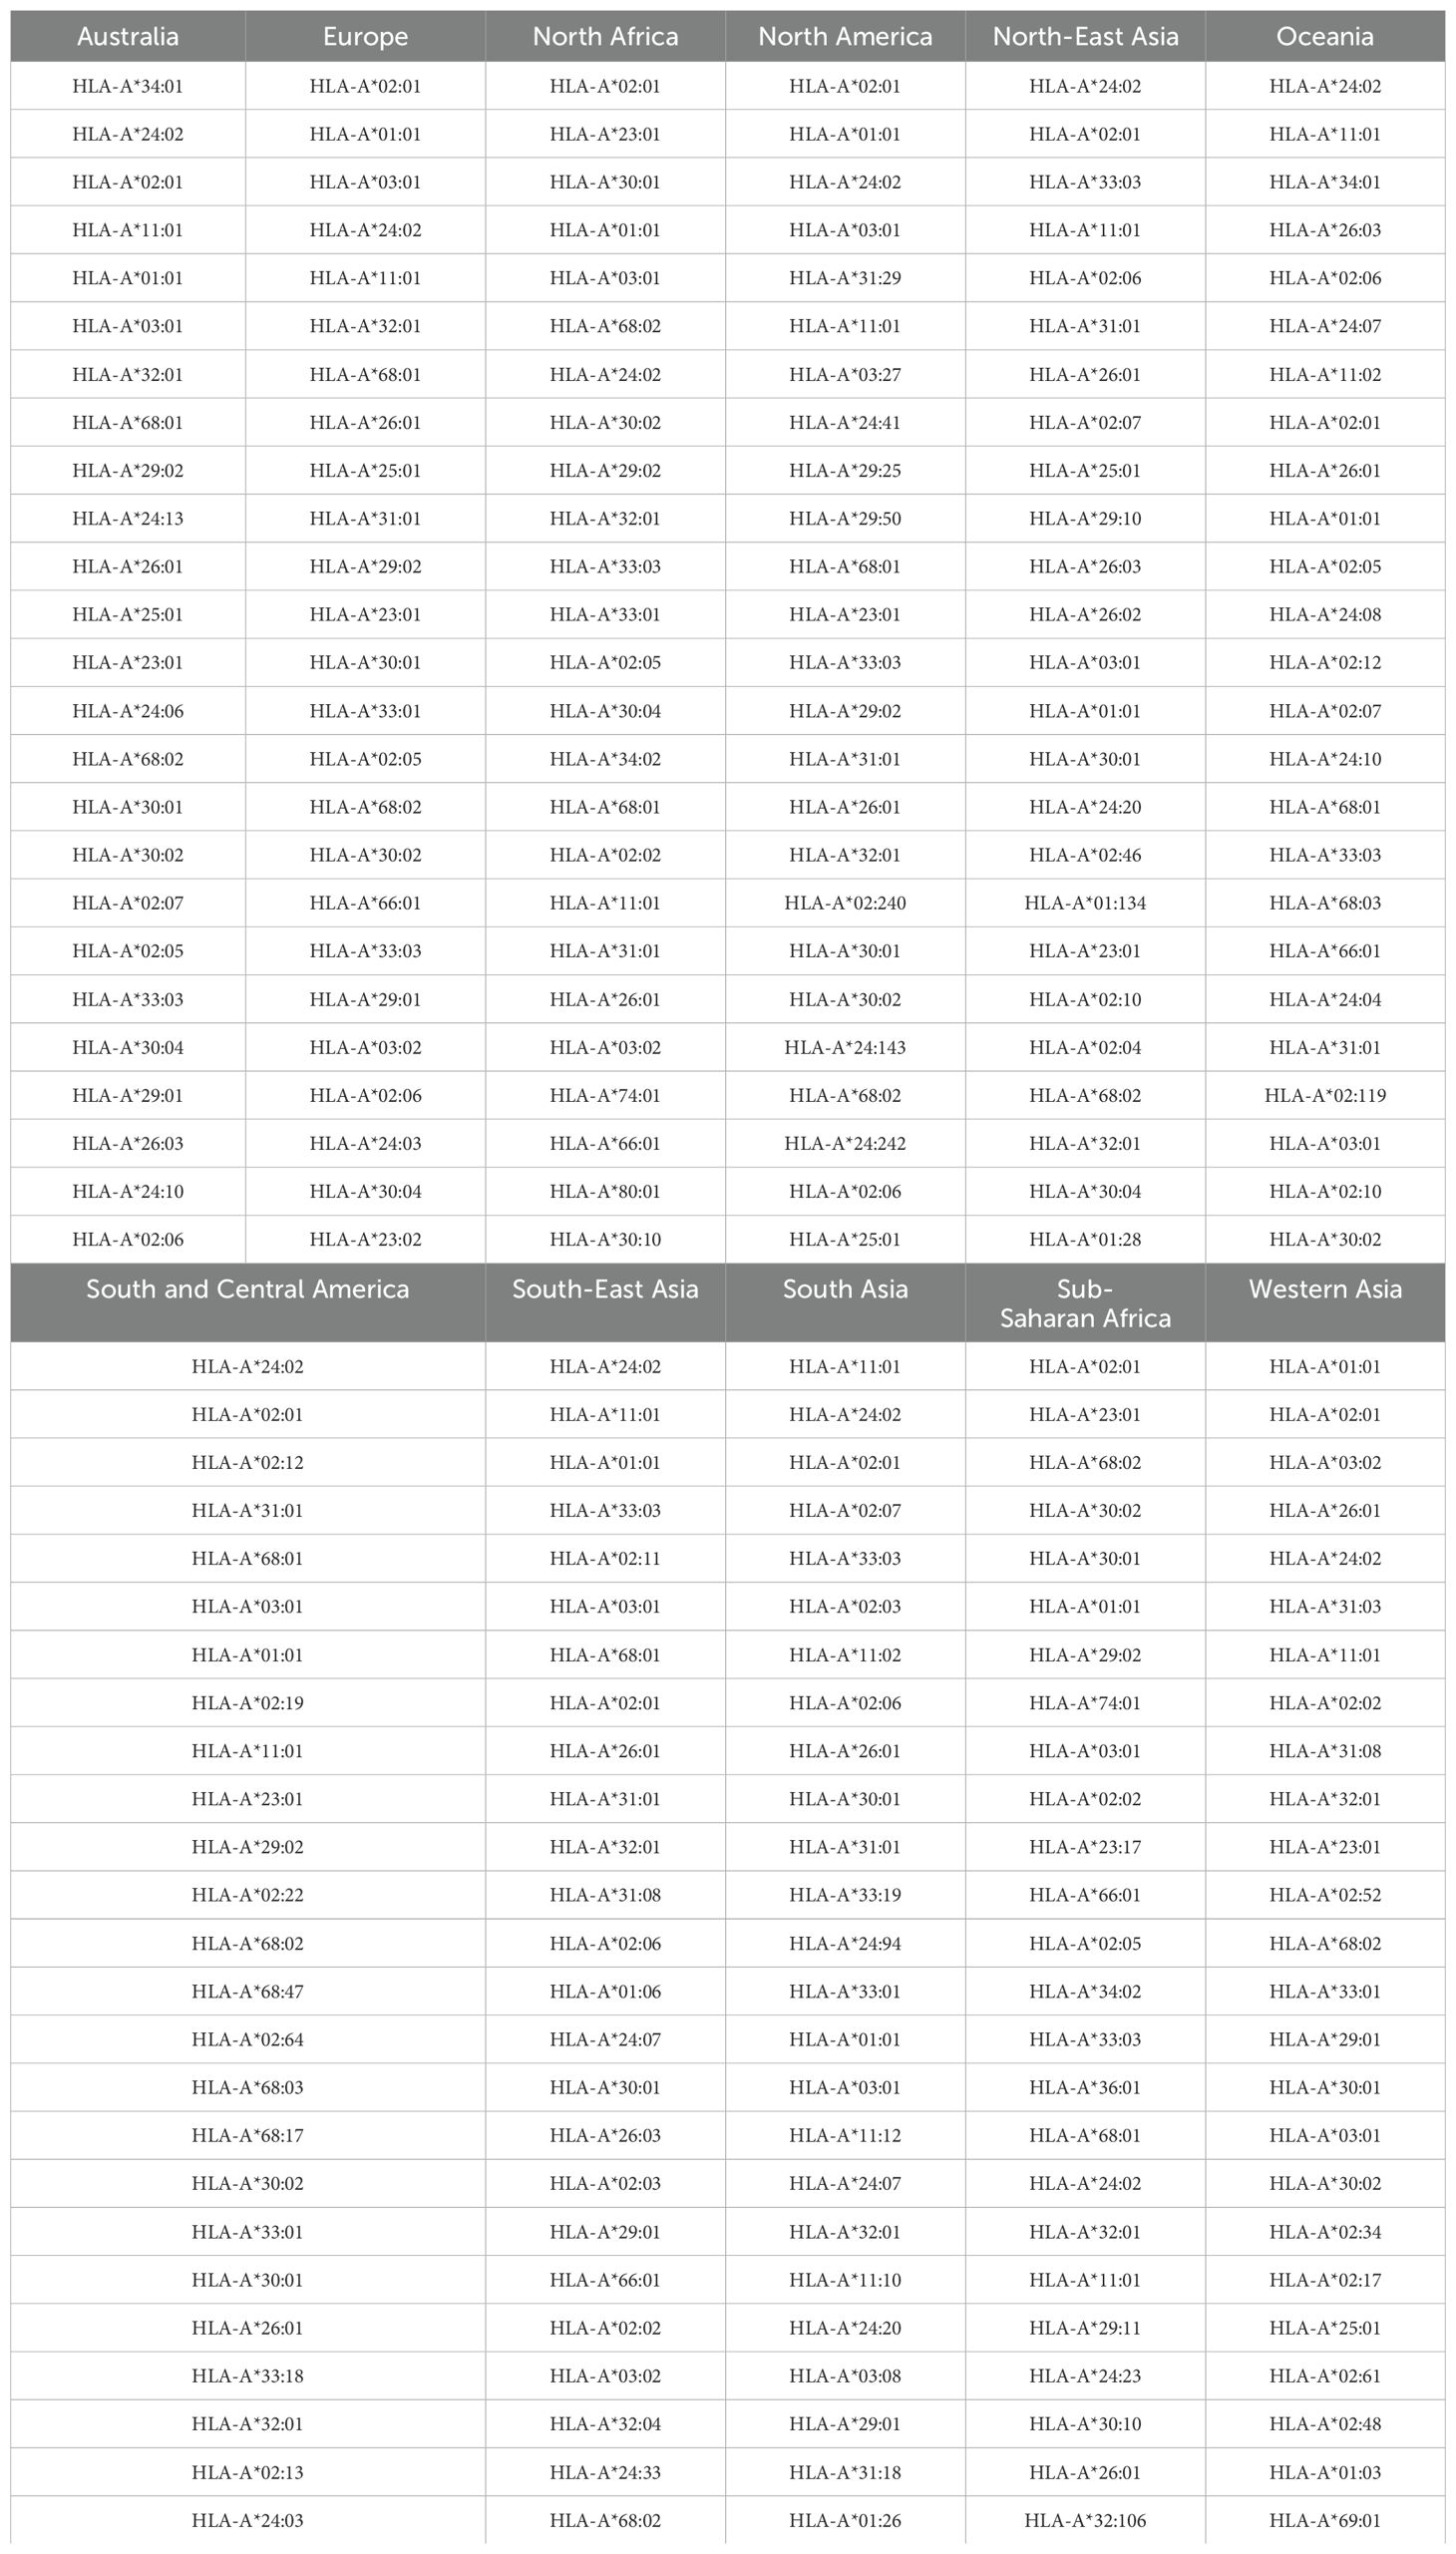
Table 6. Top 25 most frequent HLA-A alleles for the eleven regions considered, in order of decreasing frequency.
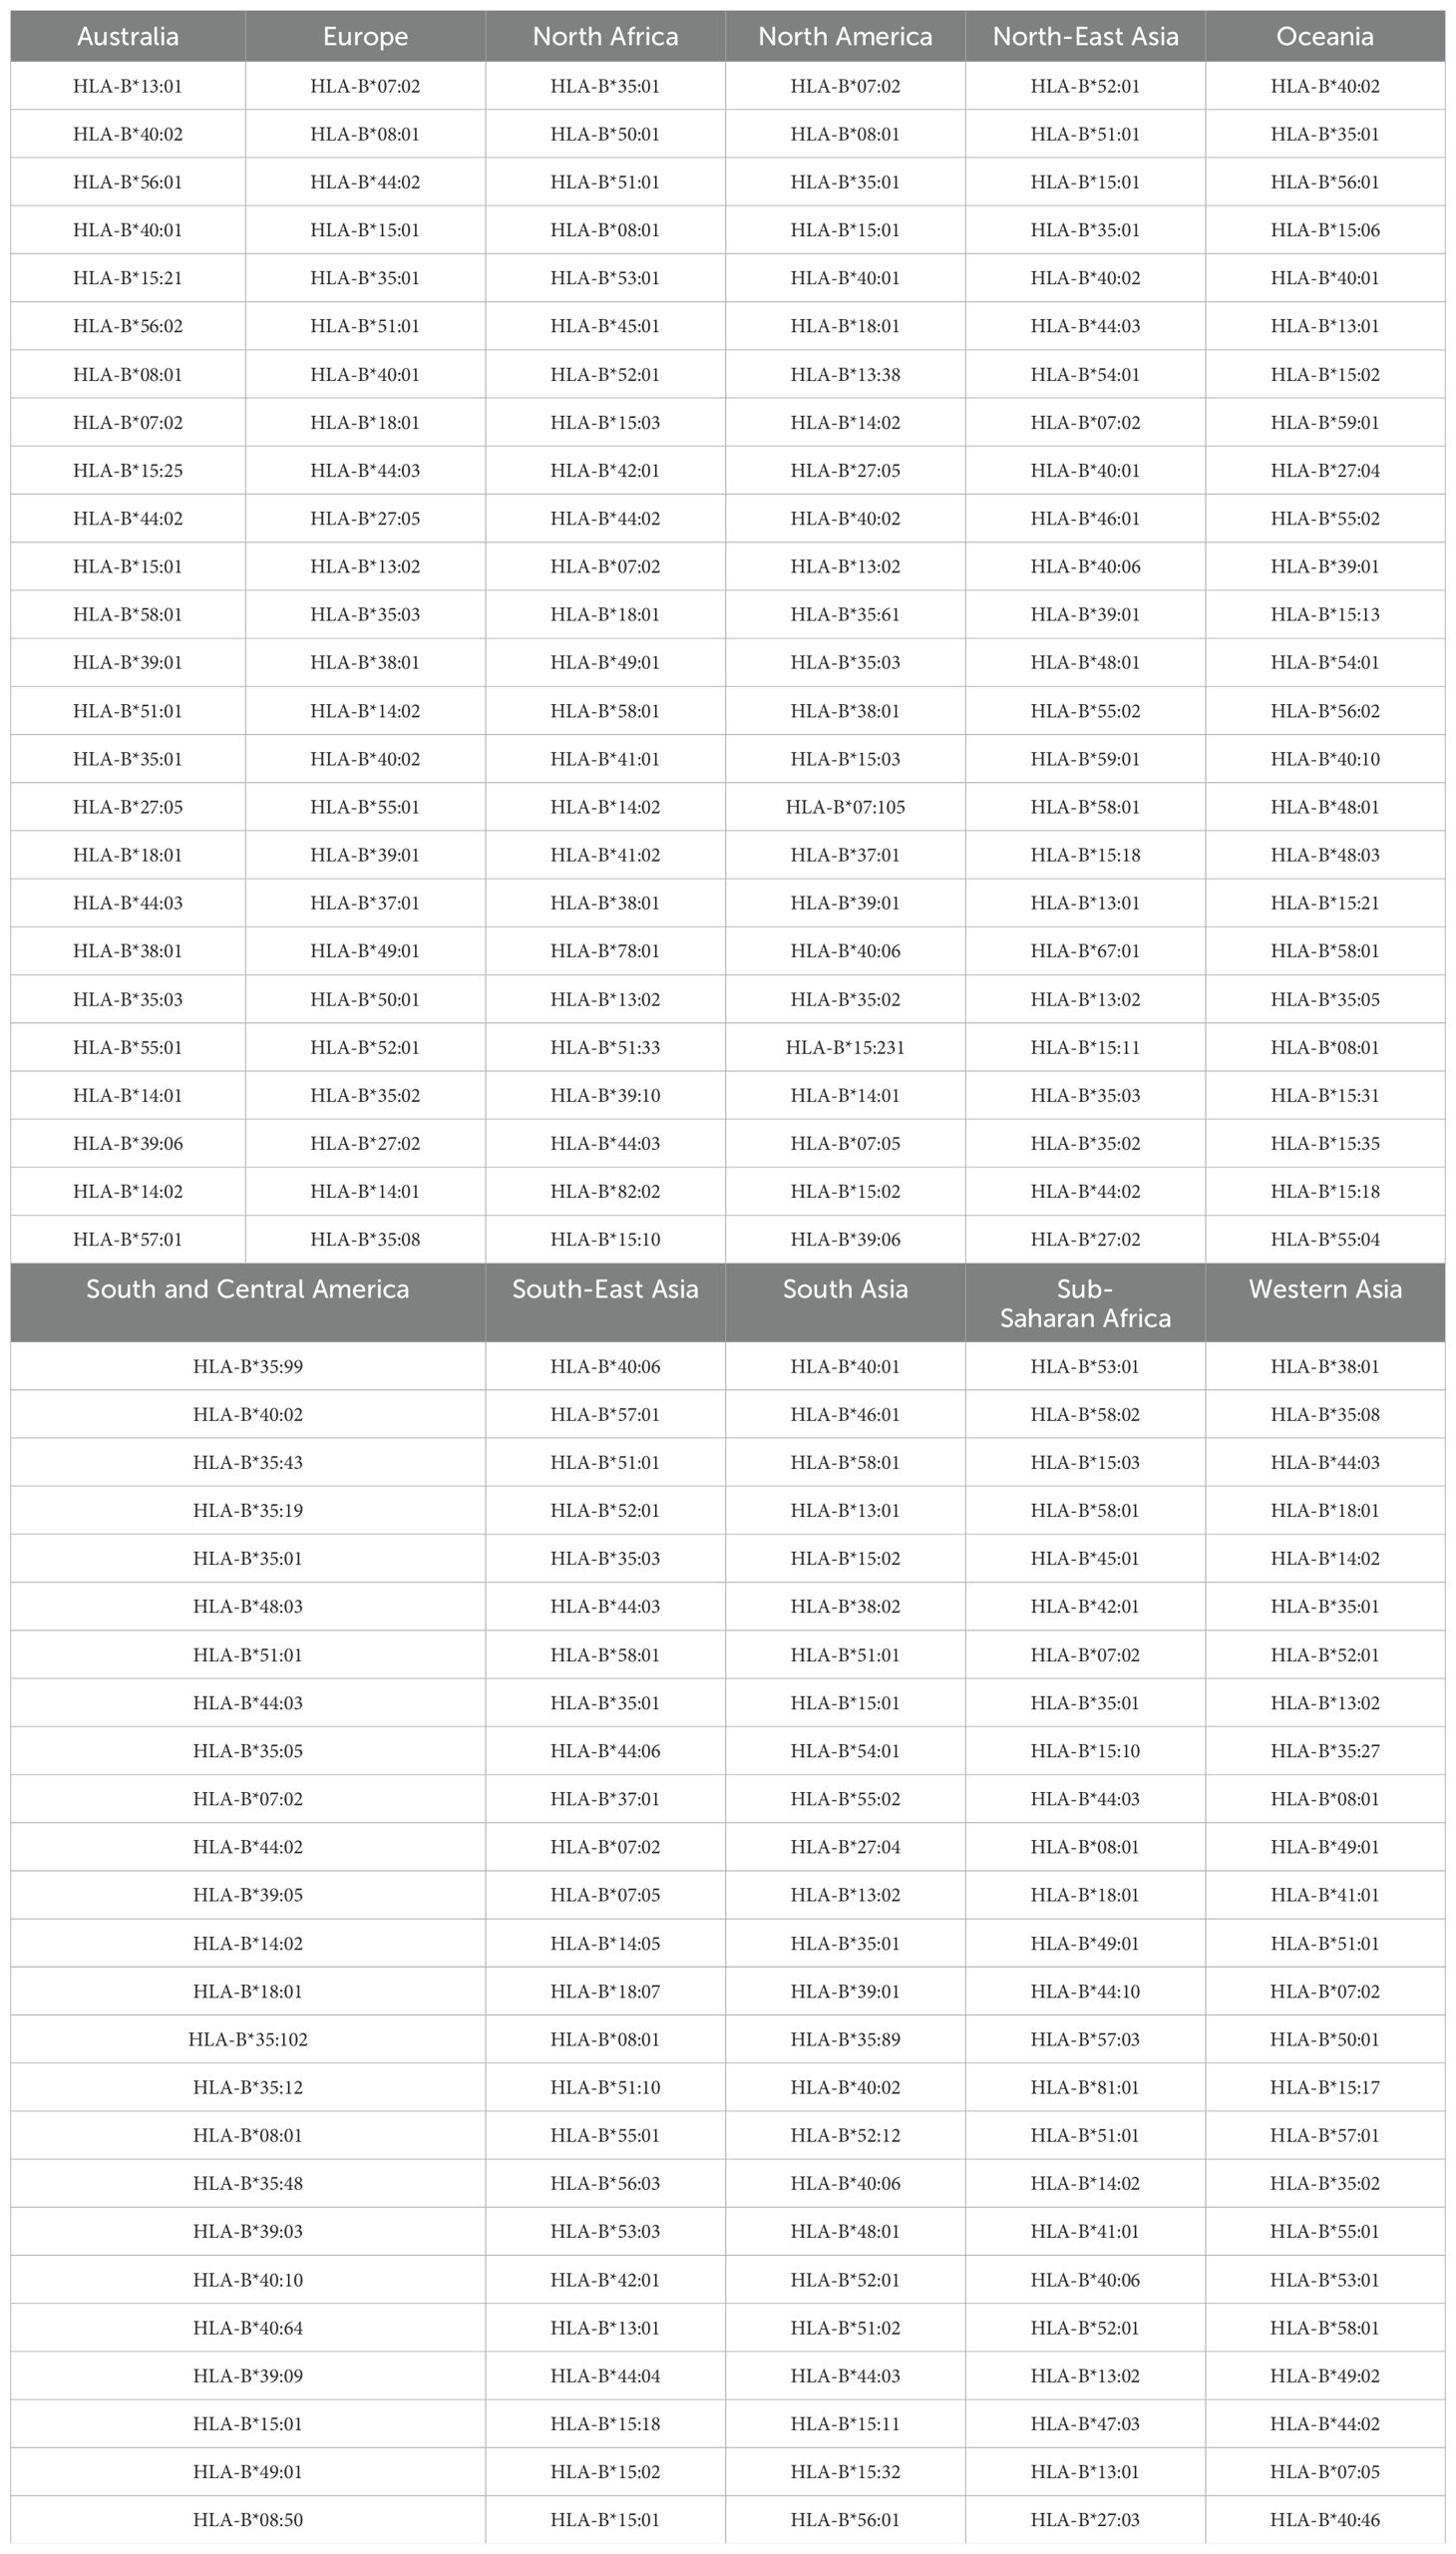
Table 7. Top 25 most frequent HLA-B alleles for the eleven regions considered, in order of decreasing frequency.
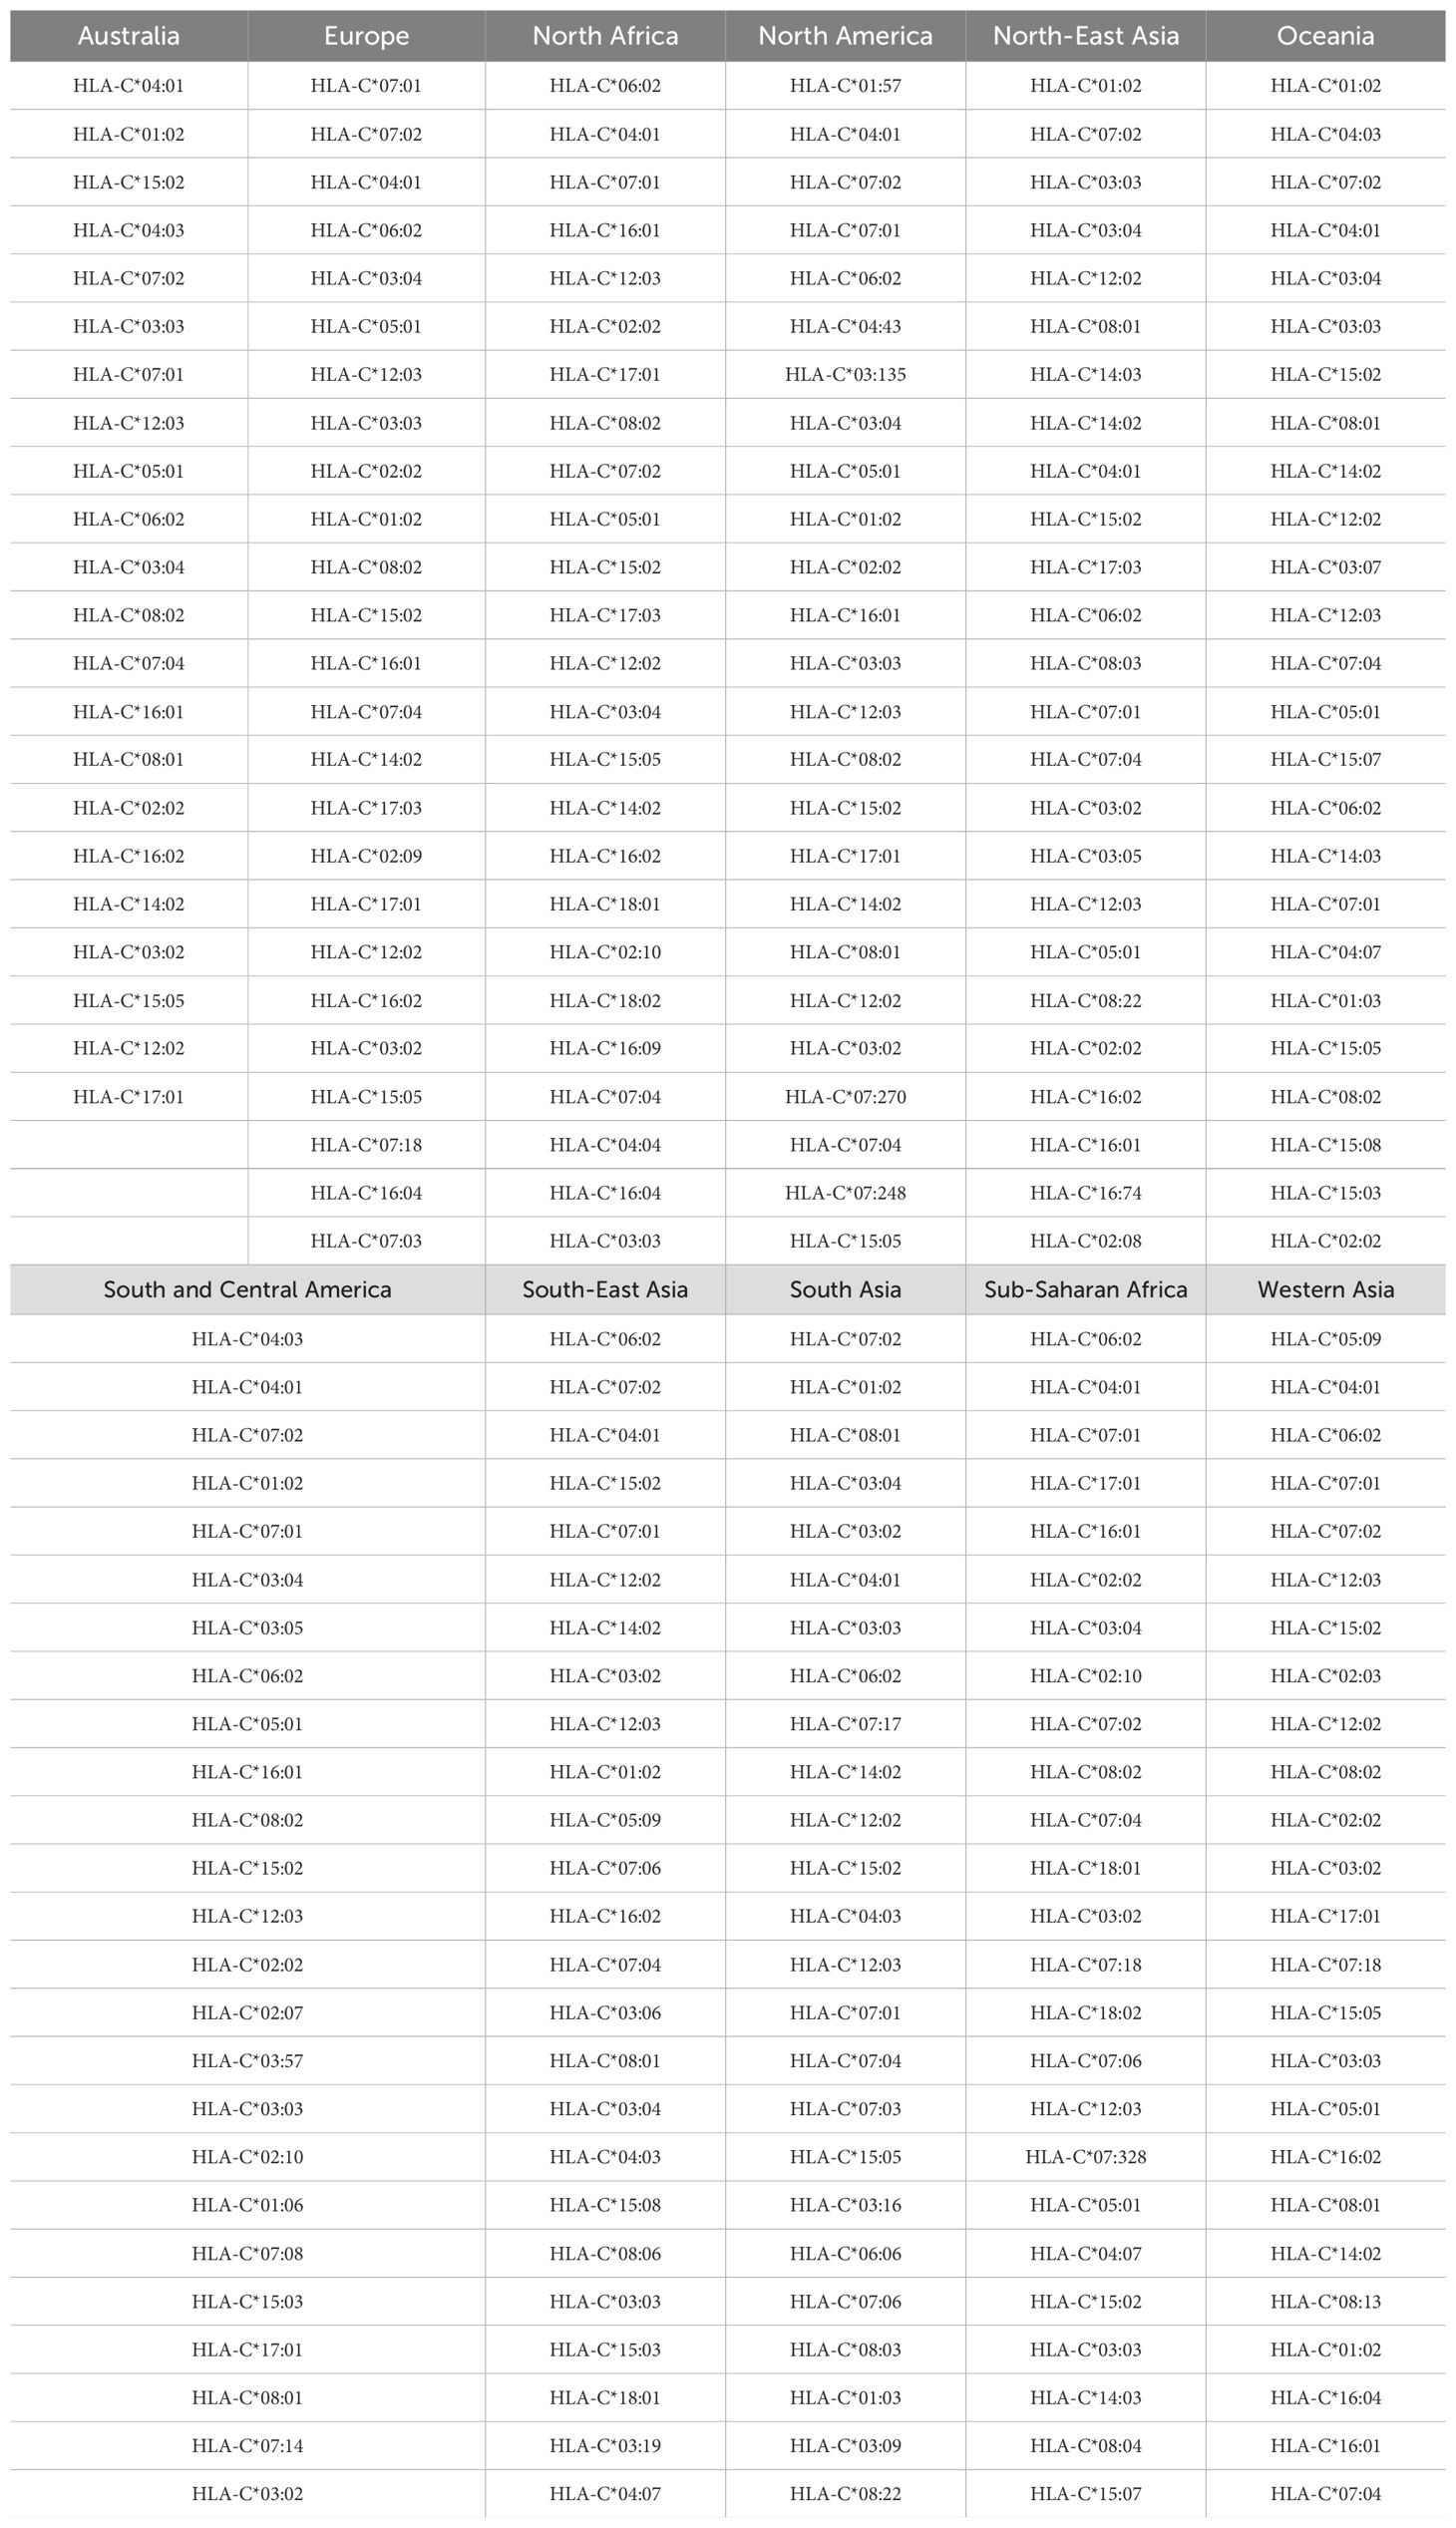
Table 8. Top 25 most frequent HLA-C alleles for the eleven regions considered, in order of decreasing frequency.
3.1 Mean regional coverage metric
We compute the mean regional coverage metric, , shown in Figure 3, grouped by region and for the chosen ten different vaccine proteins. The top panel corresponds to HLA-A, middle one to HLA-B, and bottom to HLA-C alleles, respectively. From left to right, the bars for each region represent Ebola GP (Zaire), Ebola GP (Sudan), Ebola NP (Zaire), Ebola NP (Sudan), SARS-CoV-2 spike (Wuhan-Hu-1), SARS-CoV-2 spike (Delta AY.4), SARS-CoV-2 spike (Omicron BA.1), SARS-CoV-2 spike (Omicron BA.2), SARS-CoV-2 spike (Omicron BA.5), and Burkholderia Hcp1. We observe that HLA-C values are (overall) lower than those for HLA-A and HLA-B alleles; this implies that for the studied proteins CD8+ T cell responses will be dominated (on average) by T cell receptors binding to HLA-A or HLA-B pMHC complexes. If we now turn our attention to HLA-A alleles (top panel), for almost all regions, the largest values correspond to SARS-CoV-2 spike (Omicron BA.1), SARS-CoV-2 spike (Omicron BA.2), and SARS-CoV-2 spike (Omicron BA.5), followed by SARS-CoV-2 spike (Wuhan-Hu-1) and SARS-CoV-2 spike (Delta AY.4), and then Burkholderia Hcp1. Lower values correspond to Ebola GP (Zaire), Ebola GP (Sudan), Ebola NP (Zaire), and Ebola NP (Sudan), with a small overall dominance of Ebola NP (Zaire). Europe does not follow this precise pattern with a large value for Burkholderia Hcp1. It is also interesting to note that HLA-A Ebola GP (Zaire) is comparable to, or even larger than, Ebola NP (Zaire) in Australia, North-East Asia, Oceania, South and Central America, South Asia, and South-East Asia. For HLA-B alleles, coverage values are dominated by Ebola NP (Sudan), followed closely by Ebola NP (Zaire), followed by Burkholderia Hcp1, then the five different SARS-CoV-2 spike proteins (with similar magnitude), with lowest values for Ebola GP (Sudan) and Ebola GP (Zaire). We note that Ebola NP (nucleoprotein) is not a surface protein, as is the case of GP or SARS-CoV-2 spike. We also note the rather large value of Hcp1 for North America for HLA-B (middle panel).
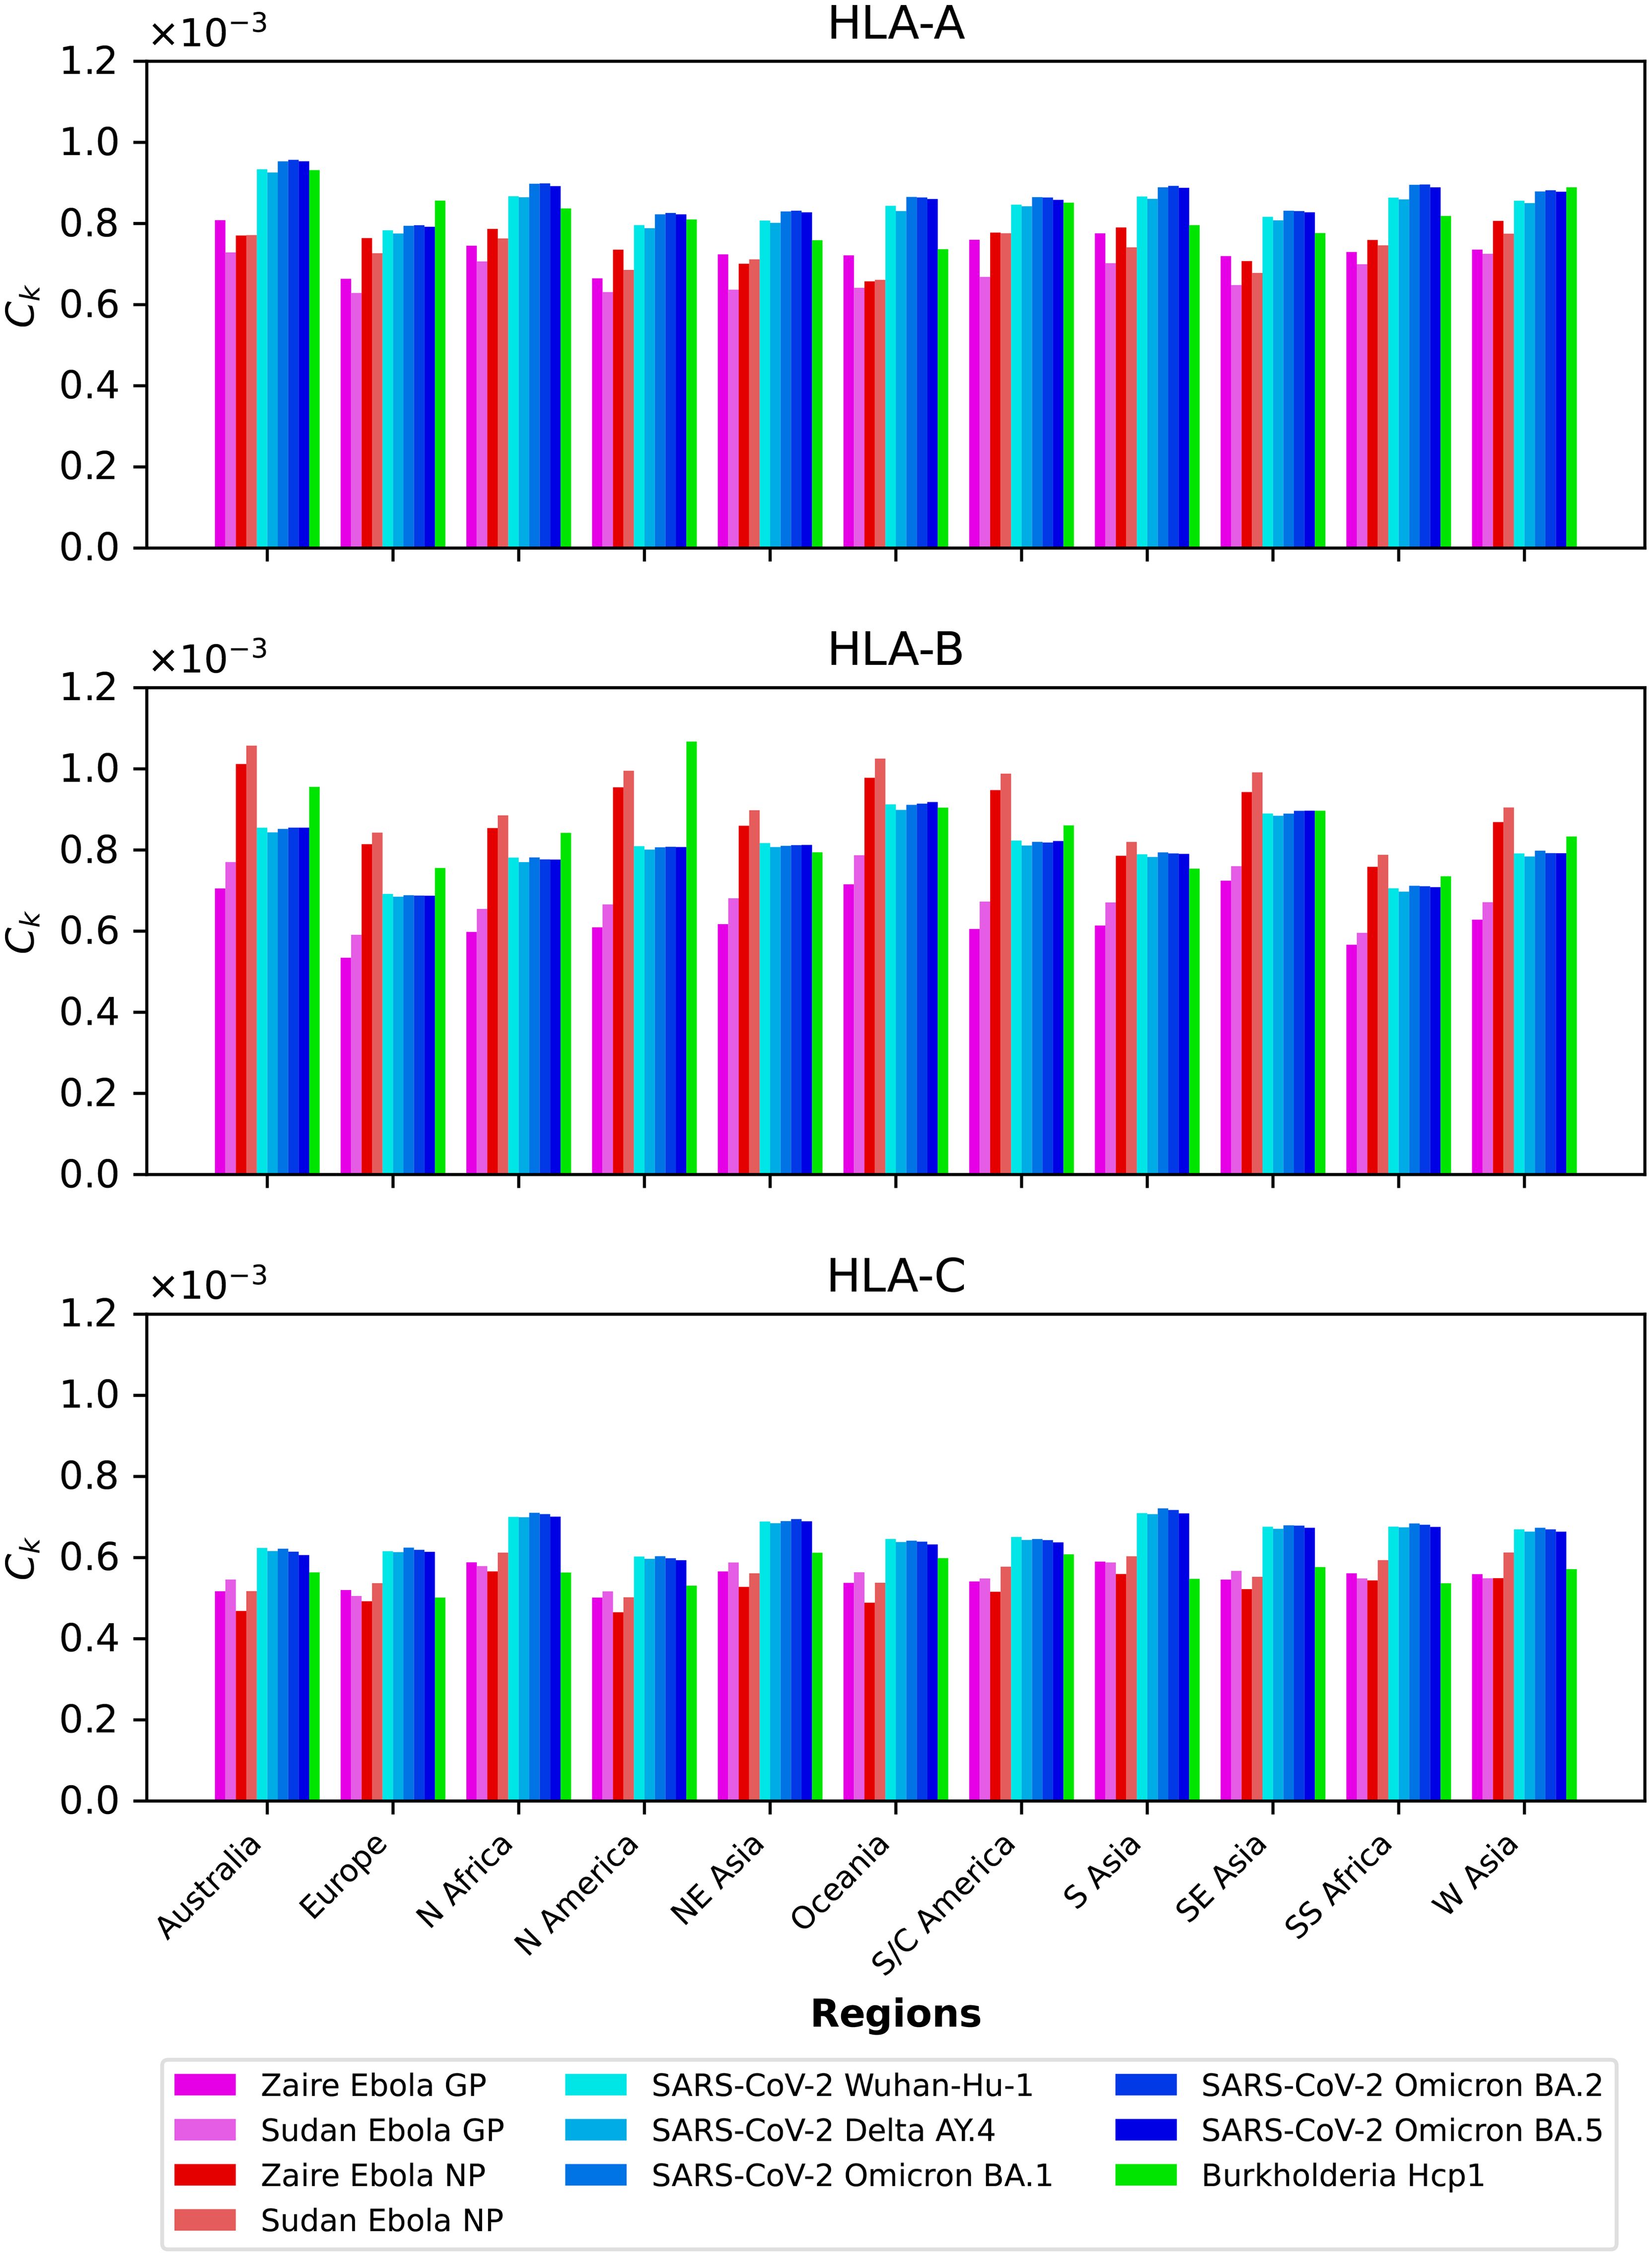
Figure 3. Mean regional coverage metric, , grouped by region and for ten different proteins. The top panel corresponds to HLA-A, middle one to HLA-B, and bottom to HLA-C alleles, respectively. From left to right, the bars for each region represent Ebola GP (Zaire), Ebola GP (Sudan), Ebola NP (Zaire), Ebola NP (Sudan), SARS-CoV-2 spike (Wuhan-Hu-1), SARS-CoV-2 spike (Delta AY.4), SARS-CoV-2 spike (Omicron BA.1), SARS-CoV-2 spike (Omicron BA.2), SARS-CoV-2 spike (Omicron BA.5), and Burkholderia Hcp1.
We next show in Figure 4 the mean regional coverage metric, , grouped by pathogen and for eleven different regions. We observe that for HLA-A and HLA-B alleles, Australia has the largest values, but that is not the case for HLA-C, with North Africa, North-East Asia and South Asia dominating the scores. For HLA-B alleles, Oceania and South-East Asia have overall second largest scores, but for this HLA type the patterns of dominance depend on the specific protein under consideration. For instance, for Burkholderia Hcp1 North America clearly dominates, but that is not the case for SARS-CoV-2 spike (overall for the different variants), where Oceania takes the lead. It is interesting to note that for HLA-B the largest values overall are obtained for Ebola NP (Sudan). The results for HLA-C (bottom panel) for a given vaccine protein do not show great variation between geographical regions. North Africa tends to dominate, followed closely by North-East Asia and South Asia. It is interesting to observe that this pattern is broken for Hcp1, where North-East Asia, Oceania, and South and Central America take the lead.
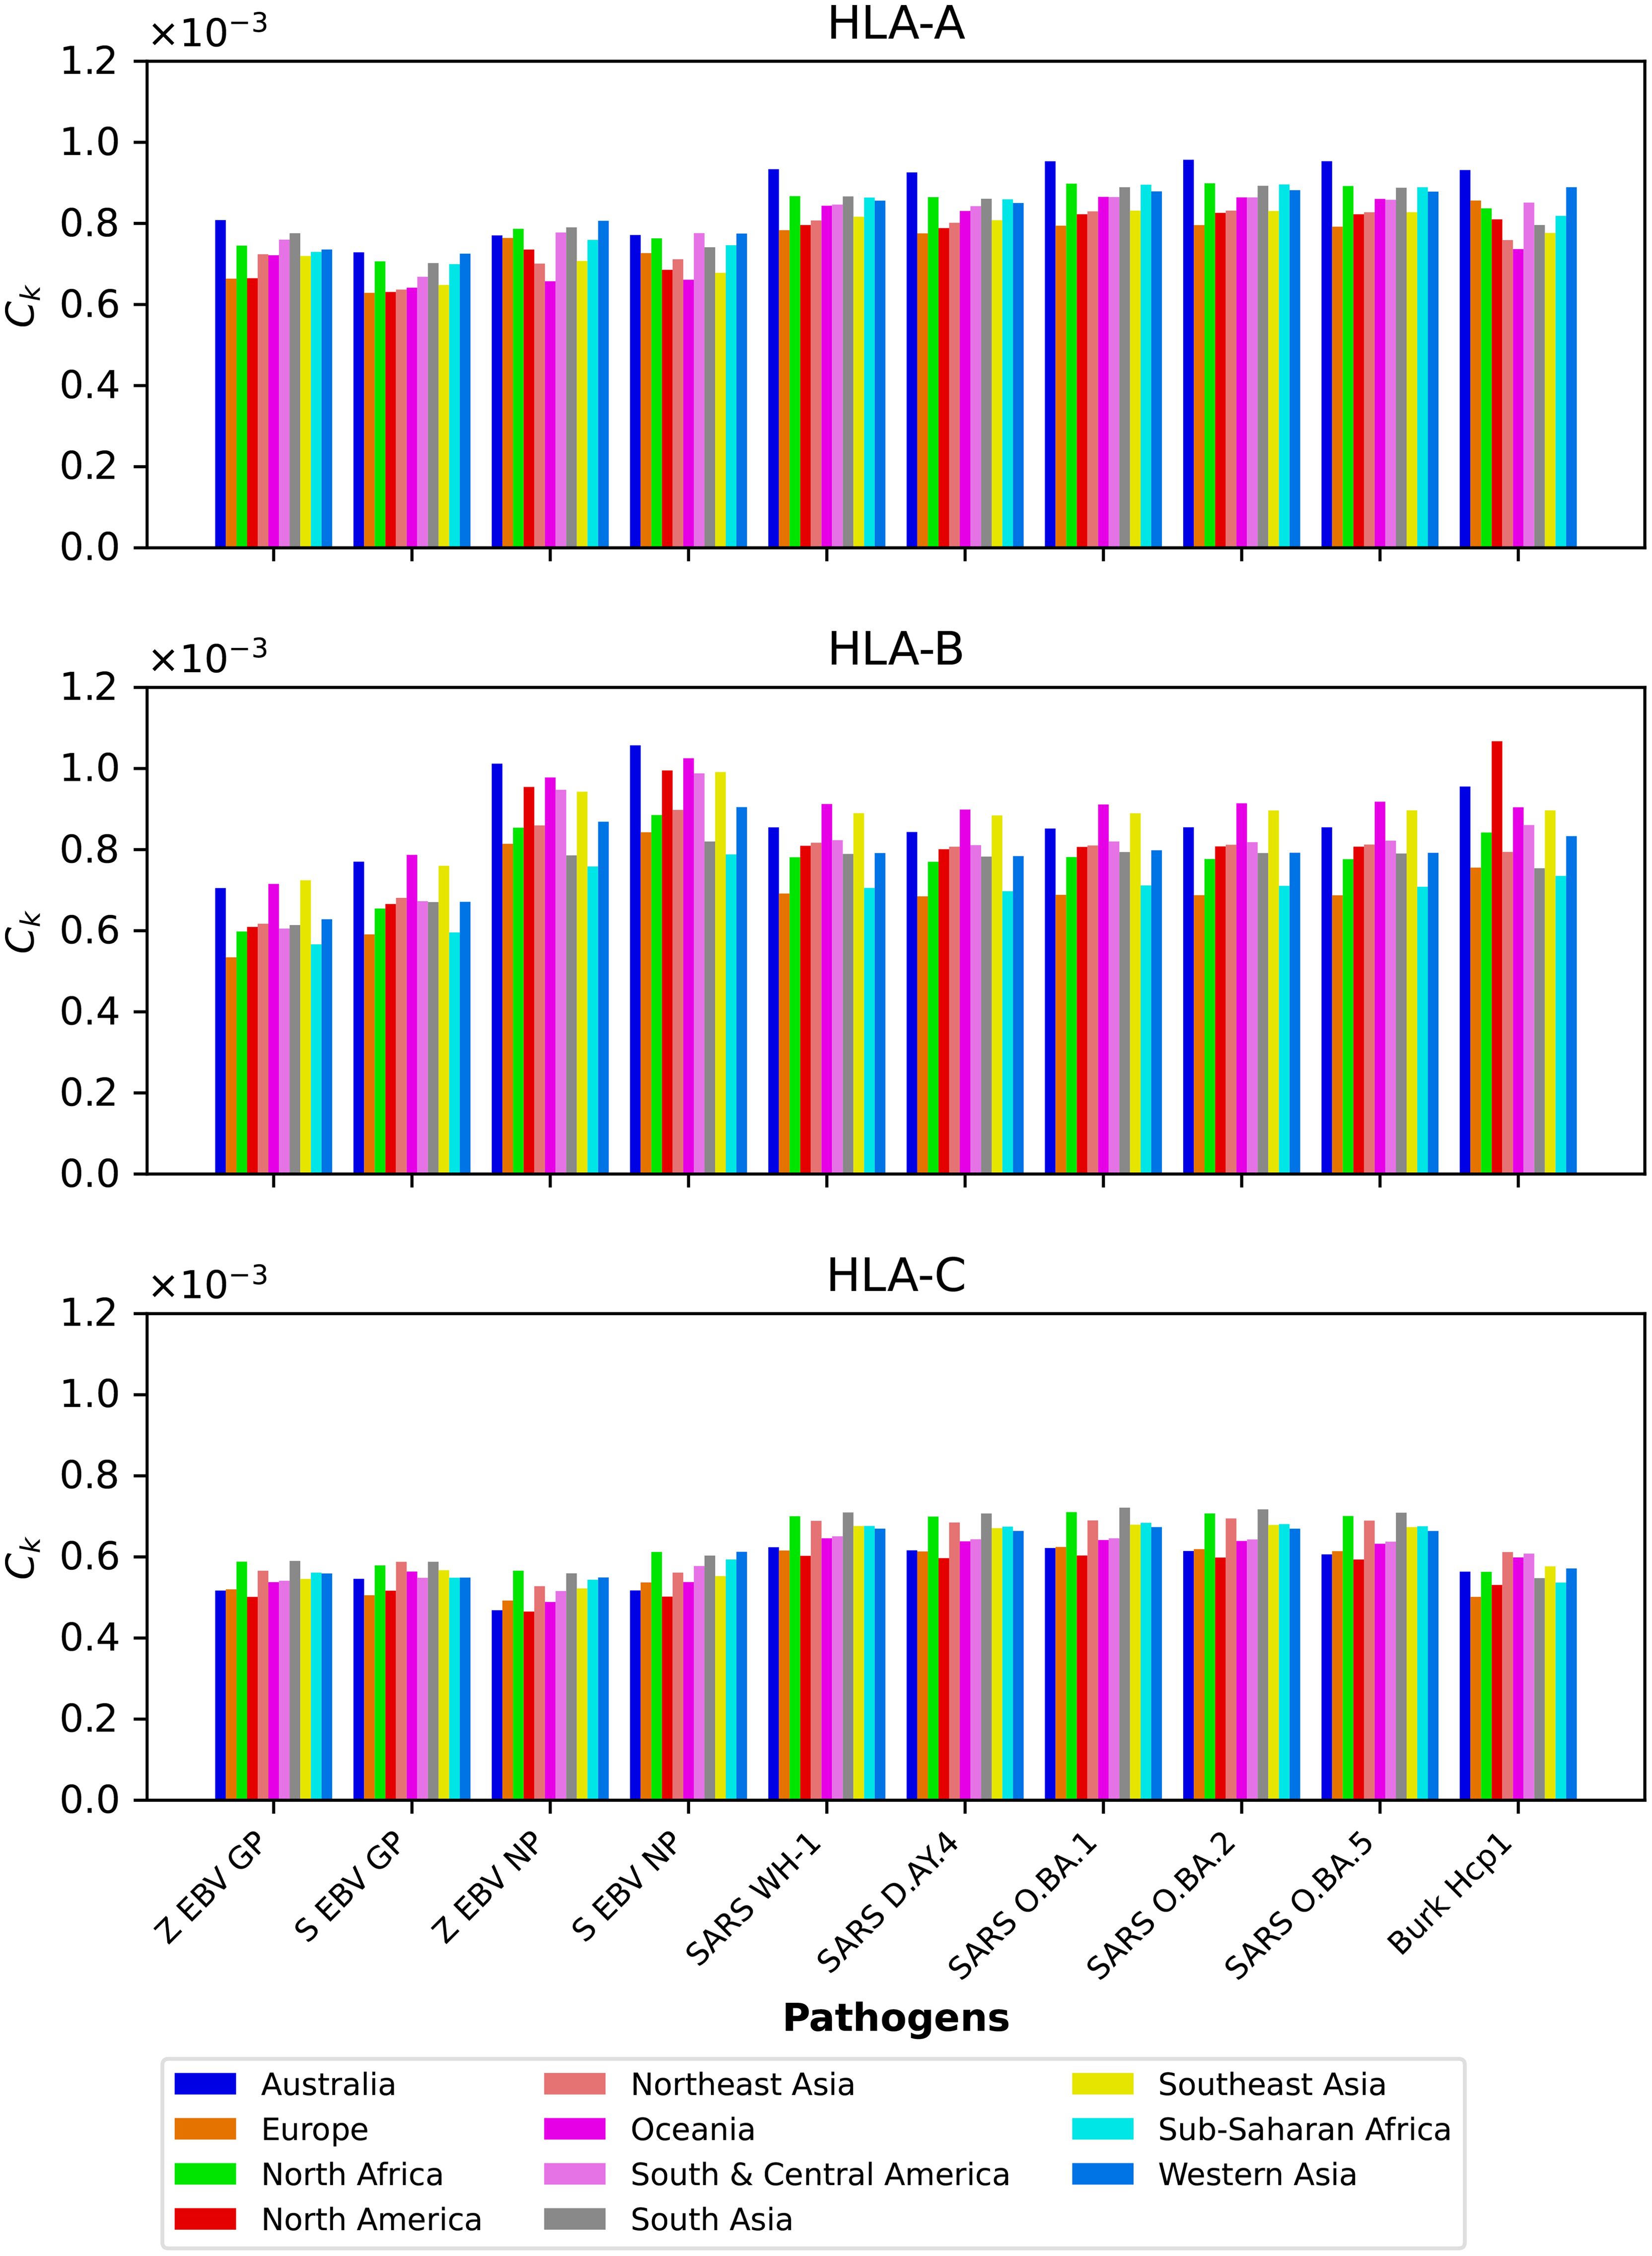
Figure 4. Mean regional coverage metric, , grouped by pathogen and for eleven different regions. The top panel corresponds to HLA-A, middle one to HLA-B, and bottom to HLA-C alleles, respectively. From left to right, the bars for each protein represent Australia, Europe, North Africa, North America, North-East Asia, Oceania, South and Central America, South Asia, South-East Asia, Sub-Saharan Africa, and Western Asia.
3.2 Dissecting the mean regional coverage metric
We now want to dissect the results from the previous section by evaluating the contribution to the mean regional coverage metric from allele frequencies on the one hand, and from HLA allele-peptide binding and peptide immunogenicity, on the other (see Equation 5). To that end, we focus on North America, and provide plots of the contributions to from the normalized allele frequencies and from the binding scores and peptide immunogenicity, as encoded in the variable σi (see Equation 6). Figures 5, 6 show on the x axis individual alleles (top panel represents HLA-A, middle one HLA-B, and bottom one HLA-C alleles, respectively), on the left y axis normalized regional frequencies, and on the right y axis the σi value of each allele, for Ebola GP and NP (Sudan and Zaire), SARS-CoV-2 spike (five different variants), and Burkholderia Hcp1 proteins.
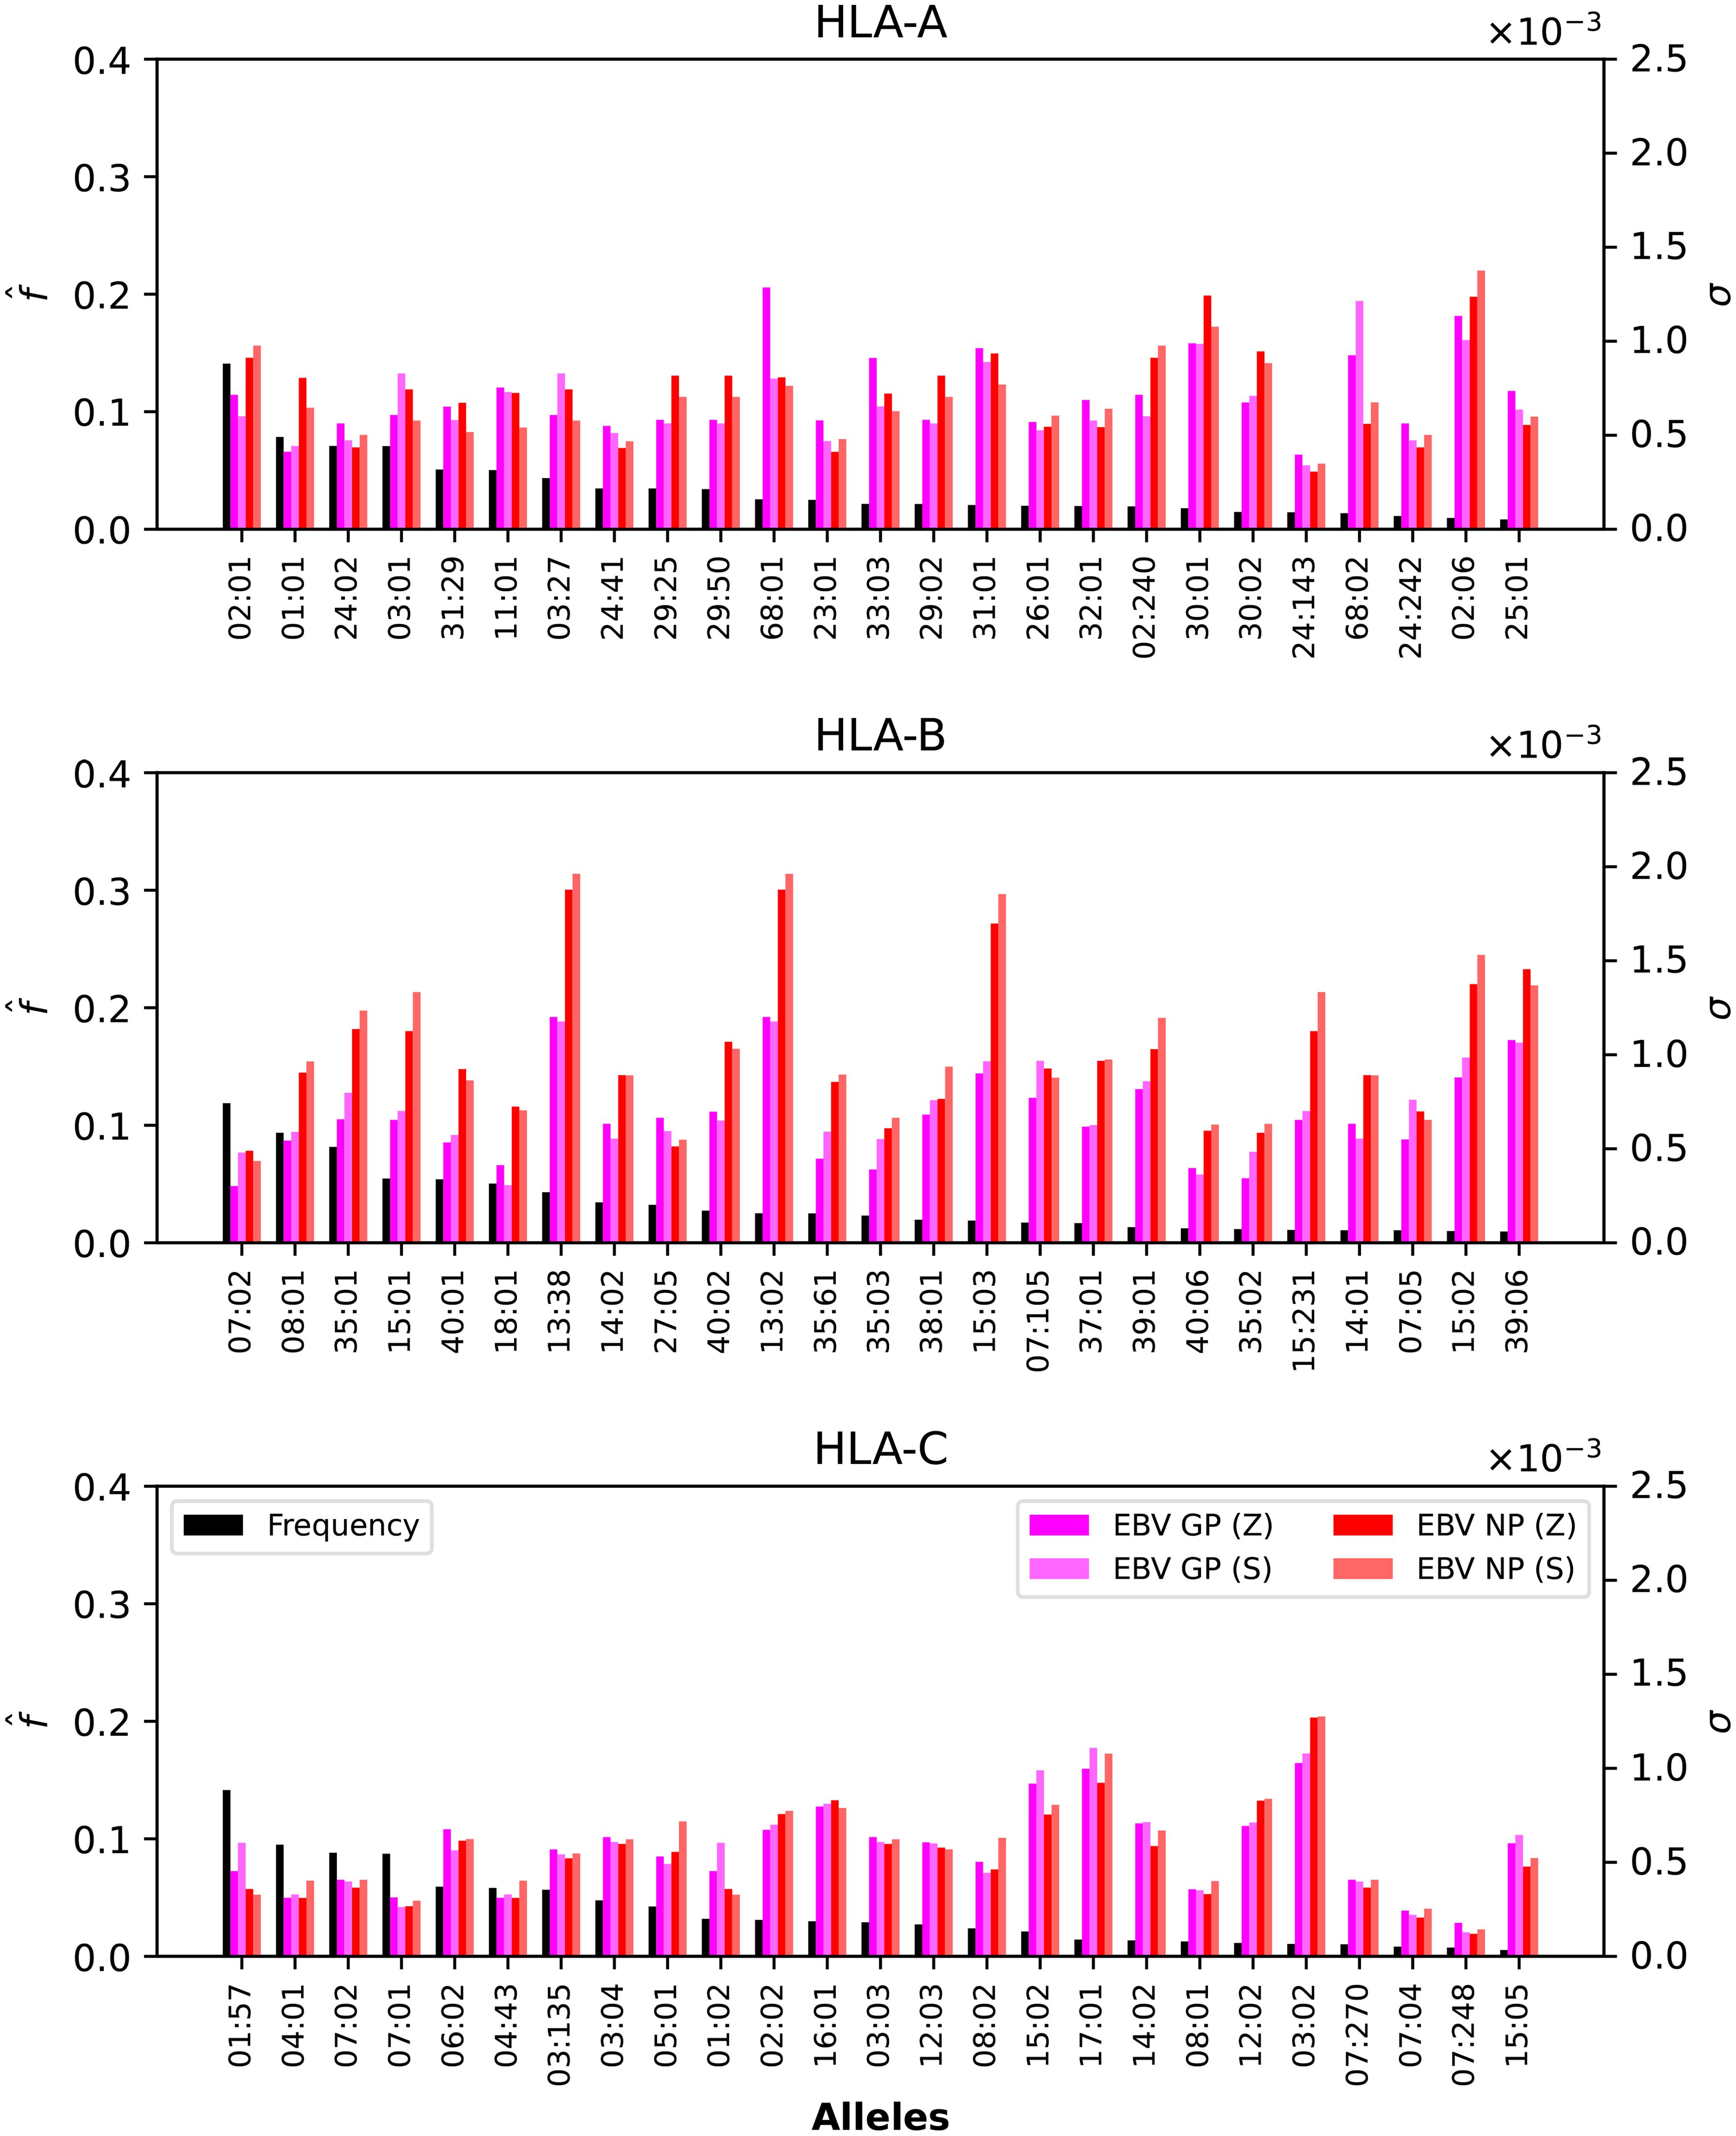
Figure 5. Normalized regional frequencies (left y axis), , and Ebola σi values (right y axis) for the top 25 most frequent alleles of each type in North America (x axis). The top panel represents HLA-A, the middle HLA-B, and the bottom HLA-C alleles, respectively.
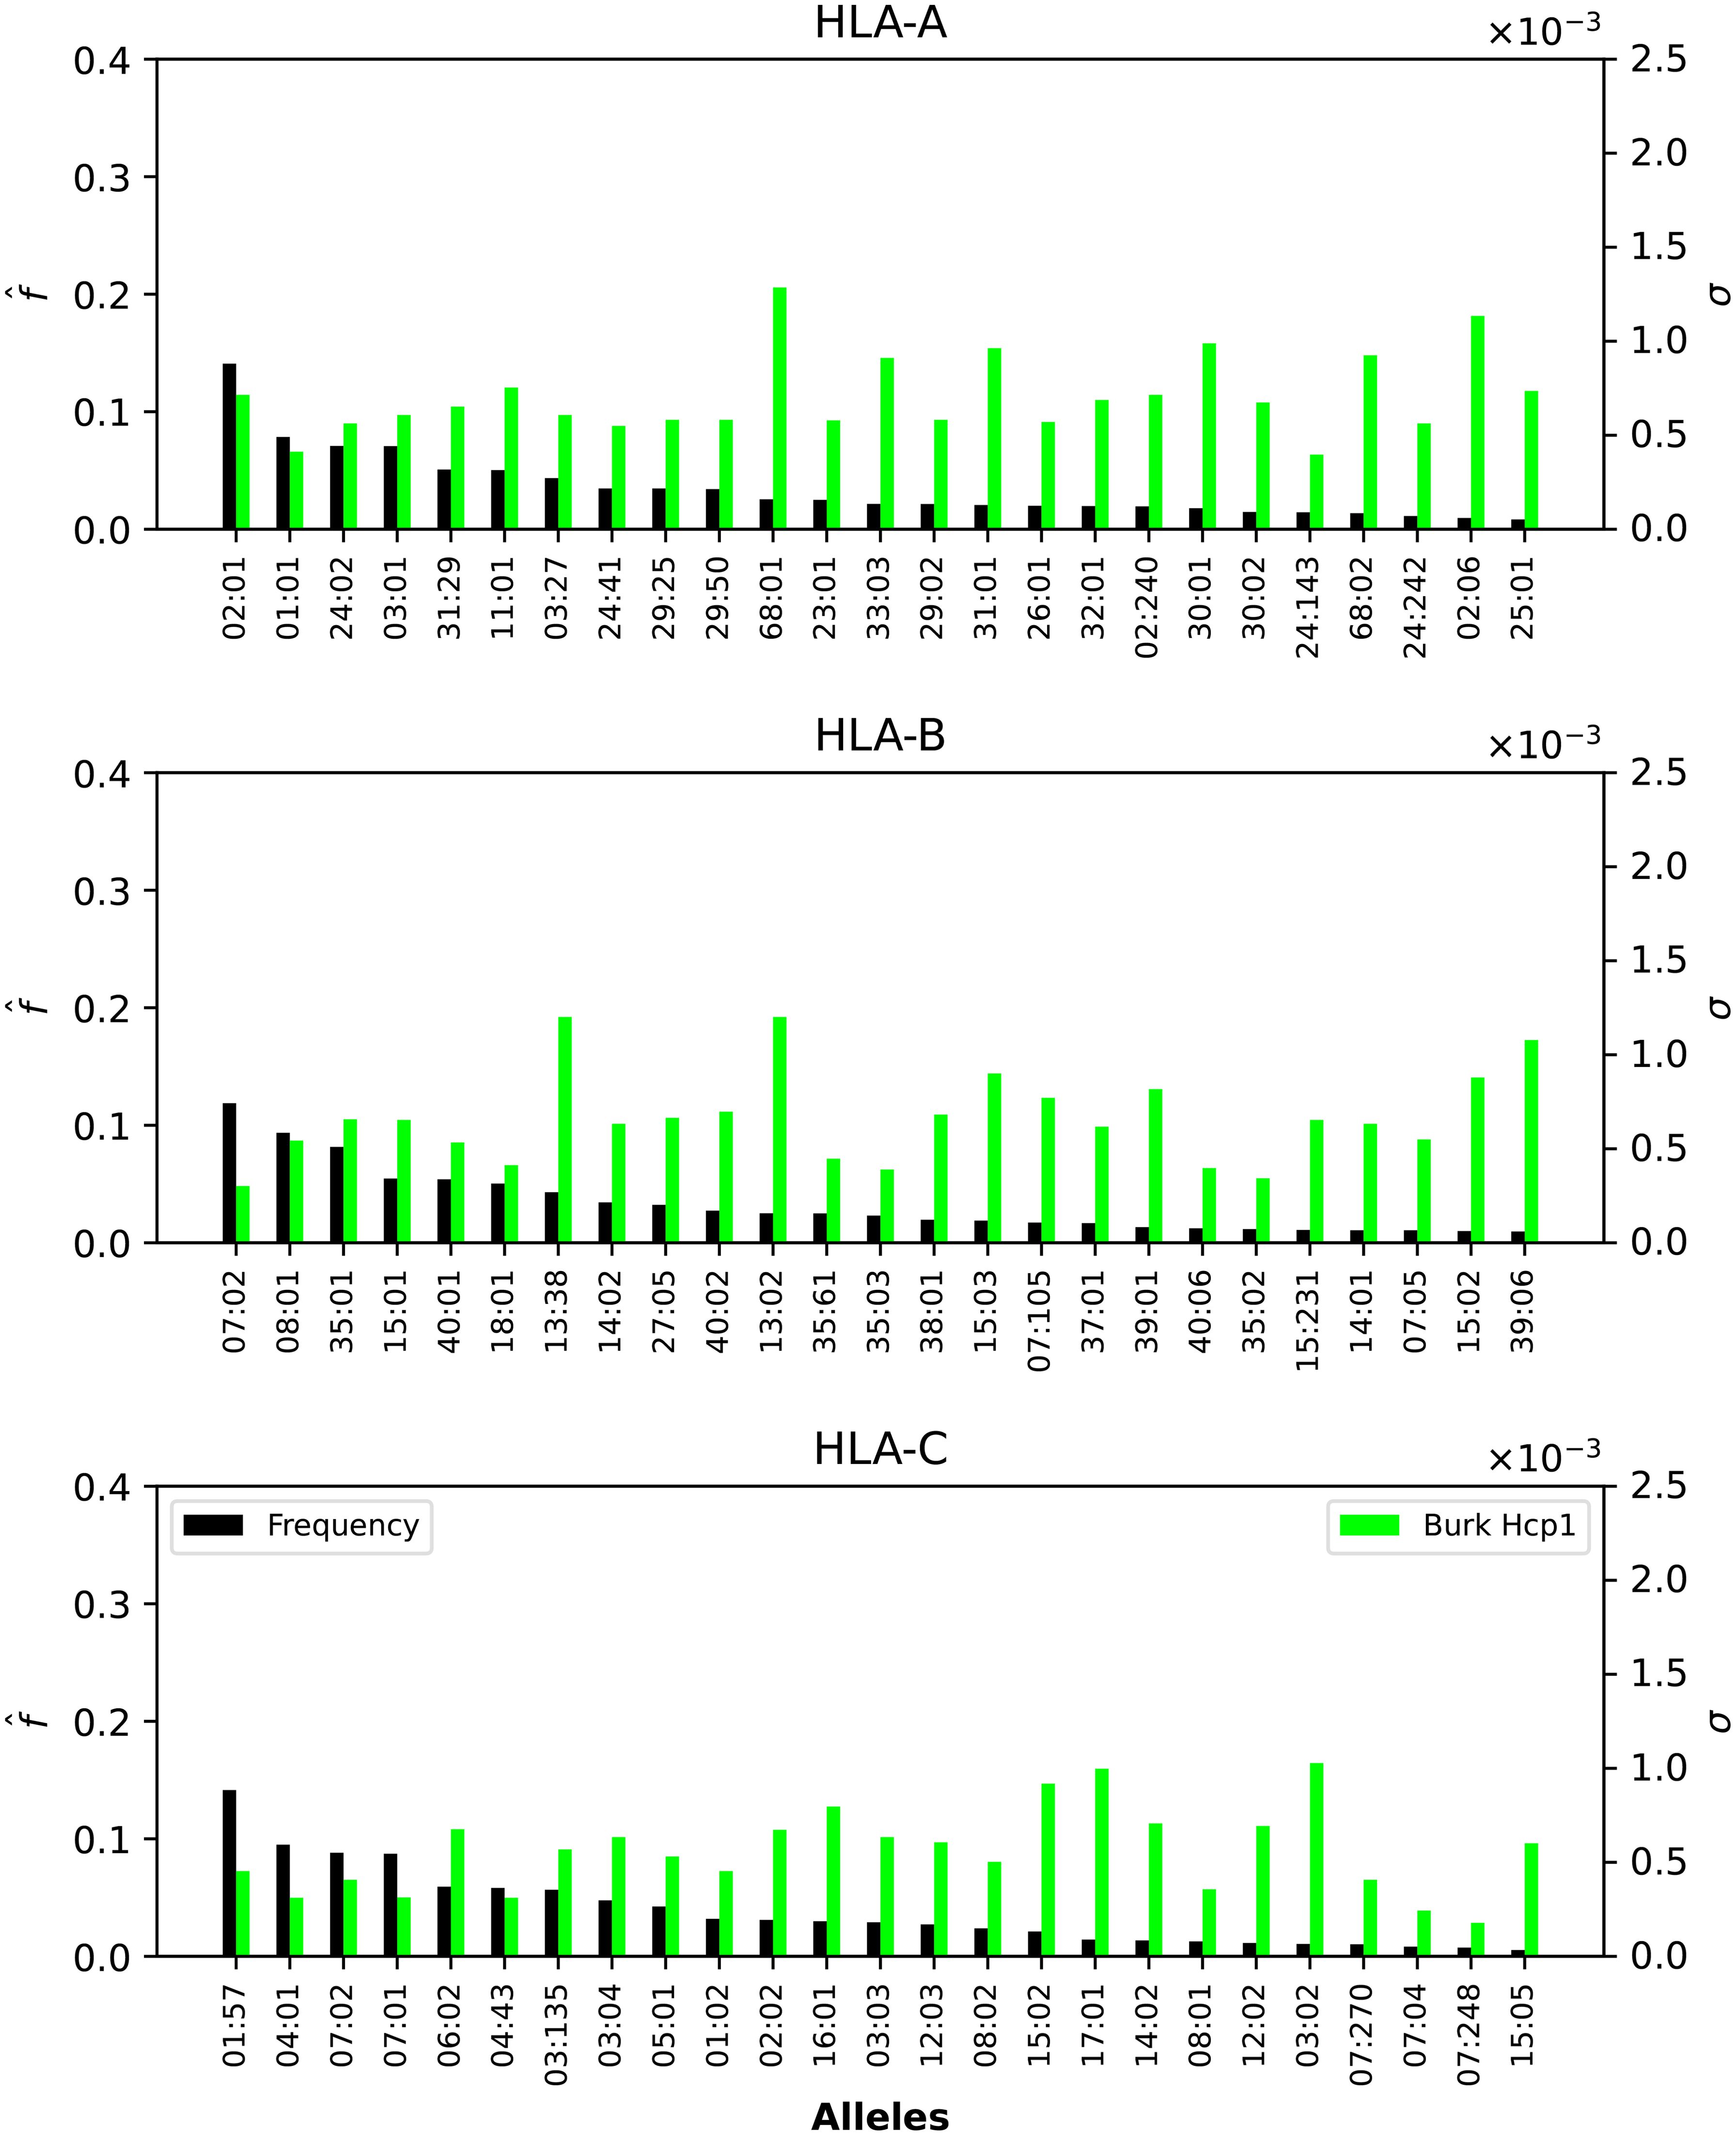
Figure 6. Normalized regional frequencies (left y axis), , and Burkholderia σi values (right y axis) for the top 25 most frequent alleles of each type in North America (x axis). The top panel represents HLA-A, the middle HLA-B, and the bottom HLA-C alleles, respectively.
Figures 5, 6 show that only one allele per type, HLA-A*02:01, HLA-B*07:02, HLA-C*01:57, has a frequency greater than 10%. For Ebola proteins, Figure 5 shows that σi values are largest (overall) for HLA-B, then HLA-A, and HLA-C. This implies that CD8+ T cell responses to Ebola GP or NP proteins will be dominated by HLA-B restricted TCRs. Alleles HLA-A*68:01, HLA-A*30:01, HLA-A*68:02 and HLA-A*02:06 dominate the σi values. For HLA-A*68:01 and Ebola GP Zaire, its σi value is much larger than those of the other three Ebola proteins. In the case of HLA-B alleles, HLA-B*13:38, HLA-B*13:02 and HLA-B*15:03 have the largest σi values, followed by HLA-B*15:02 and HLA-B*39:06, for NP proteins (Sudan and Zaire).
In the case of SARS-CoV-2 spike protein, Figure 7 shows, as was the case for Ebola, that CD8+ T cell responses will be dominated by HLA-B restricted TCRs. HLA-A*68:01 for Wuhan-Hu-1 has a larger σi value when compared to the other variants, and HLA-A*02:06 dominates the σi values for all five variants. The observed trend for HLA-B in Figure 5 seems to be repeated for SARS-CoV-2, with HLAB*13:38, HLA-B*13:02 and HLA-B*15:03 having the largest σi values, followed by HLA-B*15:02 and HLA-B*39:06. Contrary to HLA-A*68:01, it is now the Omicron variants that dominate the values. For HLA-C, it is HLA-C*03:02 that has the largest σi values, from lowest to highest as SARS-CoV-2 evolved from Wuhan-Hu-1 to Omicron BA.5.
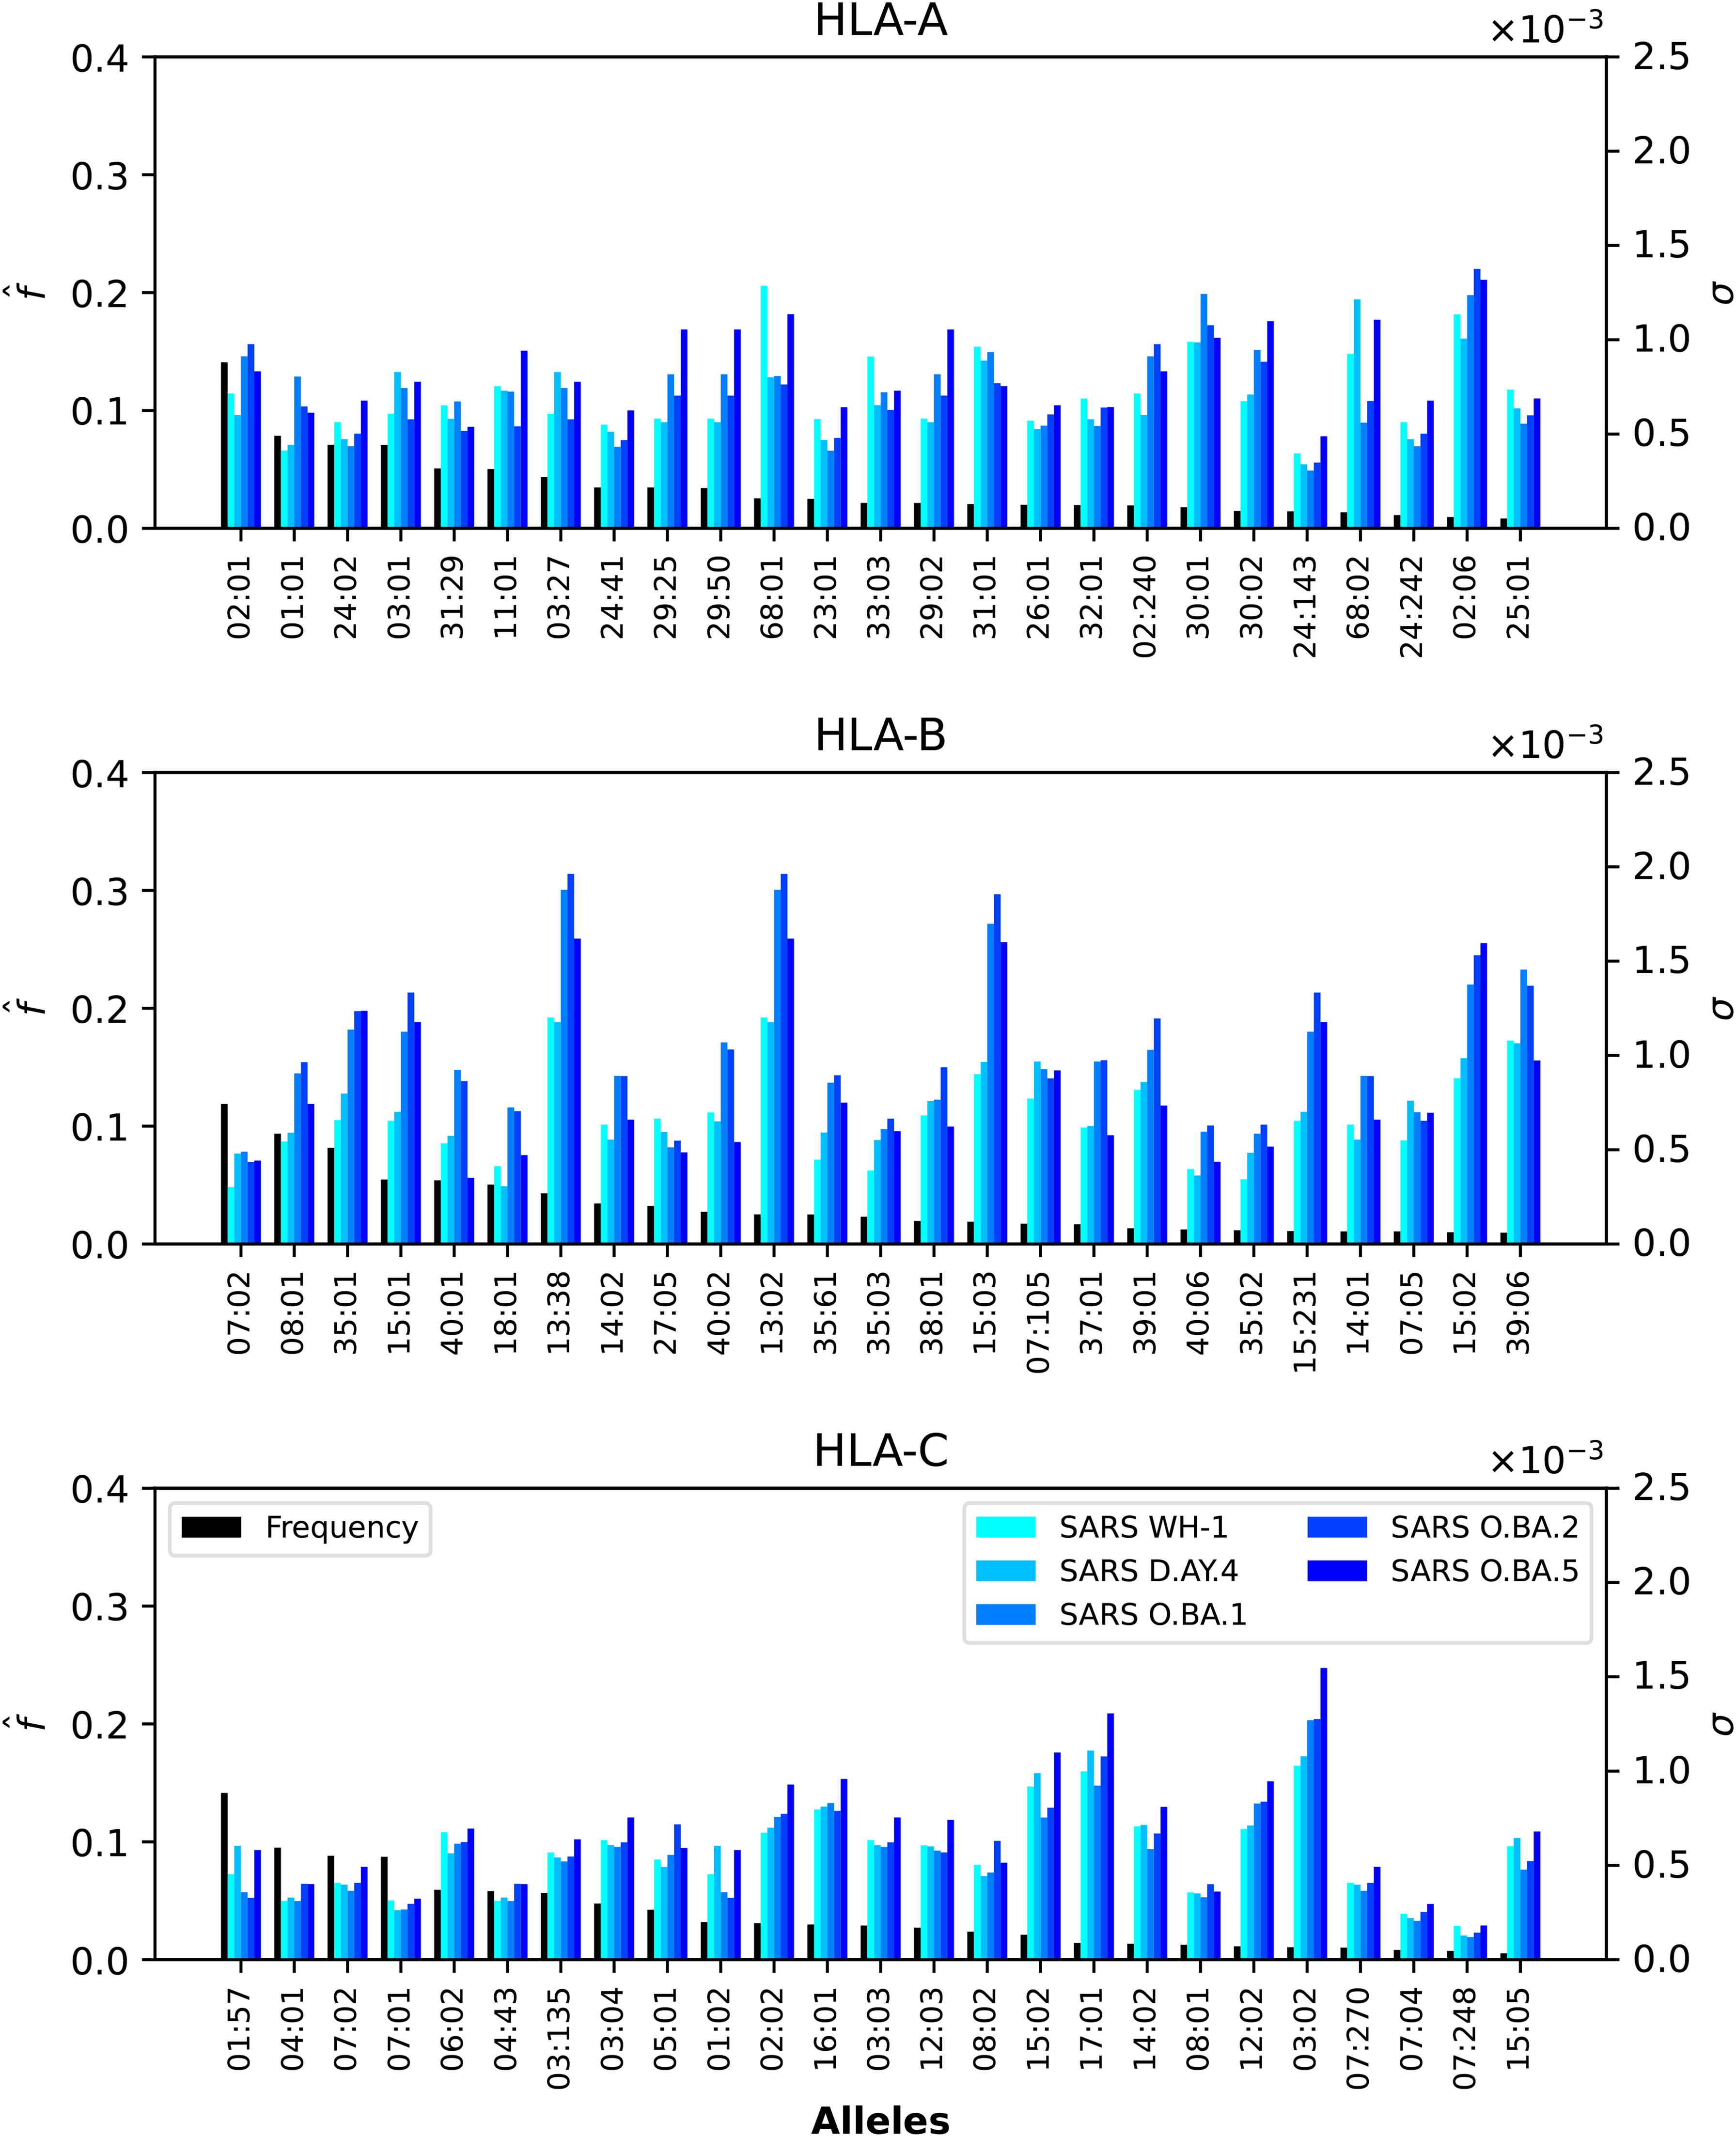
Figure 7. Normalized regional frequencies (left y axis), , and SARS-CoV-2 σi values (right y axis) for the top 25 most frequent alleles of each type in North America (x axis). The top panel represents HLA-A, the middle HLA-B, and the bottom HLA-C alleles, respectively.
Finally, Figure 6 shows that HLA-A and HLA-B Burkholderia σi values are comparable, with HLA-C a bit lower (overall). Those alleles (A, B, or C) identified for their large σi values in Figure 5 and Figure 7 dominate as well in the case of Burkholderia Hcp1. It is, thus, interesting to observe that rather different proteins (from two viruses and one bacterium) seem to be binding better to a subset of HLA class I alleles.
3.3 Dissecting the individual regional coverage metric: allele pair analysis
We now turn our attention to the individual regional coverage metric for allele pairs. Figure 8 shows the frequency and individual regional coverage score, , for each allele pair (see Equation 7) in North America. The top row corresponds to allele frequencies (HLA-A, HLA-B, and HLA-C), the second, third, fourth and fifth to for Ebola GP Zaire, Ebola GP Sudan, Ebola NP Zaire, and Ebola NP Sudan, respectively. Each column thus corresponds to one HLA class I type, HLA-A (left), HLA-B (middle) and HLA-C (right). We observe that overall smaller coverage scores are obtained for HLA-C allele pairs, and that NP proteins and HLA-B allele pairs lead to the largest values, for both Sudan and Zaire variants. For HLA-A, similar coverage scores are obtained for GP and NP proteins, with a slight preference for Zaire versus Sudan. The HLA-B alleles identified in the previous section, HLA-B*13:38, HLA-B*13:02 and HLA-B*15:03, if paired with each other, lead to the largest scores.
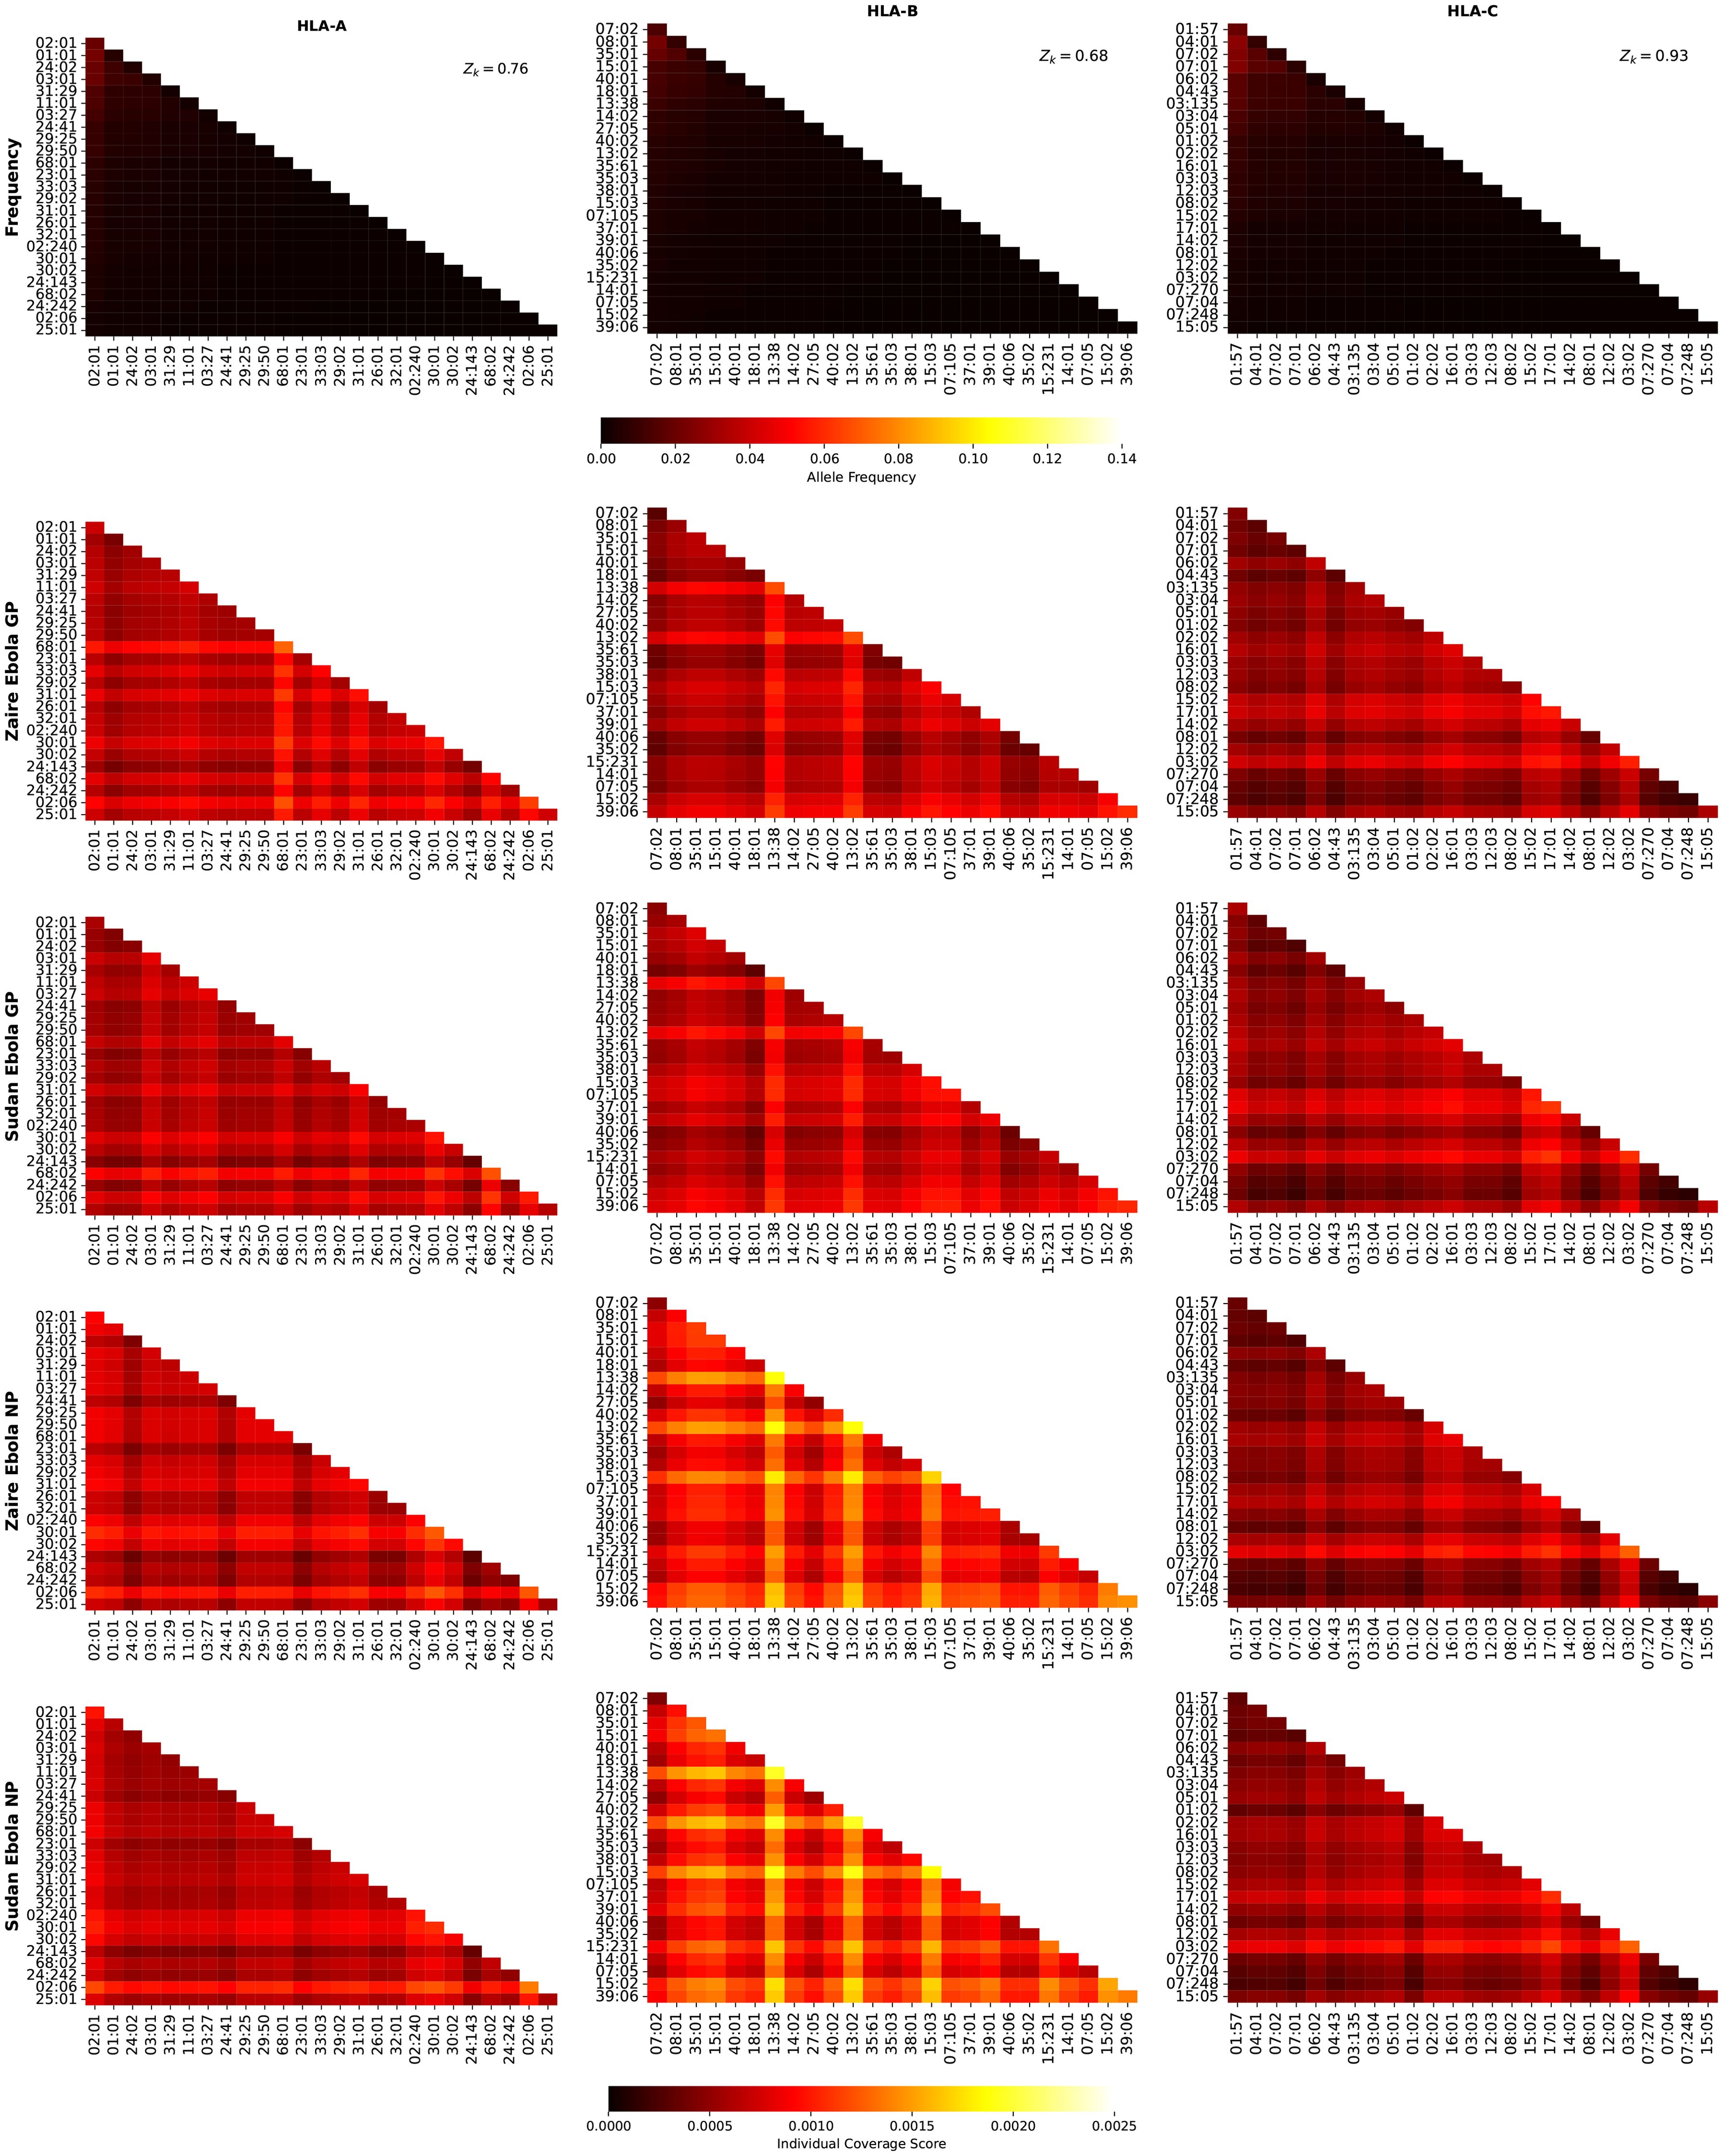
Figure 8. Frequency and individual regional coverage score, , for each allele pair (see Equation 7) in North America. The top row corresponds to allele frequencies (HLA-A, HLA-B, and HLA-C), the second, third, fourth and fifth to for Ebola GP Zaire, Ebola GP Sudan, Ebola NP Zaire, and Ebola NP Sudan, respectively. Left column corresponds to HLA-A alleles, middle to HLA-B, and right to HLA-C. The sum of the individual frequencies for each allele type is indicated on the panels in the top row.
Figure 9 shows the frequency and individual regional coverage score, , for each allele pair (see Equation 7) in North America. The top row corresponds to allele frequencies (HLA-A, HLA-B, and HLA-C), the second and third to for SARS-CoV-2 spike Wuhan-Hu-1 and Delta AY.4, respectively. Each column thus corresponds to one HLA class I type, HLA-A (left), HLA-B (middle) and HLA-C (right). We observe that overall smaller coverage scores are obtained for HLA-C allele pairs, followed by HLA-A, and then HLA-B. There is hardly any difference between the two variants, Wuhan-Hu-1 and Delta AY.4. The HLA-B alleles identified in the previous section, HLA-B*13:38, HLA-B*13:02 and HLA-B*15:03, if paired with each other, lead to the largest scores, which are lower when compared to those in Figure 8.
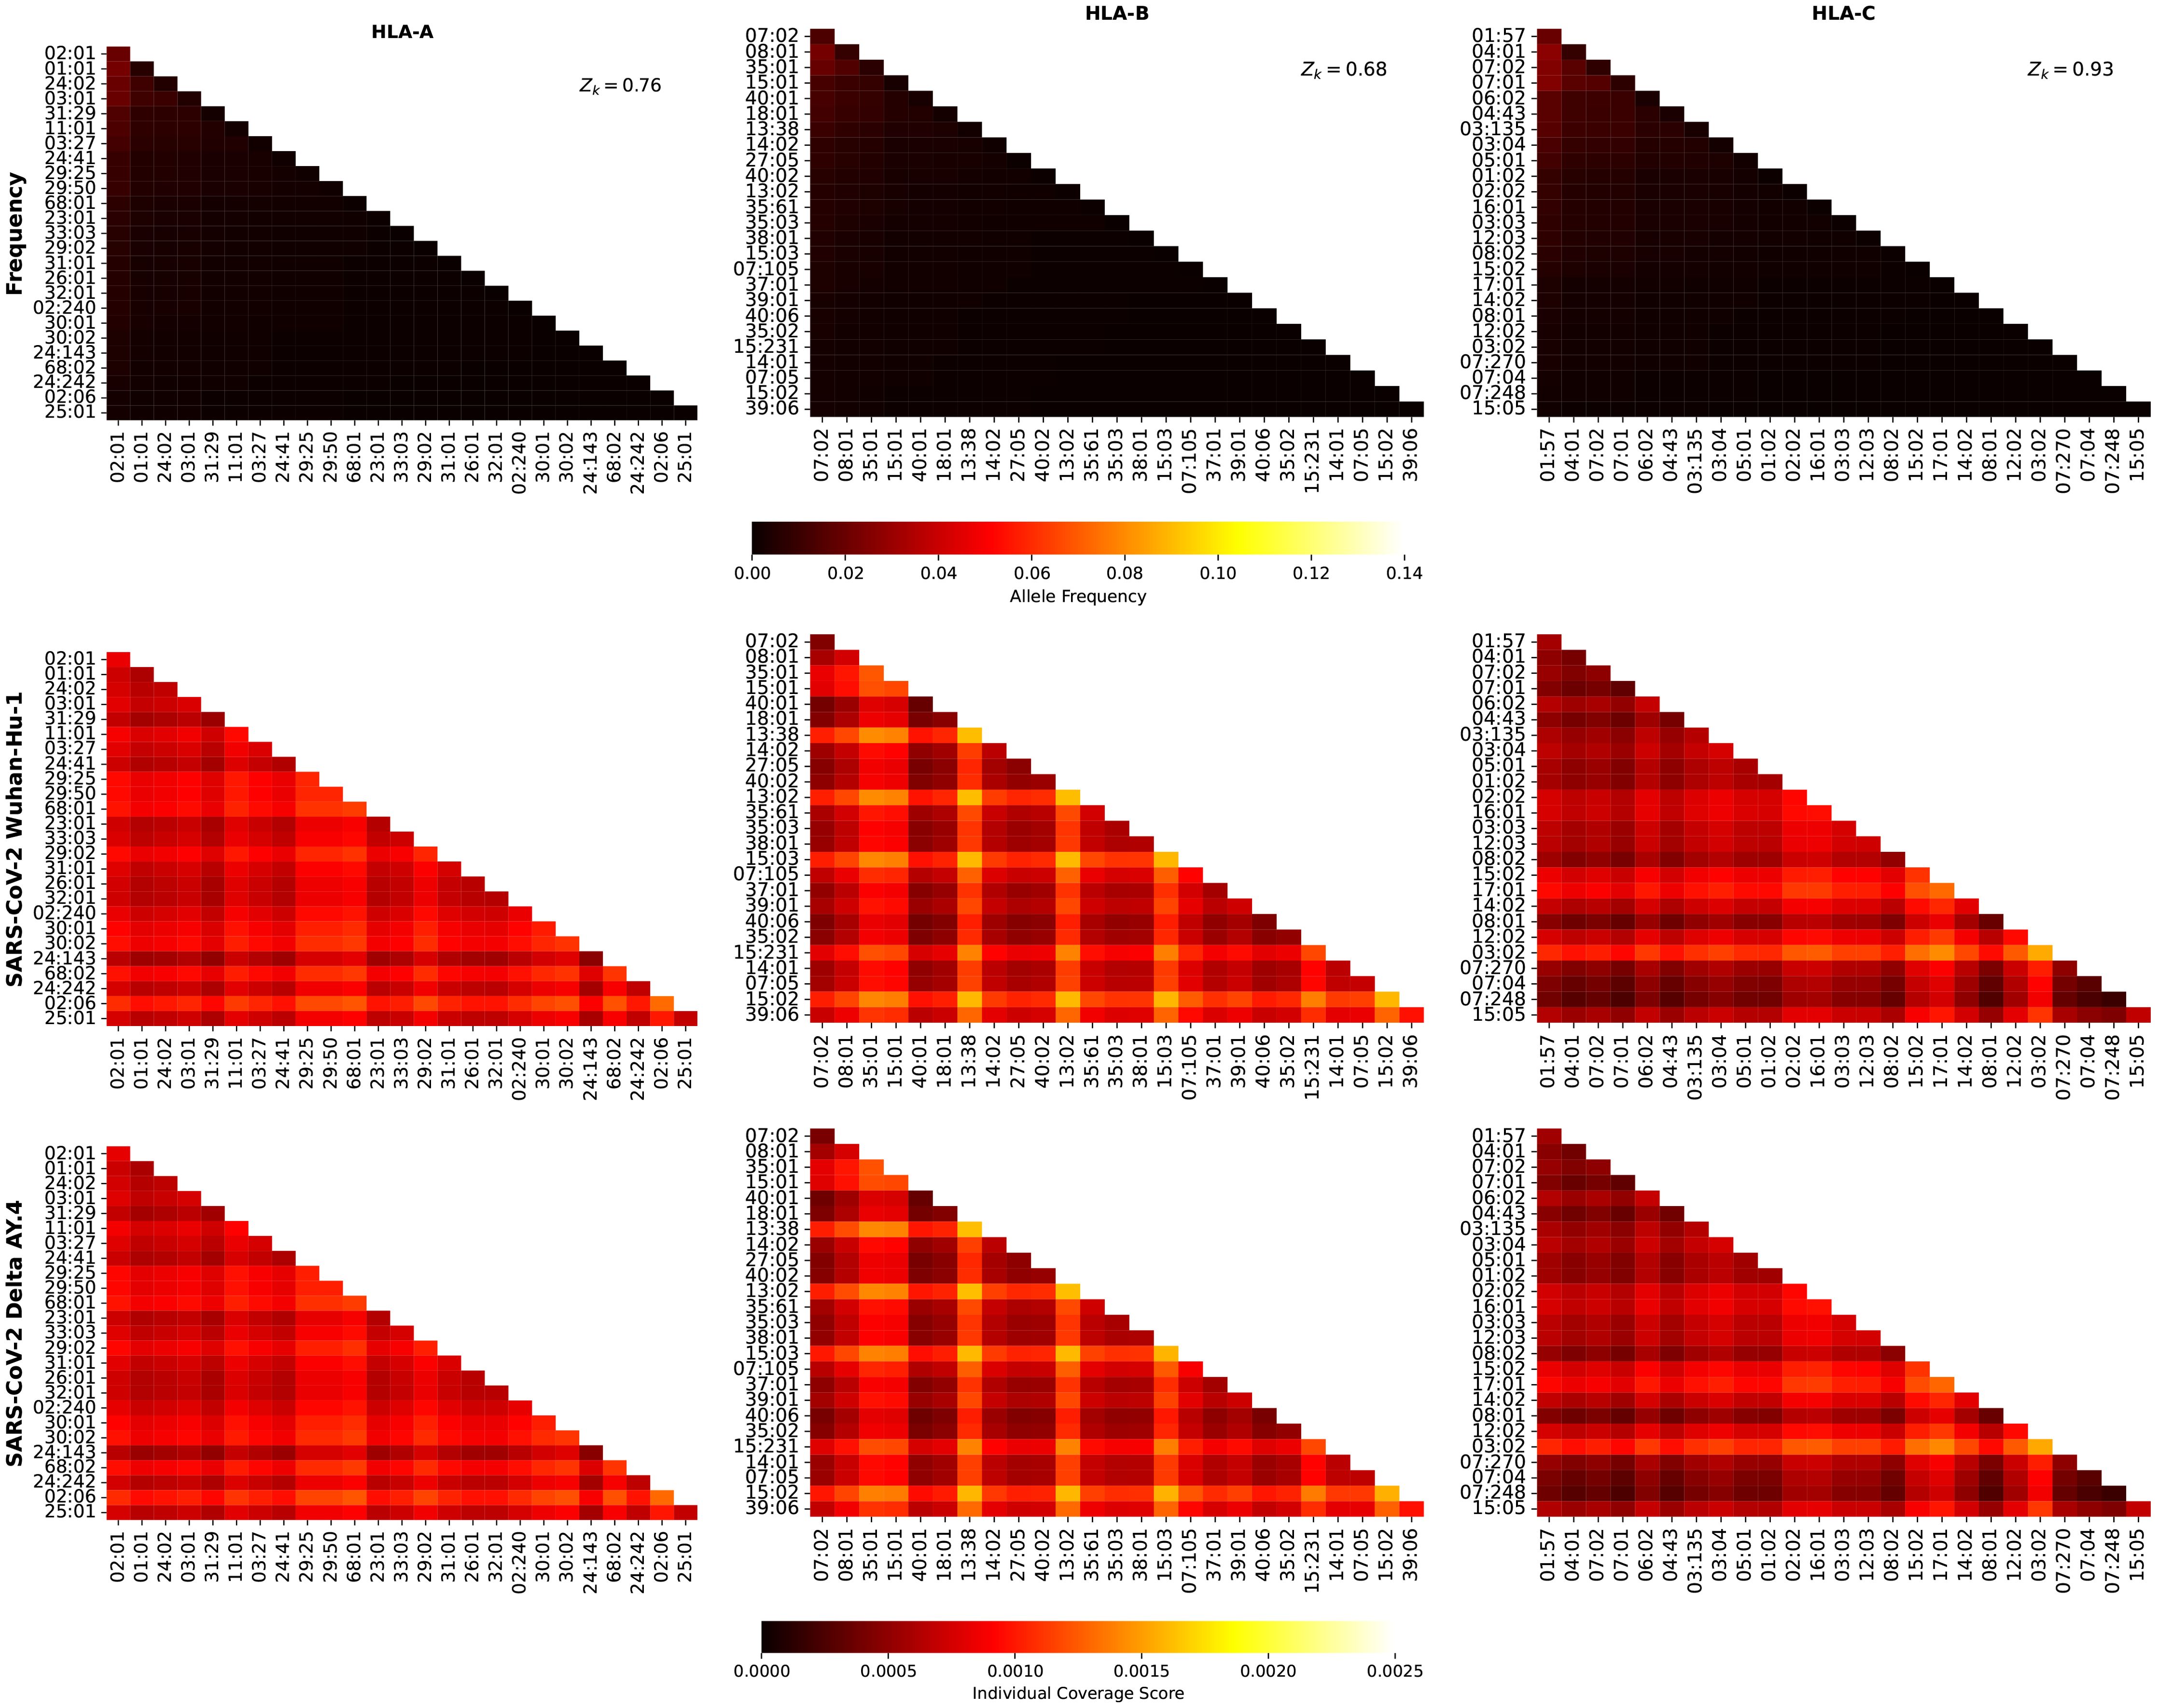
Figure 9. Frequency and individual regional coverage score, , for each allele pair (see Equation 7) in North America. The top row corresponds to allele frequencies (HLA-A, HLA-B, and HLA-C), the second and third to for SARS-CoV-2 spike Wuhan-Hu-1 and Delta AY.4, respectively. Left column corresponds to HLA-A alleles, middle to HLA-B, and right to HLA-C. The sum of the individual frequencies for each allele type is indicated on the panels in the top row.
Figure 10 shows the frequency and individual regional coverage score, , for each allele pair (see Equation 7) in North America. The top row corresponds to allele frequencies (HLA-A, HLA-B, and HLA-C), the second, third, and fourth to for SARS-CoV-2 spike Omicro BA.1, BA.2, and BA.5, respectively. Each column thus corresponds to one HLA class I type, HLA-A (left), HLA-B (middle) and HLA-C (right). No significant differences can be found between this figure and Figure 9, indicating, in agreement with the results of Ref (48) that CD8+ T cell responses elicited by the SARS-CoV-2 spike vaccine (Wuhan ancestral sequence) will be protective and cross-reactive against Omicron variants.
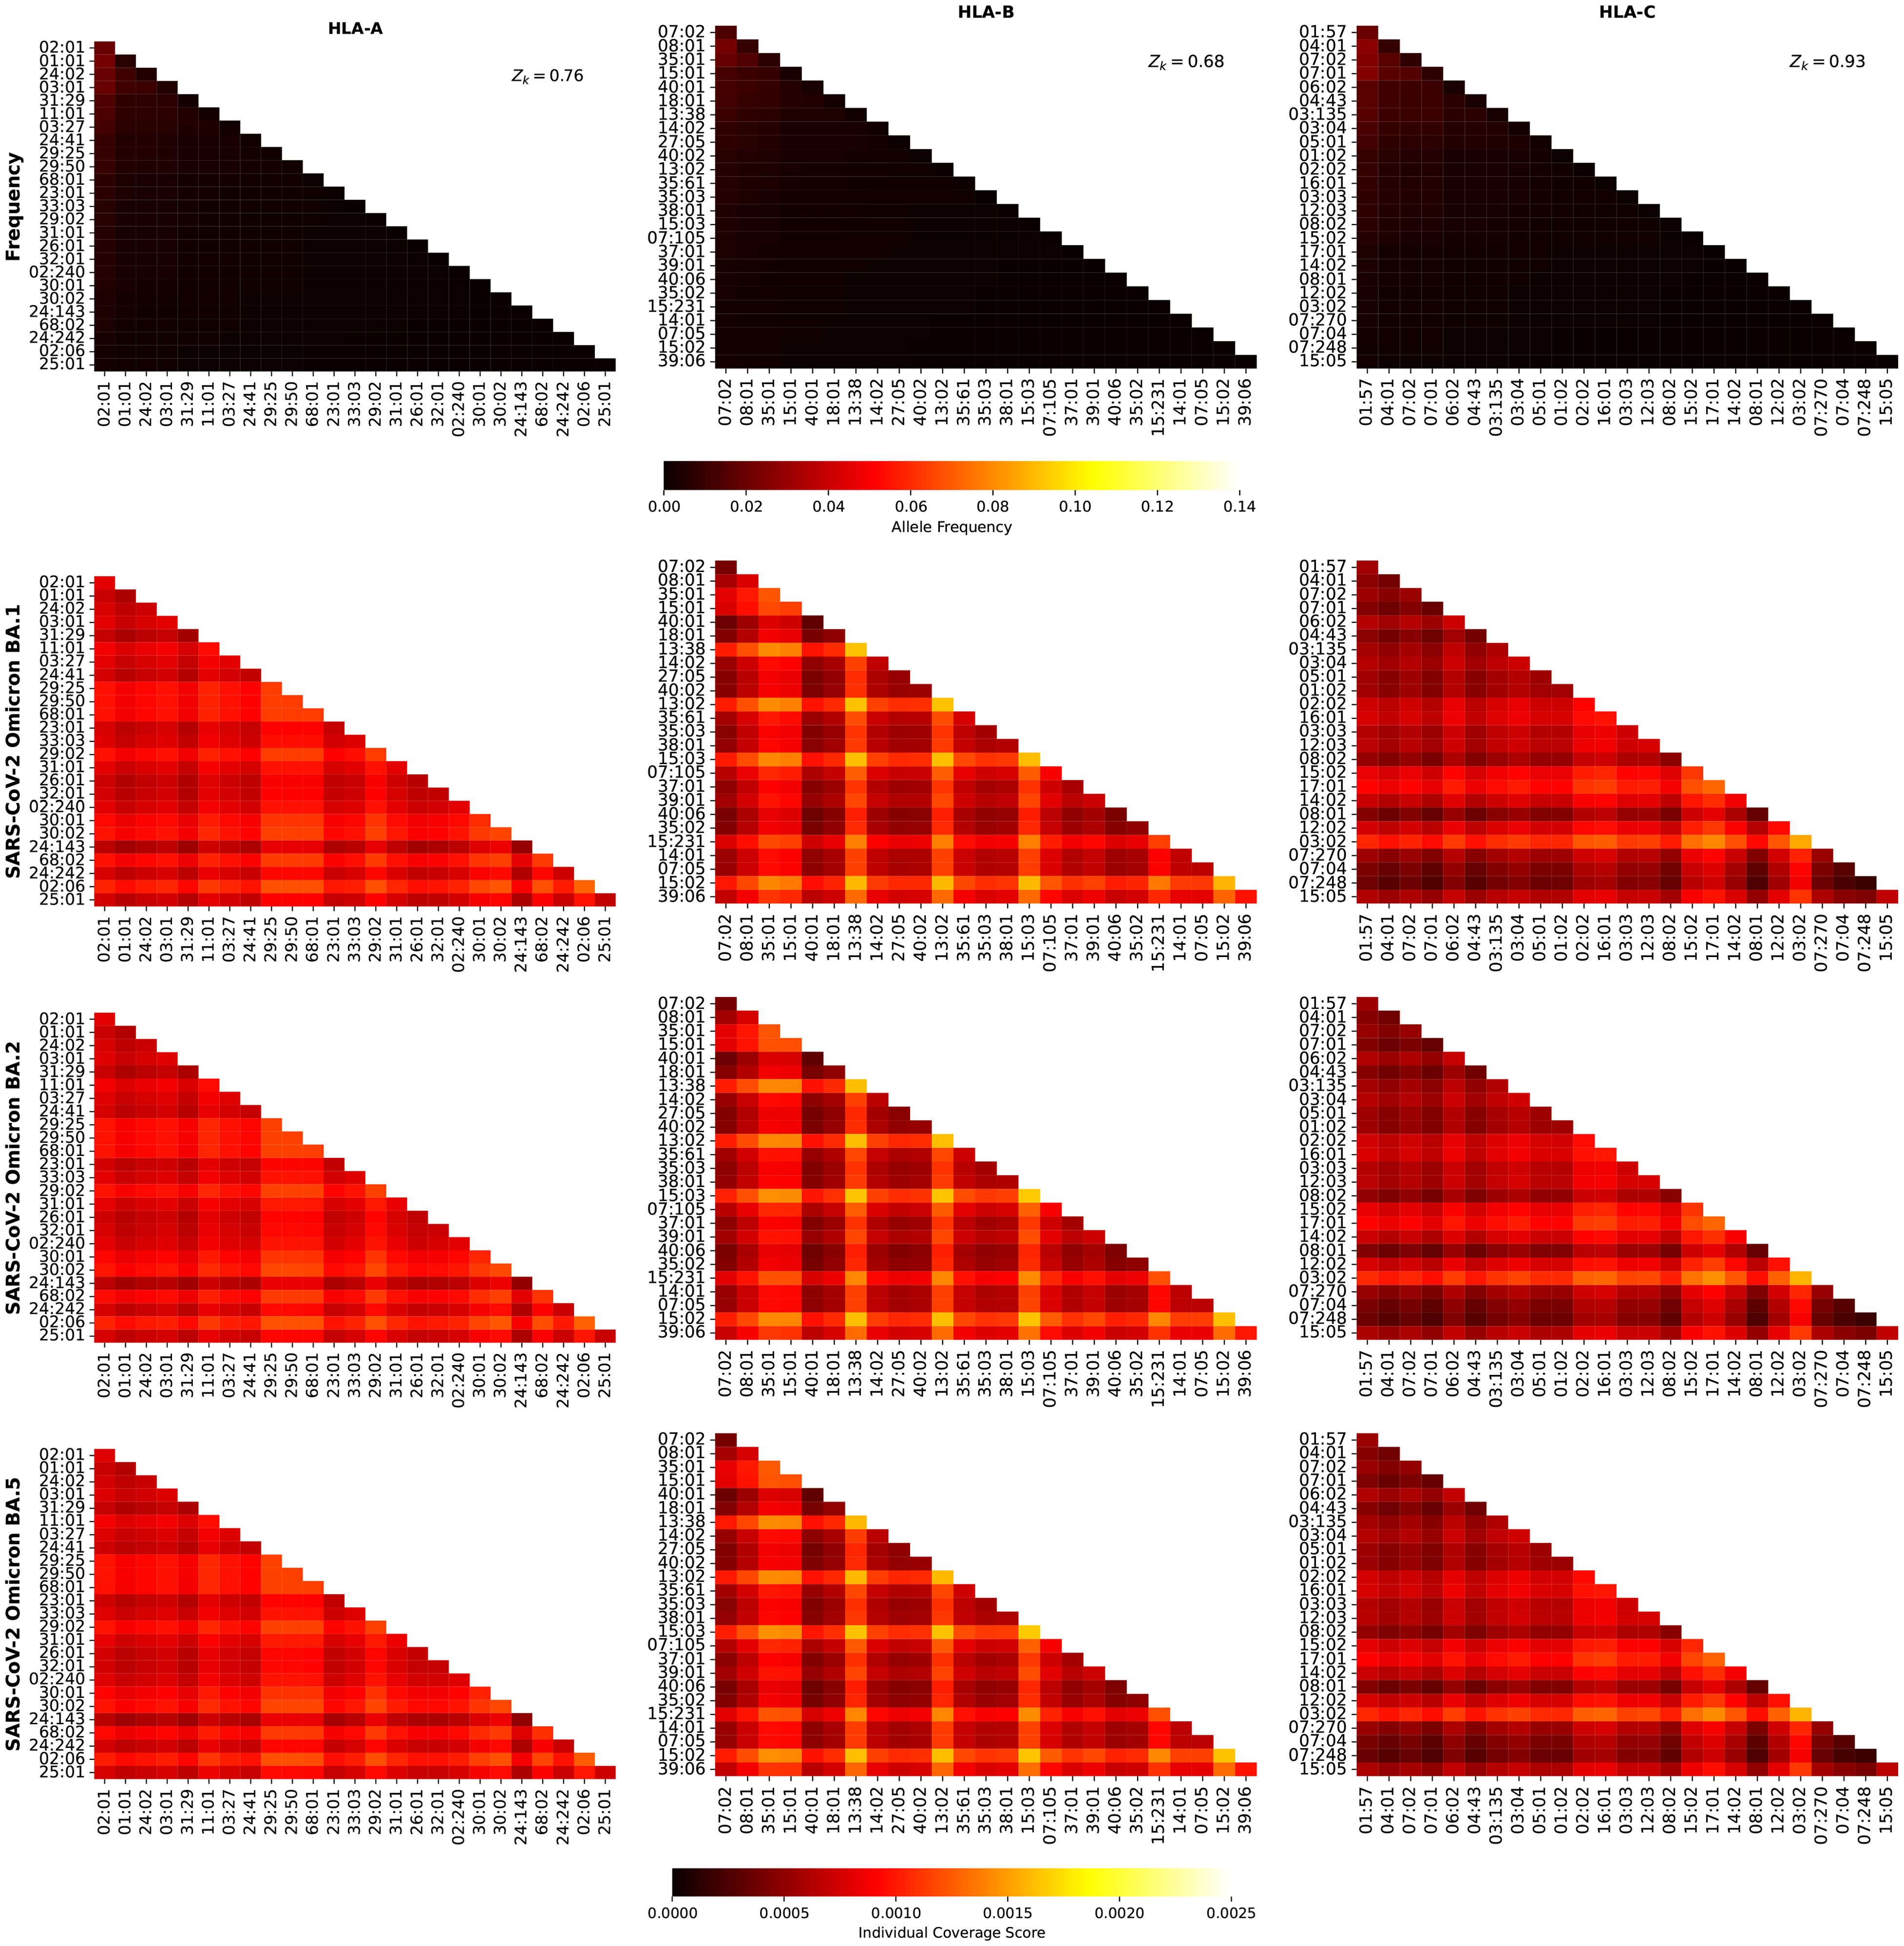
Figure 10. Frequency and individual regional coverage score, , for each allele pair (see Equation 7) in North America. The top row corresponds to allele frequencies (HLA-A, HLA-B, and HLA-C), the second, third, and fourth to for SARS-CoV-2 spike Omicron BA.1, BA.2, and BA.5, respectively. Left column corresponds to HLA-A alleles, middle to HLA-B, and right to HLA-C. The sum of the individual frequencies for each allele type is indicated on the panels in the top row.
Figure 11 shows the frequency and individual regional coverage score, , for each allele pair (see Equation 7) in North America. The top row corresponds to allele frequencies (HLA-A, HLA-B, and HLA-C), and the bottom to for Burkholderia Hcp1 protein. Each column thus corresponds to one HLA class I type, HLA-A (left), HLA-B (middle) and HLA-C (right). For the Burkholderia Hcp1 protein, we observe that the dominant individual coverage scores correspond to HLA-A, followed by HLA-B, and then HLA-C. The HLA-B alleles that were identified, both for Ebola NP and for SARS-CoV-2 spike, with high values, do not play such a significant role in the case of the Hcp1 protein.
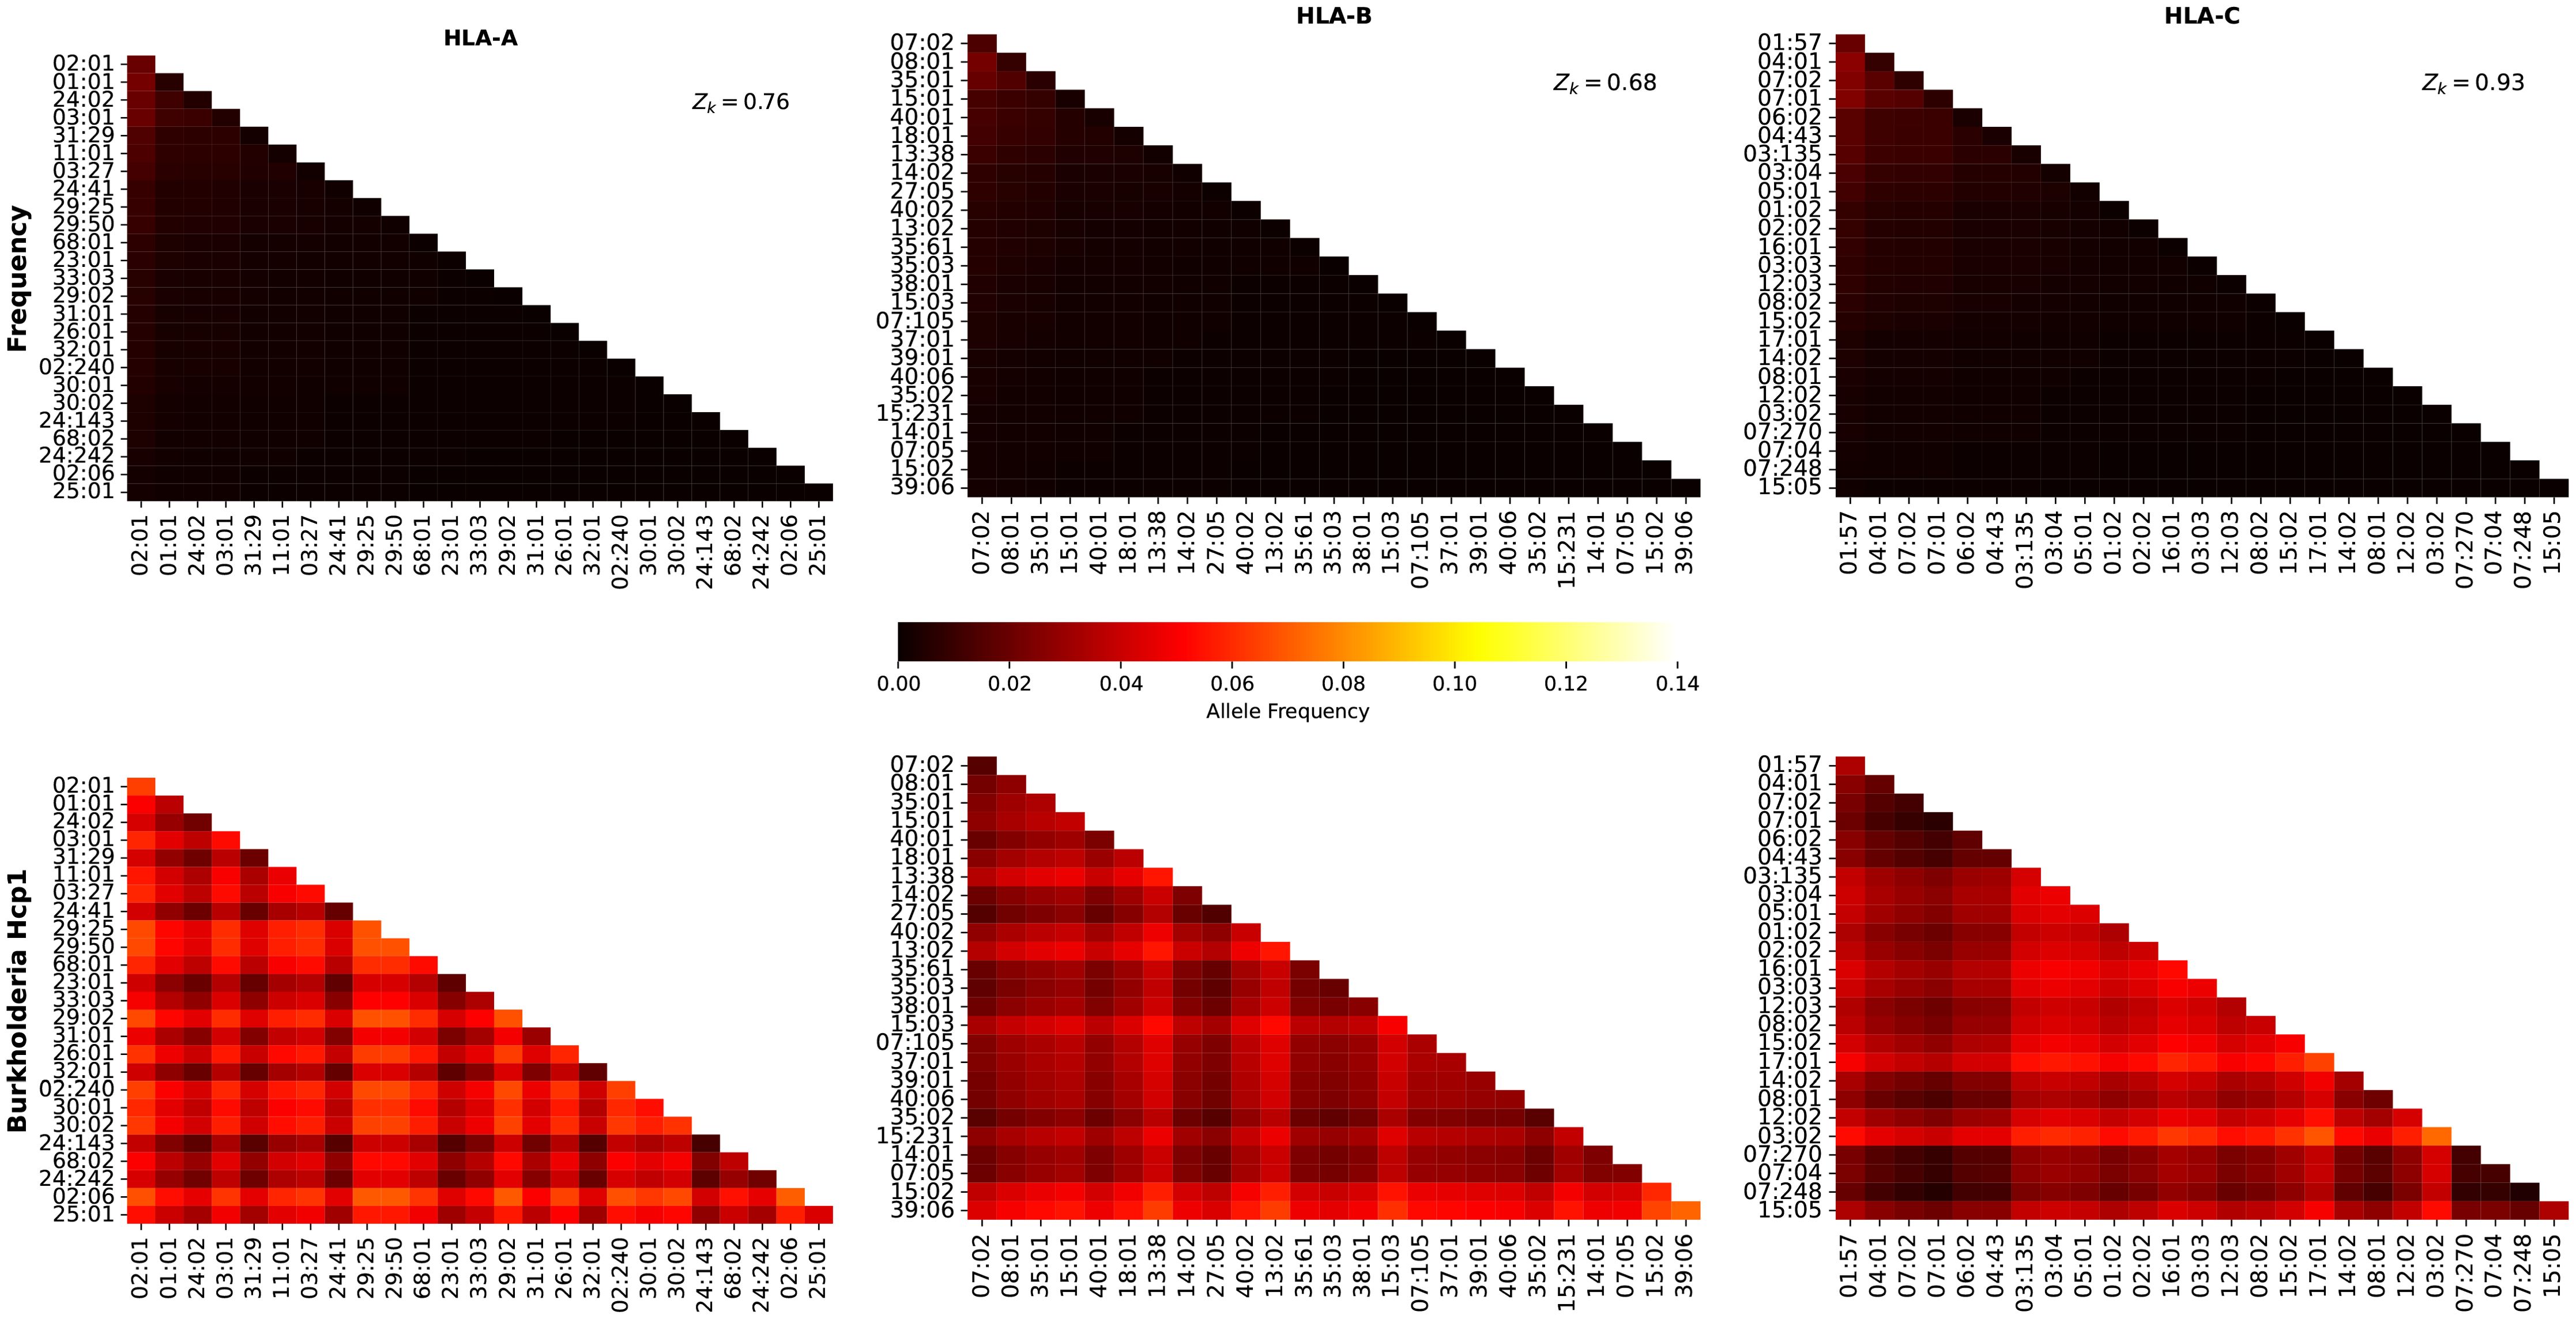
Figure 11. Frequency and individual regional coverage score, , for each allele pair (see Equation 7) in North America. The top row corresponds to allele frequencies (HLA-A, HLA-B, and HLA-C), and the bottom to for Burkholderia Hcp1 protein. Left column corresponds to HLA-A alleles, middle to HLA-B, and right to HLA-C. The sum of the individual frequencies for each allele type is indicated on the panels in the top row.
3.4 Contribution of immuno-dominant epitopes to mean coverage metric
We next analyze the contribution of the immuno-dominant epitopes to the mean coverage metric, as defined by the ratio in Equation 10. Immuno-dominant epitopes have been identified for Ebola GP (Zaire and Sudan) and SARS-CoV-2 spike protein in section 2.3.
Figure 12 displays, per geographical region, the values of for the different proteins considered, and the three different HLA class I types, HLA-A (top), HLA-B (middle) and HLA-C (bottom), respectively. We note that the overall highest contributions from the immuno-dominant epitopes correspond to HLA-A alleles, with Ebola GP Zaire leading, for all regions, except for South and Central America. The contribution for the different SARS-CoV-2 immuno-dominant epitopes is largest for the Wuhan-Hu-1 variant, decreasing for Delta AY.4 and Omicron BA.1, and then increasing for both Omicron BA.2 and BA.5. For HLA-B alleles, is clearly largest for Ebola GP Zaire (around 6%), and lower for the SARS-CoV-2 spike immunodominant epitopes and Ebola GP Zaire (around 2%). The situation seems reversed for HLA-C alleles, where the SARS-CoV-2 spike immuno-dominant epitopes lead to the largest values of (around 5%). In this instance, Ebola GP Zaire is around 1% and much lower for the Ebola GP Sudan.
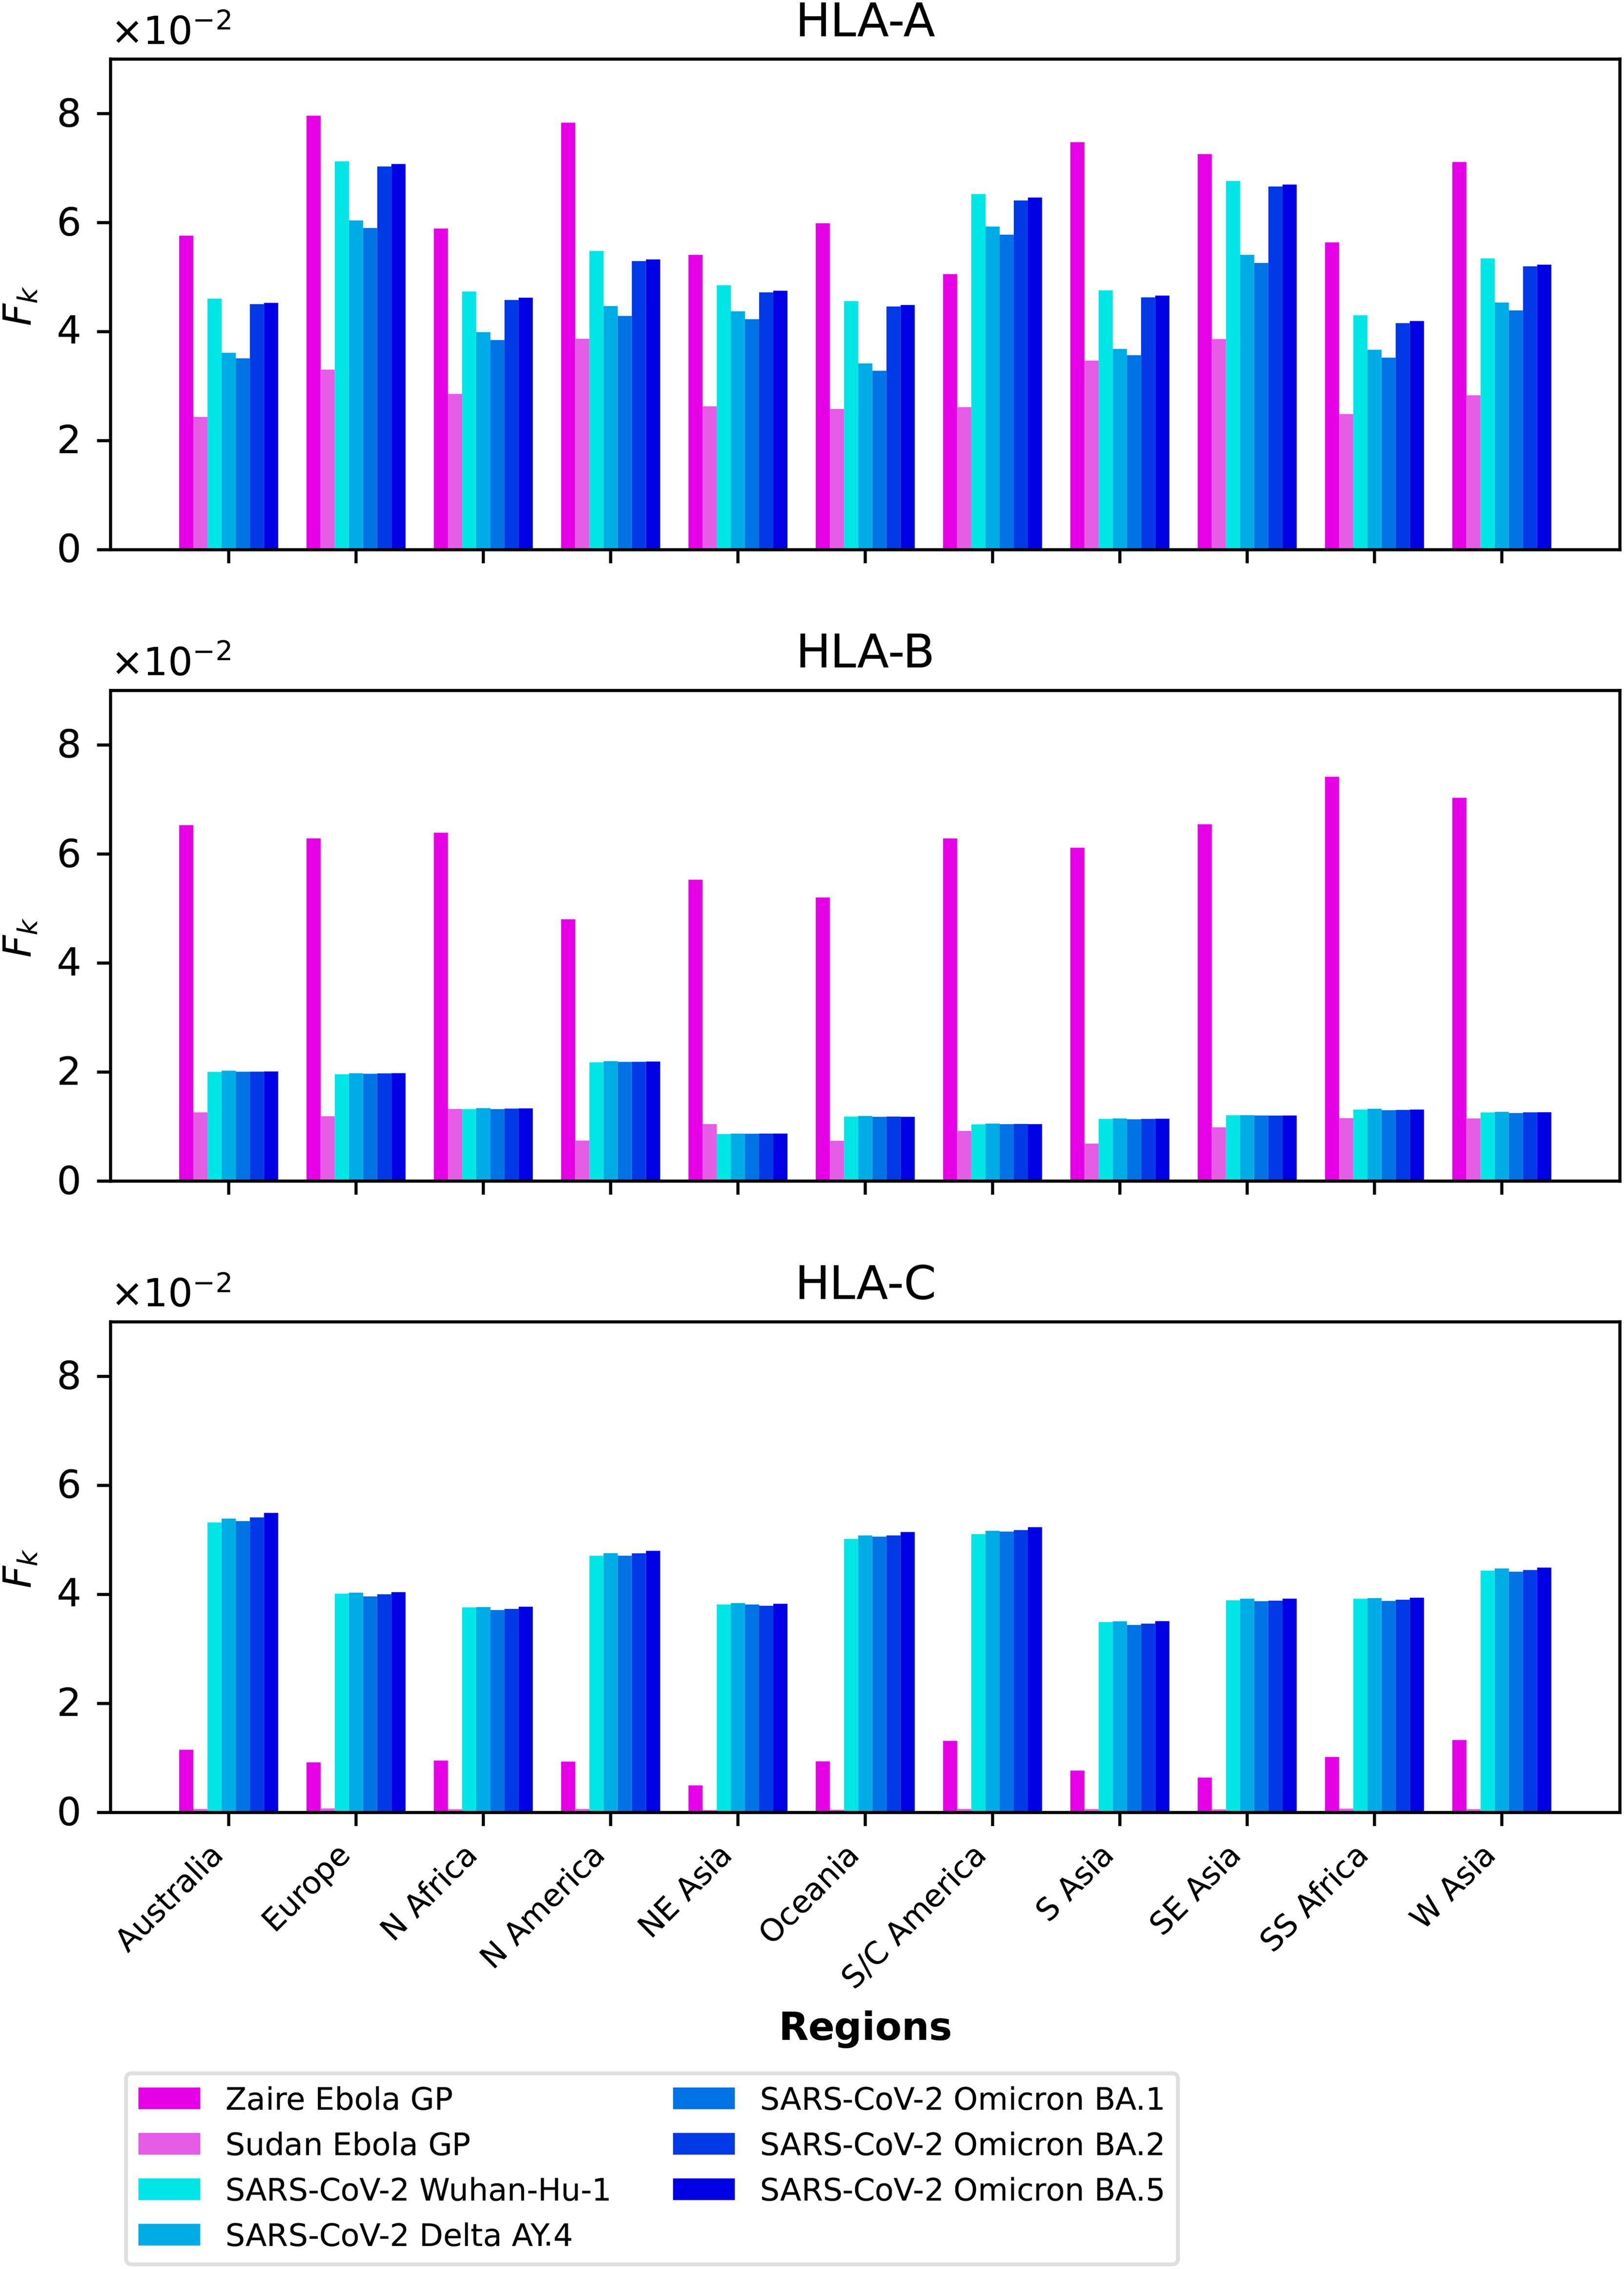
Figure 12. grouped by geographical region for Ebola GP and SARS-CoV-2 spike immuno-dominant epitopes, and for HLA-A (top), HLA-B (middle), and HLA-C (bottom).
Figure 13 displays, per pathogen, the values of for the different proteins considered, and the three different HLA class I types, HLA-A (top), HLA-B (middle) and HLA-C (bottom), respectively. It is interesting to observe that for HLA-A alleles, and across proteins, the largest contribution from immuno-dominant epitopes to the mean regional coverage metric is achieved in Europe. Whereas for HLA-C alleles, the leading region is Australia, followed closely by South and Central America, Oceania, and North America.
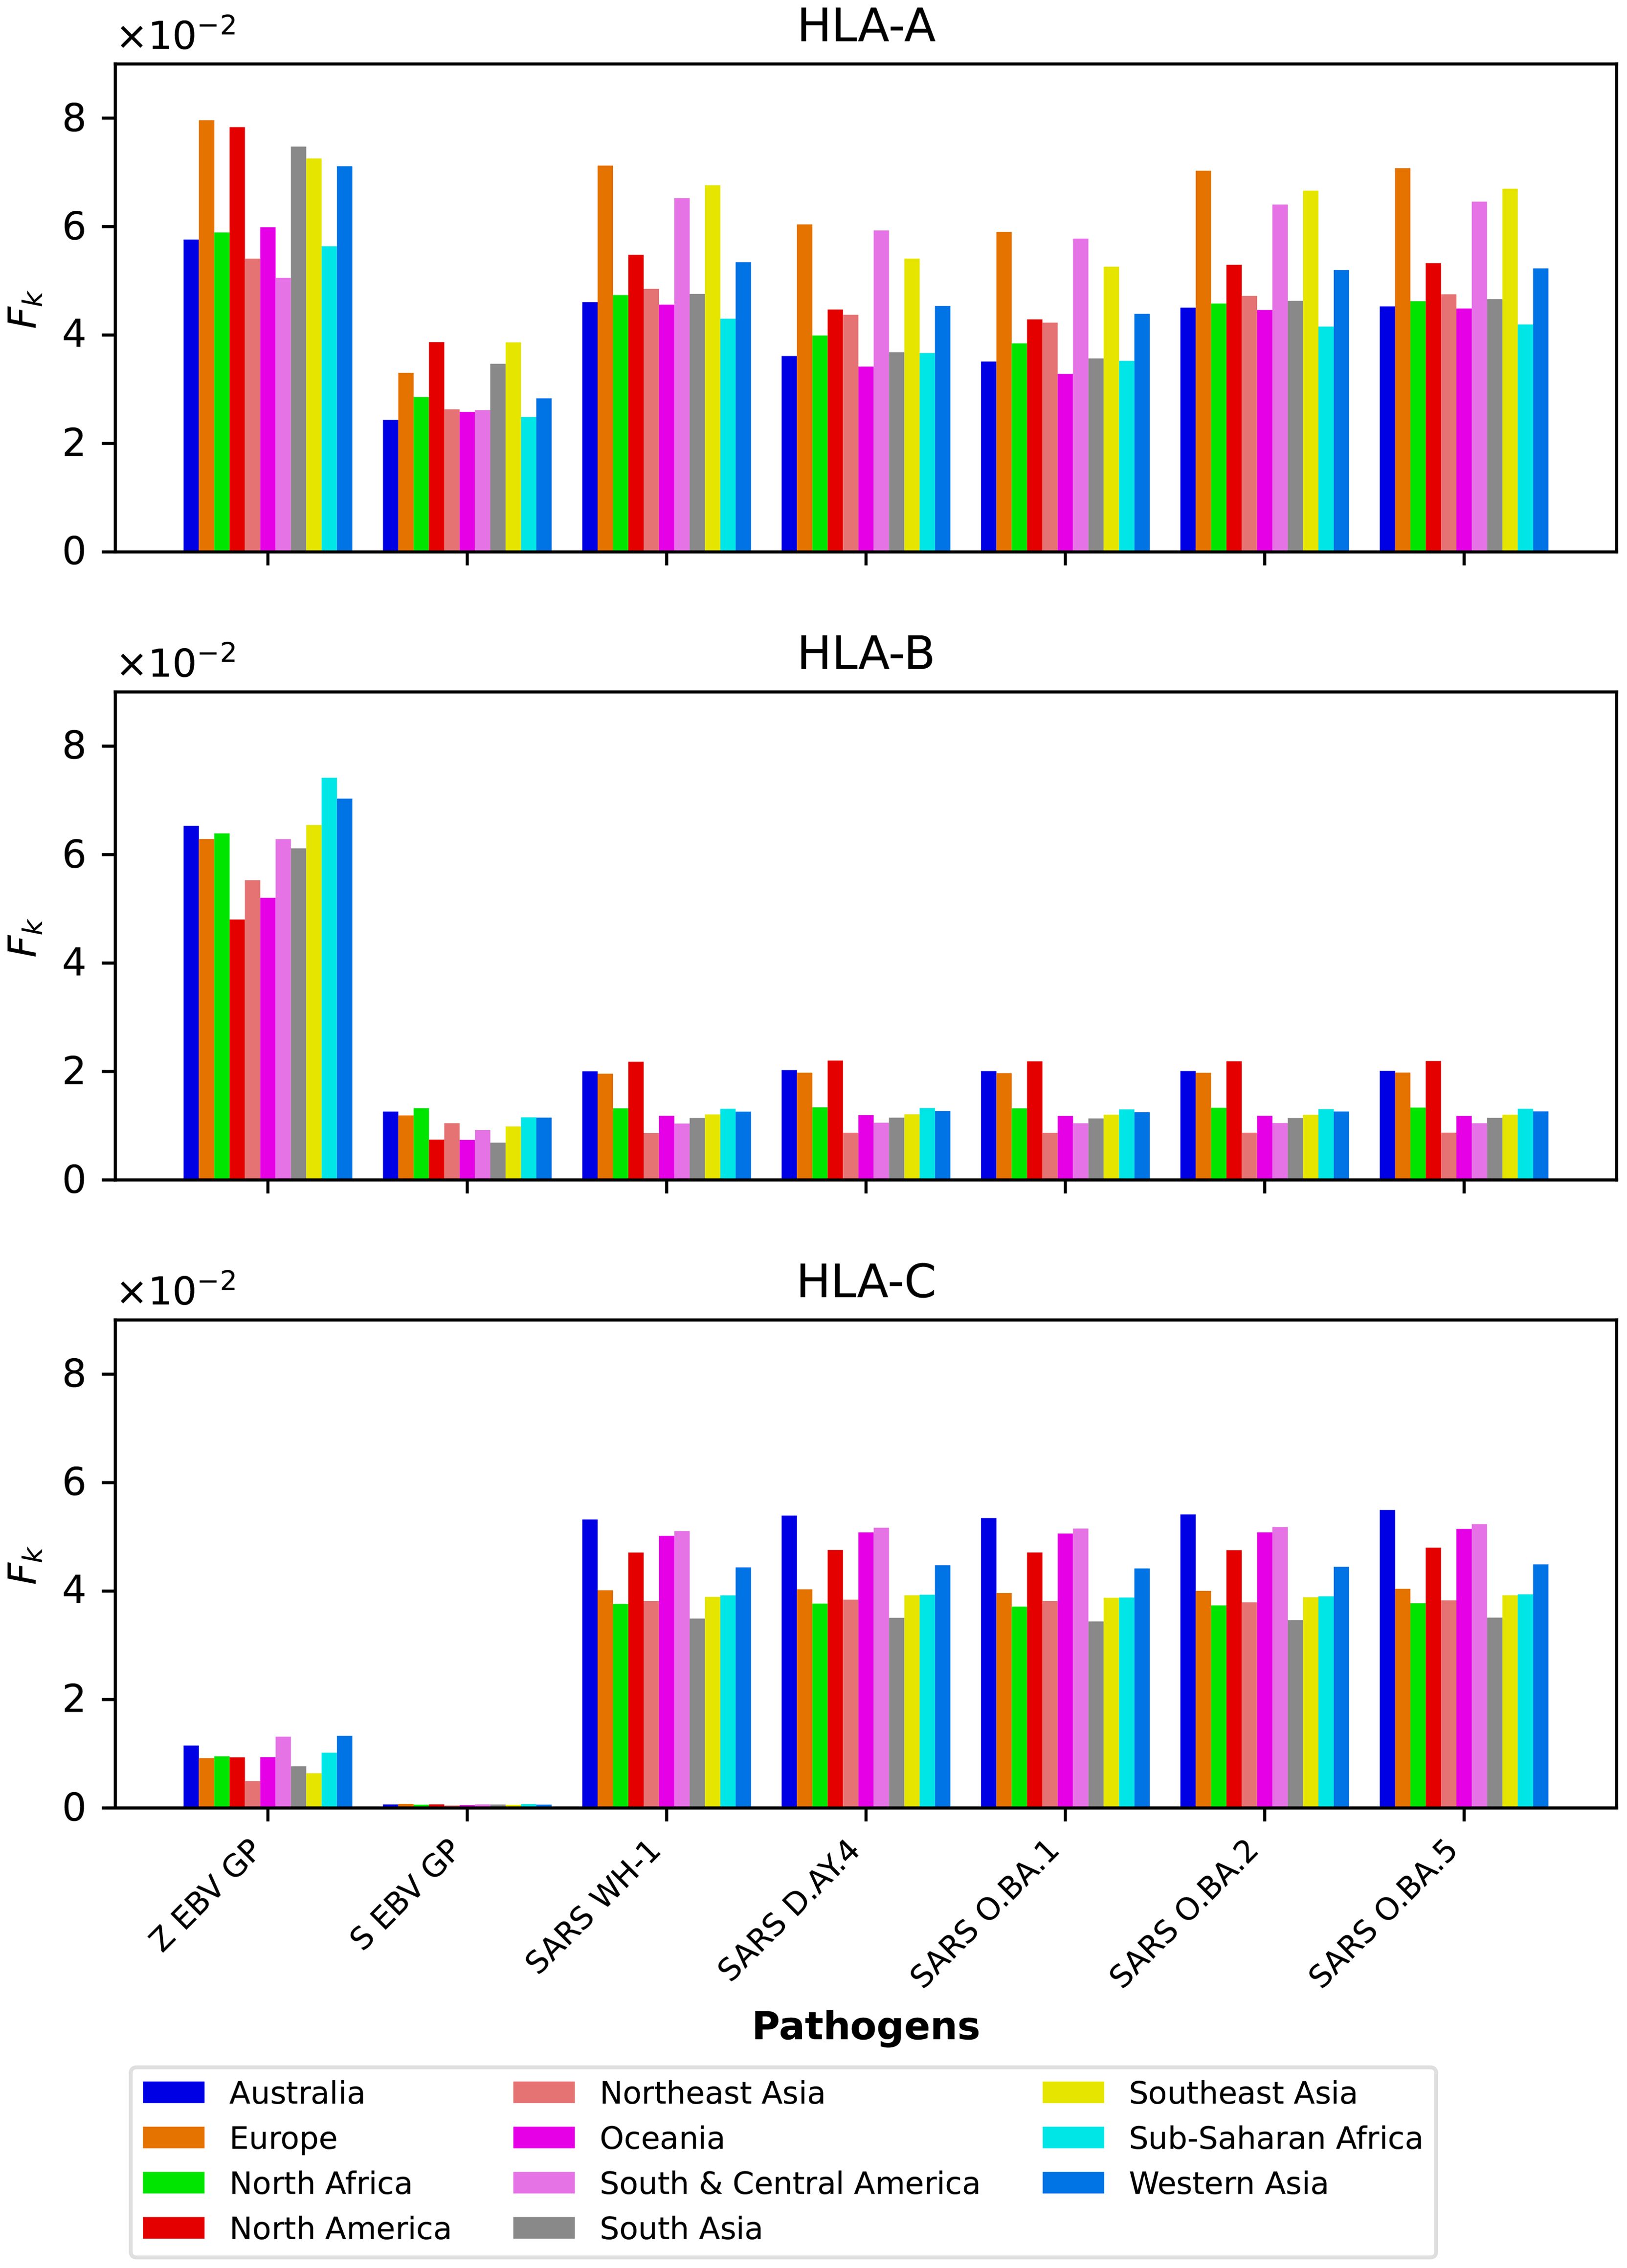
Figure 13. grouped by protein for the eleven different geographical regions, and for HLA-A (top), HLA-B (middle), and HLA-C (bottom).
3.5 Distributions of immuno-dominant epitopes
We now display the results from the analysis of the probability distributions for gj and ϕj (see section 2.3).
Figures 14 and 15 show the gj probability distributions for Ebola GP and SARS-CoV-2 spike protein, respectively. We have identified individual values corresponding to the immuno-dominant epitopes. Our results indicate that the immuno-dominant epitopes do not have significantly larger immunogenicity values, when compared to non-immuno-dominant ones.
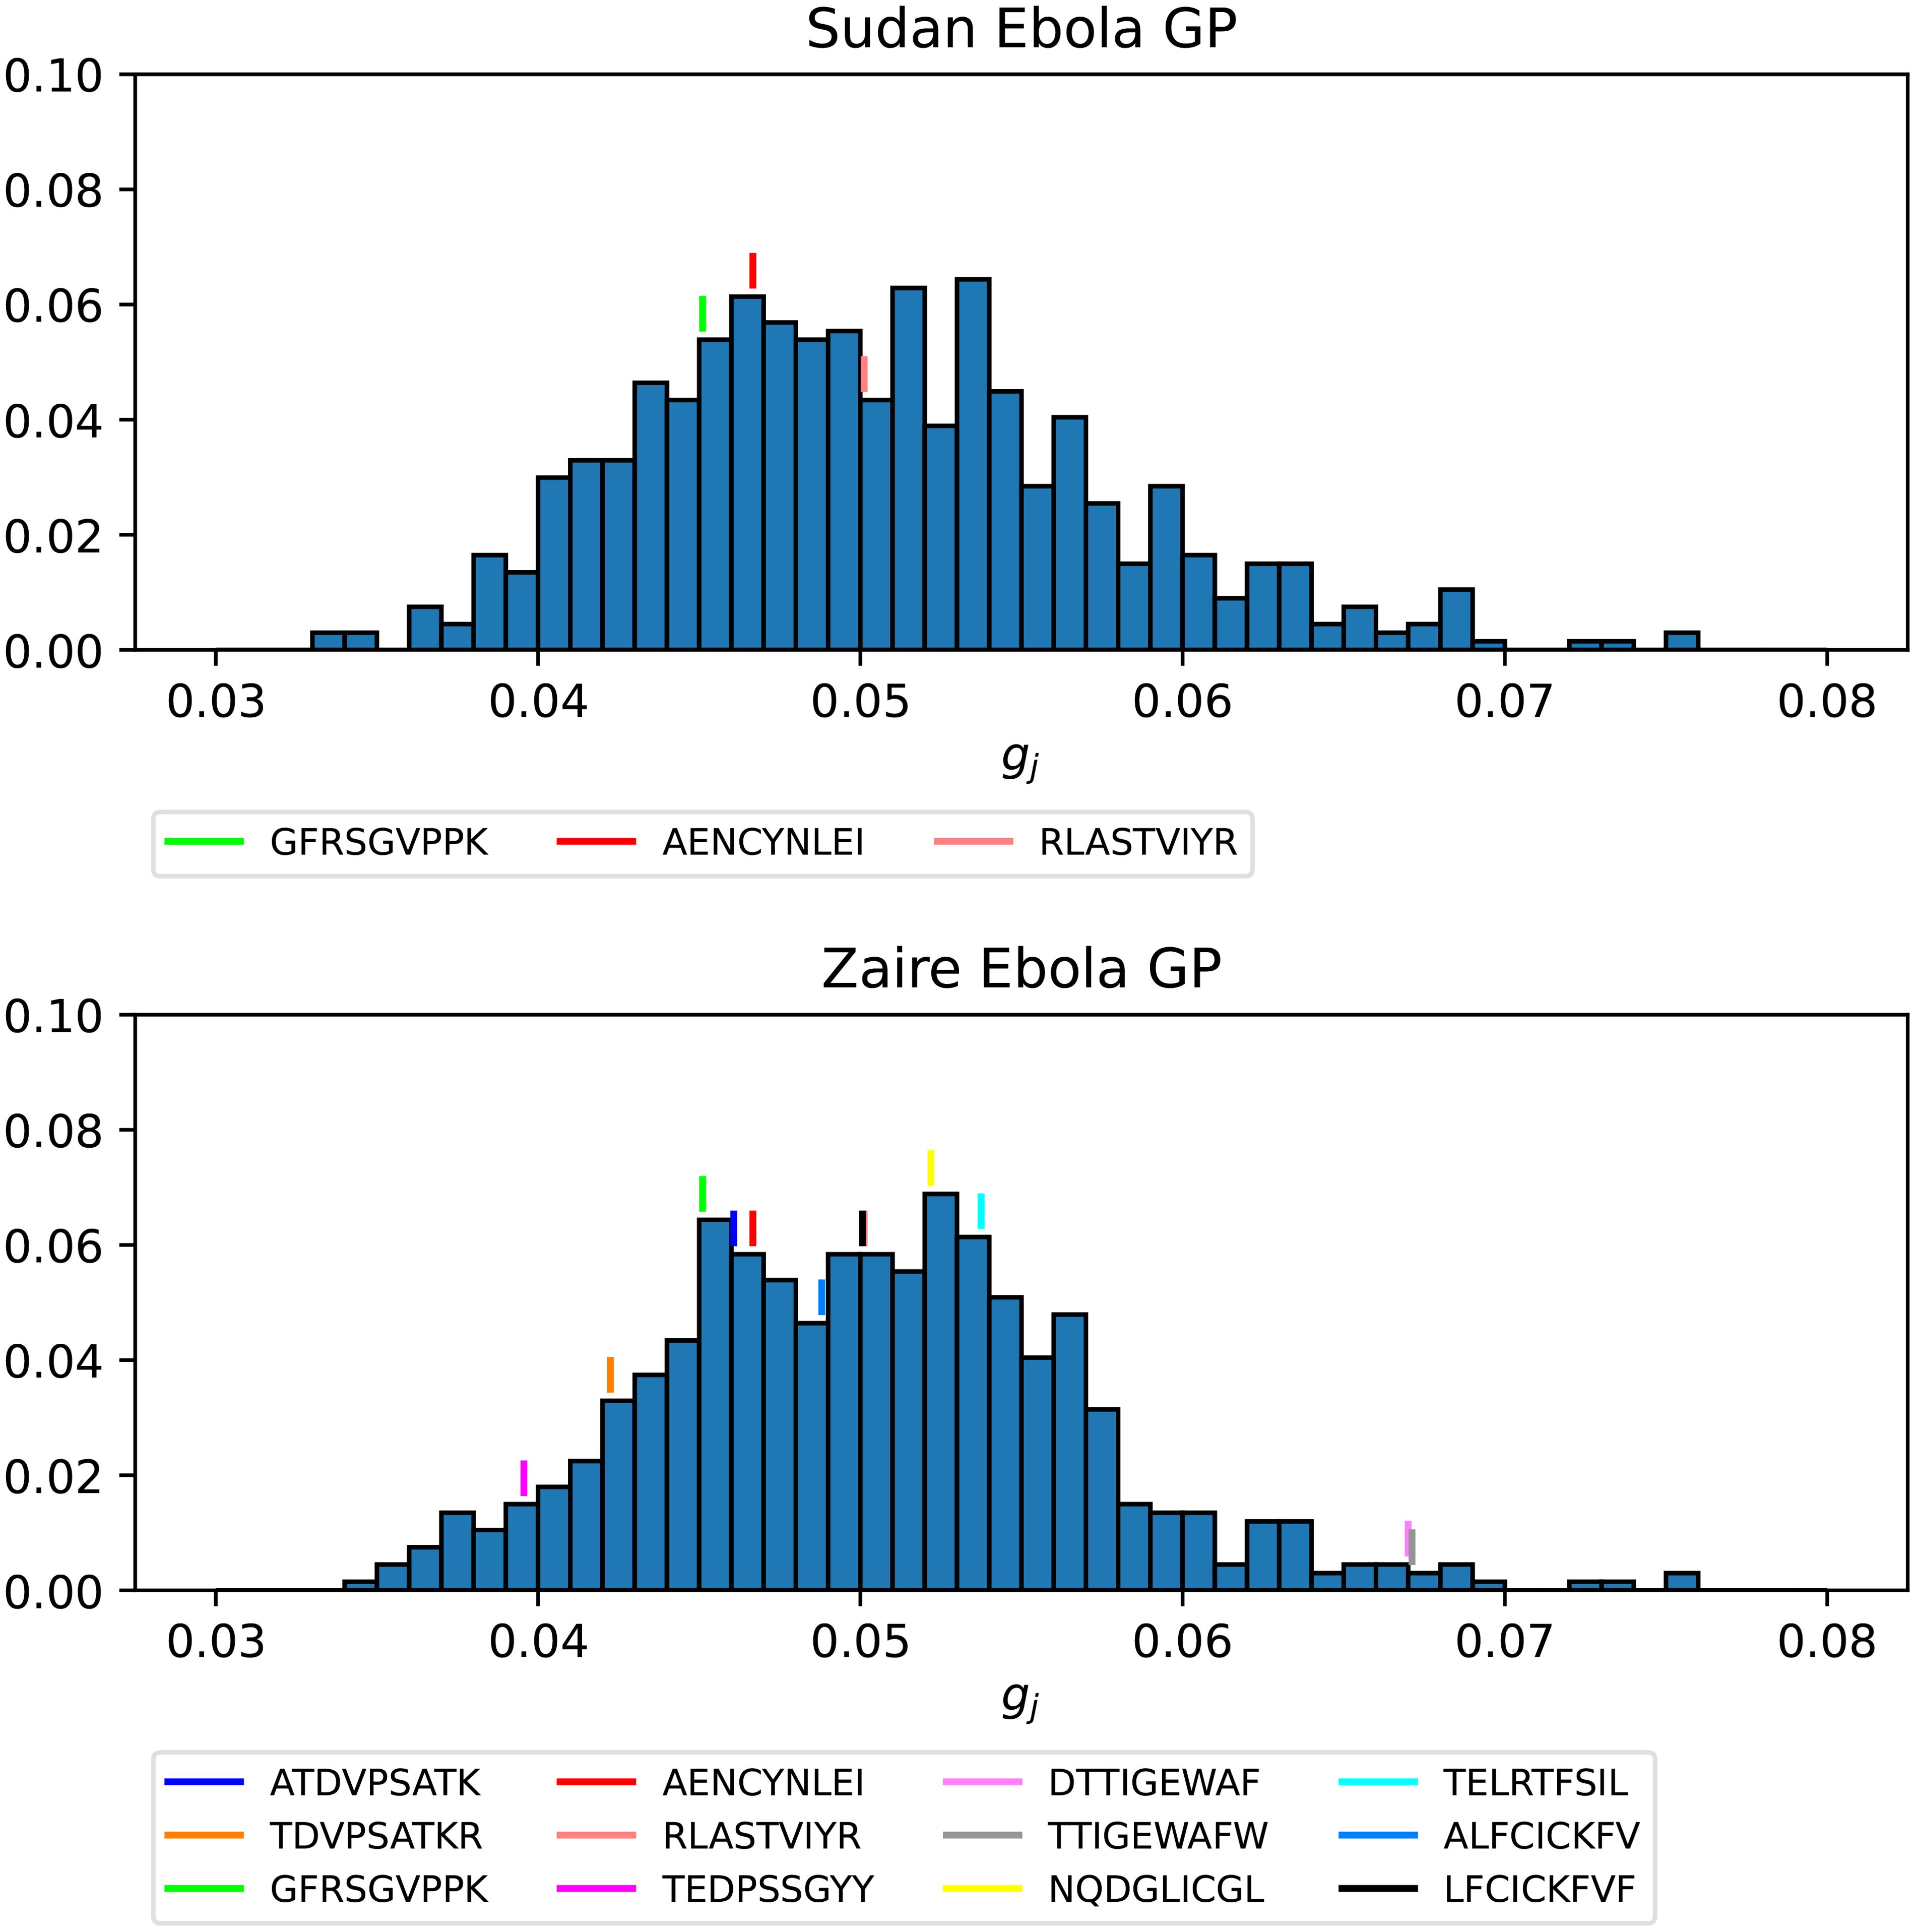
Figure 14. Probability distribution for the immunogenicity, gj, of the nonamers of Ebola GP Sudan (top) and Ebola GP Zaire (bottom). Individual values corresponding to the immuno-dominant epitopes have been identified.
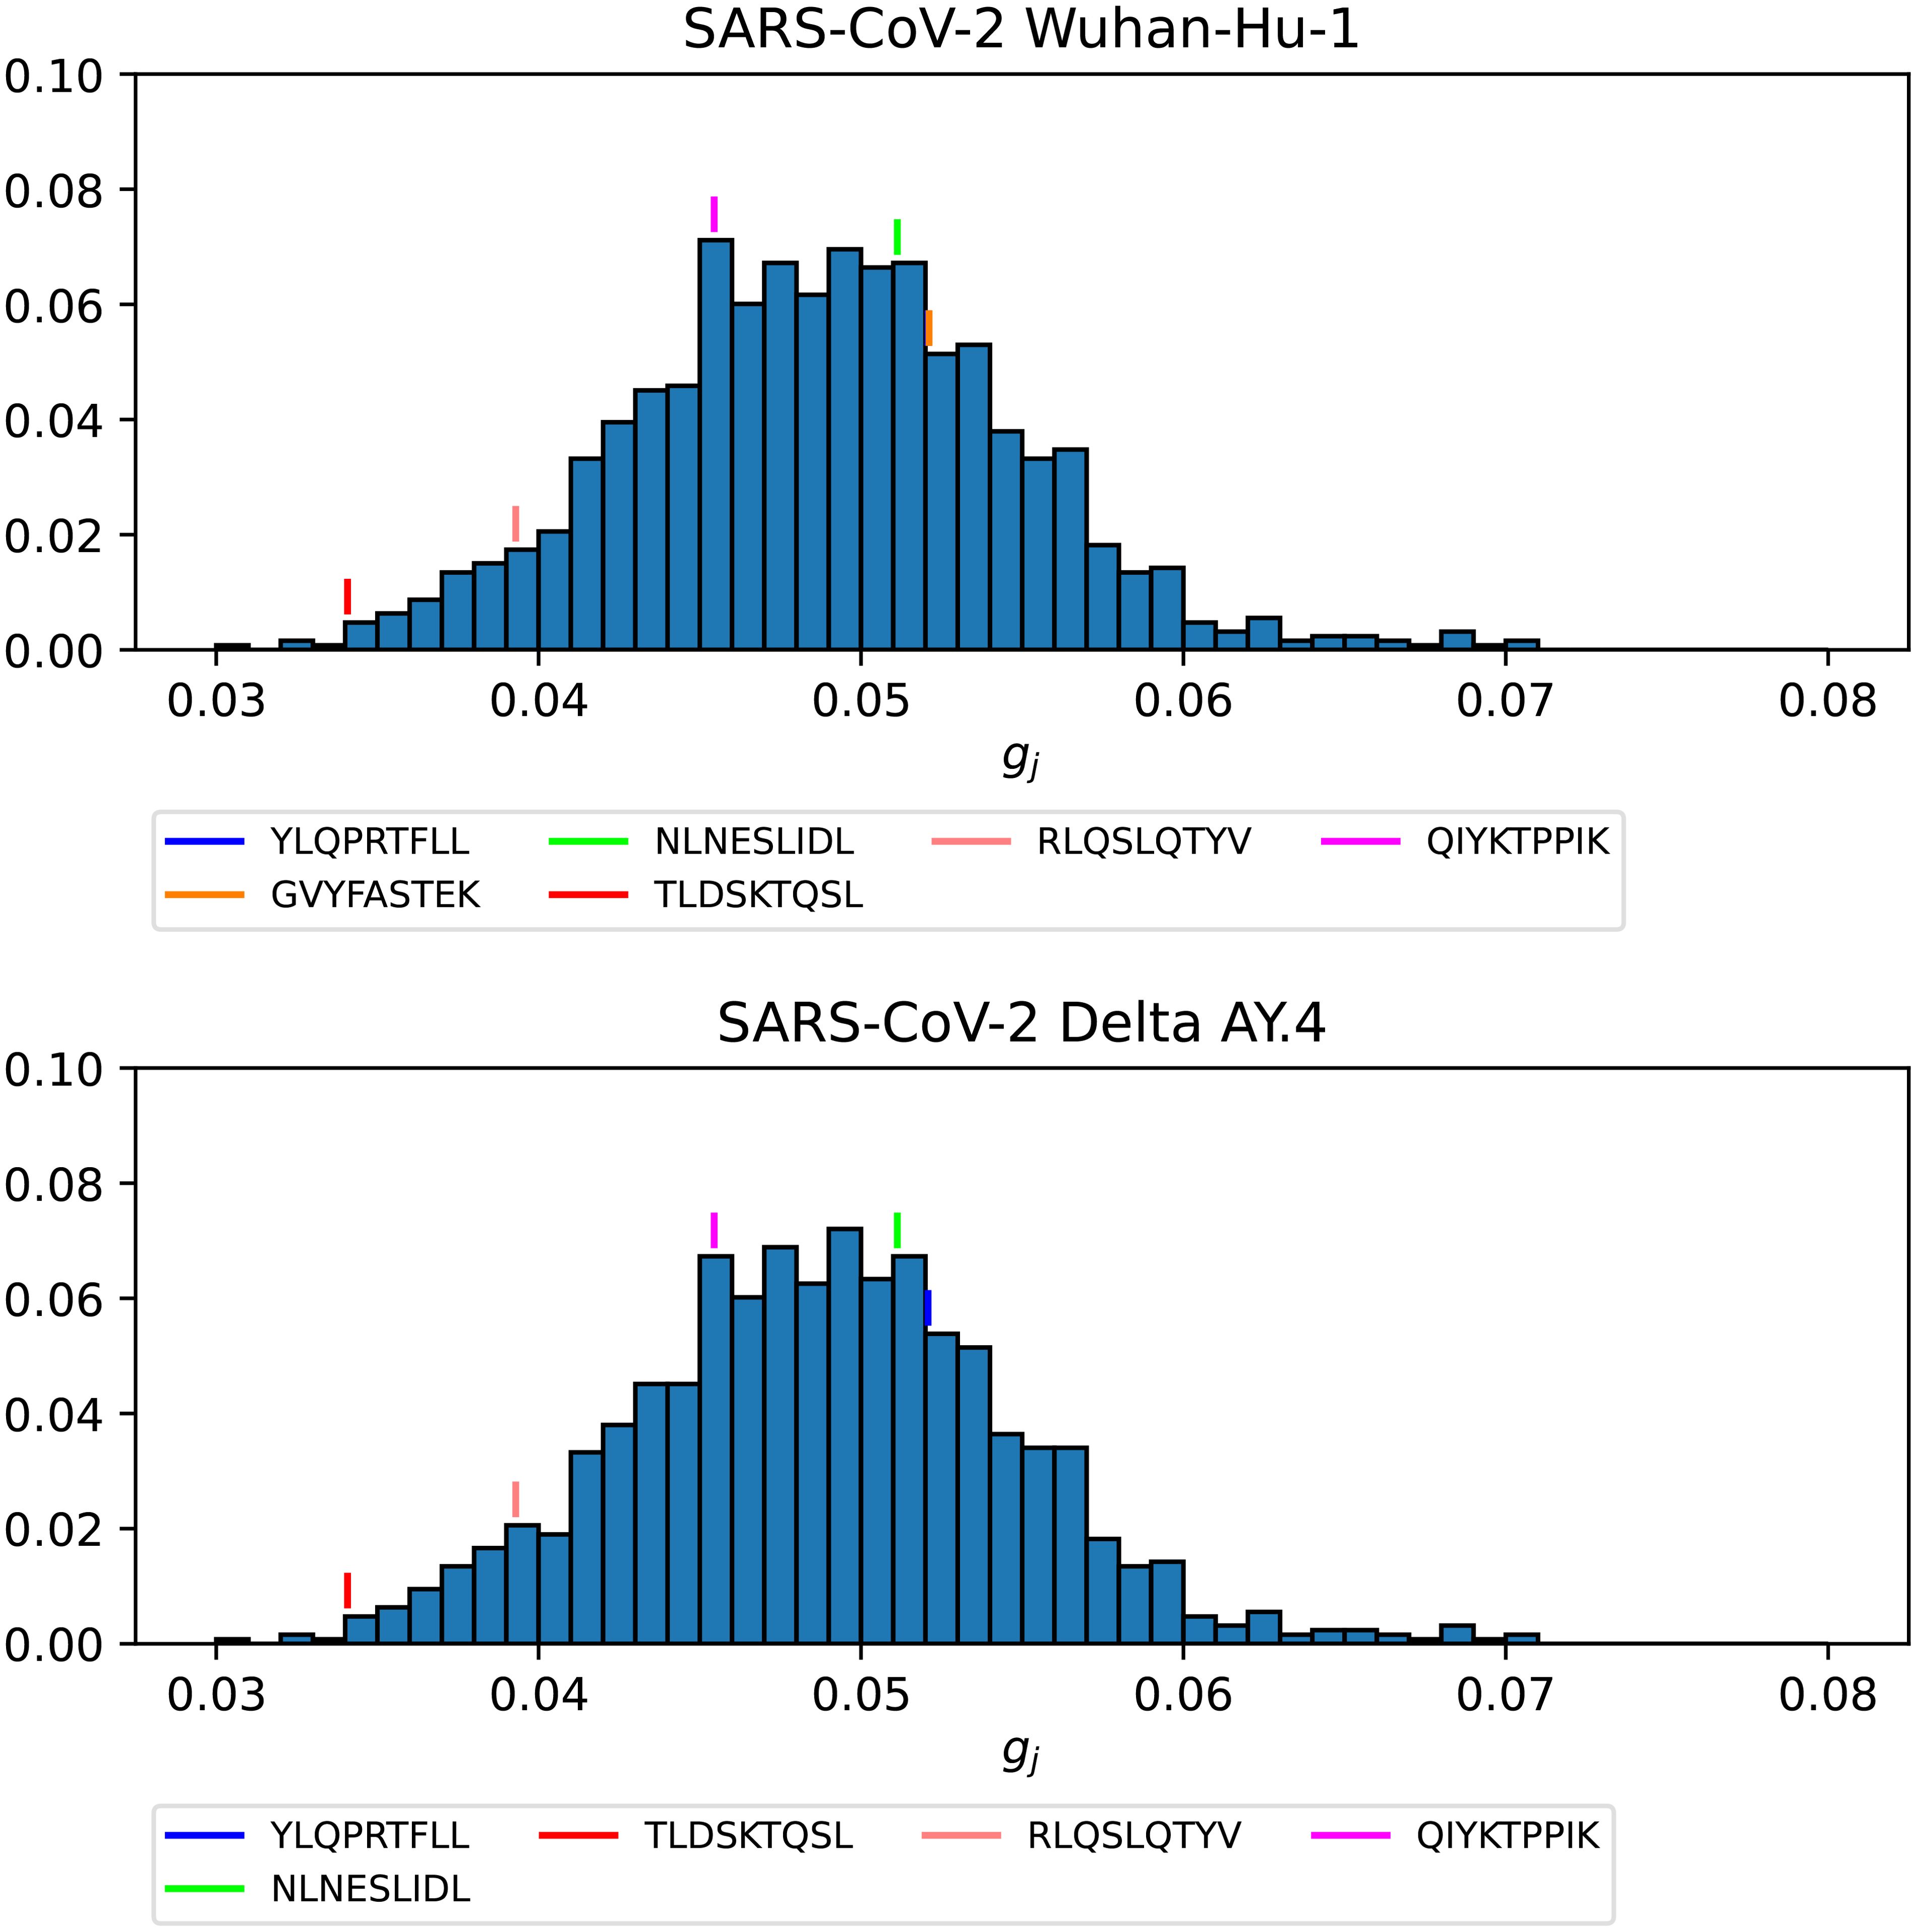
Figure 15. Probability distribution for the immunogenicity, gj, of the nonamers of SARS-CoV-2 WuhanHu-1 spike (top) and SARS-CoV-2 Delta AY.4 spike (bottom). Individual values corresponding to the immuno-dominant epitopes have been identified.
Figures 16–18 show the probability distributions of the mean TCR-MHC combined immunogenicity, ϕj, for Ebola GP Sudan, Ebola GP Zaire, and SARS-CoV-2 spike proteins, respectively, for North America, and for the three HLA class I types. We have identified individual values corresponding to the immuno-dominant epitopes. Our results indicate that the immuno-dominant epitopes have a significantly larger ϕj value, when compared to non-immuno-dominant ones. For instance, Figure 16 shows that for HLA-A nonamer RLASTVIYR belongs to the tail of the distribution, and the same is true for HLA-B nonamer TELRTFSIL (see Figure 17). In the case of immuno-dominant epitopes for SARS-CoV-2 spike protein, Figure 18 indicates that nonamer YLQPRTFLL belongs to the tail of the distribution for HLA-A, as well as HLA-B and HLA-C, and so does nonamer TLDSKTQSL for HLA-B and HLA-C. These results indicate that the immuno-dominance of the nonamers is determined not so much by their immunogenicity, as defined by Equation 4, but by their associated binding scores to HLA-class alleles (see Equation 14). Furthermore, since our results indicate that immuno-dominant epitopes belong to the tail of certain probability distributions, they provide an indirect validation of the methods proposed here to characterize vaccine coverage.
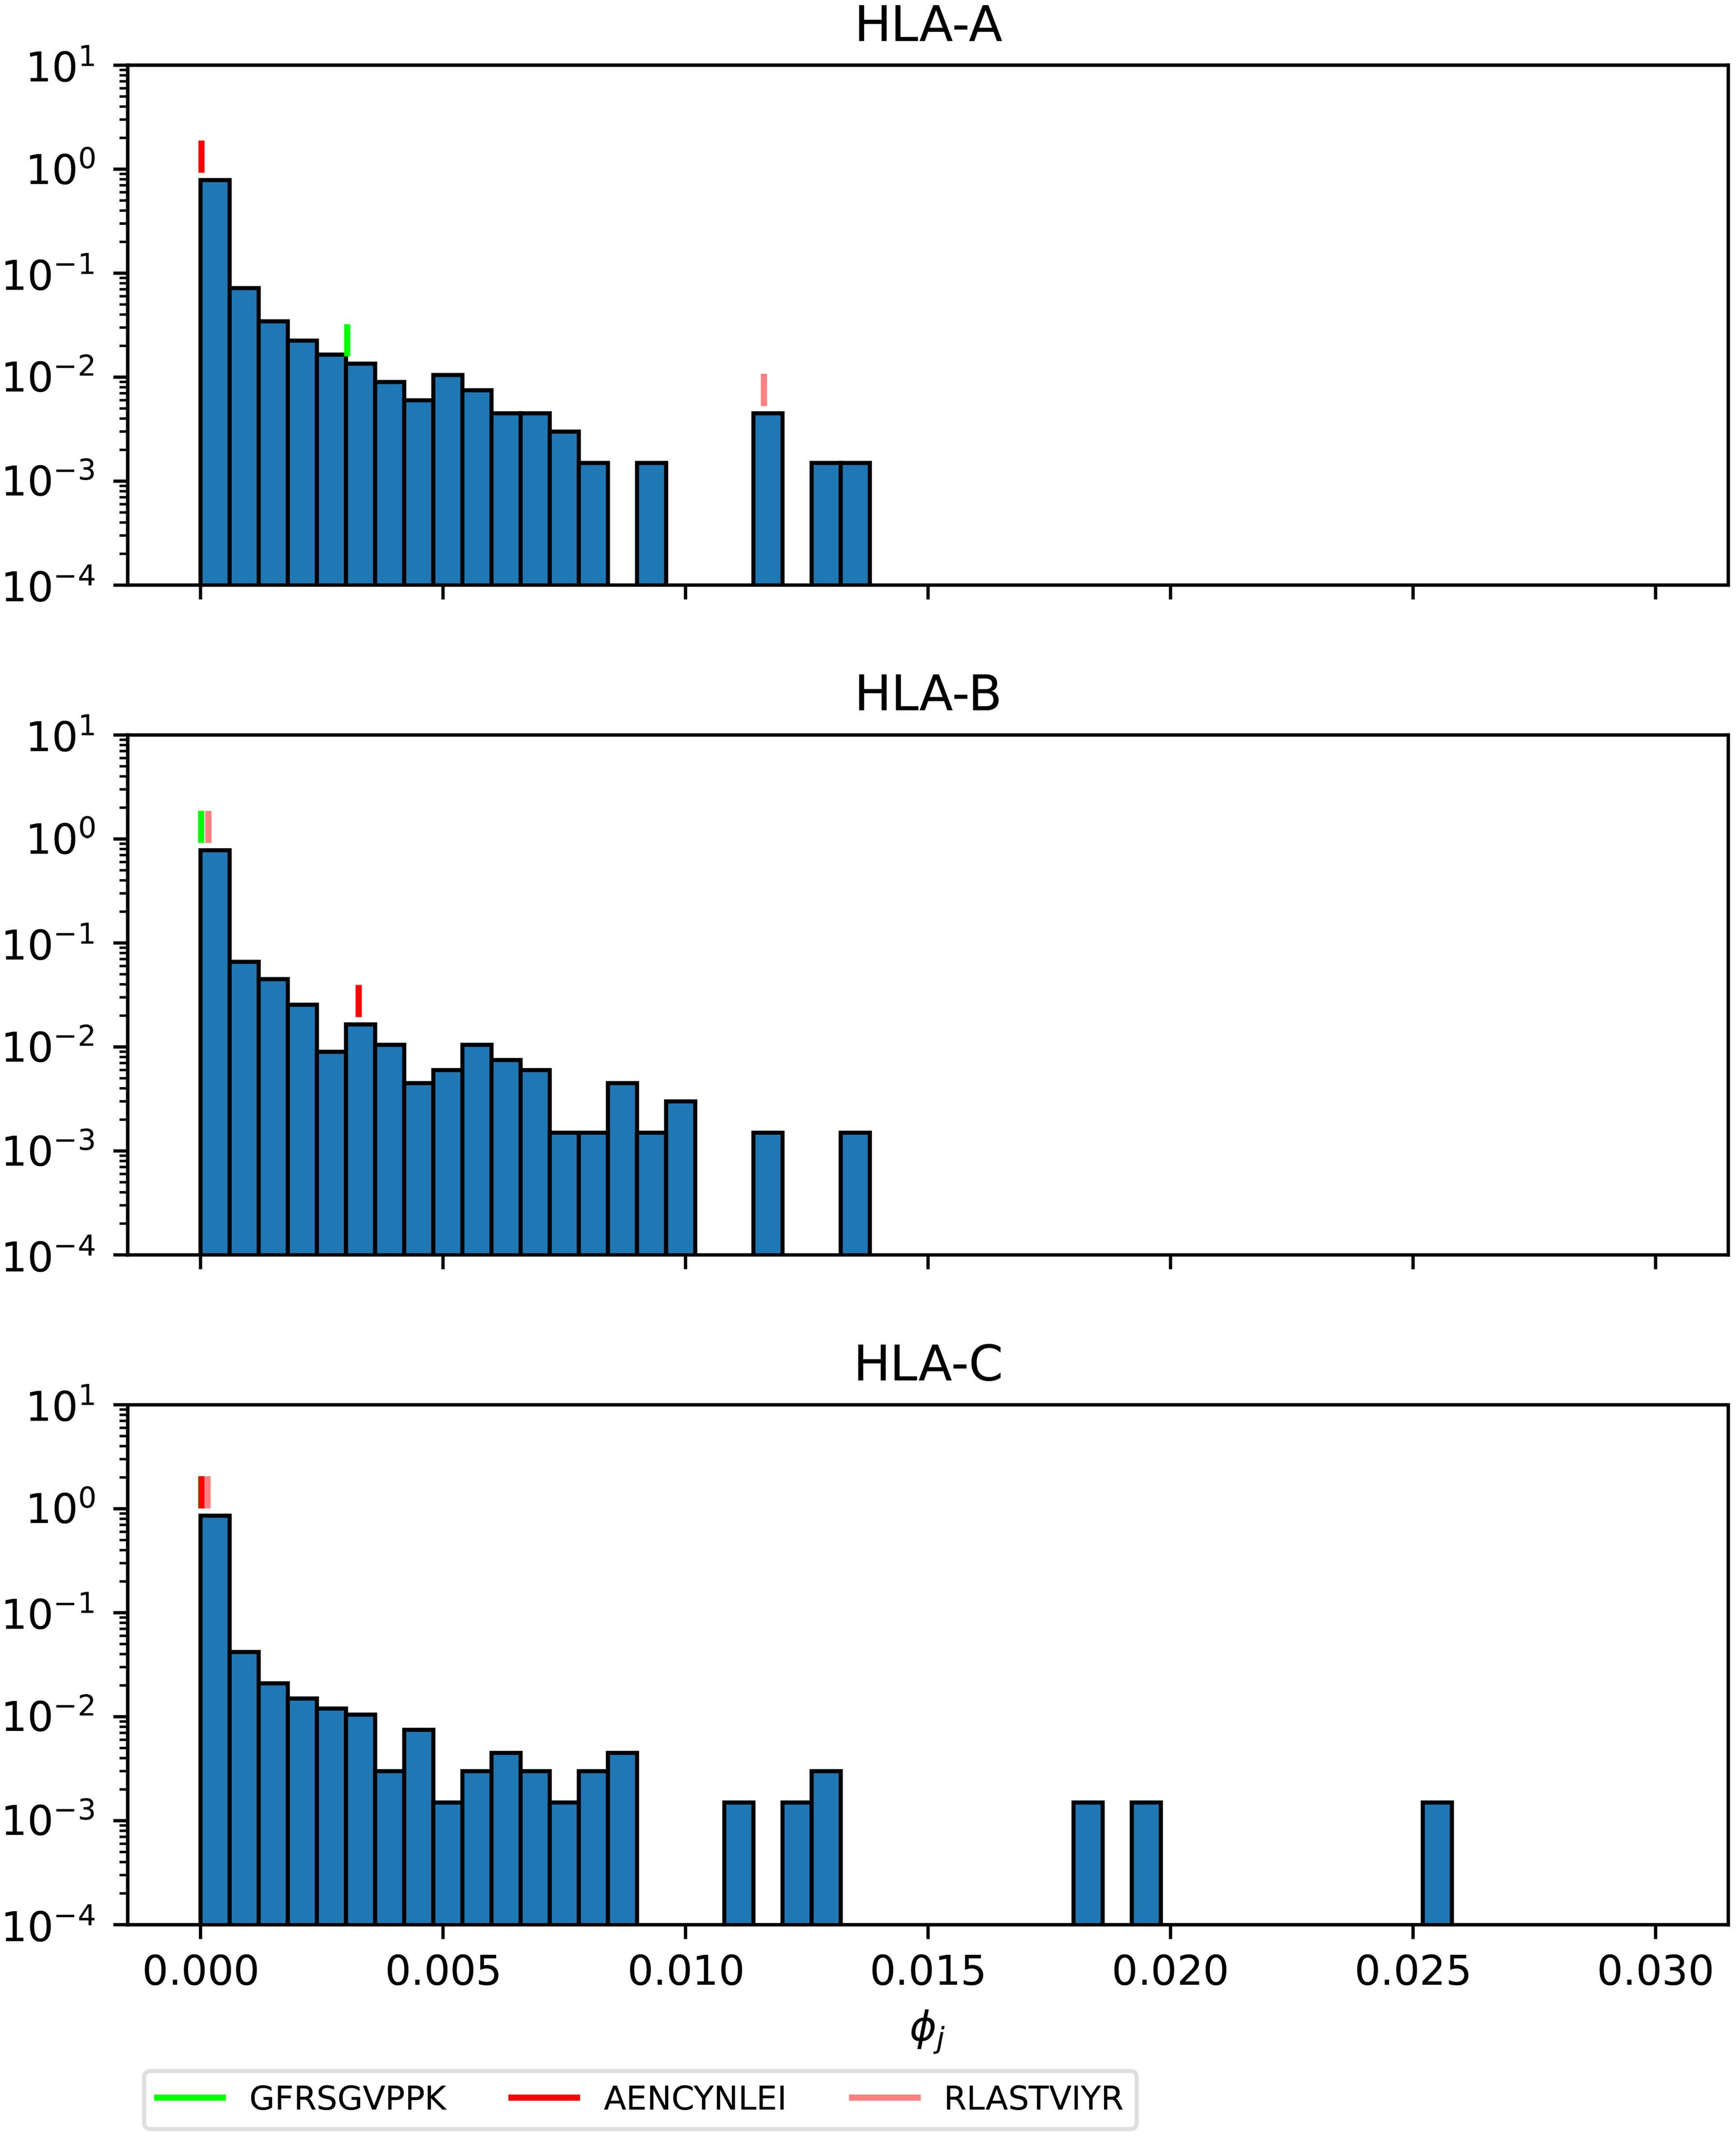
Figure 16. Mean TCR-MHC combined immunogenicity, ϕj, probability distribution in North America of the nonamers for Ebola GP Sudan, with HLA-A (top), HLA-B (middle), and HLA-C (bottom). Individual values corresponding to the immuno-dominant epitopes have been identified.
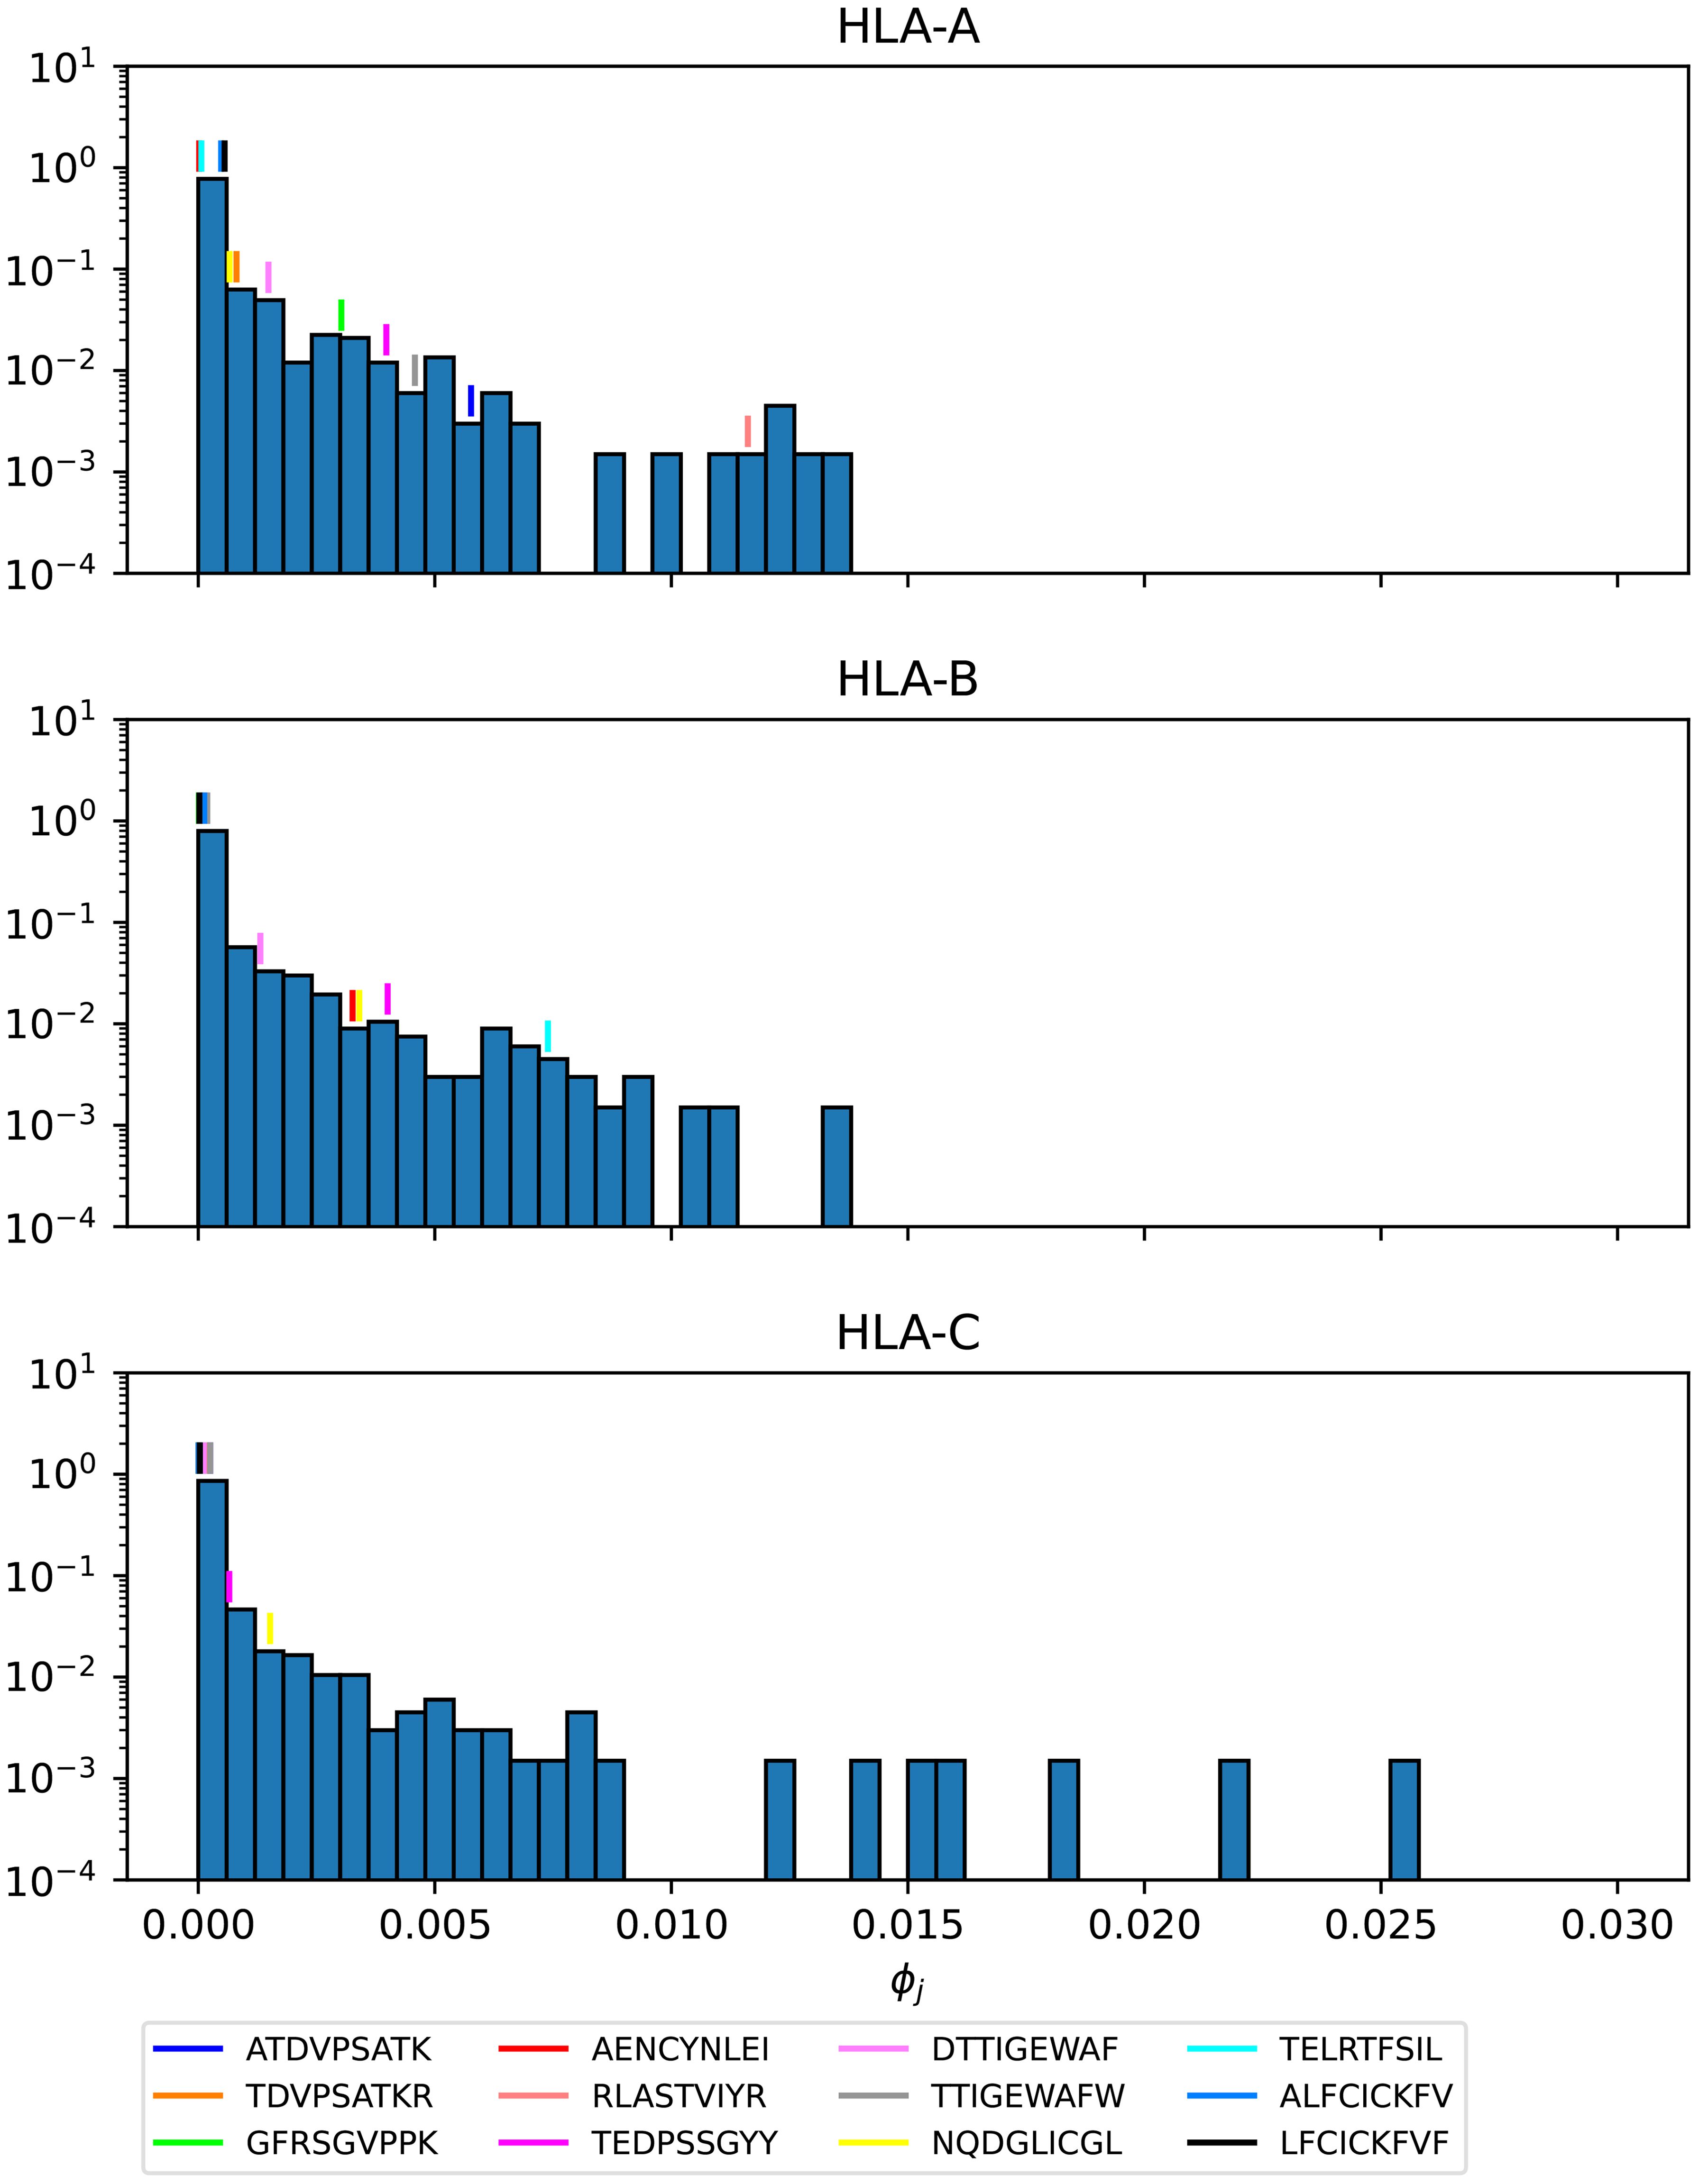
Figure 17. Mean TCR-MHC combined immunogenicity, ϕj, probability distribution in North America of the nonamers for Ebola GP Zaire, with HLA-A (top), HLA-B (middle), and HLA-C (bottom). Individual values corresponding to the immuno-dominant epitopes have been identified.
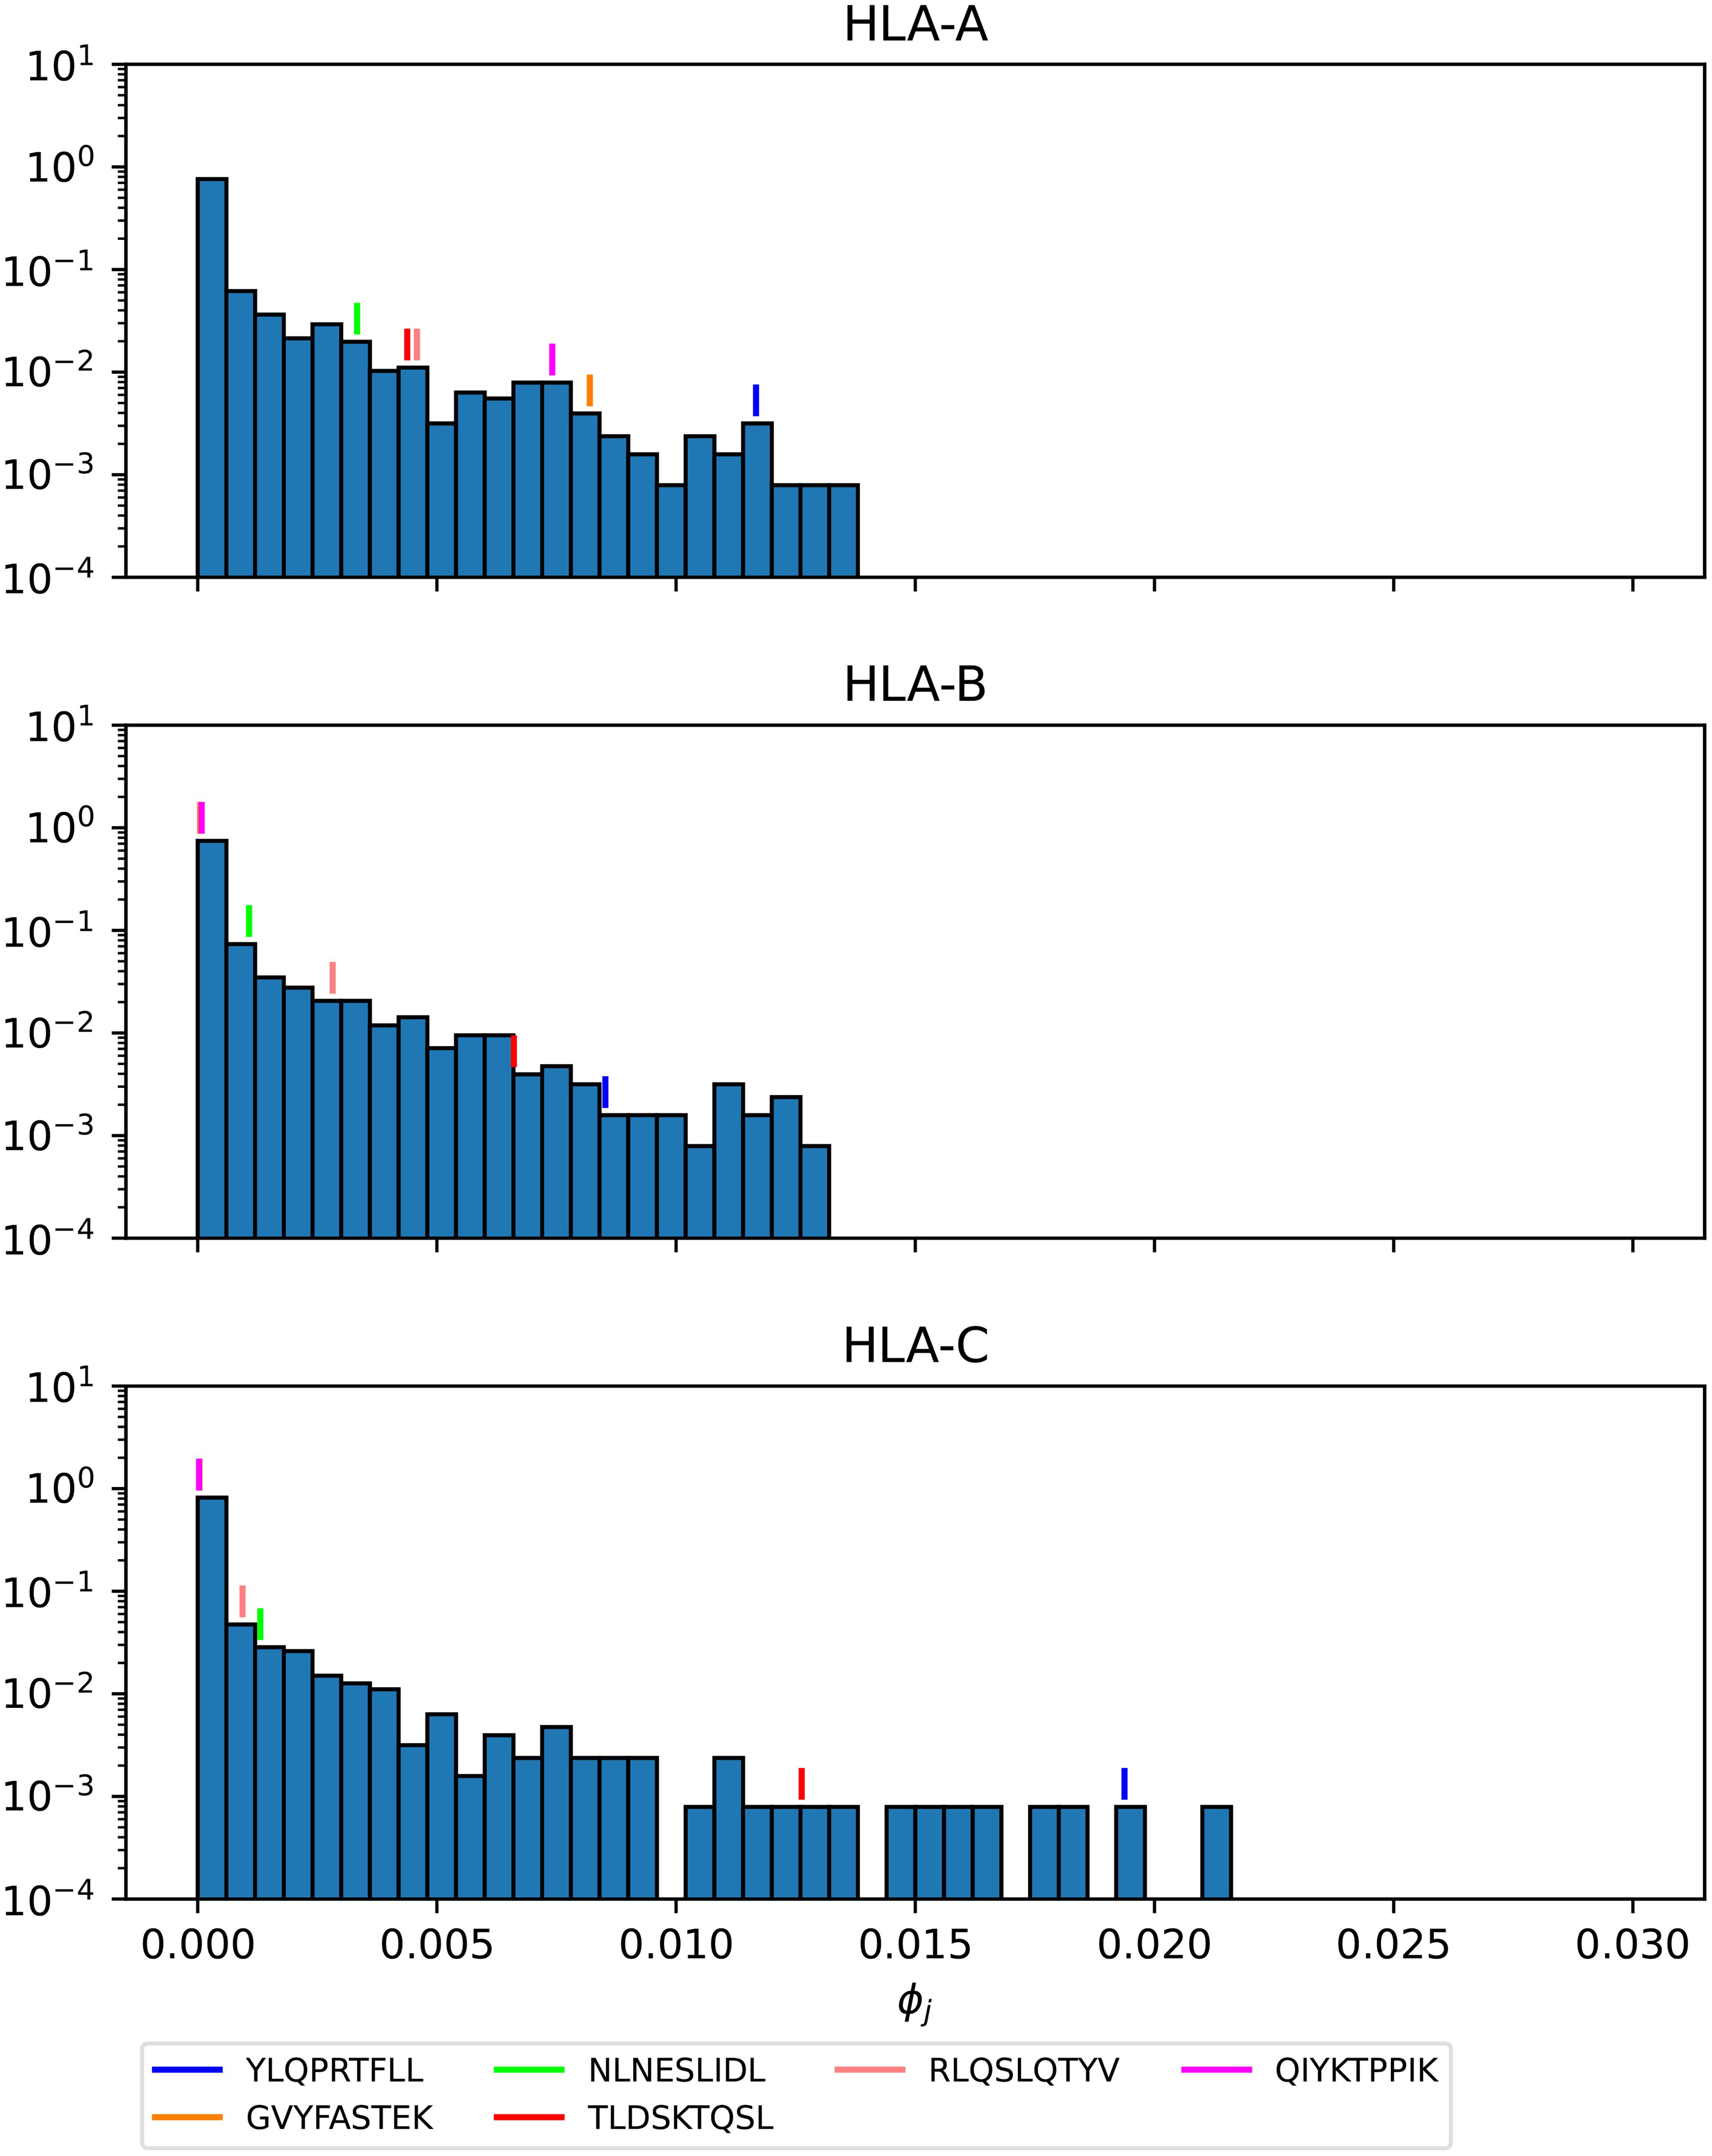
Figure 18. Mean TCR-MHC combined immunogenicity, ϕj, probability distribution in North America of the nonamers for SARS-CoV-2 Wuhan-Hu-1 spike, with HLA-A (top), HLA-B (middle), and HLA-C (bottom). Individual values corresponding to the immuno-dominant epitopes have been identified.
4 Discussion
Sterilizing immunity, provided by (pre-existing) neutralizing antibodies, has been recognized as the ideal immune response and primary goal of vaccine design to control pathogens, viruses or bacteria (49). Important human pathogens such as herpes viruses, Mycobacterium tuberculosis, malaria, and HIV pose a challenge in light of antigenic evolution and antibody immune escape, since vaccines which induce antibody responses (humoral immune responses) are ineffective against them (49, 50). CD8+ T cells, elements of the adaptive cellular arm of the immune system (1), have been shown to mediate protection during infection with these pathogens, as reviewed in Refs (49, 50). More recently, substantial evidence has emerged of the protective role of CD8+ T cell-mediated responses to conserved regions of the genome of HIV-1 (4), Lassa virus (5, 51), SARS-CoV-2 (6, 7), pandemic influenza (8), and Ebola virus (9). Yet, we still do not have a single metric to define protective T cell immune responses. This is a huge challenge given the phenotypic and multi-functional heterogeneity of T cell responses, and TCR diversity and cross-reactivity (10, 50).
In this paper, we aim to develop a novel framework to quantify the potential of CD8+ T cells to induce vaccine-mediated immune responses, and in turn, propose such a metric. The MHC-restriction of T cell receptor antigen recognition brings an additional and crucial consideration, since the HLA locus is the most polymorphic gene cluster of the entire human genome (11). Our proposed solution is based on the hypothesis that a multi-partite graph (see Figure 2) is the natural framework to consider: 1) viral genetic diversity of the pathogen as represented in the set of peptides, , so that wild type and all circulating (or predicted) variants can be analyzed, 2) HLA variability as considered with regard to geographical regions , HLA alleles , and their frequencies within each region, and 3) TCR recognition variability as accounted for by peptide immunogenicity (27).
The multi-partite graph, together with HLA class I frequencies (for HLA-A, HLA-B, and HLA-C types) in eleven different geographical regions (see section 2.1.1), binding scores of HLA class I alleles to nonamers (see section 2.1.2), and peptide immunogenicity (27) (see section 2.1.3), allow us to define a mean regional coverage metric in Equation 5 for a given vaccine protein. Figures 3 and 4 show our results for the ten different proteins considered here: Ebola virus (GP and NP, Sudan and Zaire), SARS-CoV-2 spike (five variants), and Burkholderia pseudomallei Hcp1. We then argue that the mean regional coverage metric does not capture the fact that an individual carries two alleles, and not M different ones. Thus, we propose the individual regional coverage metric in Equation 7, and the mean individual regional coverage metric in Equation 8 to account for this important difference. In the absence and presence of HLA allele associations, we show that both metrics, and , (as defined in the main text) are the same (see Supplementary Material, section 1.1 and section 1.2). This result indicates the need to further study the choice of the individual regional coverage metric, , for a given allele pair q. To that end, we propose two new choices for : in section 1.3 (see Supplementary Material), we adopt the dominance of one allele as the criterion to determine , and in section 1.4 (see Supplementary Material), we perform an equilibrium chemical reaction analysis of the binding between a peptide and a pair of alleles to argue a second choice for . As shown in the Supplementary Material, these two new and different choices for lead to a mean individual regional coverage metric which is clearly is modified by the presence of HLA allele associations. Thus, we conclude that were we to obtain true allele pair frequencies, instead of the individual allele frequencies used here, the mean individual regional coverage metric would be the true metric for CD8+ T cell immune responses. Finally, we discuss immuno-dominance and immuno-dominant epitopes (11), in light of recent studies for Ebola GP and SARS-CoV-2 spike protein (46, 47). We make use of the immuno-dominant epitopes identified in these studies (see Tables 4 and 5), together with our approaches, to calculate the contribution of the immuno-dominant epitopes to the mean regional coverage metric (see section 3.4), and to show that for suitably defined probability distributions (see section 2.3) the immuno-dominant peptides belong to the tail of such distributions. In fact, Figures 12 and 13 show that the subset of η different immuno-dominant epitopes make a significant contribution to the mean regional coverage metric, which is of the order of 5% for HLA-A and Ebola GP Zaire and SARS-CoV-2 spike across regions, as well as for HLA-B and Ebola GP Zaire, and HLA-C and SARS-CoV-2 spike. We note that for Ebola GP Zaire there are η = 12 different immuno-dominant nonamers, out of a total of P = 676; that is, the set of immuno-dominant nonamers is less than 2% of the total nonamer set. In the case of SARS-CoV-2 Wuhan-Hu-1 spike protein η = 6 and P = 1273, which implies the set of immuno-dominant nonamers is less than 0.5% of the total nonamer set. These results and the figures included in section 3.5 provide a first validation of the metrics defined here, since they capture the singular nature of the small subset of immuno-dominant epitopes.
There are a number of limitations to our study. First of all, the multi-partite graph does not include important processes such as the processing and presentation of CD8+ T cell epitopes, or the expression levels of different MHC molecules (HLA-A, HLA-B, or HLA-C). These could be considered in our methods as node weights; for instance, the level of expression of allele ai (the level of processing and presentation of peptide pj) could be included in the graph as a node weight ei (node weight πj). Secondly, and as a proxy for TCR diversity, we have made use of the concept of nonamer immunogenicity (27). We have made use of the concept of immunogenicity to provide a measure of the binding between a given epitope and the average T cell receptor (TCR). This is clearly a huge limitation, and looking forward, one could make use of cluster-based algorithms, such as GLIPH and TCRdist to characterize the TCR repertoire into distinct TCR groups based on sequence similarities. As described by Davis in Ref (16) such algorithms can help us define rules of TCR specificity, HLA types from bulk TCR sequences, and identify major T cell targets in infectious disease or vaccines. The goal is to make use of these approaches together with high-throughput TCR sequencing (TCR-seq) technology to identify TCR patterns associated with immune phenotypes, and ultimately establish T cell correlates of immune protection. Unfortunately, we still cannot directly translate sequence into TCR specificity (16). Reverse epitope discovery is a computational and empirical workflow which relates condition-associated paired αβ TCR sequences and HLA and epitope associations, and in turn allows for epitope specificity assignment of immuno-dominant public TCR clusters (52). This is clearly not the full story, and methods such as TCRdist (53), together with single cell, paired α and β TCR sequencing, are providing us with extremely valuable insights into the identification of public T cell receptors which mediate protection against SARS-CoV-2 infection (54). Furthermore, recent work by Chen et al. has shown that TCR sequences are the most important and quantitative factor determining both the phenotype and persistence of specific CD8+ T cells against immunogenic viral antigens from SARS-CoV-2, cytomegalovirus, and influenza virus (55). Thus, our future work will be along this direction to include the role of the full set , as well as the edges between elements of and . The metrics proposed here can be (easily) generalized to account for TCR diversity.
Looking forward there is a lot of work ahead of us. We will take advantage of the multi-partite graph approach to evaluate differences in vaccine platform antigen presentation. To generate effective CD8+ T cells, the cross-presentation of antigen on the MHC class I molecule is critical. Generally, cross-presentation depends on delivery to lymph nodes, uptake by dendritic cells (DCs), and the ability to get antigen into the cytosol of antigen presenting cells (APCs), primarily DCs (56). In a typical antigen presentation process, proteins in the cytosol of APCs are broken down into peptides and delivered to the endoplasmic reticulum for loading and presentation in MHC class I molecules by a transporter associated with antigen presentation (TAP). To generate cross-presentation, one must enhance both vacuolar and cytosolic pathways (56). Here, sequence and conformation of the antigens and their lifetimes could affect the cross-presentation process. Along with the chosen adjuvant, a given vaccine platform that is used for antigen presentation can influence or alter the efficiency of these processes. Therefore, we intend to use this model to better inform us on the ability of a chosen vaccine platform to favor cross-presentation.
As mentioned above, we want to explore the role of allele associations and aim to obtain allele pair frequencies to compare the two metrics proposed (57). We would like to apply our methods to other pathogens of public health relevance such as Lassa virus and Crimean Congo hemorrhagic fever virus, with the viral sequences provided in Refs (58, 59). Another avenue we have failed to explore is that of immune evasion and the role of MHC-restriction (28) in eliciting HLA-mediated selective pressure (12–14). We plan to make use of the computational methods developed by Hertz et al. (28) and the approaches adopted here to quantify the potential of a vaccine protein to exert immune pressure and drive viral evolution in different human populations, as well as to identify HLA generalists and specialists (38). Finally, the CD8+ T cell metrics proposed here do not account for T cell function (cytokine secretion, proliferative capacity, or cytotoxic killing activity) or T cell half-life (of particular relevance for central and effector memory T cells). We propose to make use of the multi-partite graph developed here, together with mathematical models of viral and immune dynamics (60–64), to identify and quantify other potential correlates of immune protection, such as half-lives of cellular subsets of interest, as well as their function and phenotype (65).
We conclude with a perspective on how the methods presented here can be used to drive vaccine development in cases of pandemics or emerging viruses. An important first step will be to validate our methods with experimental data on CD8+ T cell responses to vaccines for different human populations. To that end, we propose to make use of the methods described in Ref (50) such as elispot assays, to generate data sets and check whether or not they correlate with the metrics introduced in this manuscript. A second step is to address some of the limitations described above, such as the rather important concept of immunogenicity. Methods (diffRBM), such as those developed by Bravi et al., a sequence-based approach using transfer learning and Restricted Boltzmann Machines (RBM) to predict antigen immunogenicity and specificity (42), will be essential to characterize molecular features of immunogenicity with HLA-specific strategies. The methods and metrics proposed here can readily be used to inform epitope-based vaccine design, since they provide a systematic approach to tailor the desired immune response to individuals (66).
Data availability statement
The original contributions presented in the study are included in the article/Supplementary Material. A public GitHub repository provides links to codes and data sets to generate results presented in this article: https://github.com/DuaneHarris0813/HLA-Coverage-Metrics. Further inquiries can be directed to the corresponding author.
Author contributions
DH: Formal analysis, Methodology, Validation, Visualization, Writing – review & editing. AS: Investigation, Methodology, Validation, Writing – review & editing. MM: Methodology, Writing – review & editing. TL: Methodology, Writing – review & editing. AM: Methodology, Writing – review & editing. AL: Writing – review & editing. JK-S: Funding acquisition, Project administration, Writing – review & editing. YL: Investigation, Writing – review & editing. KW: Writing – review & editing. BM: Writing – review & editing. SG: Investigation, Writing – review & editing. RR: Investigation, Writing – review & editing. AP: Investigation, Writing – review & editing. CM-P: Conceptualization, Investigation, Methodology, Supervision, Writing – original draft, Writing – review & editing.
Funding
The author(s) declare financial support was received for the research, authorship, and/or publication of this article. This work was supported by the Defense Threat Reduction Agency under the Rapid Assessment of Platform Technologies to Expedite Response (RAPTER) program (award no. HDTRA1242031). The authors would like to thank Dr. Traci Pals for her support of this work. YL was supported by the Laboratory Directed Research and Development Program of Los Alamos National Laboratory (LANL). LANL is operated by Triad National Security, LLC, for the National Nuclear Security Administration of U.S. Department of Energy (Contract No. 89233218CNA000001). The authors declare that this study received funding from DTRA. The funder was not involved in the study design, collection, analysis, interpretation of data, the writing of this article or the decision to submit it for publication.
Acknowledgments
This manuscript has been reviewed at Los Alamos National Laboratory and assigned report number LA-UR-24-23493.
Conflict of interest
The authors declare that the research was conducted in the absence of any commercial or financial relationships that could beconstrued as a potential conflict of interest.
Publisher’s note
All claims expressed in this article are solely those of the authors and do not necessarily represent those of their affiliated organizations, or those of the publisher, the editors and the reviewers. Any product that may be evaluated in this article, or claim that may be made by its manufacturer, is not guaranteed or endorsed by the publisher.
Author disclaimer
The views expressed in this article are those of the authors and do not reflect the official policy or position of the U.S. Department of Defense or the U.S. Government.
Supplementary material
The Supplementary Material for this article can be found online at: https://www.frontiersin.org/articles/10.3389/fimmu.2024.1420284/full#supplementary-material
Footnotes
- ^ A data set is gold standard if allele frequency sums to 1, sample size is greater than 50, and it has four digit resolution. A data set is silver standard if allele frequency sums to 1, sample size is any, and it has mixed two/four or more digits [37].
- ^ The number of locations is different for each region.
- ^ We also note that the set depends on the choice of pathogen; for instance, the set for Ebola (Sudan) GP protein is different from that of Ebola (Zaire) GP. The same is true for each of the five different SARS-CoV-2 spike variants considered here.
References
1. Pollard AJ, Bijker EM. A guide to vaccinology: from basic principles to new developments. Nat Rev Immunol. (2021) 21:83–100. doi: 10.1038/s41577-020-00479-7
2. Mascola JR, Fausi AS. Novel vaccine technologies for the 21st century. Nat Rev Immunol. (2020) 20:87–8. doi: 10.1038/s41577-019-0243-3
3. Plotkin SA. Updates on immunologic correlates of vaccine-induced protection. Vaccine. (2020) 38:2250–7. doi: 10.1016/j.vaccine.2019.10.046
4. Collins DR, Gaiha GD, Walker BD. CD8+ T cells in HIV control, cure and prevention. Nat Rev Immunol. (2020) 20:471–82. doi: 10.1038/s41577-020-0274-9
5. Garry RF. Lassa fever—the road ahead. Nat Rev Microbiol. (2023) 21:87–96. doi: 10.1038/s41579-022-00789-8
6. Grifoni A, Sidney J, Vita R, Peters B, Crotty S, Weiskopf D, et al. SARS-CoV-2 human T cell epitopes: Adaptive immune response against COVID-19. Cell Host Microbe. (2021) 29:1076–92. doi: 10.1016/j.chom.2021.05.010
7. Neto TAP, Sidney J, Grifoni A, Sette A. Correlative CD4 and CD8 T-cell immunodominance in humans and mice: Implications for preclinical testin. Cell Mol Immunol. (2023) 20:1328–38. doi: 10.1038/s41423-023-01083-0
8. Sridhar S, Begom S, Bermingham A, Hoschler K, Adamson W, Carman W, et al. Cellular immune correlates of protection against symptomatic pandemic influenza. Nat Med. (2013) 19:1305–12. doi: 10.1038/nm.3350
9. Speranza E, Ruibal P, Port JR, Feng F, Burkhardt L, Grundhoff A, et al. T-cell receptor diversity and the control of T-cell homeostasis mark Ebola virus disease survival in humans. J Infect Dis. (2018) 218:S508–18. doi: 10.1093/infdis/jiy352
10. Gaevert JA, Duque DL, Lythe G, Molina-París C, Thomas PG. Quantifying T cell cross-reactivity: Influenza and coronaviruses. Viruses. (2021) 13:1786. doi: 10.3390/v13091786
11. Kedzierska K, Koutsakos M. The ABC of major histocompatibility complexes and T cell receptors in health and disease. Viral Immunol. (2020) 33:160–78. doi: 10.1089/vim.2019.0184
12. Dendrou CA, Petersen J, Rossjohn J, Fugger L. HLA variation and disease. Nat Rev Immunol. (2018) 18:325–39. doi: 10.1038/nri.2017.143
13. Meyer D, Aguiar VRC, Bitarello BárbaraD, Brandt DéboraYC, Nunes K. A genomic perspective on HLA evolution. Immunogenetics. (2018) 70:5–27. doi: 10.1007/s00251-017-1017-3
14. Brumme ZL, Brumme CJ, Heckerman D, Korber BT, Daniels M, Carlson J, et al. Evidence of differential HLA class I-mediated viral evolution in functional and accessory/regulatory genes of HIV-1. PloS Pathog. (2007) 3:e94. doi: 10.1371/journal.ppat.0030094
15. Halle S, Halle O, Förster R. Mechanisms and dynamics of T cell-mediated cytotoxicity in vivo. Trends Immunol. (2017) 38:432–43. doi: 10.1016/j.it.2017.04.002
16. Gondré-Lewis TA, Jiang C, Ford ML, Koelle DM, Sette A, Shalek AK, et al. Niaid workshop on T cell technologie. Nat Immunol. (2023) 24:14–8. doi: 10.1038/s41590-022-01377-x
17. Schwarz M, Mzoughi S, Lozano-Ojalvo D, Tan AT, Bertoletti A, Guccione E. T cell immunity is key to the pandemic endgame: How to measure and monitor it. Curr Res Immunol. (2022) 3:215–21. doi: 10.1016/j.crimmu.2022.08.004
18. Mosmann TR, McMichael AJ, LeVert A, McCauley JW, Almond JW. Opportunities and challenges for T cell-based influenza vaccines. Nat Rev Immunol. (2024), 1–17. doi: 10.1038/s41577-024-01030-8
19. Wong P, Pamer EG. CD8 T cell responses to infectious pathogens. Annu Rev Immunol. (2003) 21:29–70. doi: 10.1146/annurev.immunol.21.120601.141114
20. Flaxman A, Ewer KJ. Methods for measuring T-cell memory to vaccination: From mouse to man. Vaccines. (2018) 6:43. doi: 10.3390/vaccines6030043
21. Poloni C, Schonhofer C, Ivison S, Levings MK, Steiner TS, Cook L. T-cell activation–induced marker assays in health and disease. Immunol Cell Biol. (2023) 101:491–503. doi: 10.1111/imcb.v101.6
22. Harty JT, Badovinac VP. Shaping and reshaping CD8+ T-cell memory. Nat Rev Immunol. (2008) 8:107–19. doi: 10.1038/nri2251
23. Koh C-H, Lee S, Kwak M, Kim B-S, Chung Y. CD8 T-cell subsets: heterogeneity, functions, and therapeutic potential. Exp Mol Med. (2023) 55:2287–99. doi: 10.1038/s12276-023-01105-x
24. Elemans M, Basatena N-KSal, Asquith B. The efficiency of the human CD8+ T cell response: how should we quantify it, what determines it, and does it matter? PloS Comput Biol. (2012) 8:e1002381. doi: 10.1371/journal.pcbi.1002381
25. Bevan MJ. Helping the CD8+ T-cell response. Nat Rev Immunol. (2004) 4:595–602. doi: 10.1038/nri1413
26. Available online at: https://www.allelefrequencies.net/pop6001a.asp. (Accessed April 2024)
27. Calis JJA, Maybeno M, Greenbaum JA, Weiskopf D, De Silva AD, Sette A, et al. Properties of MHC class I presented peptides that enhance immunogenicity. PloS Comput Biol. (2013) 9:e1003266. doi: 10.1371/journal.pcbi.1003266
28. Hertz T, Cohen-Lavi L, Sachren S, Koren E, Burkovitz A. Computational fingerprinting of immune-mediated pressure on SARS-CoV-2 viral evolution reveals preliminary evidence for immune-evasion. J Immunol. (2022) 208:125–09. doi: 10.4049/jimmunol.208.Supp.125.09
29. Oyarzun P, Kashyap M, Fica V, Salas-Burgos A, Gonzalez-Galarza FF, McCabe A, et al. A proteome-wide immunoinformatics tool to accelerate T-cell epitope discovery and vaccine design in the context of emerging infectious diseases: an ethnicity-oriented approach. Front Immunol. (2021) 12:598778. doi: 10.3389/fimmu.2021.598778
30. Theiler J, Korber B. Graph-based optimization of epitope coverage for vaccine antigen design. Stat Med. (2018) 37:181–94. doi: 10.1002/sim.v37.2
31. Toussaint NC, Dönnes P, Kohlbacher O. A mathematical framework for the selection of an optimal set of peptides for epitope-based vaccines. PloS Comput Biol. (2008) 4:e1000246. doi: 10.1371/journal.pcbi.1000246
32. Toussaint NC, Kohlbacher O. OptiTope—a web server for the selection of an optimal set of peptides for epitope-based vaccines. Nucleic Acids Res. (2009) 37:W617–22. doi: 10.1093/nar/gkp293
33. Reche PA, Reinherz EL. PEPVAC: a web server for multi-epitope vaccine development based on the prediction of supertypic mhc ligands. Nucleic Acids Res. (2005) 33:W138–42. doi: 10.1093/nar/gki357
34. Gonzalez-Galarza FF, McCabe A, Melo dos Santos EJ, Jones J, Takeshita L, Ortega-Rivera ND, et al. Allele frequency net database (AFND) 2020 update: gold-standard data classification, open access genotype data and new query tools. Nucleic Acids Res. (2020) 48:D783–8. doi: 10.1093/nar/gkz1029
35. Middleton D, Menchaca L, Rood H, Komerofsky R. New allele frequency database: http://www.allelefrequencies.net. Tissue Antigens. (2003) 61:403–7. doi: 10.1034/j.1399-0039.2003.00062.x
36. Hurley CK. Naming HLA diversity: a review of HLA nomenclature. Hum Immunol. (2021) 82:457–65. doi: 10.1016/j.humimm.2020.03.005
37. Available online at: https://hla.alleles.org/nomenclature/naming.html. (Accessed April 2024)
38. Kaufman J. Generalists and specialists: a new view of how MHC class I molecules fight infectious pathogens. Trends Immunol. (2018) 39:367–79. doi: 10.1016/j.it.2018.01.001
39. Available online at: http://www.allelefrequencies.net/gold.aspx. (Accessed April 2024)
40. Vita R, Mahajan S, Overton JA, Dhanda SK, Martini S, Cantrell JR, et al. The immune epitope database (IEDB): 2018 update. Nucleic Acids Res. (2019) 47:D339–43. doi: 10.1093/nar/gky1006
41. Reynisson B, Alvarez B, Paul S, Peters B, Nielsen M. NetMHCpan4.1 and NetMHCIIpan-4.0: improved predictions of MHC antigen presentation by concurrent motif deconvolution and integration of MS MHC eluted ligand data. Nucleic Acids Res. (2020) 48:W449–W454. doi: 10.1093/nar/gkaa379
42. Bravi B, Gioacchino ADi, Fernandez-de Cossio-Diaz J, Walczak AM, Mora T, Cocco S, et al. A transfer-learning approach to predict antigen immunogenicity and T-cell receptor specificity. ELife. (2023) 12:e85126. doi: 10.7554/eLife.85126
43. Qi Q, Liu Yi, Cheng Y, Glanville J, Zhang D, Lee J-Y, et al. Diversity and clonal selection in the human T-cell repertoire. Proc Natl Acad Sci. (2014) 111:13139–44. doi: 10.1073/pnas.1409155111
44. Lythe G, Callard RE, Hoare RL, Molina-París C. How many TCR clonotypes does a body maintain? J Theor Biol. (2016) 389:214–24. doi: 10.1016/j.jtbi.2015.10.016
45. Weng N-p. Numbers and odds: TCR repertoire size and its age changes impacting on T cell functions. Semin Immunol. (2023) 69:101810. doi: 10.1016/j.smim.2023.101810
46. Meyer S, Blaas I, Bollineni RC, Delic-Sarac M, Tran TT, Knetter C, et al. Prevalent and immunodominant CD8 T cell epitopes are conserved in SARS-CoV-2 variants. Cell Rep. (2023) 42:111995. doi: 10.1016/j.celrep.2023.111995
47. Powlson J, Wright D, Zeltina A, Giza M, Nielsen M, Rampling T, et al. Characterization of antigenic MHC-Class-I-Restricted T cell epitopes in the glycoprotein of Ebolavirus. Cell Rep. (2019) 29:2537–2545.e3. doi: 10.1016/j.celrep.2019.10.105
48. Tarke A, Coelho CH, Zhang Z, Dan JM, Yu ED, Methot N, et al. SARS-CoV-2 vaccination induces immunological T cell memory able to cross-recognize variants from Alpha to Omicron. Cell. (2022) 185:847–59. doi: 10.1016/j.cell.2022.01.015
49. Tscharke DC, Croft NP, Doherty PC, La Gruta NL. Sizing up the key determinants of the CD8+ T cell response. Nat Rev Immunol. (2015) 15:705–16. doi: 10.1038/nri3905
50. Seder RA, Darrah PA, Roederer M. T-cell quality in memory and protection: implications for vaccine design. Nat Rev Immunol. (2008) 8:247–58. doi: 10.1038/nri2274
51. Prescott JB, Marzi A, Safronetz D, Robertson SJ, Feldmann H, Best SM. Immunobiology of Ebola and Lassa virus infections. Nat Rev Immunol. (2017) 17:195–207. doi: 10.1038/nri.2016.138
52. Pogorelyy MV, Rosati E, Minervina AA, Mettelman RC, Scheffold A, Franke A, et al. Resolving sars-cov-2 cd4+ T cell specificity via reverse epitope discovery. Cell Rep Med. (2022) 3. doi: 10.1016/j.xcrm.2022.100697
53. Mayer-Blackwell K, Fiore-Gartland A, Thomas PG. Flexible distance-based TCR analysis in python with tcrdist3. In: T-cell Repertoire Characterization. Springer (2022). p. 309–66.
54. Mayer-Blackwell K, Schattgen S, Cohen-Lavi L, Crawford JC, Souquette A, Gaevert JA, et al. TCR meta-clonotypes for biomarker discovery with tcrdist3 enabled identification of public, HLA-restricted clusters of SARS-CoV-2 TCRs. Elife. (2021) 10:e68605. doi: 10.7554/eLife.68605
55. Chen DG, Xie J, Su Y, Heath JR. T cell receptor sequences are the dominant factor contributing to the phenotype of CD8+ T cells with specificities against immunogenic viral antigens. Cell Rep. (2023) 42. doi: 10.1016/j.celrep.2023.113279
56. Baljon JJ, Wilson JT. Bioinspired vaccines to enhance MHC class-i antigen crosspresentation. Curr Opin Immunol. (2022) 77:102215. doi: 10.1016/j.coi.2022.102215
57. Gragert L, Madbouly A, Freeman J, Maiers M. Six-locus high resolution HLA haplotype frequencies derived from mixed-resolution dna typing for the entire us donor registry. Hum Immunol. (2013) 74:1313–20. doi: 10.1016/j.humimm.2013.06.025
58. Andersen KG, Shapiro BJ, Matranga CB, Sealfon R, Lin AE, Moses LM, et al. Clinical sequencing uncovers origins and evolution of lassa virus. Cell. (2015) 162:738–50. doi: 10.1016/j.cell.2015.07.020
59. D’Addiego J, Wand N, Afrough B, Fletcher T, Kurosaki Y, Leblebicioglu H, et al. Recovery of complete genome sequences of crimean-congo haemorrhagic fever virus (cchfv) directly from clinical samples: A comparative study between targeted enrichment and metagenomic approaches. J Virological Methods. (2024) 323:114833. doi: 10.1016/j.jviromet.2023.114833
60. Best K, Barouch DH, Guedj J, Ribeiro RM, Perelson AS. Zika virus dynamics: Effects of inoculum dose, the innate immune response and viral interference. PloS Comput Biol. (2021) 17:e1008564. doi: 10.1371/journal.pcbi.1008564
61. Perelson AS, Ke R. Mechanistic modeling of SARS-CoV-2 and other infectious diseases and the effects of therapeutics. Clin Pharmacol Ther. (2021) 109:829–40. doi: 10.1002/cpt.v109.4
62. Waites W, Cavaliere M, Danos V, Datta R, Eggo RM, Hallett TB, et al. Compositional modelling of immune response and virus transmission dynamics. Philos Trans R Soc A. (2022) 380:20210307. doi: 10.1098/rsta.2021.0307
63. Zarnitsyna VI, Akondy RS, Ahmed H, McGuire DJ, Zarnitsyn VG, Moore M, et al. Dynamics and turnover of memory CD8 T cell responses following yellow fever vaccination. PloS Comput Biol. (2021) 17:e1009468. doi: 10.1371/journal.pcbi.1009468
64. Gosling JP, Krishnan SM, Lythe G, Chain B, Mackay C, Molina-París C. A mathematical study of CD8+ T cell responses calibrated with human data. arXiv preprint arXiv:1802.05094. (2018). doi: 10.48550/arXiv.1802.05094
65. Graw F, Regoes RR. Predicting the impact of CD8+ T cell polyfunctionality on hiv disease progression. J Virol. (2014) 88:10134–45. doi: 10.1128/JVI.00647-14
Keywords: HLA class I, vaccine, epitope, CD8 + T cell, immune response, correlate of protection, immuno-dominant, coverage metric
Citation: Harris DC, Shanker A, Montoya MM, Llewellyn TR, Matuszak AR, Lohar A, Kubicek-Sutherland JZ, Li YW, Wilding K, Mcmahon B, Gnanakaran S, Ribeiro RM, Perelson AS and Molina-París C (2024) Quantification of heterogeneity in human CD8+ T cell responses to vaccine antigens: an HLA-guided perspective. Front. Immunol. 15:1420284. doi: 10.3389/fimmu.2024.1420284
Received: 19 April 2024; Accepted: 16 September 2024;
Published: 18 November 2024.
Edited by:
Miguel Fribourg, Icahn School of Medicine at Mount Sinai, United StatesReviewed by:
Filippo Castiglione, Technology Innovation Institute (TII), United Arab EmiratesNishant Kumar Singh, Ragon Institute, United States
Copyright © 2024 Harris, Shanker, Montoya, Llewellyn, Matuszak, Lohar, Kubicek-Sutherland, Li, Wilding, Mcmahon, Gnanakaran, Ribeiro, Perelson and Molina-París. This is an open-access article distributed under the terms of the Creative Commons Attribution License (CC BY). The use, distribution or reproduction in other forums is permitted, provided the original author(s) and the copyright owner(s) are credited and that the original publication in this journal is cited, in accordance with accepted academic practice. No use, distribution or reproduction is permitted which does not comply with these terms.
*Correspondence: Carmen Molina-París, bW9saW5hLXBhcmlzQGxhbmwuZ292
 Duane C. Harris
 Apoorv Shanker
 Makaela M. Montoya
 Trent R. Llewellyn2
 Anna R. Matuszak
 Jessica Z. Kubicek-Sutherland
 Ben Mcmahon
 Ruy M. Ribeiro
 Alan S. Perelson
 Carmen Molina-París