- 1Department of Food Science and Technology, Jomo Kenyatta University of Agriculture and Technology, Nairobi, Kenya
- 2Kenya Agricultural and Livestock Research Organization (KALRO)-Dairy Research Institute (DRI), Naivasha, Kenya
- 3University of Rouen, Normandy, The COBRA Laboratory (Bioorganic Organic Chemistry: Reactivity and Analysis) Mont-Saint-Aignan, Normandie, France
Cactus pear fruits are rich sources of nutritional (essential vitamins, amino acids and minerals) and antioxidant compounds (flavonoids, carotenes, betalains, ascorbic acid and quercetin). The fruit is cultivated for fresh markets and also serves as nutraceutical and functional food, finding application in various forms such as juice, jam, wine, syrup and in dairy products. However, short postharvest life and negative perception has contributed to its underutilization in the local context. Total titratable acidity (TTA) and total soluble solids (TSS) are among the desirable attributes used to assess postharvest quality of Cactus pears. A portable near-infrared spectrometer (NIRS) can non-destructively determine the internal quality of Cactus pears’ thus reducing postharvest losses. This study evaluated the potential of a handheld NIRS coupled with chemometrics of partial least square regression (PLSR) for rapid, non-destructive, and simultaneous determination of TTA and TSS in intact Cactus pear fruits. Cactus pears at different stages of maturity were sampled from Laikipia county, in Kenya, and immediately subjected to spectral data acquisition and wet-chemistry analyses. The PLSR was used to train and validate predictive models for the determination of TTA and TSS content in intact Cactus pears. The prediction model for TTA gave an R-squared (R2) of 0.73, root mean squared error of prediction (RMSEP) of 0.28% citric acid, and residual predictive deviation (RPD) of 1.97. Additionally, the TSS model resulted in R2 of 0.75, RMSEP of 1.60° Brix, and RPD of 2.06. Overall, these findings highlight the effectiveness of NIRS in non-destructive measurement of TTA and TSS levels in whole Cactus pears. However, with further refinement and optimization of these models, the full potential of this technique for swift and precise assessment of these parameters in whole Cactus pears can be realized. This would greatly benefit farmers and processors by reducing expenses associated with quality assessment and facilitating market entry of Cactus pear derived food products.
1 Introduction
The cactus pear (Opuntia ficus-indica L.) plant, belongs to the Cactaceae family, and is known for its succulent and spiny cladodes and its adaptability to arid and semi-arid regions (Al-Naqeb et al., 2021; Ramírez-Rodríguez et al., 2020; Sipango et al., 2022). The fruit is found across several regions including Asia, Europe, Australia, Africa, the Middle East, North America, and South America (Feugang et al., 2006). In Mexico, cactus pear constitutes one of the most valuable natural resources, being a source of delicious and nutrient-rich fruits and vegetables for human consumption (Vigueras and Portillo, 2018). The berry-like fruit is characterized a fleshy pulp and a thick skin, with an average fruit weight of 100-200 g and varying considerably in terms of color (purple to orange), size, and flavor (Yahia and Sáenz, 2011). The cactus pear fruit is a source of nutritionally important vitamins (vitamin C, E, K, and beta-carotenes), carbohydrates and proteins, although it has low caloric content compared to other fruits (Ramírez-Rodríguez et al., 2020). The fruit is a also a rich source of antioxidants (carotenes, flavonoids, betalains, ascorbic acid and quercetin) essential amino acids (arginine, tyrosine, and glutamic acid) and minerals (magnesium, calcium, and potassium) and fiber in the form of pectin (Van Uytvanck et al., 2014; Cota-Sánchez, 2015; Feugang et al., 2006; El-Mostafa et al., 2014; Hailu, 2020; Guevara-Figueroa et al., 2010; Mutwa et al., 2015; Daniloski et al., 2022). The fruit pulp is also characterized by a high level of reducing sugars (12 to 17%), low level of titratable acidity (Cota-Sánchez, 2015), pigments (Felker et al., 2008; Butera et al., 2002), and mucilage (Sepúlveda et al., 2007). However, the fruit is very perishable with a life span of about two weeks depending on the ecotype (Cota-Sánchez, 2015; Amaya-Cruz et al., 2019). The Cactus pear fruit is consumed fresh and also exported to the European markets (Ramírez-Rodríguez et al., 2020). Multiple uses of Cactus pear fruits have resulted in the domestication of the plant in Mexico (Vigueras and Portillo, 2018). The Cactus pear fruit is cultivated for the fresh market but also serves as nutraceuticals and functional food, with applications in various forms such as juices, syrup, dairy products ingredients and as jam. However, short postharvest life and negative perception especially due to the presence of spines has contributed to the underutilization in the local context.
In Kenya and other African countries, despite their nutritional potential, Cactus pear fruit remains underutilized (Aregahegn et al., 2013). Local communities often perceive the Cactus pear plant as a problematic weed due to its aggressive invasion of agricultural lands, posing threats to both the land, domestic animals, and native vegetation (Bakewell-stone, 2023; Van Uytvanck et al., 2014). This perception has led to efforts to eradicate the plant from farms, contributing to the fruit’s underutilization. Limited knowledge of the fruit’s nutritional potential, coupled with the lack of processing facilities, further diminishes the potential utilization of the Cactus pear fruits (Sipango et al., 2022; Hailu, 2020). However, efforts have been made to promote their utilization through research and publication of articles highlighting their nutritional, nutraceutical, and functional properties. Consequently, Cactus pear fruits have been partially incorporated into African cuisine and processed into various products such as juices, jams, concentrates, marmalades, oil, and cosmetic products.
The organoleptic quality of fruits is normally determined through parameters such as total titratable acidity (TTA), total soluble solids (TSS), and other attributes (Chen and Opara, 2013). The TTA is an important element of fruit quality assessment as it greatly influences the overall sensory perception of the fruits (Velardo-Micharet et al., 2021). TTA is determined by exhaustive titration of intrinsic acids with a standard base to endpoint and then expressing the acidity in terms of the predominant organic acid present in the sample such as malic, citric, and tartaric acids and is (Zhang et al., 2023). Due to its evolution during the maturation and ripening of fruits, TTA is normally used to indicate the harvesting time for fruits (Velardo-Micharet et al., 2021). The TSS content, representing the total dissolved content in fruits, is an indicator of the maturity, sweetness, and overall quality of fruits (Magwaza and Opara, 2015). It is usually determined by a refractometer and expressed as a percentage or degree brix (%/°Brix). The TTA and TSS provide valuable information about the quality of fruits and are normally used when sorting and grading Cactus pear fruits (Mutwa et al., 2015). However, the methods for determining these parameters are destructive, time-consuming, require specialized equipment and personnel, and are sometimes impractical in certain contexts (Ncama et al., 2017; Amuah et al., 2019). Therefore, it is necessary to find a non-invasive technique for determining the quality of Cactus pear fruits that are non-destructive and provide real-time and accurate information on-site.
Near-infrared spectroscopy (NIRS) is an emerging and powerful technology for probing the composition of organic matrices like biological samples (Magwaza and Opara, 2015). It has gained significant recognition as a non-invasive tool of choice in various fields (Ozaki et al., 2018). It relies on the fact that organic molecules in the sample absorb near-infrared radiation at specific wavelengths. The absorbed radiation is linked to specific chemical bonds within the sample matrix and by analyzing the absorption pattern, the chemical composition and properties of a sample can be obtained (Beć et al., 2021). The NIR spectral region typically extends from approximately 800-2500 nm and is associated with overtones and combination bands related to hydrogen-bonded molecules (O-H, C-H, and N-H) (Amuah et al., 2019; Hasanzadeh et al., 2022). The primary advantages of NIRS are; green, non-polluting, wide applicability, rapid, requires little or no sample preparation, and its ability to simultaneously determine several parameters with just a single scan (Li et al., 2019).
Recent advancements in NIR spectroscopy have led to the emergence of miniaturized NIRS systems which offer additional speed, convenience, cost-effectiveness, simplicity, and sensitivity (Beć et al., 2021). This advancement in NIR spectroscopy has seen an increasing literature on the use of smartphone or tablet-connected miniature spectroscopy for rapid assessment of quality indices of several agricultural produce (Amuah et al., 2019; Munawar et al., 2021; Shen et al., 2022; Wang et al., 2022b). Additionally, the accuracy of portable NIR spectroscopy is comparable to that of benchtop instruments (Kartakoullis et al., 2019; Savoia et al., 2021; Yegon et al., 2023). Therefore, this study aimed to evaluate the potential of portable NIRS coupled with multivariate analysis for rapid, accurate, and simultaneous determination of total titratable acidity and total soluble solids in intact Cactus pear fruits.
2 Materials and methods
2.1 Sample collection
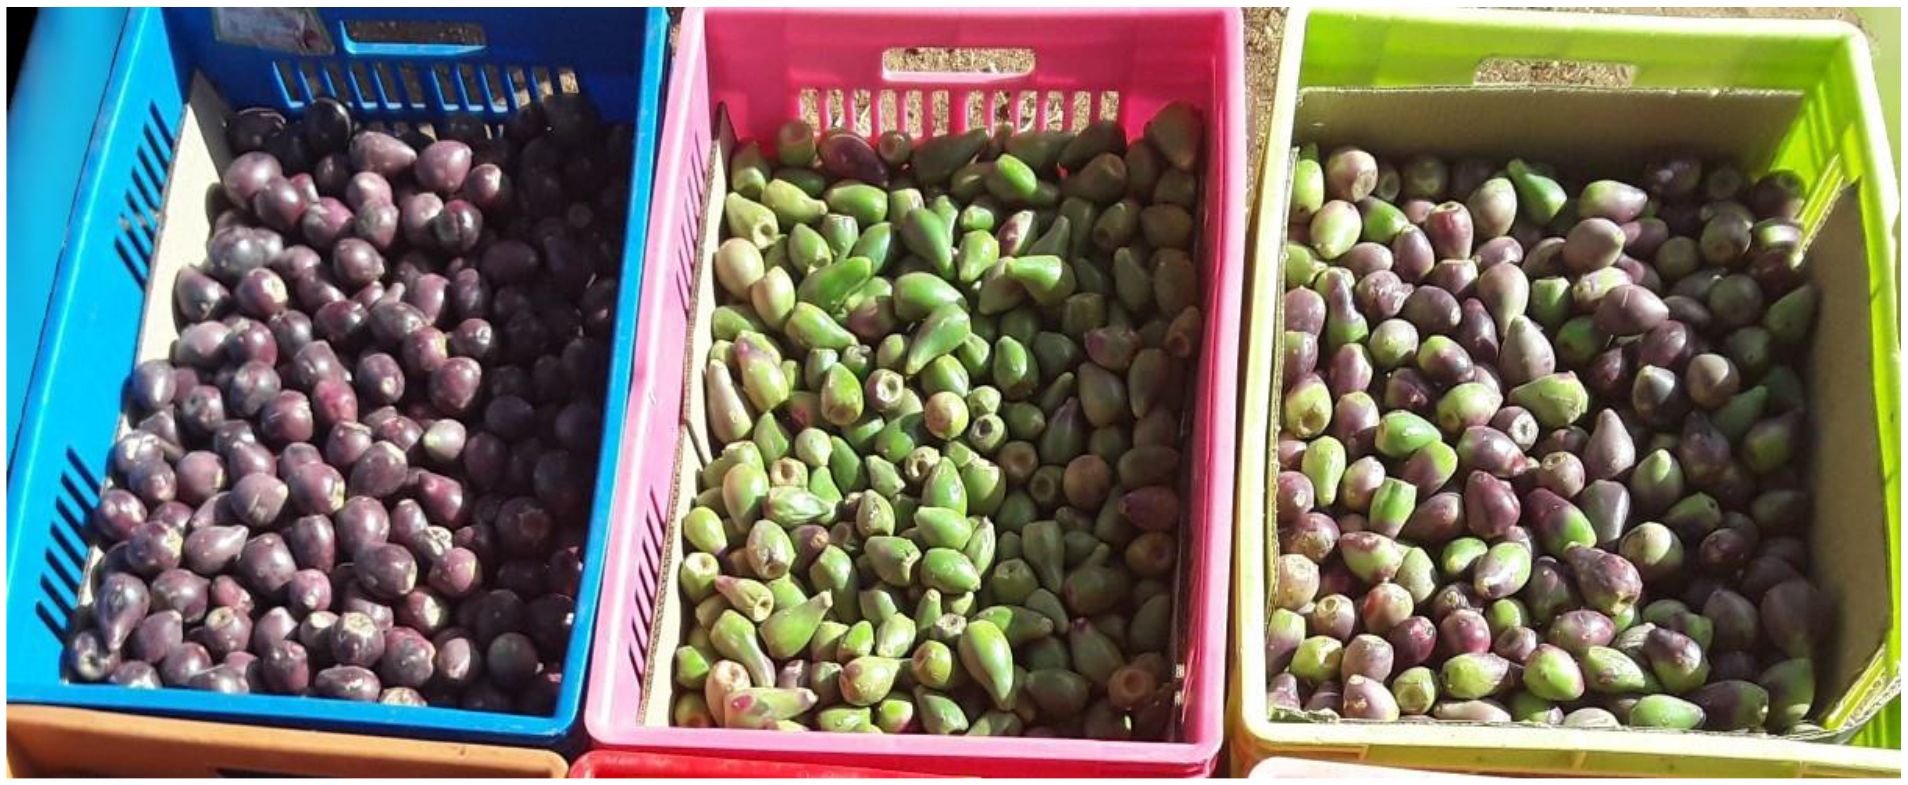
Cactus pear fruit samples were collected from the Il Ngwesi I-Mayianat Community Ranch at Makurian in Laikipia County, Kenya. Laikipia is one of the counties in Kenya known for fast-growing and highly invasive cactus plants (Mutwa et al., 2015). To capture variation in fruit’ properties, three stages of ripeness were considered for sampling; mature green, pre-ripe, and ripe fruits. Figure 1 shows different stages of Cactus pears collected for this study. Samples then were transported to Jomo Kenyatta University of Agriculture and Technology (JKUAT), postharvest laboratory, and immediately subjected to spectral data acquisition and wet-chemistry analyses.
2.2 Spectral data acquisition
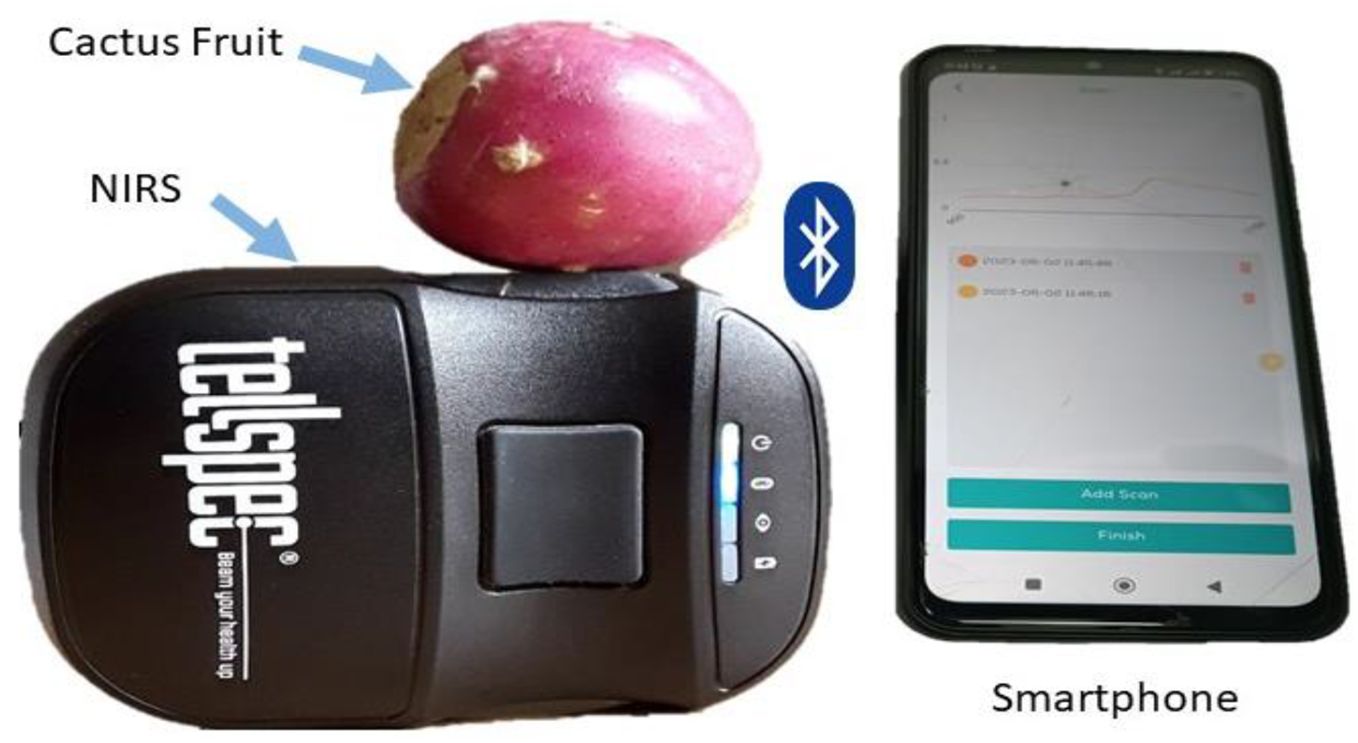
This study used a miniature NIR spectrometer model (NIR-S-G1, Tellspec, Toronto, Canada) to acquire spectral data. The instrument is incredibly small and lightweight, measuring only 77g, 75 mm in length, 58 mm in width, and 26 mm in height. It uses a digital light processing (DLP) technique to filter specific wavelengths and InGaAs detector for transforming light into signal (Crocombe, 2018). This spectrometer operates in a wavelength range of 900-1700 nm, with 256 continuous wavelengths and a resolution of 3.51 nm.
A dedicated spectral collection and management mobile application was installed on a smartphone, according to the manufacturer’s instructions. The connection between the smartphone and the spectrometer was achieved through Bluetooth. The pre-installed application was used to command the sensor, manage and export acquired spectra to analytical software for multivariate analysis. Before spectral acquisition, dried sodium chloride salt (oven-dried at 105°C for 4 hours) was scanned to obtain reference value for determining the actual reflective measurement of the sample.
Before spectral data acquisition, dried sodium chloride salt was scanned to obtain reference values for determining the sample reflectance values
Spectral data were acquired by placing the Cactus pear on top of a scanning window before commanding the spectrometer to scan the sample (as shown in Figure 2). Three spectra were collected from each fruit along the equatorial line while rotating it at 120°. An average spectrum was then computed for each sample and raw intensity values were converted into absorbance values (), where I0 is the raw intensity of reference and I is the raw intensity of sample.
The resulting data were transferred to the Unscrambler X software (Version 10.4) and OriginPro for pre-processing and multivariate analysis.
2.3 Reference measurements
2.3.1 Total titratable acidity and total soluble solids
Reference measurements are precisely taken values for a parameter and are used together with spectral data to train predictive models. In this study, the TTA and TSS for 262 Cactus pear fruit samples were determined according to (Mutwa et al., 2015) with little modification. A Cactus pear was horizontally cut into two halves and the pulp squeezed out. Approximately 2 g of the pulp was weighed (weighing scale model no: AEG-220, Shimadzu Corporation, Japan) and diluted with 50 ml of distilled water. From the solution, 10 ml were measured into a 250 ml conical flask, and added 2-3 drops of Thymol blue indicator. The solution was then titrated against 0.1N NaOH until a permanent blue color persisted. The volume of the titer was recorded and used for calculating the amount of TTA in Cactus pears. The concentration of TTA was then expressed as a percentage of citric acid. The concentration of TTA was calculated according to Equation 1 below.
The conversion factor for citric acid is 0.064.
The TSS was measured by squeezing out the juice from the other half of the Cactus pear fruit into the sample holder of a hand refractometer (ATAGO model ATC-1, Tokyo, Japan), and reading taken. The resulting measurements were expressed as °Brix. The TTA and TSS were determined in triplicate for every sample and the average values were used for calibration purposes.
2.4 PLSR model development
2.4.1 Data partitioning
As a norm in PLSR modeling, the dataset was divided into two subsets; the calibration set and the prediction set. The calibration set was used to train the models while the prediction set was used to evaluate the performance of the models. The sorting division method was used to split the dataset. This was adopted since it is simple and ensures that the range in values is well captured in both prediction and calibration sets. This was carried out as follows; the dataset was separated based on the parameter and individually sorted from the lowest to the highest, then the middle in every four samples were picked for the prediction set and the remaining three samples were assigned to the calibration set. The resulting ratio was 3:1, i.e., 196 samples picked for the calibration of models and the remaining 66 samples for evaluating the performance of constructed models.
2.4.2 Spectral data pre-processing
The NIR spectra can be negatively affected by several factors such as surface irregularities (scratches, bruises, or uneven textures), path length variation, and skin thickness, among others (Olmos et al., 2018). To minimize these interferences, pre-processing techniques are applied to raw spectra to remove artifacts, background noise, and interferences caused by these factors. Spectral pre-processing also improves the quality and usefulness of spectral data before modeling (Olmos et al., 2018). Here, linear baseline correction (LBC) was used to pre-process raw spectra and then mean centered (MC). The LBC was used to improve the accuracy of spectral data by removing the underlying trends or baseline drift that is not related to the chemical properties of the sample (Rinnan et al., 2009). The MC was used for offset removal and resolution enhancement (Iacobucci et al., 2016).
2.4.3 Construction and evaluation of models
The PLSR is a typical linear modeling approach for spectroscopic data. It determines components in spectral data that have the greatest correlation with reference data (Berrueta et al., 2007). To be specific, the PLSR approach models both spectral and reference data simultaneously and identifies latent variables in spectral data that best describe the latent variables in reference data. The determination of an optimum number of latent variables or factors is crucial during the training of models (Christensen and Amemiya, 2002). This ensures a balance between capturing the most relevant information contained in the dataset and avoiding overfitting or underfitting the model (Christensen and Amemiya, 2002).
In this study, leave-one-out cross-validation (LOOCV) technique was employed to determine the optimum number of factors. That is, the number of factors corresponding to the lowest prediction error. The PLSR models were constructed using the independent variables (spectral data) and the dependent variables (reference data). The spectral data from the wavelength 950-1650 nm were used for modeling as the remaining variables were considered irrelevant or noisy (Fan et al., 2018). The performances of trained models were then evaluated both internally and externally.
For internal validation, R-squared (R2) of calibration (Equation 2) and root mean squared error of cross-validation (RMSECV) (Equation 3) were used. For external validation, external sets of data were subjected to the models, and their performance was evaluated based on R-squared (R2) of prediction (Equation 2), root means square error of prediction (RMSEP) (Equation 4), bias (Equation 5) and residual predictive deviation (RPD) (Equation 6) (Amuah et al., 2019; Wang et al., 2022a).
where is the total number of samples is the predicted values, is the reference value from wet chemistry, is the mean of predicted values, and is the predicted value of the fruit parameter, is the standard deviation of reference data.
3 Results and discussion
3.1 Reference measurements; TTA and TSS
The TTA and TSS results are shown in Table 1. The TTA ranged from 0.21-3.70% citric acid with an average value of 1.39% citric acid. These results indicate that the pulp of a Cactus pear is moderately acidic. However, the mean of TTA expressed as % citric acid reported in this study was slightly above 0.32% citric acid reported by Mutwa et al. (2015) and outside the range of 0.72-0.83% citric acid reported by Roghelia and Panchal (2016). The possible reason for this discrepancy is that samples belonging to three different maturity stages were collected (i.e., mature green, pre-ripe, and ripe) and analyzed in this study. Varietal differences and the geographical location of Cactus pear fruit might have also contributed to the observed differences (Shewfelt, 1990).

Table 1. Summary of reference parameters and PLSR results for prediction of TTA and TSS in Cactus pear fruits.
The TSS ranged from 0.3-10.9°Brix with a mean of 5.4°Brix. However, the range of TSS reported by this study was below 11.25-13.50° Brix and 11.6-13.7°Brix reported by El-Samahy et al. (2006) and Mokoboki et al. (2009), respectively. The mean of TSS in this study was low by almost half the mean reported by Mutwa et al. (2015) (10.13° Brix) for Opuntia monacantha variety. The TSS results for this study slightly varied from those in the literature and the main reason for this variation was the different maturity stages samples analyzed by this study.
3.2 Cactus pear fruits’ NIR spectra
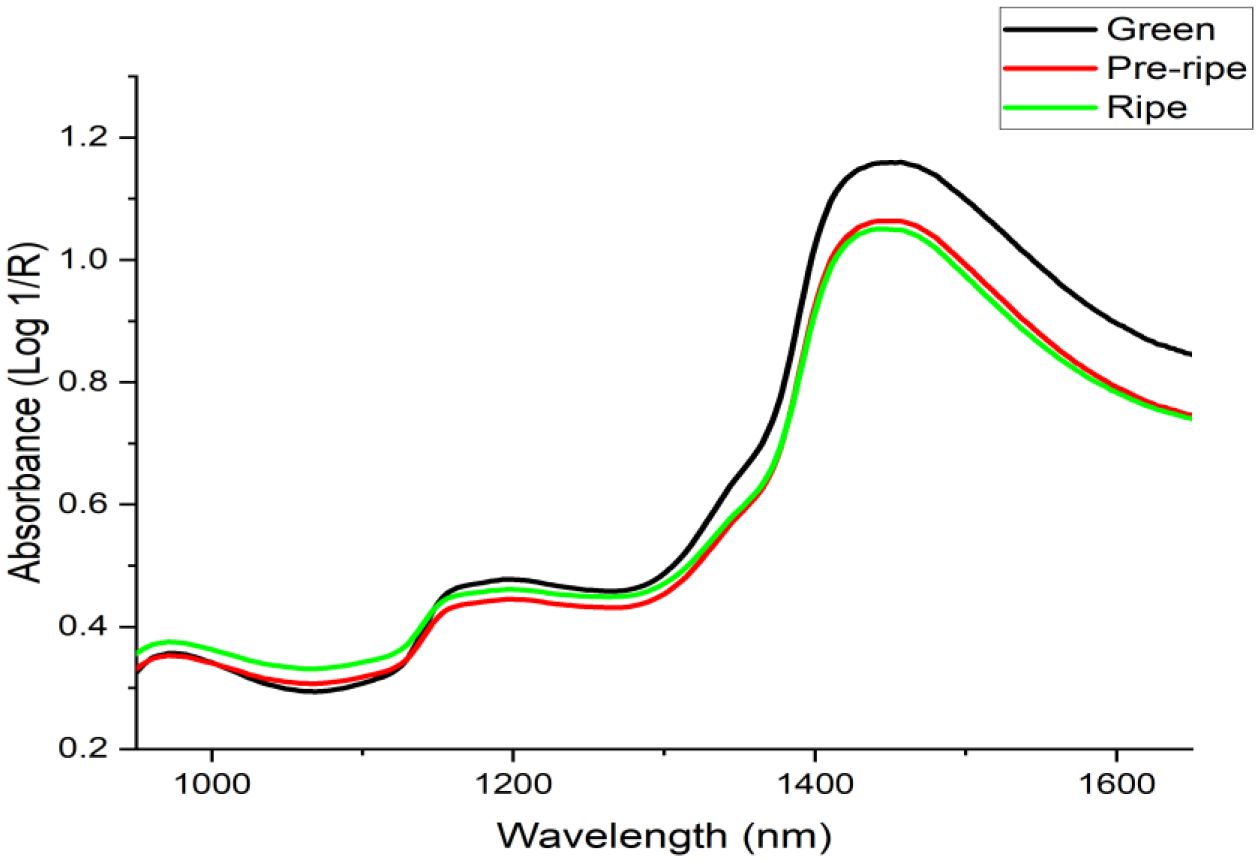
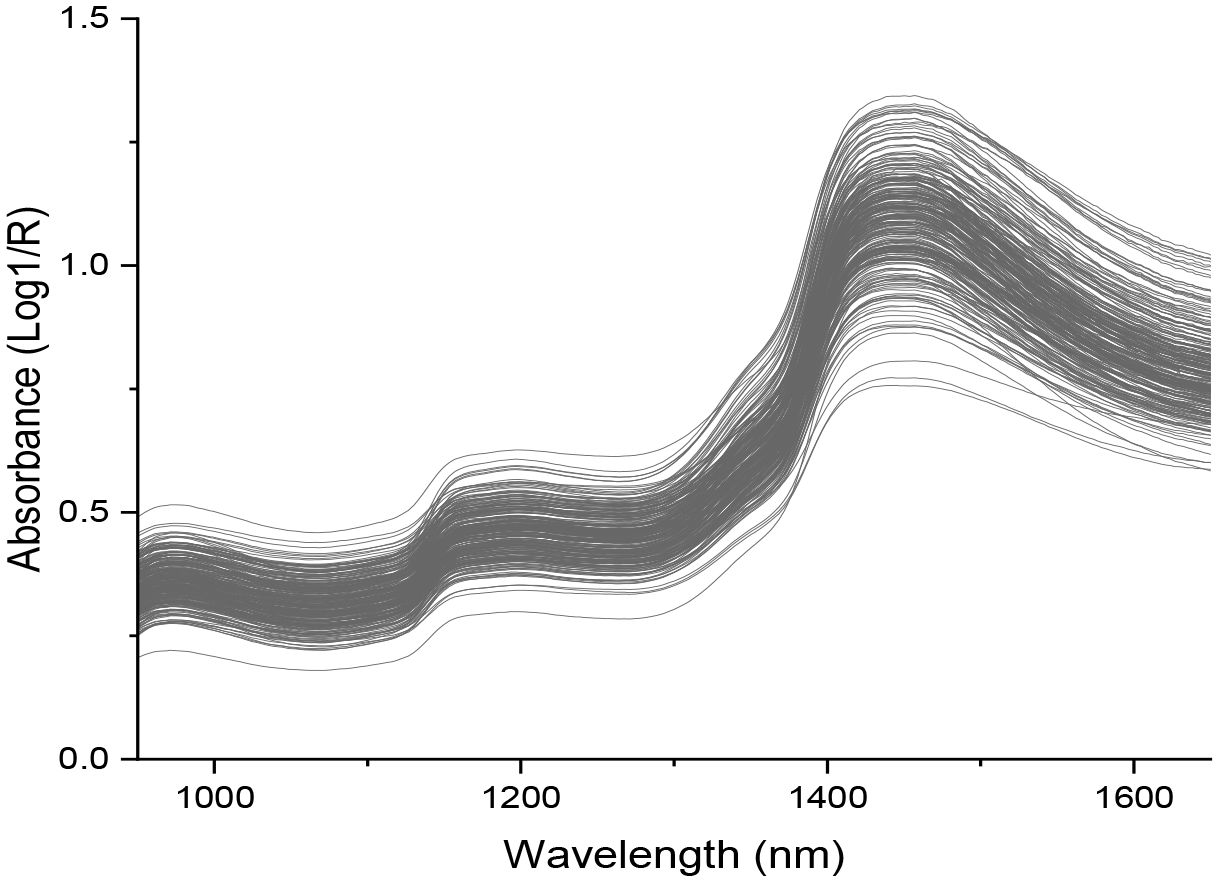
Figures 3, 4 show raw spectra for Cactus pear fruits. In Figure 3, spectral variation for green, pre-ripe, and ripe samples was consistent from 950 to 1400 nm. Beyond 1450 nm, the mean spectrum for green Cactus pears significantly deviated from the other samples. Even though there were differences in the intensities of absorbances, all spectra portrayed similar trends and shapes throughout the entire wavelength. Also, there were three common absorption peaks, one prominent at around 1450 nm and two minor peaks at around 1180 nm and 960 nm. The major band at around 1450 nm is associated with the first overtone O-H stretch in water molecules (Liang et al., 2018; Li et al., 2019). The absorption signal at 1180 nm is likely due to a blend of two stretching vibrations; one is associated with C-H stretching of CH3 and the other one is the first overtone O-H stretching (Shen et al., 2022). The peak at around 960 nm is associated with the second overtone O-H and C-H (Workman and Weyer, 2007).
Considering the penetration depth of NIR radiation which is up to 3 mm (Huang et al., 2016), the spectral signals acquired were a combination of the contributions from both the skin and the pulp of the fruit. The hydroxyl (O-H) groups represented by the absorption signals at 1445 nm, 1000 nm, and 800 nm for the first, second, and third overtone O-H stretch (Workman and Weyer, 2007) are associated with sugars, organic acids (Amuah et al., 2019), vitamins (Borba et al., 2021), water (Guan et al., 2019) and the cell wall components (cellulose, hemicellulose and pectin) (Fang, 2015). Citric acid belongs to the carboxylic acid functional group. It is characterized by the presence of a carboxyl group which consists of a carbonyl group (C=O) and a hydroxyl (OH) group (Wilhelm and Gardette, 1994). Citric acid is a predominant organic acid in Cactus pear (Mutwa et al., 2015). Water, glucose, sucrose, and cellulose of Cactus pears contain O-H and C-H chemical bonds in their chemical structures. The TSS and TTA are organic molecules that typically contain C-H, O-H, C-O, and C-C bonds in their structure (Amuah et al., 2019) and NIR spectroscopy could be a suitable tool for rapid screening of these parameters in Cactus pears non-invasively.
3.3 Characterization of cactus pear fruits
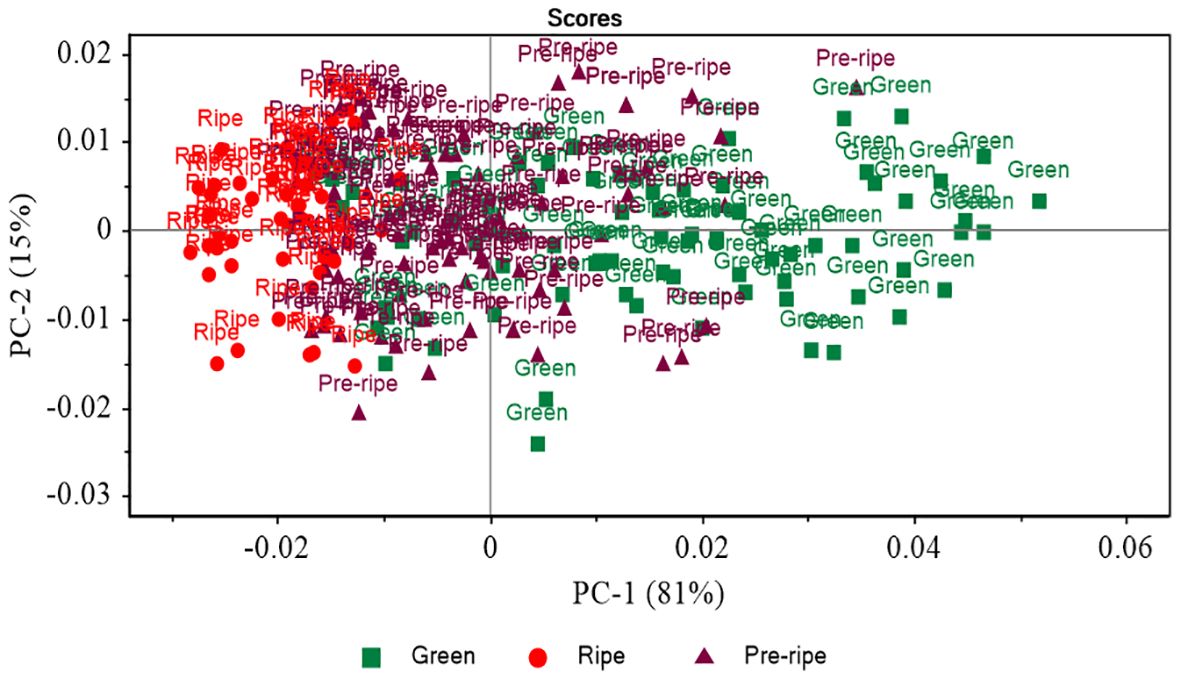
Principal component analysis (PCA) was used to reduce the complexity of the dataset while retaining as much as possible the variation within the datasets. Figure 5 shows a PCA score plot with clusters of Cactus pears based on the different ripening stages. Three distinct groups corresponding to green, pre-ripe, and ripe stages of Cactus pears are observed. Along the PC1 axis, the green and pre-ripe groups overlap slightly while pre-ripe and ripe clearly separate. The amount of total explained variations were 81% and 15% for PC1 and PC2, respectively. The PC1 explained a substantial amount of variation which relates to the progression of ripening of Cactus pears.
3.4 Quantification models
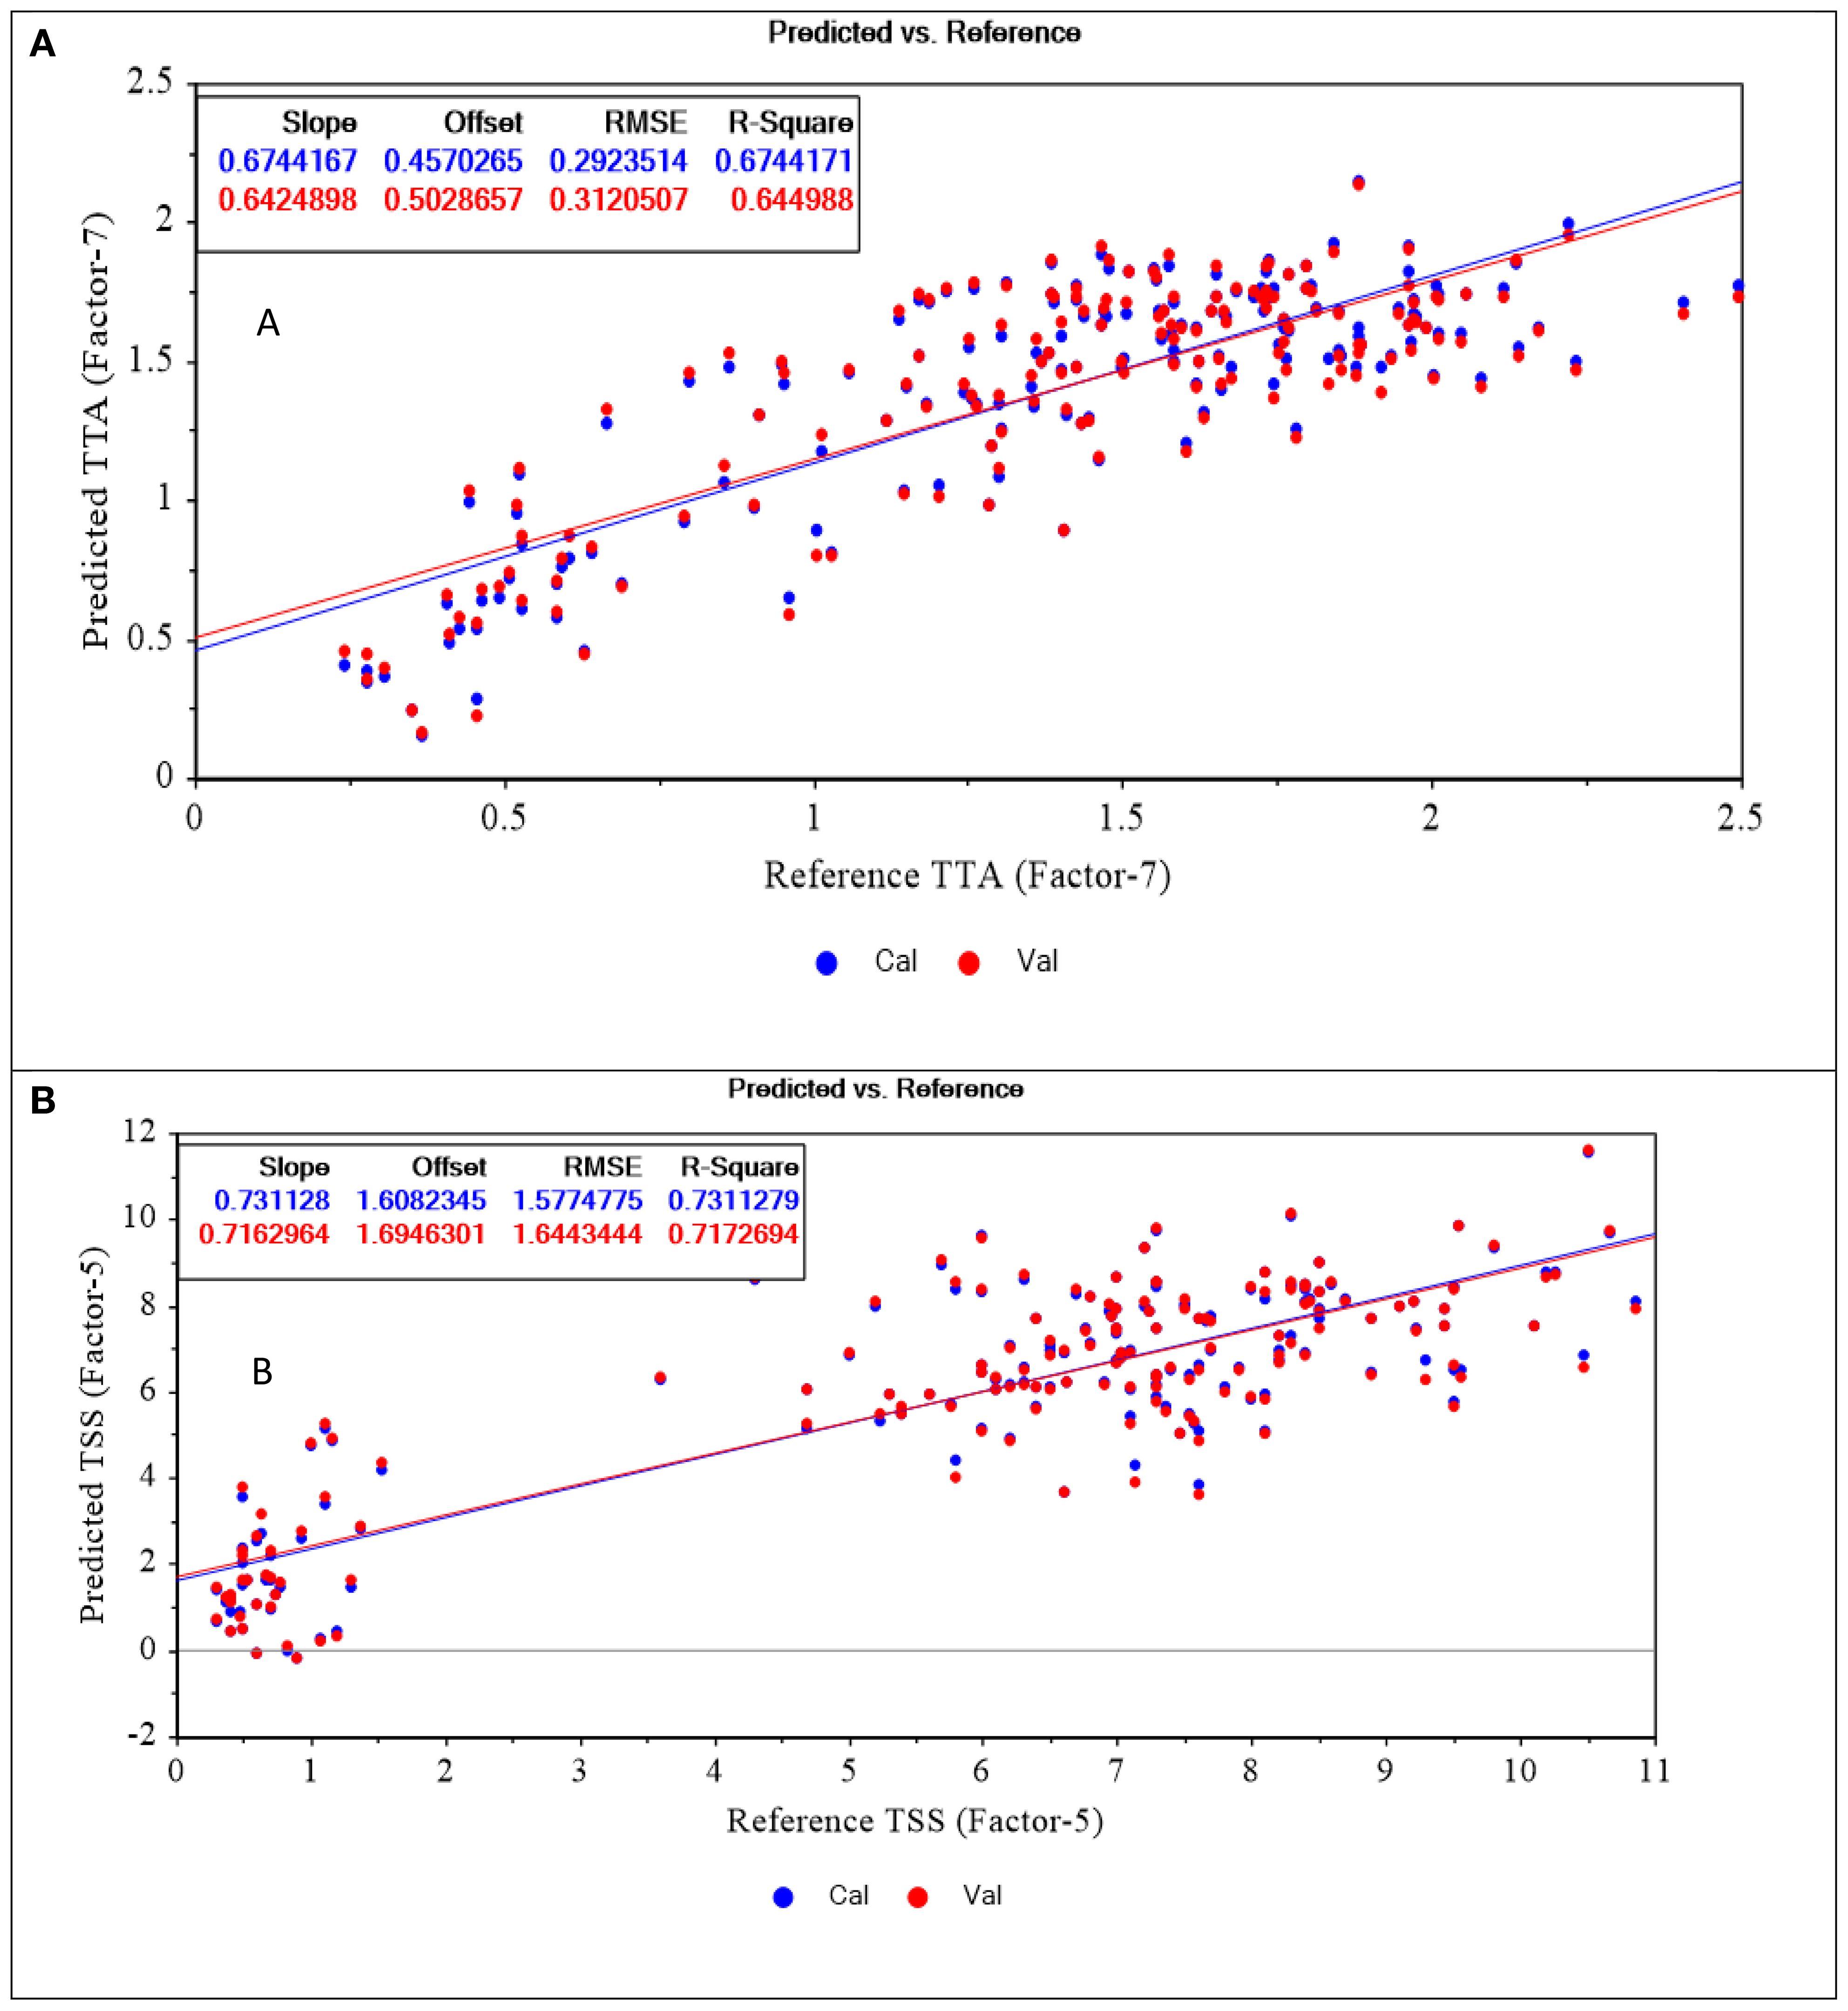
The performance of the PLSR models trained for predicting TTA and TSS in intact Cactus pear samples are shown in Figure 6. Measured and predicted values are displayed by the x-axis and y-axis, respectively. The blue points represent the training set while the red points correspond to the independent set of data used for the internal validation. Apart from internal validation using LOOCV, model’s performance was also assessed using an independent set of samples (prediction set) that was not part of the training set. The prediction set was meant to test the model’s performance on new set of samples and evaluate its predictive power. Table 1 provides the statistical results of the models.
The TTA model showed reasonably fair performance as it presented an R2 of 0.65 and an RMSEC of 0.31% citric acid. This meant that the model was able to explain about 65% of the total variation in TTA content in cactus pears. However, considering a range of 0.21-3.70% citric acid within the samples, an error of ±0.31% citric acid suggests that the model may not be reliable in predicting TTA in Cactus pears. Despite that, the model resulted in improved statistics upon validation with an external set of samples. The model resulted in an R2 and RMSEP of 0.73 and 0.29% citric acid, respectively.
The TSS model resulted in an R2 and RMSEC of 0.72 and 1.64°Brix, respectively for the calibration set. Additionally, it also returned an R2 and RMSEP of 0.75 and 1.60°Brix, respectively for the prediction set. The TTA and TSS models presented better results when subjected to an external set of samples. This proved the models’ potential of providing estimates of TTA and TSS content on new cactus pear samples.
The mean of predicted TTA (1.32% citric acid) and TSS (5.73° Brix) (Table 1) were so close to the mean of conventionally measured TTA (1.39% citric acid) and TSS (5.4° Brix) (Table 1). This suggested that both PLSR models performed well in explaining the overall patterns of TTA and TSS in Cactus pears and provided an estimate that aligned well with the average values of measured parameters. The standard deviation for predicted TTA and TSS were slightly lower than that of the actual values. This meant that the predicted values were closer to the mean when compared with the reference data. It was a good trend because predicted samples deviated normally from the mean. It also indicated that there were very low chances of predicting samples as outliers since their actual values were close to the mean.
The predicted % CV was smaller than the actual %CV except for TTA. This confirmed that the TSS model was able to accurately predict TSS values in new samples with reduced variability compared to the original data. Since all predicted values were lower than the actual measurements, it resulted in a bias of -0.01 and -0.09 for the TTA and TSS models, respectively. This was a confirmation of the underestimation of predictions made by the models. Another parameter that was used to validate the models was RPD. It is a metric for evaluating the practical usefulness of a PLSR model in a real-world scenario (Bellon-Maurel et al., 2010). This parameter affirmed that the TSS model was more precise in predicting the TSS content in Cactus pears as it presented an RPD of 2.06. According to (Bellon-Maurel et al., 2010), a model with an RPD of above 2.00 is considered excellent and reliable.
In addition to statistical metrics of PLSR models, scatter plots are necessary for the visualization of the relationships between the predictor variable (spectral data) and the response variable (reference data). Scatter plots indicate patterns, clusters, similarities, and differences among the samples. Figure 6 shows the scatter plots for TTA and TSS calibration models. The data points for both predicted and conventionally measured values were distributed along the regression line. This suggested that predicted and actual values were so close and NIR spectroscopy could be used for non-invasive determination of TTA and TSS in intact Cactus pears.
Figures 7, 8 shows factor 1 spectral loading weights for models predicting TTA and TSS in cactus fruits, respectively. Spectral loading weights for a model predicting TTA explained 76% and 22% of variance in spectra data and measured TTA, respectively, while the model predicting TSS was responsible for 55% and 24% variance in spectral data and measured TSS, respectively. These spectral loading weights demonstrates how well the wavelengths were considered by the models. Figures 7, 8 shows several peaks at different wavelengths that were responsible for prediction of TTA and TSS in cactus fruits. Particularly, peaks at around 1050-1110, 1240, 1400, 1450, 1600-1650 nm and 1040-1100, 1270, 1400, 1450, 1550, and 1650 nm were responsible for prediction of TTA and TSS in cactus fruits. These wavelengths contributed significantly to the formation of latent variables responsible for predicting TTA and TSS in cactus fruits, with those from 1400 nm onwards being the most influential. In addition, these wavelengths correspond to the vibrational modes belonging to C-H, O-H, and N-H chemical bonds (Workman and Weyer, 2007; Liu et al., 2015; Amuah et al., 2019) which are normally found in carbohydrates, organic acids and proteins, and contributes to TTA and TSS in cactus fruits (Cota-Sánchez, 2015; Hernández García et al., 2020).
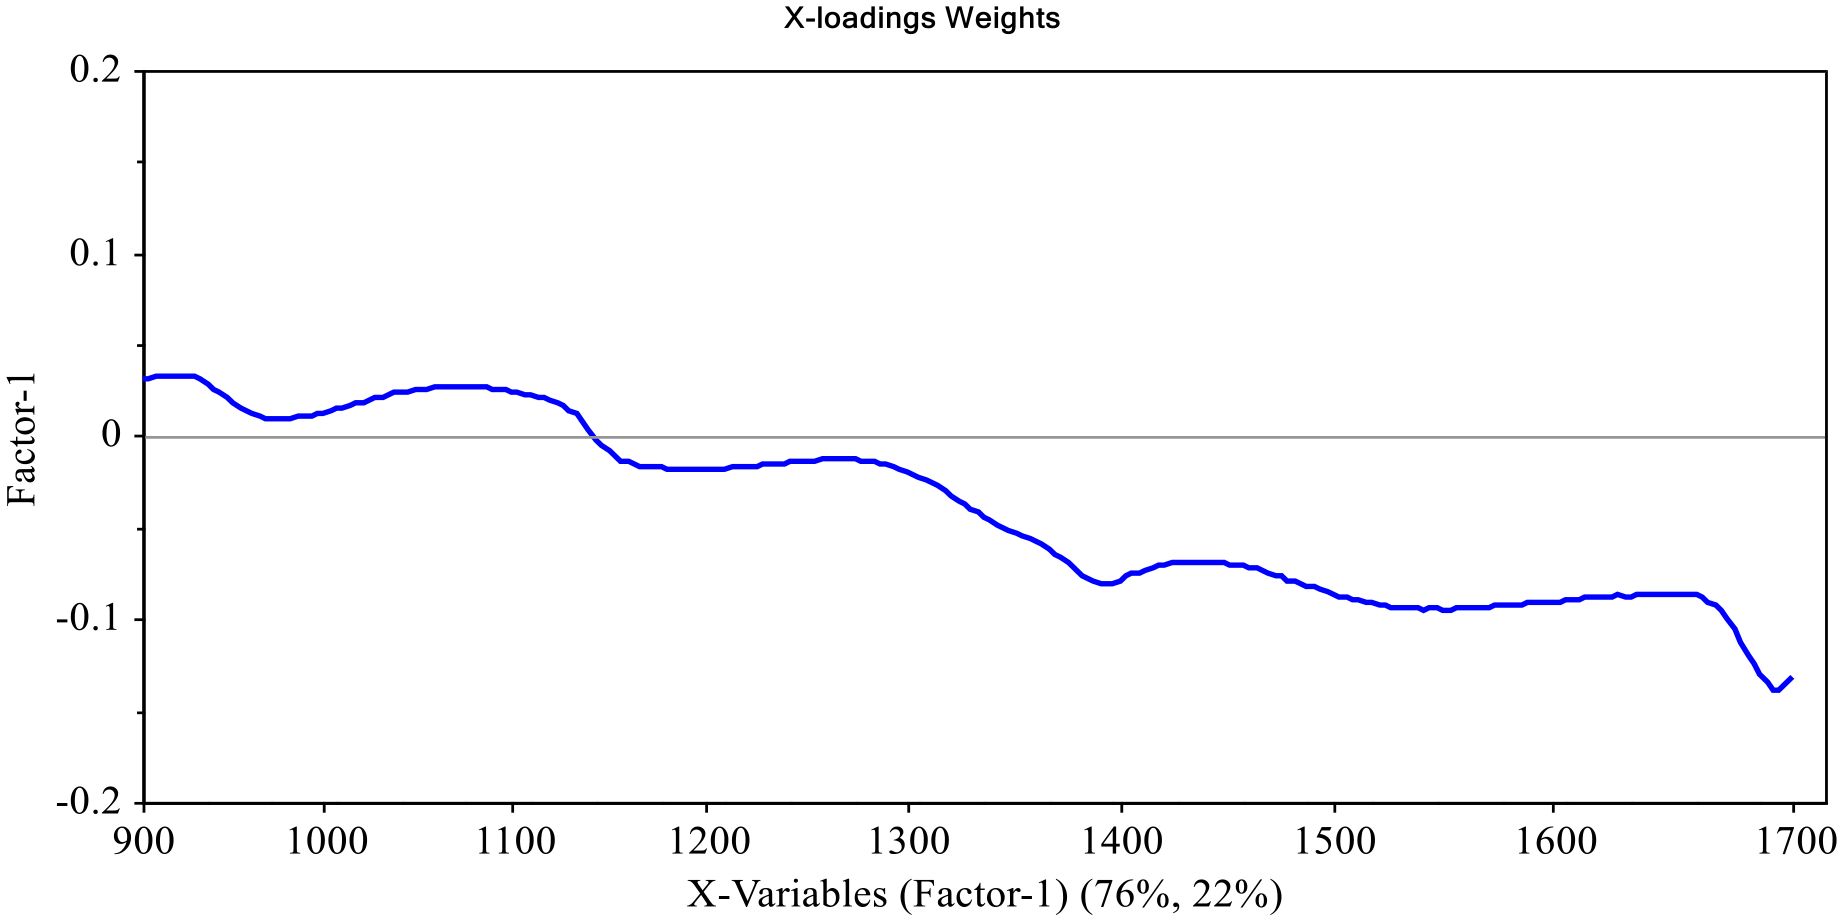
Figure 7. Factor 1 X-loadings plot for PLSR model predicting TTA in cactus fruits, showing contribution of wavelengths (900-1700 nm), which explains 76% of variance.
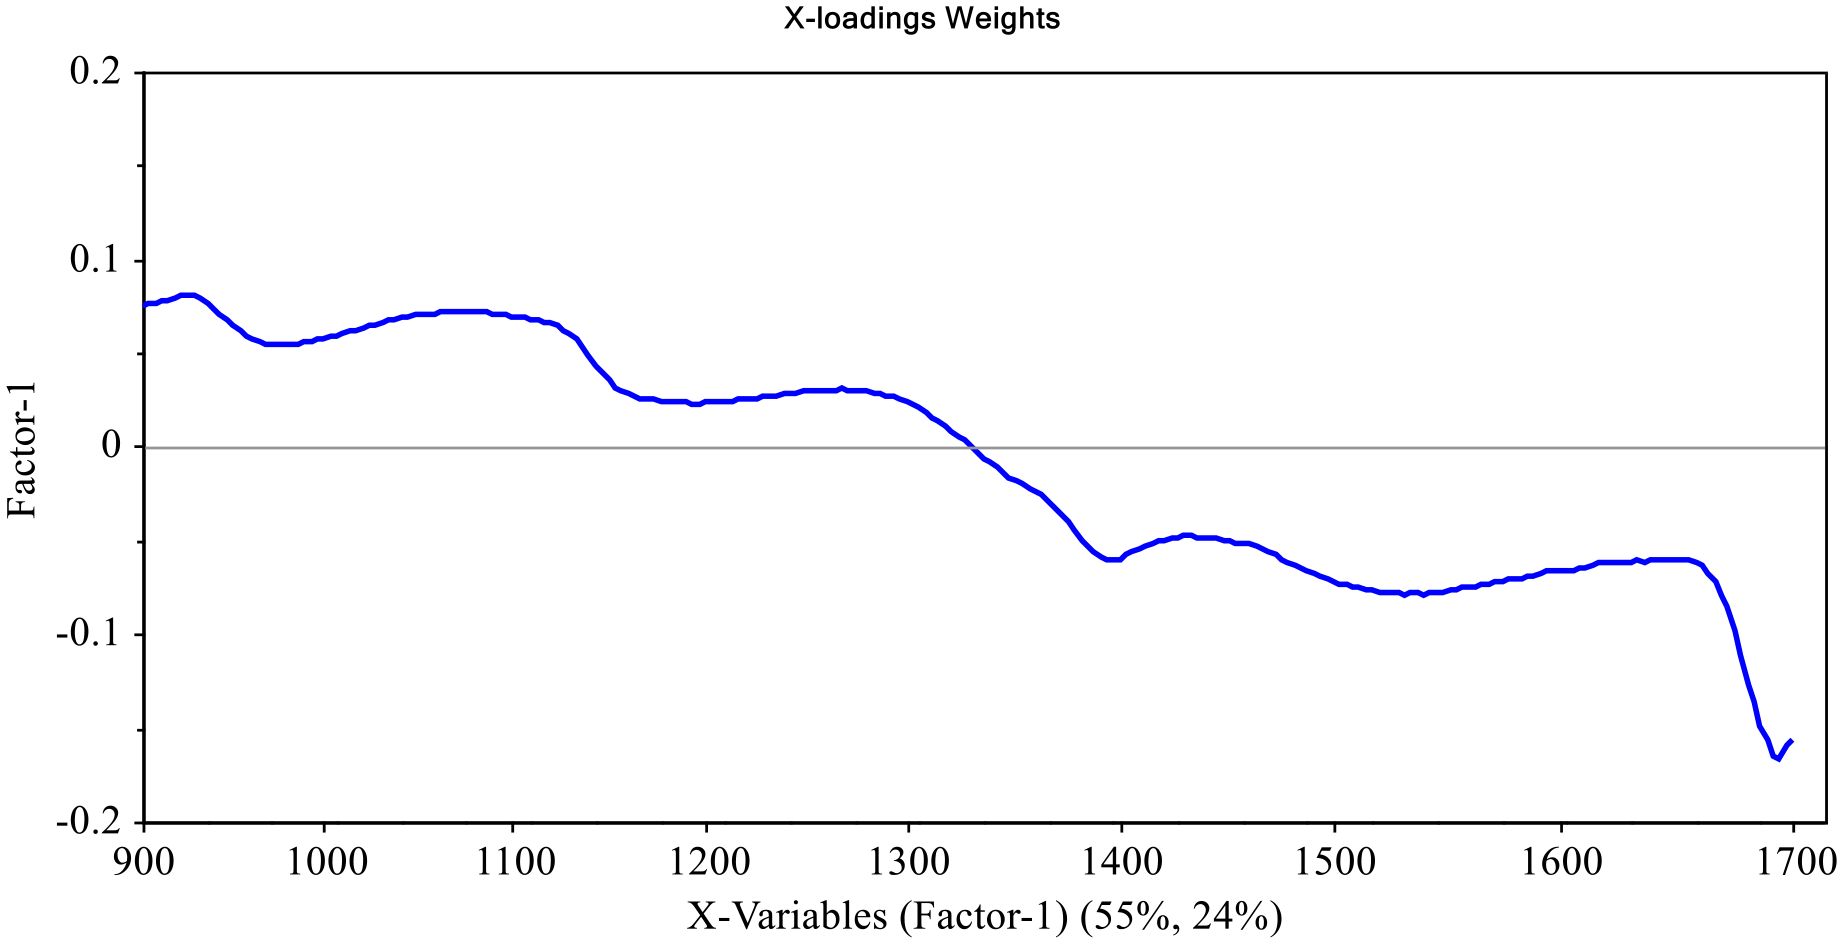
Figure 8. Factor 1 X-loadings plot for PLSR model predicting TSS in cactus fruits, showing contribution of wavelengths (900-1700 nm), which explains 55% of variance.
4 Conclusion
This study assessed the feasibility of a portable NIR spectrometer (wl 900 – 1700 nm) for rapid and non-destructive determination of total titratable acidity (TTA) and total soluble solids (TSS) content in cactus fruits. Partial least squares regression (PLSR) algorithm was adopted for training and validating predictive models. While the TTA model achieved an R2 of 0.73, RMSEP of 0.29% citric acid, and RPD of 1.97, its accuracy in terms of prediction error, was low considering a small range of TTA reported in this study. Conversely, the TSS model performed better with an R2 of 0.75, RMSEP of 1.60° Brix, and RPD of 2.06. Nonetheless, these results demonstrated the potential of a portable NIR spectrometer for non-invasive and rapid quantification of TTA and TSS content in cactus fruits. Implementation of this technique by farmers or processors would greatly improve quality assessment of cactus fruits, specifically in terms of TTA and TSS. It would also help in reducing expenses associated with quality assessment and promote utilization of cactus fruits by facilitating market entry of cactus derived food products.
Data availability statement
The raw data supporting the conclusions of this article will be made available by the authors, without undue reservation.
Author contributions
WO: Conceptualization, Funding acquisition, Investigation, Project administration, Resources, Supervision, Visualization, Writing – original draft, Writing – review & editing. DL: Conceptualization, Data curation, Formal analysis, Investigation, Writing – original draft. SI: Conceptualization, Methodology, Resources, Supervision, Validation, Writing – original draft. PK: Conceptualization, Investigation, Methodology, Resources, Supervision, Writing – review & editing. WN: Investigation, Methodology, Writing – review & editing. DY: Data curation, Investigation, Methodology, Software, Visualization, Writing – original draft, Writing – review & editing.
Funding
The author(s) declare financial support was received for the research, authorship, and/or publication of this article. The financial support for this research study was provided by the dryGrow Foundation, Sicily, Italy to WO under the research project title “Exploiting the Nutraceutical Potential of The Invasive and Cultivated Cactus Pear Fruit in Kenya”.
Conflict of interest
The authors declare that the research was conducted in the absence of any commercial or financial relationships that could be construed as a potential conflict of interest.
Publisher’s note
All claims expressed in this article are solely those of the authors and do not necessarily represent those of their affiliated organizations, or those of the publisher, the editors and the reviewers. Any product that may be evaluated in this article, or claim that may be made by its manufacturer, is not guaranteed or endorsed by the publisher.
References
Al-Naqeb G., Fiori L., Ciolli M., Aprea E. (2021). Prickly pear seed oil extraction, chemical characterization and potential health benefits. Molecules. 26, 5018. doi: 10.3390/molecules26165018
Amaya-Cruz D. M., Pérez-Ramírez I. F., Delgado-García J., Mondragón-Jacobo C., Dector-Espinoza A., Reynoso-Camacho R. (2019). An integral profile of bioactive compounds and functional properties of prickly pear (Opuntia ficus indica L.) peel with different tonalities. Food Chem 278, 568–578. doi: 10.1016/j.foodchem.2018.11.031
Amuah C. L. Y., Teye E., Lamptey F. P., Nyandey K., Opoku-Ansah J., Adueming P. O. W. (2019). Feasibility study of the use of handheld NIR spectrometer for simultaneous authentication and quantification of quality parameters in intact pineapple fruits. J. Spectrosc 2019, 1–9. doi: 10.1155/2019/5975461
Aregahegn A., Chandravanshi B. S., Atlabachew M. (2013). Mineral contents of fruits of cactus pear (Opuntia ficus indica) grown in Ethiopia. In: Acta Horticulturae. 979, 117–126.
Beć K. B., Grabska J., Huck C. W. (2021). Principles and applications of miniaturized near-infrared (NIR) spectrometers. Chem. - A Eur. J 27, 1514–1532. doi: 10.1002/chem.202002838
Bellon-Maurel V., Fernandez-Ahumada E., Palagos B., Roger J. M., McBratney A. (2010). Critical review of chemometric indicators commonly used for assessing the quality of the prediction of soil attributes by NIR spectroscopy. TrAC - Trends Analytical Chem. 29, 1073–1081. doi: 10.1016/j.trac.2010.05.006
Berrueta L. A., Alonso-Salces R. M., Héberger K. (2007). Supervised pattern recognition in food analysis. J. Chromatogr. A. 1158, 196–214. doi: 10.1016/j.chroma.2007.05.024
Borba K. R., Spricigo P. C., Aykas D. P., Mitsuyuki M. C., Colnago L. A., Ferreira M. D. (2021). Non-invasive quantification of vitamin C, citric acid, and sugar in ‘Valência’ oranges using infrared spectroscopies. J. Food Sci. Technol 58, 731–738. doi: 10.1007/s13197-020-04589-x
Butera D., Tesoriere L., Gaudio F., Bongiorno A., Allegra M., Pintaudi A. M., et al. (2002). Antioxidant activities of sicilian prickly pear (Opuntia ficus indica) fruit extracts and reducing properties of its betalains: Betanin and indicaxanthin. J. Agric. Food Chem 50, 6895–6901. doi: 10.1021/jf025696p
Chen L., Opara U. L. (2013). Texture measurement approaches in fresh and processed foods — A review. Food Res. Int 51, 823–835. doi: 10.1016/j.foodres.2013.01.046
Christensen W. F., Amemiya Y. (2002). Latent variable analysis of multivariate spatial data. J. Am. Stat. Assoc 97, 543–564. doi: 10.1198/016214502753479437
Cota-Sánchez J. H. (2015). Nutritional composition of the prickly pear (Opuntia ficus-indica) fruit. Nutr. Composition Fruit Cultivars. 2016, 691–712. doi: 10.1016/B978-0-12-408117-8.00028-3
Crocombe R. A. (2018). “Handheld spectrometers in 2018 and beyond: MOEMS, photonics, and smartphones“, in Proceedings SPIE 10545, MOEMS and Miniaturized Systems XVII, 105450C (22 February 2018). doi: 10.1117/12.2286492
Daniloski D., D'cunha N. M., Speer H., McKune A. J., Alexopoulos N., Panagiotakos D. B., et al. (2022). Recent developments on Opuntia spp., their bioactive composition, nutritional values, and health effects. Food Bioscience 47, 101665.
El-Mostafa K., Kharrassi Y., Badreddine A., Andreoletti P., Vamecq J., El M. S., et al. (2014). Nopal cactus (Opuntia ficus-indica) as a source of bioactive compounds for nutrition, health and disease. Molecules. 19, 14879–14901. doi: 10.3390/molecules190914879
El-Samahy S. K., Abd El-Hady E. A., Habiba R. A., Moussa T. E. (2006). Chemical and rheological characteristics of orange-yellow cactus-pear pulp from Egypt. J. Prof. Assoc. Cactus Dev 8, 39–51. doi: 10.56890/jpacd.v8i.277
Fan S., Li C., Huang W., Chen L. (2018). Data fusion of two hyperspectral imaging systems with complementary spectral sensing ranges for blueberry bruising detection. Sensors (Switzerland) 18, 4463. doi: 10.3390/s18124463
Fang W. (2015). Development of a prediction model for Hemp (Cannabis sativa L.) cell wall composition using near-infrared spectroscopy (NIRS) and biochemical analysis. [M.Sc. Thesis]. (Wageningen: Wageningen University), 1–23. Available online at: https://api.semanticscholar.org/CorpusID:6660198.
Felker P., Stintzing F. C., Müssig E., Leitenberger M., Carle R., Vogt T., et al. (2008). Colour inheritance in cactus pear (Opuntia ficus-indica) fruits. Ann. Appl. Biol 152, 307–318. doi: 10.1111/j.1744-7348.2008.00222.x
Feugang J., Konarski P., Zou D., Stintzing F. C., Zou C. (2006). Nutritional and medicinal use of Cactus pear (Opuntia spp.) cladodes and fruits. Front. Bioscience 11, 2574–2589. doi: 10.2741/1992
Guan X., Liu J., Huang K., Kuang J., Liu D. (2019). Evaluation of moisture content in processed apple chips using NIRS and wavelength selection techniques. Infrared Phys. Technol 98, 305–310. doi: 10.1016/j.infrared.2019.01.010
Guevara-Figueroa T., Jiménez-Islas H., Reyes-Escogido M. L., Mortensen A. G., Laursen B. B., Lin L. -W., et al. (2010). Proximate composition, phenolic acids, and flavonoids characterization of commercial and wild nopal (Opuntia spp.). J. Food Compos. Anal. 23 (6), 525–532. doi: 10.1016/j.jfca.2009.12.003
Hailu Z. (2020). Cactus (Opuntia Ficus Indica) and its role in poverty reduction and achievements of goals of the Ethiopian green economy: a review. Int. J. Botany Stud. 5 (3), 447–451.
Hasanzadeh B., Abbaspour-Gilandeh Y., Soltani-Nazarloo A., Cruz-Gámez E. D., Hernández-Hernández J. L., Martínez-Arroyo M. (2022). Non-destructive measurement of quality parameters of apple fruit by using visible/near-infrared spectroscopy and multivariate regression analysis. Sustainability (Switzerland) 14, 14918. doi: 10.3390/su142214918
Hernández García F., Andreu Coll L., Cano-Lamadrid M., López Lluch D., A. Carbonell BarraChina Á., Legua Murcia P. (2020). “Valorization of Prickly Pear [Opuntia ficus-indica (L.) Mill]: Nutritional Composition, Functional Properties and Economic Aspects,” in Invasive Species - Introduction Pathways, Economic Impact, and Possible Management Options. (London, UK: Intechopen).
Huang M., Kim M. S., Chao K., Qin J., Mo C., Esquerre C., et al. (2016). Penetration depth measurement of near-infrared hyperspectral imaging light for milk powder. Sensors (Switzerland) 16, 441. doi: 10.3390/s16040441
Iacobucci D., Schneider M. J., Popovich D. L., Bakamitsos G. A. (2016). Mean centering helps alleviate “micro” but not “macro” multicollinearity. Behav. Res. Methods 48, 1308–1317. doi: 10.3758/s13428-015-0624-x
Kartakoullis A., Comaposada J., Cruz-Carrión A., Serra X., Gou P. (2019). Feasibility study of smartphone-based Near Infrared Spectroscopy (NIRS) for salted minced meat composition diagnostics at different temperatures. Food Chem 278, 314–321. doi: 10.1016/j.foodchem.2018.11.054
Li S., Luo H., Hu M., Zhang M., Feng J., Liu Y., et al. (2019). Optical non-destructive techniques for small berry fruits: A review. Artif. Intell. Agric 2, 85–98. doi: 10.1016/j.aiia.2019.07.002
Liang G., Dong C., Hu B., Zhu H., Yuan H., Jiang Y., et al. (2018). Prediction of moisture content for congou black tea withering leaves using image features and nonlinear method. Sci. Rep 8, 7854. doi: 10.1038/s41598-018-26165-2
Liu Y.-Y., Tu Z.-H., Chu Q.-X. (2015). “A guide to near-infrared spectroscopic analysis of industrial manufacturing processes,“ in 2015 Asia-Pacific Microwave Conference (APMC). Herisau, Switzerland: Metrom AG, doi: CH-9101(2013).8.108.5026EN-2013-02
Magwaza L. S., Opara U. L. (2015). Analytical methods for determination of sugars and sweetness of horticultural products-A review. Scientia Horticulturae. 184, 179–192. doi: 10.1016/j.scienta.2015.01.001
Mokoboki K., Kgama T., Mmbi N. (2009). Evaluation of cactus pear fruit quality at Mara ADC, South Africa. Afr. J. Agric. Res 4, 028–032. doi: 10.5897/AJAR.9000309
Munawar A. A., Hayati R., Fachruddin F. (2021). Rapid determination of inner quality parameters of intact mango fruits using portable near infrared spectroscopy. In. IOP Conf. Series: Earth Environ. Science. 711, 012009. doi: 10.1088/1755-1315/711/1/012009
Mutwa N. K., Owino W. O., Sila D. N. (2015). Identification, nutritional and phytochemical description of edible wild from Kenya cactus varieties. Ann., Food Sci. Technol. 16, 1–27. doi: 10.13140/RG.2.2.33463.53928
Ncama K., Opara U. L., Tesfay S. Z., Fawole O. A., Magwaza L. S. (2017). Application of Vis/NIR spectroscopy for predicting sweetness and flavour parameters of ‘Valencia’ orange (Citrus sinensis) and ‘Star Ruby’ grapefruit (Citrus x paradisi Macfad). J. Food Eng 193, 86–94. doi: 10.1016/j.jfoodeng.2016.08.015
Olmos V., Bedia C., Tauler R., Juan A. (2018). Preprocessing tools applied to improve the assessment of aldrin effects on prostate cancer cells using raman spectroscopy. Appl. Spectrosc 72, 489–500. doi: 10.1177/0003702817746947
Ozaki Y., Huck C. W., Beć K. B. (2018). Near-IR spectroscopy and its applications. Mol. Laser Spectroscopy: Adv. Applications. 24, 4370. doi: 10.1016/B978-0-12-849883-5.00002-4
Ramírez-Rodríguez Y., Martínez-Huélamo M., Pedraza-Chaverri J., Ramírez V., Martínez-Tagüeña N., Trujillo J. (2020). Ethnobotanical, nutritional and medicinal properties of Mexican drylands Cactaceae Fruits: Recent findings and research opportunities. Food Chem. 312, 126073. doi: 10.1016/j.foodchem.2019.126073
Rinnan Å., van den Berg F., Engelsen S. B. (2009). Review of the most common pre-processing techniques for near-infrared spectra. TrAC - Trends Analytical Chem 28, 1201–1222. doi: 10.1016/j.trac.2009.07.007
Roghelia V., Panchal J. (2016). Physicochemical characteristics of cactus pear fruits. J. Pharm. Chem. Biol. Sci 4, 119–125.
Savoia S., Albera A., Brugiapaglia A., Stasio L., CecChinato A., Bittante G. (2021). Prediction of meat quality traits in the abattoir using portable near-infrared spectrometers: heritability of predicted traits and genetic correlations with laboratory-measured traits. J. Anim. Sci. Biotechnol 12. doi: 10.1186/s40104-021-00555-5
Sepúlveda E., Sáenz C., Aliaga E., Aceituno C. (2007). Extraction and characterization of mucilage in Opuntia spp. J. Arid Environments 68, 534–545. doi: 10.1016/j.jaridenv.2006.08.001
Shen S., Hua J., Zhu H., Yang Y., Deng Y., Li J., et al. (2022). Rapid and real-time detection of moisture in black tea during withering using micro-near-infrared spectroscopy. LWT 155, 112970. doi: 10.1016/j.lwt.2021.112970
Shewfelt R. L. (1990). Sources of variation in the nutrient content of agricultural commodities from the farm to the consumer. J. Food Qual 13, 37–54. doi: 10.1111/j.1745-4557.1990.tb00004.x
Sipango N., Ravhuhali K. E., Sebola N. A., Hawu O., Mabelebele M., Mokoboki H. K., et al. (2022). Prickly Pear (Opuntia spp.) as an Invasive Species and a Potential Fodder Resource for Ruminant Animals. Sustainability (Switzerland).
Van Uytvanck J., Verheyen K., Jakobsson S., Lindborg R. (2014). Grazing as a tool for wood-pasture restoration and management. Eur. Wood-pastures Transition: A Social-ecological Approach. Routledge, 2014, 149–61.
Velardo-Micharet B., Agudo-Corbacho F., Ayuso-Yuste M. C., Bernalte-García M. J. (2021). Evolution of some fruit quality parameters during development and ripening of three apricot cultivars and effect of harvest maturity on postharvest maturation. Agric. (Switzerland) 11, 639. doi: 10.3390/agriculture11070639
Vigueras A., Portillo L. (2018). Uses of opuntia species and the potential impact of cactoblastis cactorum (Lepidoptera: pyralidae) in Mexico author (s): A. L. Vigueras G. and L. Portillo source: the florida entomologist, vol. 84, no. 4 (Dec. 2001), pp. 493-498 publish. Florida Entomologist 84, 493–498.
Wang H. P., Chen P., Dai J. W., Liu D., Li J. Y., Xu Y. P., et al. (2022b). Recent advances of chemometric calibration methods in modern spectroscopy: Algorithms, strategy, and related issues. TrAC Trends Analytical Chem 153, 116648. doi: 10.1016/j.trac.2022.116648
Wang F., Wang C., Song S. (2022a). Rapid and low-cost detection of millet quality by miniature near-infrared spectroscopy and iteratively retaining informative variables. Foods 11, 1841. doi: 10.3390/foods11131841
Wilhelm C., Gardette J.-L. (1994). Infrared identification of carboxylic acids formed in polymer photooxidation. J. Appl. Polymer Sci 51, 1411–1420. doi: 10.1002/app.1994.070510808
Workman J. J., Weyer L. (2007). Practical guide to interpretive near-infrared spectroscopy. Pract. Guide to Interpretive Near-Infrared Spectroscopy. CRC Press. doi: 10.1201/9781420018318
Yahia E. M., Sáenz C. (2011). Cactus pear (Opuntia species). In Postharvest biology and technology of tropical and subtropical fruits. Woodhead Publishing., 290–331e.
Yegon D., Ojijo N. K., Tybussek T., Owino W. (2023). Application of portable near-infrared spectroscopy for rapid detection and quantification of adulterants in baobab fruit pulp. Int. J. Food Sci. Technol 58, 1465–1473. doi: 10.1111/ijfs.16313
Keywords: chemometrics, total titratable acidity (TTA), total soluble solid (TSS), fruit maturity, non-destructive evaluation
Citation: Owino WO, Lanoi D, Imathiu S, Kahenya P, Nyonje WA and Yegon D (2024) Near-infrared spectrometry for rapid and real-time prediction of specific quality attributes in intact cactus pear fruits (Opuntia ficus-indica L.). Front. Hortic. 3:1457362. doi: 10.3389/fhort.2024.1457362
Received: 30 June 2024; Accepted: 18 November 2024;
Published: 10 December 2024.
Edited by:
Md Golam Ferdous Chowdhury, Bangladesh Agricultural Research Institute, BangladeshReviewed by:
Giovanni Gugliuzza, Council for Agricultural Research and Agricultural Economy Analysis | CREA, ItalyGiovanni Cabassi, Council for Agricultural Research and Agricultural Economy Analysis | CREA, Italy
Copyright © 2024 Owino, Lanoi, Imathiu, Kahenya, Nyonje and Yegon. This is an open-access article distributed under the terms of the Creative Commons Attribution License (CC BY). The use, distribution or reproduction in other forums is permitted, provided the original author(s) and the copyright owner(s) are credited and that the original publication in this journal is cited, in accordance with accepted academic practice. No use, distribution or reproduction is permitted which does not comply with these terms.
*Correspondence: Willis O. Owino, d2lsbGlzQGFnci5qa3VhdC5hYy5rZQ==
 Willis O. Owino
 Daisy Lanoi
 Samuel Imathiu
 Peter Kahenya
 Winnie A. Nyonje
 Dennis Yegon