 Xueke Feng
- 1College of Agriculture and Animal Husbandry, Qinghai University, Xining, China
- 2College of Ecological and Environment Science, Xining University, Xining, China
Quantitative assessment of the impacts of climate change and human activities on marsh wetland is essential for the sustainable development of marsh wetland ecosystem. This study takes the marsh wetland in the Yellow River source region (YRSR) as the research object, using the method of residual analysis, the potential net primary productivity (NPPp) of marsh wetland vegetation in the YRSR between 2000 and 2020 was stimulated using the Zhou Guangsheng model, and the actual primary productivity (NPPa) of marsh wetland vegetation was download from MOD17A3HGF product, and the difference between them was employed to calculate the NPP affected by human activities, the relative contribution of climate change and human activities to the change of NPPa of marsh wetland vegetation was quantitatively evaluated. The results revealed that between 2000 and 2020, NPPa of marsh wetland vegetation increased in the YRSR by 95.76%, among which climate-dominated and human-dominated NPP change occupied by 66.29% and 29.47% of study areas, respectively. The Zoige Plateau in the southeast accounted for the majority of the 4.24% decline in the NPPa of the marsh wetland vegetation, almost all of which were affected by human activities. It is found that the warming and humidifying of climate, as well as human protective construction activities, are the important reasons for the increase of NPPa of marsh wetland vegetation in the YRSR. Although climate change remains an important cause of the increase in NPPa of marsh wetland vegetation, the contribution of human activities to the increase in NPPa of marsh wetland vegetation is increasing.
1. Introduction
Typical alpine marsh wetland with the highest altitude in the world are distributed in the YRSR (Xue et al., 2018; Hou et al., 2020; Wang et al., 2020). These wetlands perform a variety of ecological functions, including carbon fixation and oxygen release, water conservation, climate regulation, and biodiversity maintenance (Yan et al., 2017); they have a significant impact on the sustainable development of society, economy, ecology, and water resources in the whole Yellow River basin (Dong et al., 2020; Qiu et al., 2021). However, the ecological environment in this region is fragile and sensitive to climate change (Tang and Lin, 2021). Since 1950, the Qinghai-Tibet Plateau has experienced significantly warming, which has led to the accelerated degradation of permafrost, reduced solid water reserves, and increased precipitation (Zhao et al., 2020; Zhang Q. et al., 2022), which makes the stability of the marsh wetland ecosystem in the YRSR worse; simultaneously, human activities, such as overgrazing, expansion of construction land, and peat mining have intensified (Liu et al., 2019; Pan et al., 2020); the marsh wetland in the YRSR have been degraded to varying degrees, with serious landscape fragmentation and decreased species diversity, posing a serious threat to the aquatic ecological function, frozen soil, and ecological environment in this area (Xiang et al., 2009; Li et al., 2018). With the strengthening of ecological environment protection and the regulation of relevant policies, the Chinese government has implemented a series of ecological protection and restoration projects since 2000, including turning grazing land back to green and establishing the Sanjiangyuan National Ecological Protection Area, especially the construction of the Yellow River Source National Park, which has improved the ecological environment in the YRSR (Du et al., 2015; Shao et al., 2017; Ma et al., 2022). However, the exact mechanism of the change in marsh wetland in the YRSR is still unknown because of the mutual interference and interaction between climate change and human activities. Therefore, it is necessary to quantitatively analyze the underlying mechanisms of marsh wetland change in the YRSR, quantify the relative contributions of climate change and human activities to marsh wetland change, and further guide the scientific protection and sustainable development of marsh wetland in the YRSR.
Net primary productivity, a crucial representation of ecosystem functioning, is the difference between the total quantity of organic matter that vegetation accumulates through photosynthesis over time and the cumulative respiration per unit of time (Yan, 2022). The NPP of vegetation also reveals obvious variability owing to the influence of climate change and human activities (Cloern et al., 2021). Numerous studies have estimated the difference between NPPp and NPPa of vegetation to represent the influence of human activities on vegetation change (NPPh), quantitatively evaluated the relative contributions of climate change and human activities to various changes in land cover (Yin et al., 2020). For instance, Xie et al. (2022) explained the relative contribution of climate change and human activities to desertification reversal in Mu Us Sandy Land in northern China by employing meteorological data and MODIS NPP products whose results revealed that human activities were the leading factors of desertification reversal in different periods; Zhang F. et al. (2022) quantitatively assessed the relative contributions of climate change and human activities to grassland NPP based on the changes of grassland NPP in the YRSR, and revealed that the contribution of human activities to the restoration of grassland is increasing; Li et al. (2021) examined the relative effects of climate change and human activities on the productivity of various vegetation in Northeast China, and found that human activities resulted in 53.84% reduced NPP in deciduous coniferous forests. Although there are lots of studies have quantified the impacts of climate change and human activities on vegetation changes on the Tibetan Plateau, most of them focus on grassland or forest ecosystems (Shen et al., 2022; Wang Y. F. et al., 2022). Until recently, the research on wetland ecosystems is scarce (Mao et al., 2014; Yan et al., 2022). The marsh ecosystem has unique environmental conditions, which may lead to obvious differences in the response of marsh wetland vegetation to climate change and human activities compared with other ecosystems (Shen et al., 2022). Climate change and human activities, as well as the degradation of marsh wetland habitat quality and the changes in marsh wetland plant communities, exhibit significant effects on the NPP of marsh wetland vegetation; therefore, the relative effects of climate change and human activities on marsh wetland vegetation could be quantitatively assessed by quantifying NPP of marsh wetland vegetation (Mao et al., 2014). It is crucial for the protection and management of alpine marsh wetland and even for global marsh changes.
In this process, the key to quantifying the NPP of marsh wetland vegetation is the accurate estimation of NPPp. NPPp reflects the effects of light, temperature, and water on the productivity of vegetation. NPPp is generally estimated by employing a climate-driven model. One of the reasonable models to estimate the global distribution of vegetation NPPp is the Miami model, which is a fitting model based on the correlation between measured data at stations and annual precipitation and annual average temperature (Lieth, 1975). However, vegetation NPPp is influenced by other climatic variables in addition to temperature and precipitation, Therefore, based on Miami model, Thornth- waite Memorial model considers actual evapotranspiration, while Chikugo model considers plant physiology and ecology, and uses parameters such as net radiation and radiation dryness, which is a semi-empirical and semi-theoretical NPP estimation model (Wang J. Y. et al., 2015). However, the climate-related models such as Miami model and Thornthwaite Memorial model were originally established by statistical regression between climate conditions and measured NPP, and the model parameters may need to be adjusted when applied to specific areas (Sun et al., 2017). Zhou Guangsheng model is based on the water utilization efficiency of vegetation which is determined by the ratio of the carbon dioxide flux equation (equivalent to NPP) to the water vapor flux equation (equivalent to evapotranspiration) on the surface of vegetation. According to the precipitation in China and the net radiation data obtained from the physical process of the influence of energy and water on evaporation, a regional evapotranspiration model corresponding to the energy balance equation and water balance equation has been derived, and a net primary productivity model of natural vegetation based on plant physiological and ecological characteristics has been established, which could help better represent the characteristics of vegetation in China (Zhou and Zhang, 1996; Chen et al., 2015).
Therefore, this study uses the marsh wetland in the YRSR as the research object, the NPPp of marsh wetland vegetation in the YRSR between 2000 and 2020 was stimulated using the Zhou Guangsheng model, and the NPPa of marsh wetland vegetation was download from MOD17A3HGF product, and to estimate the NPPh of marsh wetland vegetation by the difference between NPPp and NPPa. The main purpose of this study is to: (1) estimate and analyze the temporal and spatial distribution trends of NPPp, NPPa, and NPPh of marsh wetland vegetation in the YRSR between 2000 and 2020; (2) discuss the response of NPP of marsh wetland vegetation to climate change and human activities based on the temporal and spatial changes of climate factors and human factors of marsh wetland in the YRSR between 2000 and 2020; and (3) evaluate quantitatively the relative contribution of climate change and human activities to NPP change of marsh wetland vegetation in the YRSR between 2000 and 2020. The results of this research could serve as a theoretical and methodological foundation for the formulation of wetland management policies in this region and have various implications for further guiding the scientific protection and sustainable development of wetland resources in the YRSR.
2. Materials and methods
2.1. Study area
The YRSR is located on the eastern edge of the Qinghai-Tibet Plateau, which is defined as the basin above the Tangnaihai Hydrological Station. It comprises a total area of 12.21 km2 (95.9°E∼103.4°E, 32.2°N∼36.1°N) (Figure 1), accounting for 16.29% of the Yellow River basin area (Tang and Lin, 2021; Mo et al., 2022). According to the Köppen climate classification, the YRSR has a subarctic climate that is influenced by the monsoon and tundra climate with extreme seasonal precipitation, strong evaporation, and strong solar radiation. The YRSR is rainy, accompanied by short-term strong convection between July and September every year during the summer season, which is affected by the southwest monsoon in South Asia and Southeast Asia, and gradually becomes dry and cold between October and December during the winter season which is affected by the cold and high pressure of the Qinghai-Tibet Plateau (Yuan et al., 2020). The YRSR possesses complex landforms and diverse landscapes. The terrain is typically high in the central and western regions and low in the northeast and southeast, with an altitude drop of approximately 3800 m and an average altitude of over 4000 m. The western part is separated from the Jinsha River by the Bayan Har Mountains, while the northern part is the Animaqing Mountain, covered with glacier snow the majority of the year. Wetland is one of the primary ecosystems in the YRSR, including river, lake, marsh, and artificial wetland, in which the marsh wetland accounts for 82.36% of the total wetland area in the YRSR. The vegetation dominated by herbaceous marsh vegetation and aquatic vegetation, and the main species of marsh plants are Carex pseudosupina, Poa attenuata, and Kobresia tibetica, etc. (Liu et al., 2021).
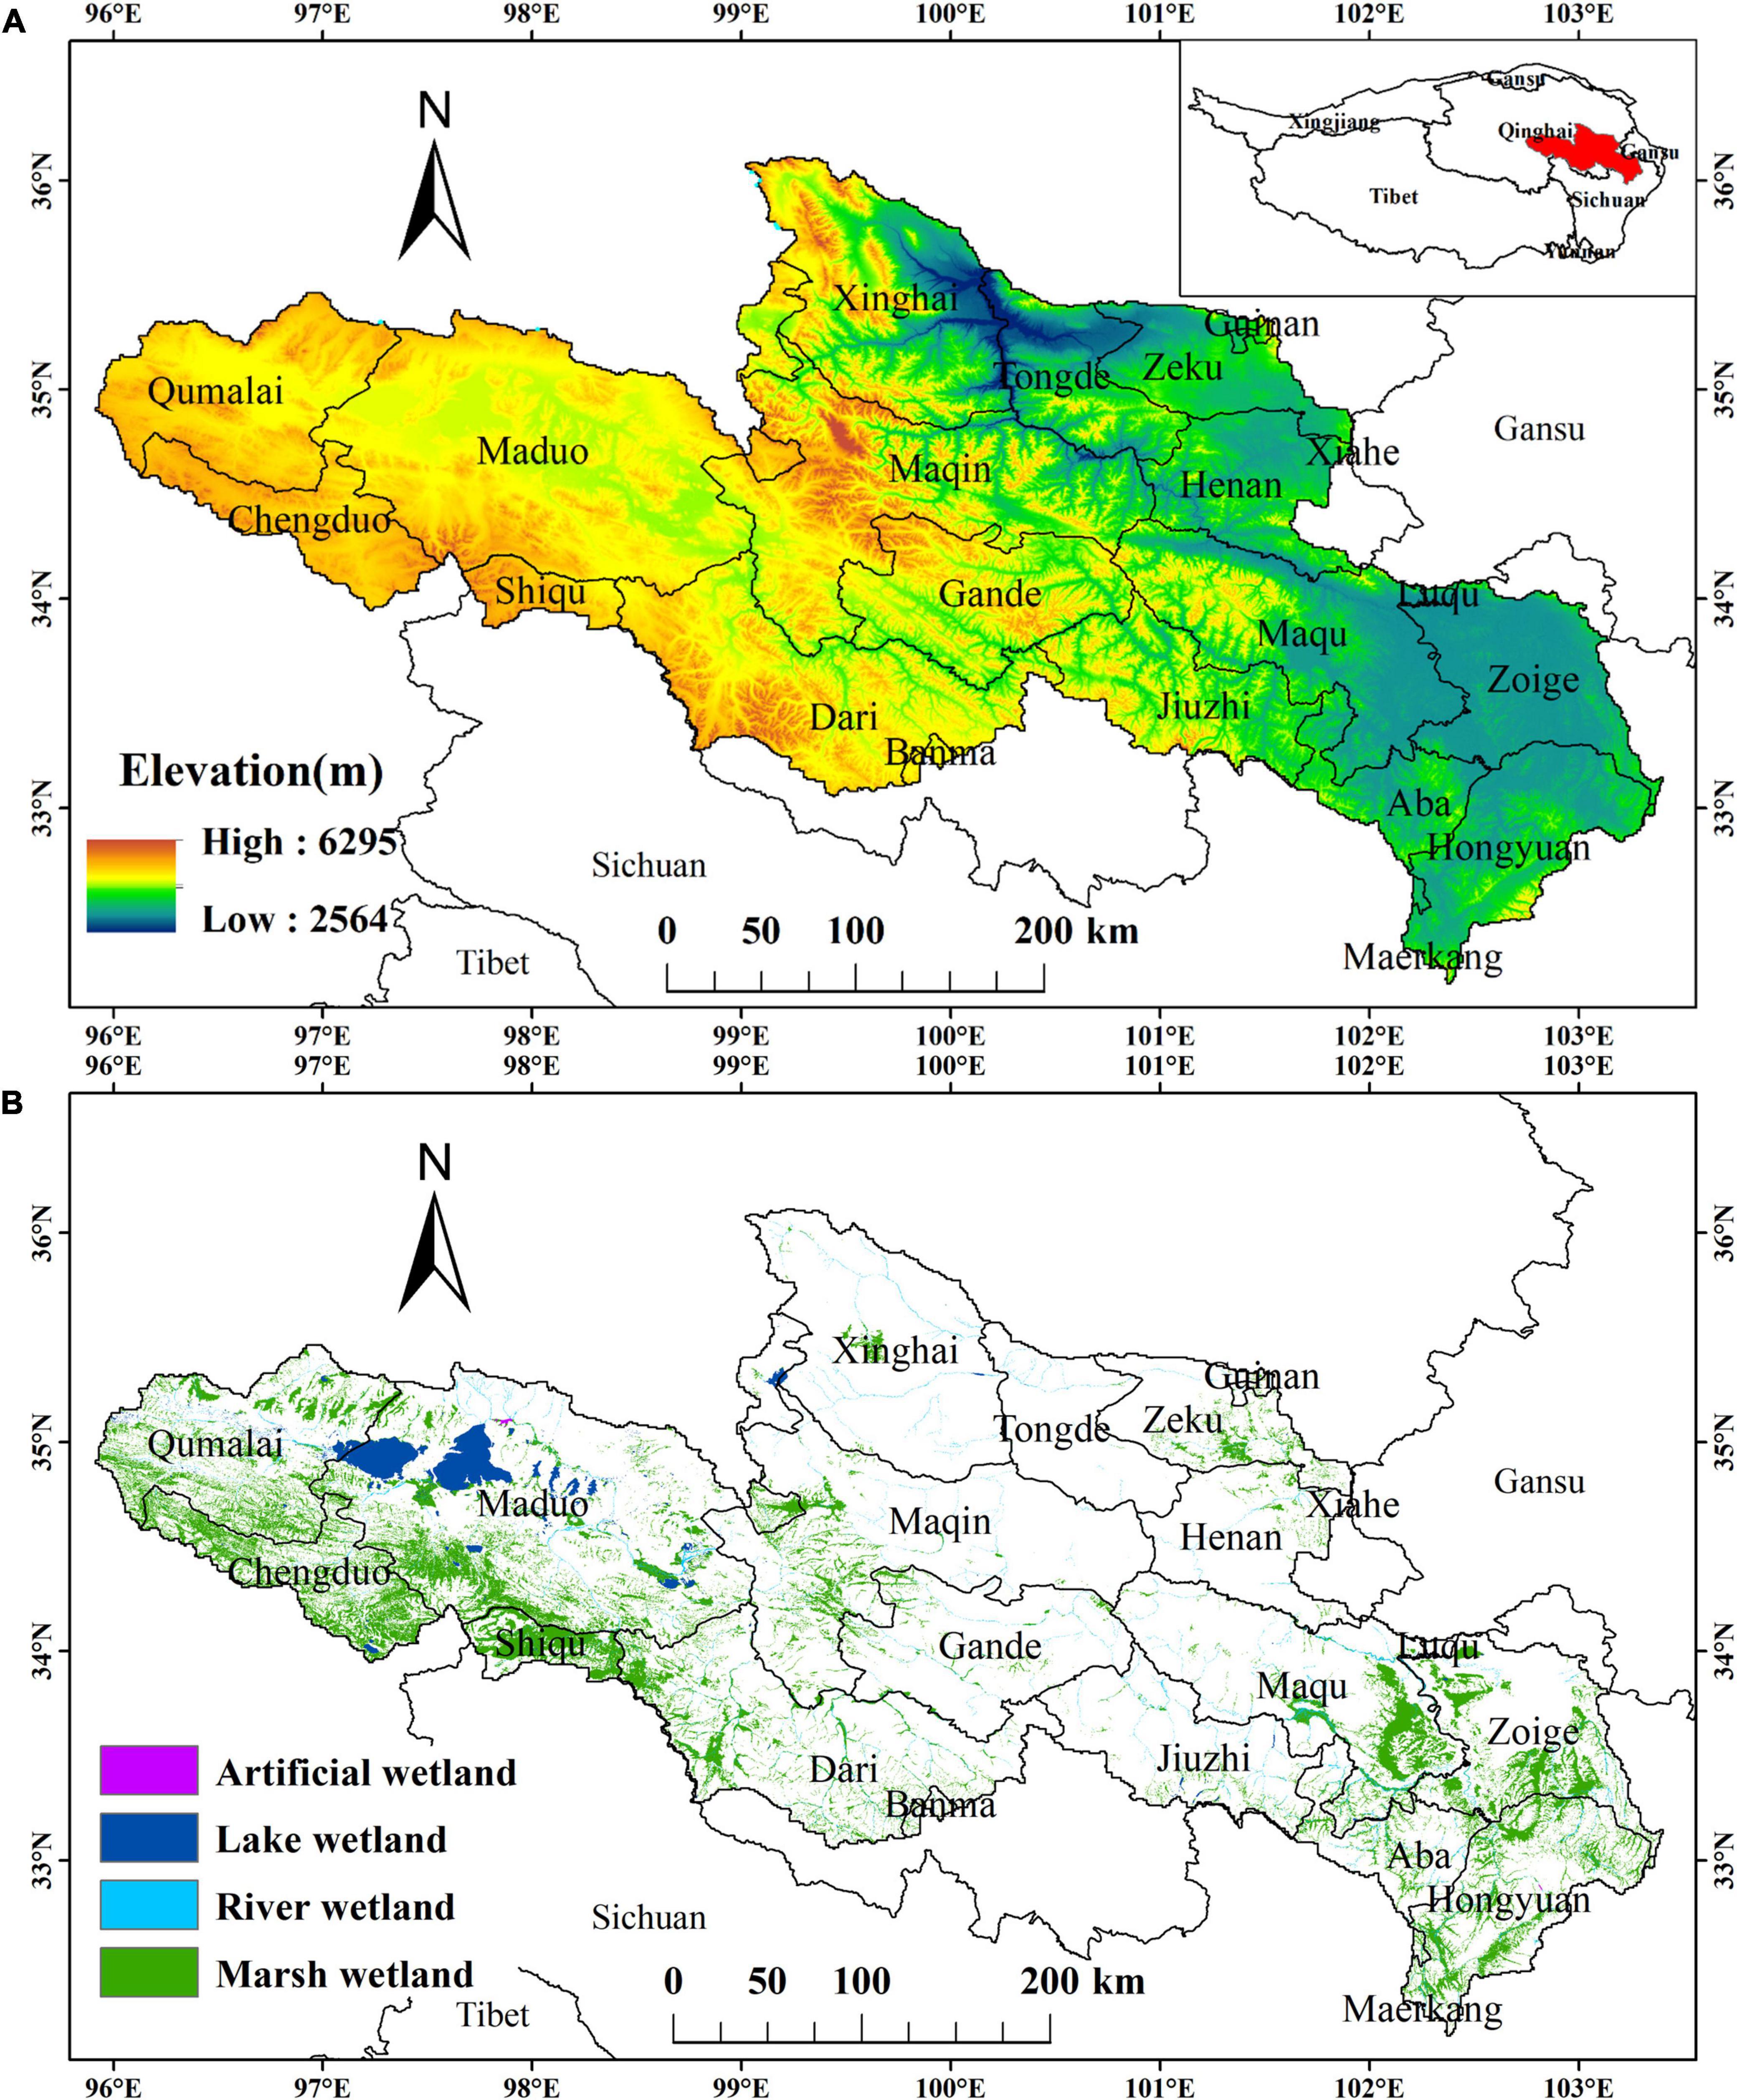
Figure 1. (A) The location and elevation of the YRSR. (B) Spatial distribution of wetland in the YRSR.
2.2. Data
The data employed in this study include marsh wetland distribution data, NPPa remote sensing data, and temperature and precipitation data. The marsh distribution data is the 2015 China marsh wetland spatial distribution dataset obtained from the National Science and Technology Basic Platform-National Earth System Science Data Center.1 The data were classified using Landsat-8 OLI remote sensing images with a spatial resolution of 30 m. The decision tree method was used to classify the wetland objects step by step, and the classification results were checked and corrected by merging them with a large number of field survey samples. The classification accuracy was 95% (Mao et al., 2020).
The remote sensing image data of NPPa was obtained from the MOD17A3HGF product, which was a MODIS image with a spatial resolution of 500 m. The NPP was synthesized by calculating the net photosynthesis (PSN) every 8 days, which was the difference between the total primary productivity and the respiratory maintenance value. The annual total as the NPPa data between 2000 and 2020 was calculated using Google Earth Engine (GEE) platform to calculate,2 which finally covers the marsh wetland in the YRSR.
The meteorological data, including temperature and precipitation data, were obtained from the National Earth System Science Data Center, National Science and Technology Infrastructure of China (see text footnote 1). This dataset was based on the Global 0.5°climate data released by Climatic Research Unit (CRU) and the global high-resolution climate data released by WorldClim. It was obtained through delta spatial downscaling and verified by 496 independent meteorological observation points, with a spatial resolution of 1 km (Peng et al., 2019). ArcGIS V10.8 (developed by Environmental Systems Research Institute, Inc., Redlands, CA, USA) was employed to calculate the average annual temperature and annual precipitation of the marsh wetland in the YRSR between 2000 and 2020.
The data of human activities are mainly the statistics of the number of livestock and population at the county level in the study area from 2000 to 2020, which comes from the Statistical Yearbook3 of each county. In order to unify the expression, the conversion coefficient is used to convert different livestock into standard sheep units, and the conversion coefficient refers to the Calculation of Proper Carrying Capacity of Rangelands in the Agricultural Industry Standard of China.
To facilitate the unified data processing, ArcMap V10.8 software was used to reprogram the aforementioned data to the WGS-84 coordinate system, and the spatial resolution was resampled to 30 m.
2.3. Methods
2.3.1. Mann-Kendall (MK) test
Mann-Kendall test, as a non-parametric statistical method to detect the trend of variables, has been widely used to study the abrupt change and trend change characteristics of time series of climatic and hydrological elements, such as temperature, precipitation, and runoff, as well as their grid-scale spatio-temporal data. Its advantage is that it does not require samples to follow a certain distribution, and it is unaffected by a few outliers. It is more suitable for type and order variables. In this study, it is used to estimate the changing trend of climate factors and NPP of marsh wetland in the YRSR between 2000 and 2020. The following formula was used to calculate the MK test (Gao and Jin, 2022; Ogunsola and Dilau, 2022):
where n represents the length of the time series, and i is 2000, 2001,…, 2020, and S is the test statistic, and Var(S) is the variance of S, and sgn (Xj-Xi) is a symbolic function, the value is 1, 0 or −1. Zs is MK test statistics, Under a given significance level α, when | Zs| > u1–α /2, the time series data of the study were at α level. Significant changes were generally taken as α = 0.05. When | Zs| > 1.96, the time series had a significance α < 0.05, and | Zs| < 1.96 denotes significance α > 0.05. The MK text of this study was implemented by Rstudio-2022.07.2−576 (developed by Delaware Public Benefit Corporation, Boston, MA, USA).
2.3.2. Estimating NPP
In this study, the NPPp of wetland vegetation in the YRSR was calculated employing the Zhou Guangsheng model, and the difference between NPPp and NPPa was estimated to represent NPPh. Zhou Guangsheng’s model is as follows (Zhou and Zhang, 1996):
Where NPPp represents the potential net primary productivity and RDI the radiation index of dryness. P denotes the annual precipitation (mm), PER the potential evapotranspiration rate, BT the annual average temperature (°C), and T the monthly mean temperature (°C).
The formula for calculating NPPh is as follows:
Where NPPh represents the net primary productivity affected by human activities, with NPPh > 0 indicating that NPP is decreased by human activities; NPPp is the potential net primary productivity, calculated by the formula (5); NPPa is the actual net primary productivity obtained from the annual synthetic data of MOD17A3HGF. Estimation of NPP was performed using ArcMap V10.8 and Envi V5.3 (produced by Exelis Visual Information Solutions).
2.3.3. Slope of marsh wetland NPP and climate factors
In each marsh wetland pixel in the study area, slope trend analysis was employed to determine the changing trend of vegetation NPP and climate factors between 2000 and 2020. The calculation formula is as follows (Ma et al., 2022; Yan et al., 2022):
Where Slope is the changing trend between 2000 and 2020, X is the vegetation NPP (NPPp, NPPa, and NPPh) or climate factors (temperature and precipitation) in the i-th year, and i = 1, 2, 3, …, 20. n represents the time between 2000 and 2020. Slope> 0 denotes an increasing trend, while Slope 0 denotes a decreasing trend. The slope analysis of this study was based on ArcMap V10.8.
2.3.4. Correlation analysis
To further analyze the relationship between climate change and NPP change in wetland vegetation, this study measured the correlation between climate factors and NPP change in wetland vegetation based on the correlation coefficient, which was calculated as follows (Shen et al., 2019):
Where r is the correlation coefficient; n = 21, representing the time span between 2000 and 2020; xi is the NPP value of the i-th year, yi is the climate value (temperature or precipitation) of the i-th year, and ˉxis the average annual NPP value, ˉy is the multi-year climatic average. The Correlation analysis of this research is realized by Matlab R2016b (developed by the Mathworks, Inc., Natick, MA, USA).
2.3.5. Contribution rate analysis
The contribution rate analysis was employed to clarify the relative contributions of climate factors and human activities to NPP changes of marsh wetland vegetation in the YRSR. The reasons for NPP changes were examined in accordance with the slope changes of NPPp, NPPa, and NPPh of marsh wetland vegetation, as depicted in the following Table 1 (Xu et al., 2010).
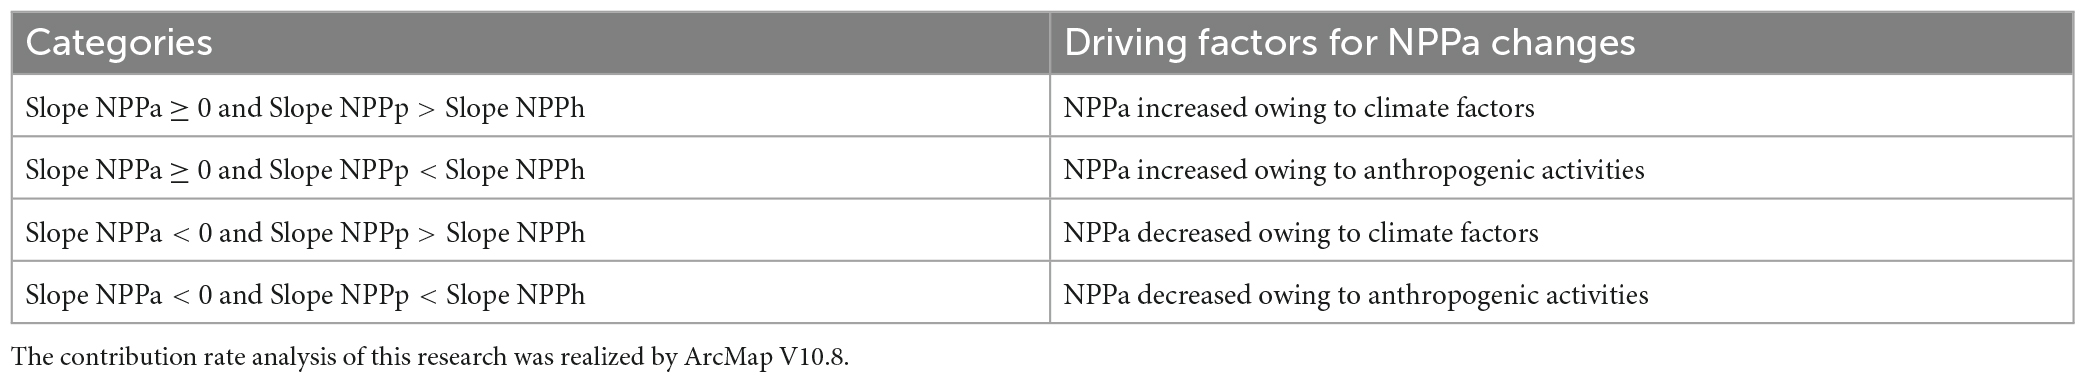
Table 1. Different categories of driving factors for NPPa changes.
3. Results
3.1. Climate change in the YRSR between 2000 and 2020
According to the change analysis of climatic factors of marsh wetland in the YRSR between 2000 and 2020 (Figure 2), the average annual temperature of marsh wetland in the YRSR was −3.51°C, with a minimum temperature of −4.20°C (in 2000) and a maximum temperature of −3.07°C (in 2009). The overall fluctuation of the annual average temperature displayed an insignificant upward trend (z-score > 1.96, P-value < 0.05). The average temperature increase rate in 21 years was 0.16°C/10a in accordance with the linear fitting equation. Between 2000 and 2020, the average annual precipitation of marsh wetland in the YRSR was 558.03 mm, with a minimum precipitation of 464.73 mm (in 2002) and a maximum precipitation of 663.35 mm (in 2018). The overall fluctuation of the average annual precipitation displayed an insignificant upward trend (z-score > 1.96, P-value < 0.05). The average precipitation increase rate in 21 years was 48.57 mm/10a in accordance with the linear fitting equation.
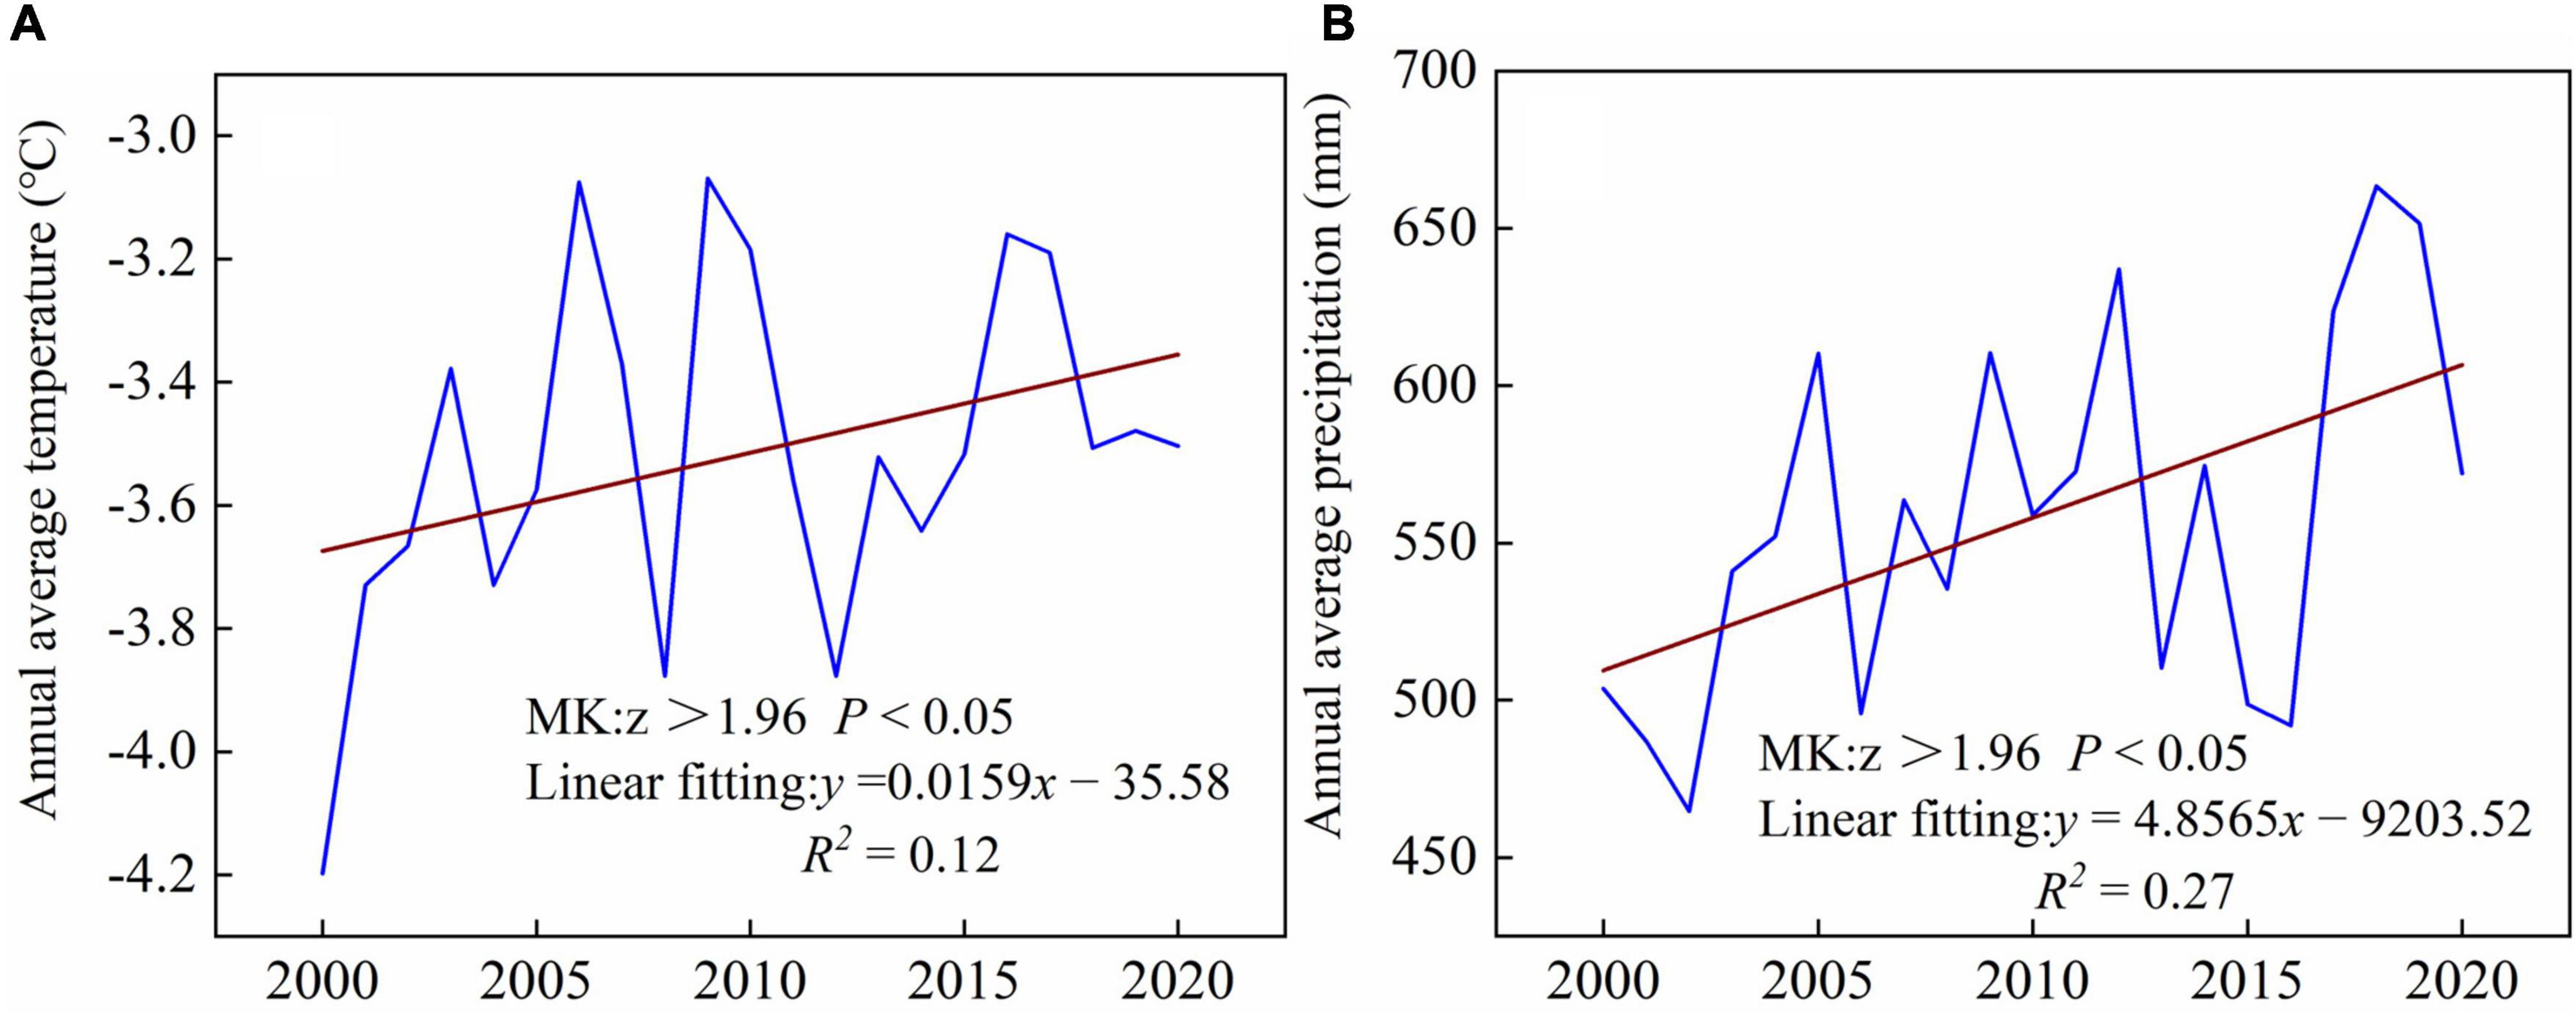
Figure 2. Variations in climate factors of marsh wetland in the YRSR between 2000 and 2020. (A) The annual variation in average annual average temperature. (B) The interannual variation in annual precipitation.
The average annual temperature of marsh wetland in the YRSR exhibited apparent spatial heterogeneity over the last 21 years according to the spatial distribution (Figure 3). The temperature centered on Mount Animaqing in the central region and increased to the periphery. The temperature revealed a decreasing trend from southeast to northwest, with higher temperatures in the north and southeast regions and lower temperatures in the central and western regions. Overall, 83.64% of the regional temperatures exhibited an increasing trend. The spatial heterogeneity of the average annual precipitation of marsh wetland in the YRSR was apparent, exhibiting a decreasing trend from east to west. In contrast to the southeast, the precipitation in the northwest was lower. The variation trend of precipitation was consistent with the spatial distribution of precipitation, and the increment of precipitation decreased from east to west. Overall, between 2000 and 2020, the marsh wetland in the YRSR exhibited a warming and humidifying trend.
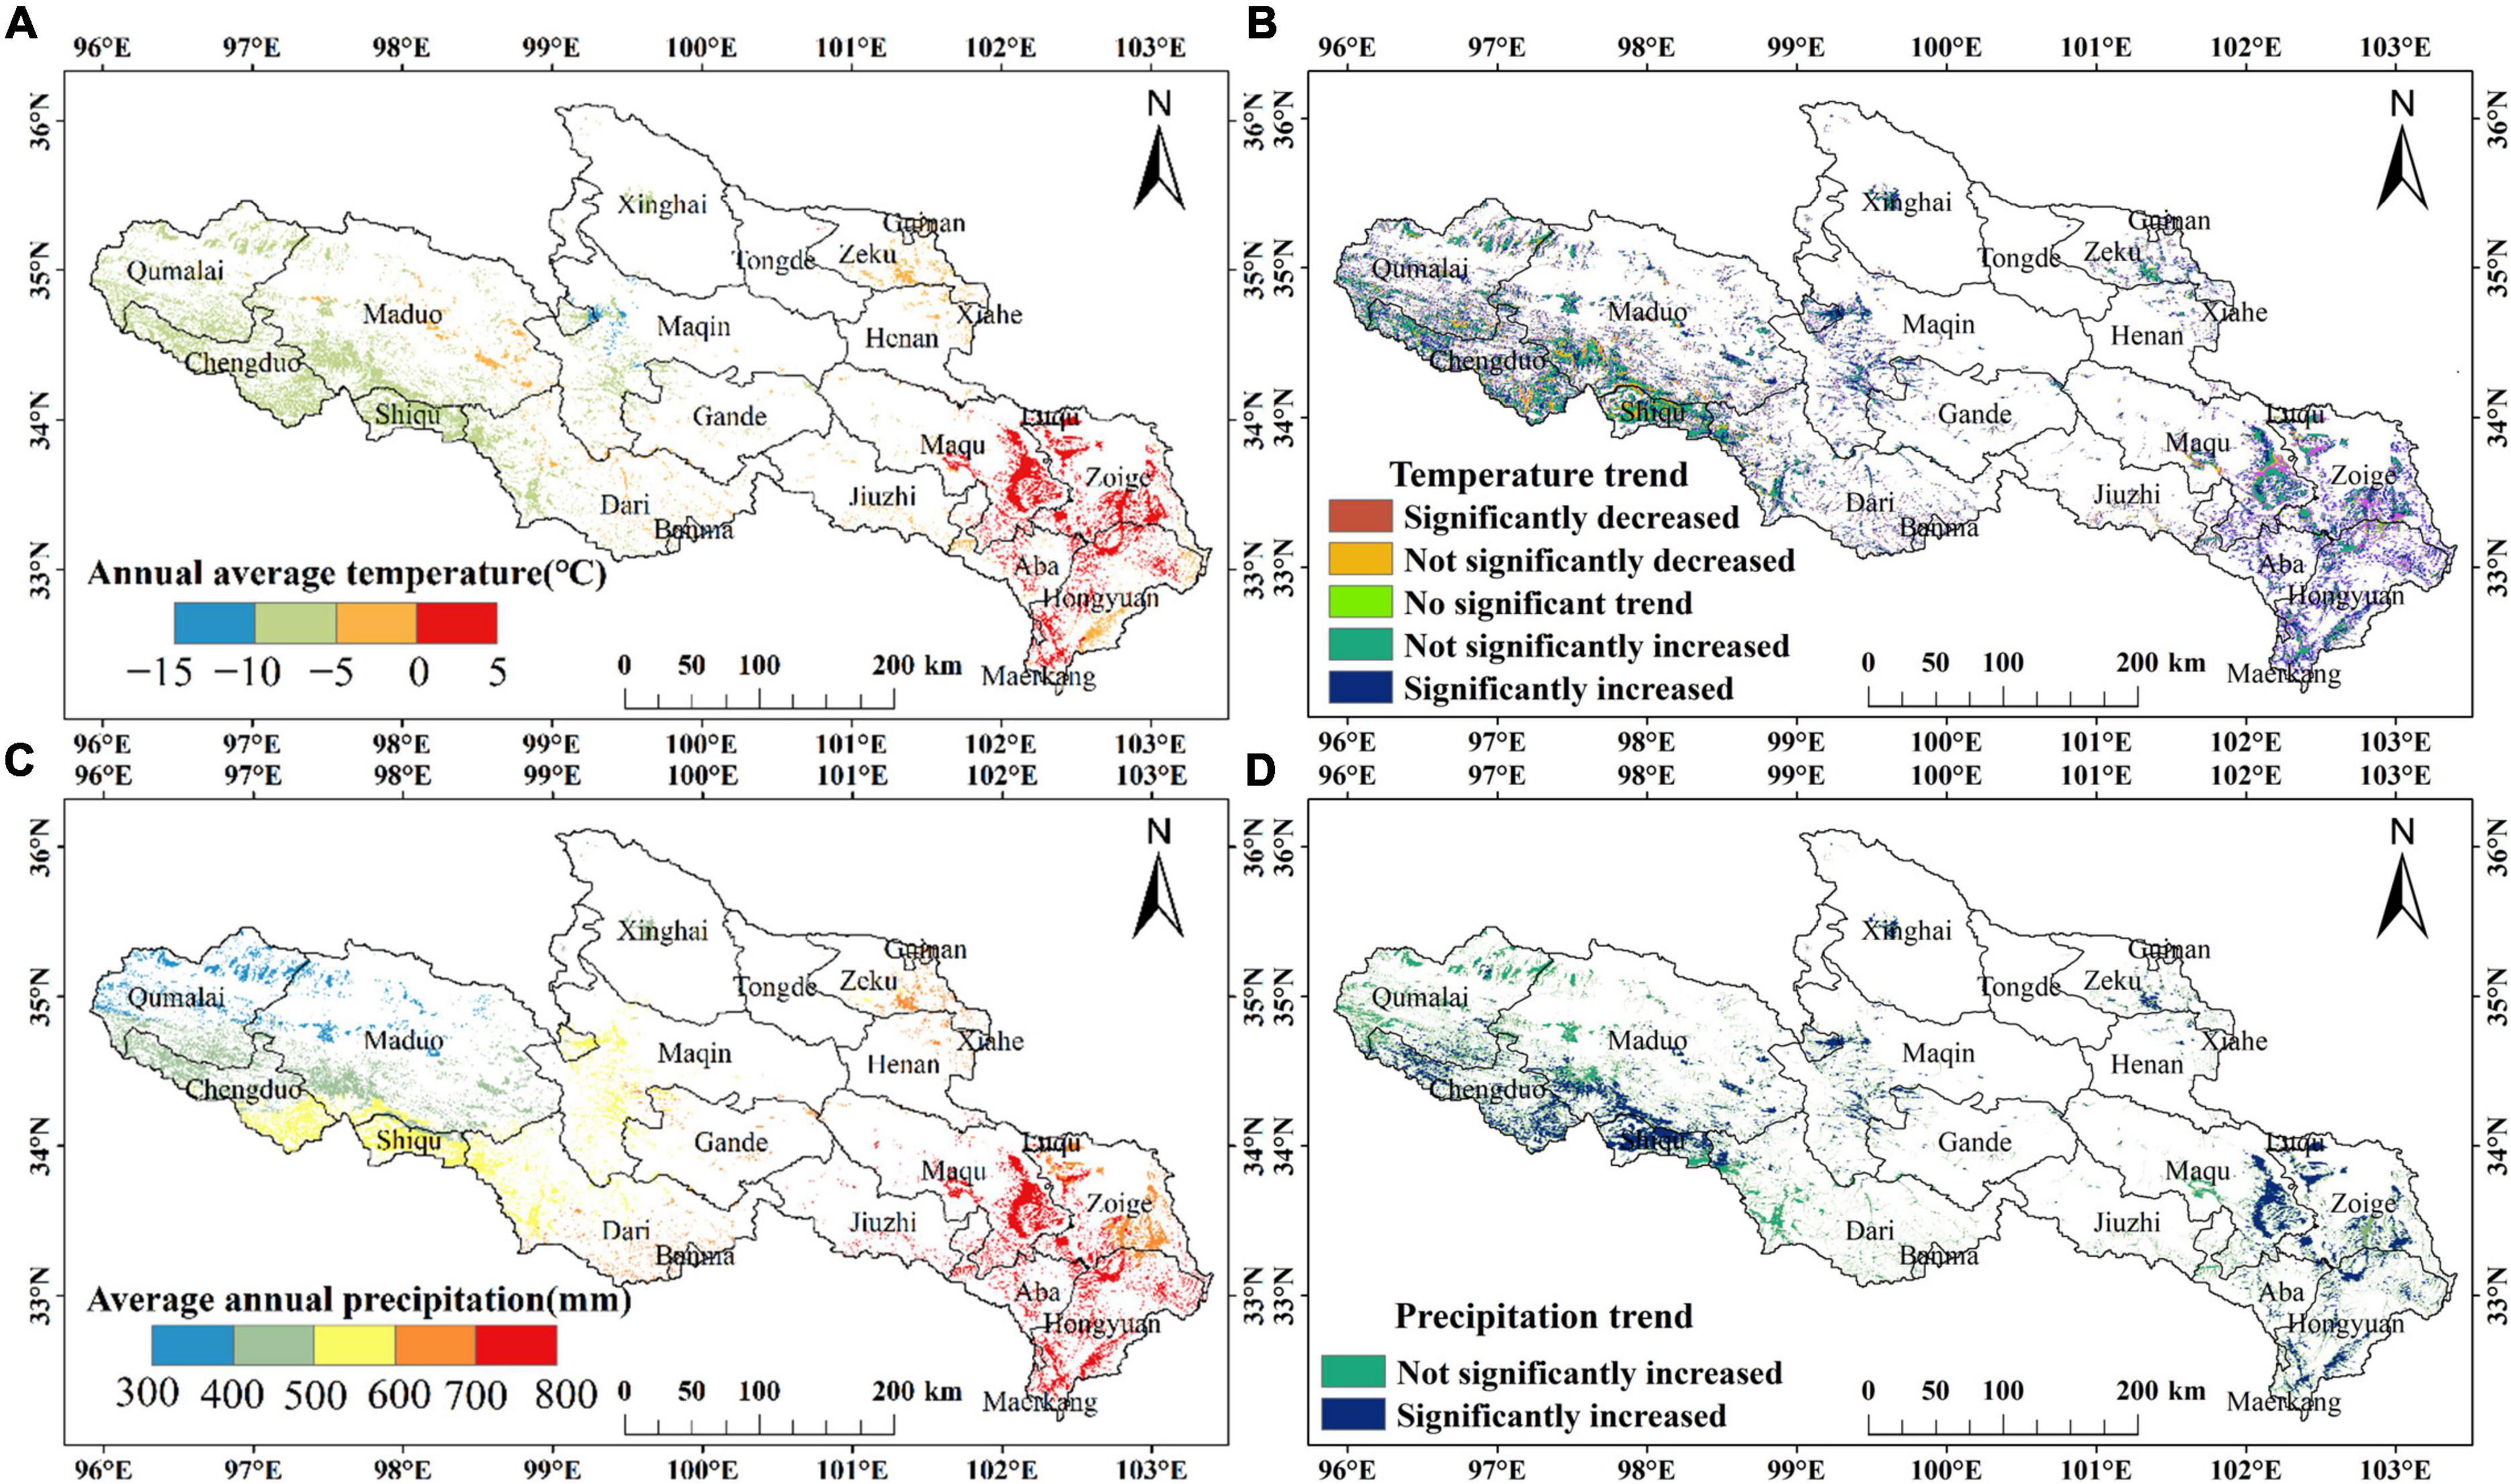
Figure 3. Spatial distribution in climate factors of marsh wetland in the YRSR between 2000 and 2020. (A) Average annual temperature. (B) Average annual temperature changing trend. (C) Average annual precipitation. (D) Average annual precipitation changing trend.
3.2. Human activities in the YRSR between 2000 and 2020
The population in the YRSR increased from 42.40 × 10⁴ in 2000 to 56.94 × 10⁴ in 2020, with an increase of 34.29%. The number of livestock increased from 1297.50 × 104 in 2000 to 1392.90 × 104 in 2020, with an increase of 7.35% (Figure 4). The number of livestock units per person decreased from 30.60 to 24.46, with a decrease of 25.10%. From 2000 to 2020, the population of the counties in the YRSR generally showed an increasing trend, among which Maqin County, Maqu County and Gande County increased the most; 52.87% of the areas in the YRSR have increased the number of livestock, mainly distributed in the Zoige Plateau in the southeast of the YRSR, while the decreased areas were mainly distributed in Maqin County, Gande county and Maduo county in the middle and west of the YRSR; 76.01% of the areas in the YRSR have decreased the number of livestock units per person, mainly distributed in Maqin County, Gande County and Maduo County in the middle and south of the YRSR, while the number of livestock units per person in Aba County, Hongyuan County and Zoige County in the southeast of the YRSR has increased.
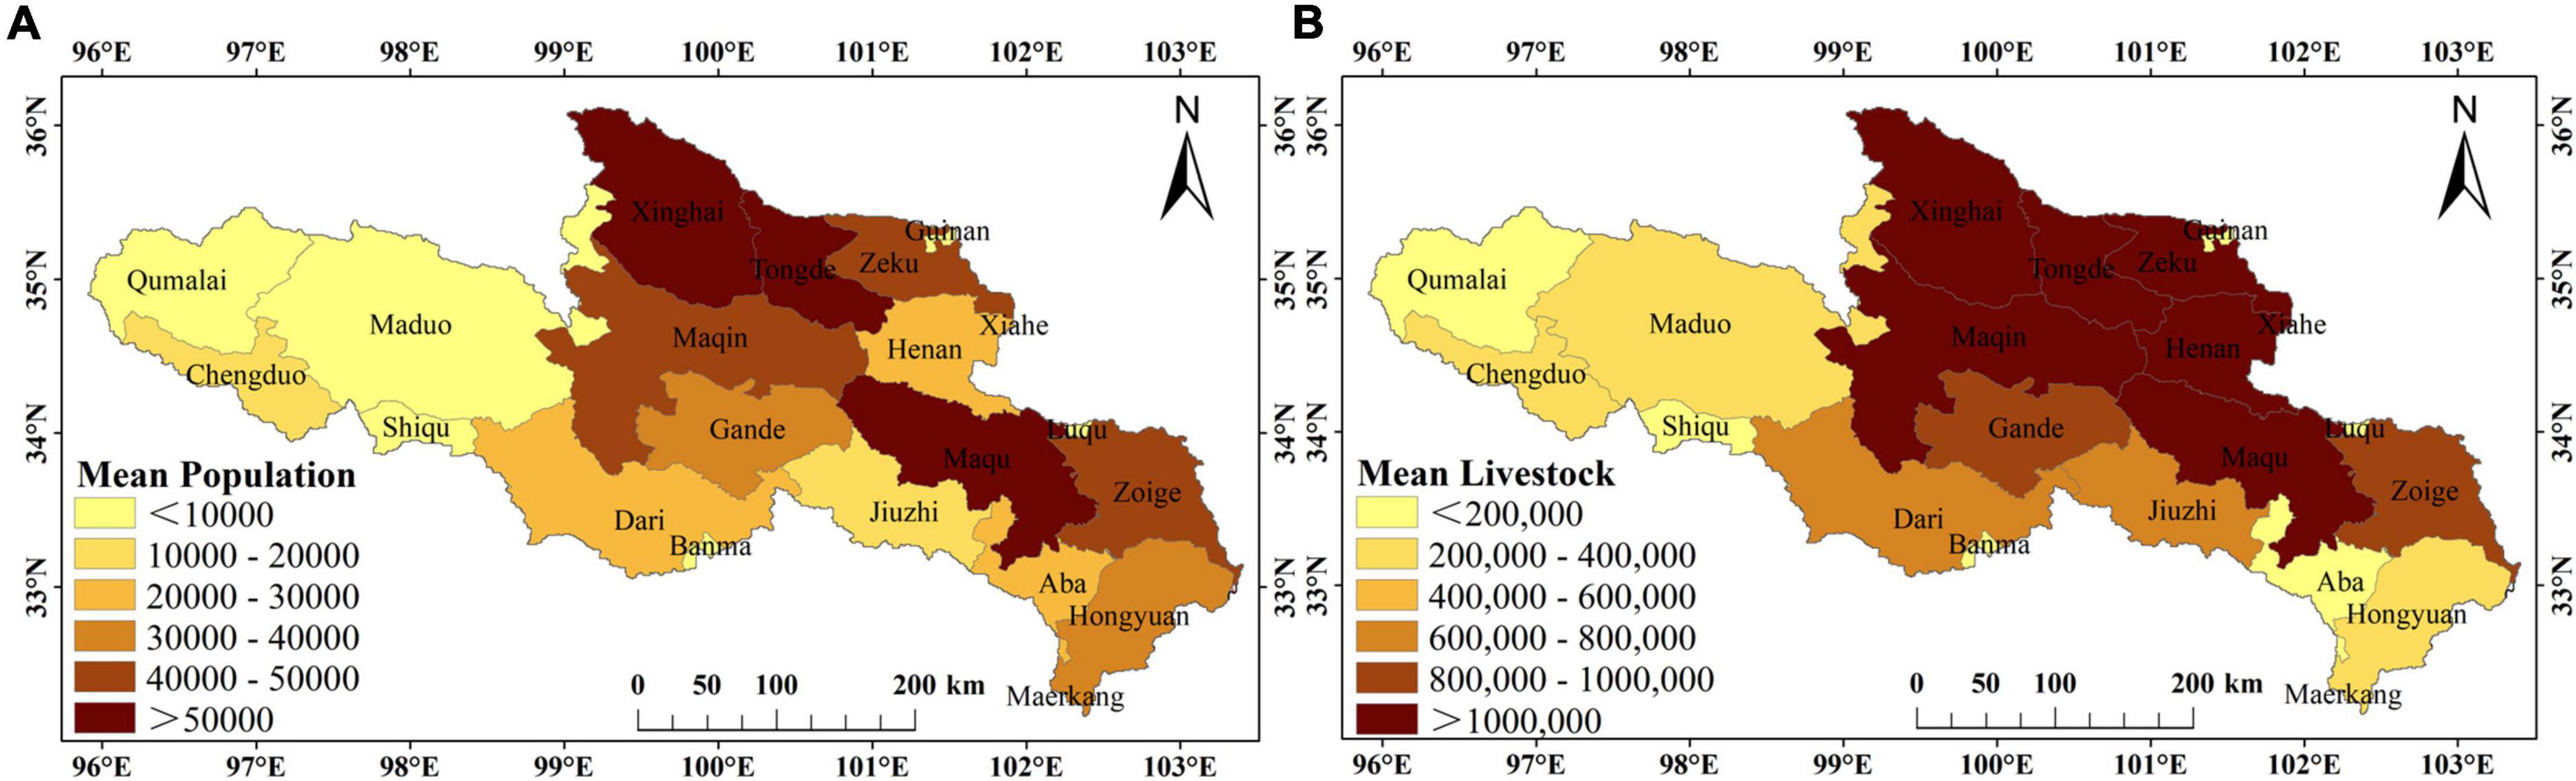
Figure 4. Spatial distribution of population and livestock in YRSR from 2000 to 2020. (A) Population from 2000 to 2020. (B) Livestock from 2000 to 2020.
3.3. NPP changes of marsh wetland vegetation in the YRSR between 2000 and 2020
Between 2000 and 2020, NPPp and NPPa of marsh wetland vegetation in the YRSR exhibited a consistently increasing trend, while NPPh exhibited a decreasing trend (negative value indicates that human activities have a positive impact on NPP increase) (Figure 5). Among them, NPPp was the lowest in 2002, at 63.21 gC/m2, and the highest in 2018, at 101.93 gC/m2, with a multi-year average of 82.23 gC/m2; the NPPa was the lowest in 2003, at 201.75 gC/m2, and the highest in 2006 at 252.71 gC/m2, with a multi-year average of 224.53 gC/m2; the NPPh was the lowest in 2006, at −178.00 gC/m2, and the highest in 2003, at −120.86 gC/m2, with a multi-year average of −143.36 gC/m2. Overall, between 2000 and 2020, the NPPp of marsh wetland vegetation in the YRSR was smaller in comparison to NPPa, and the NPP of marsh wetland vegetation in the YRSR was supplemented by human activities and exhibited an increasing trend, which demonstrated that human activities had a positive effect on the NPP of marsh wetland vegetation in the YRSR.
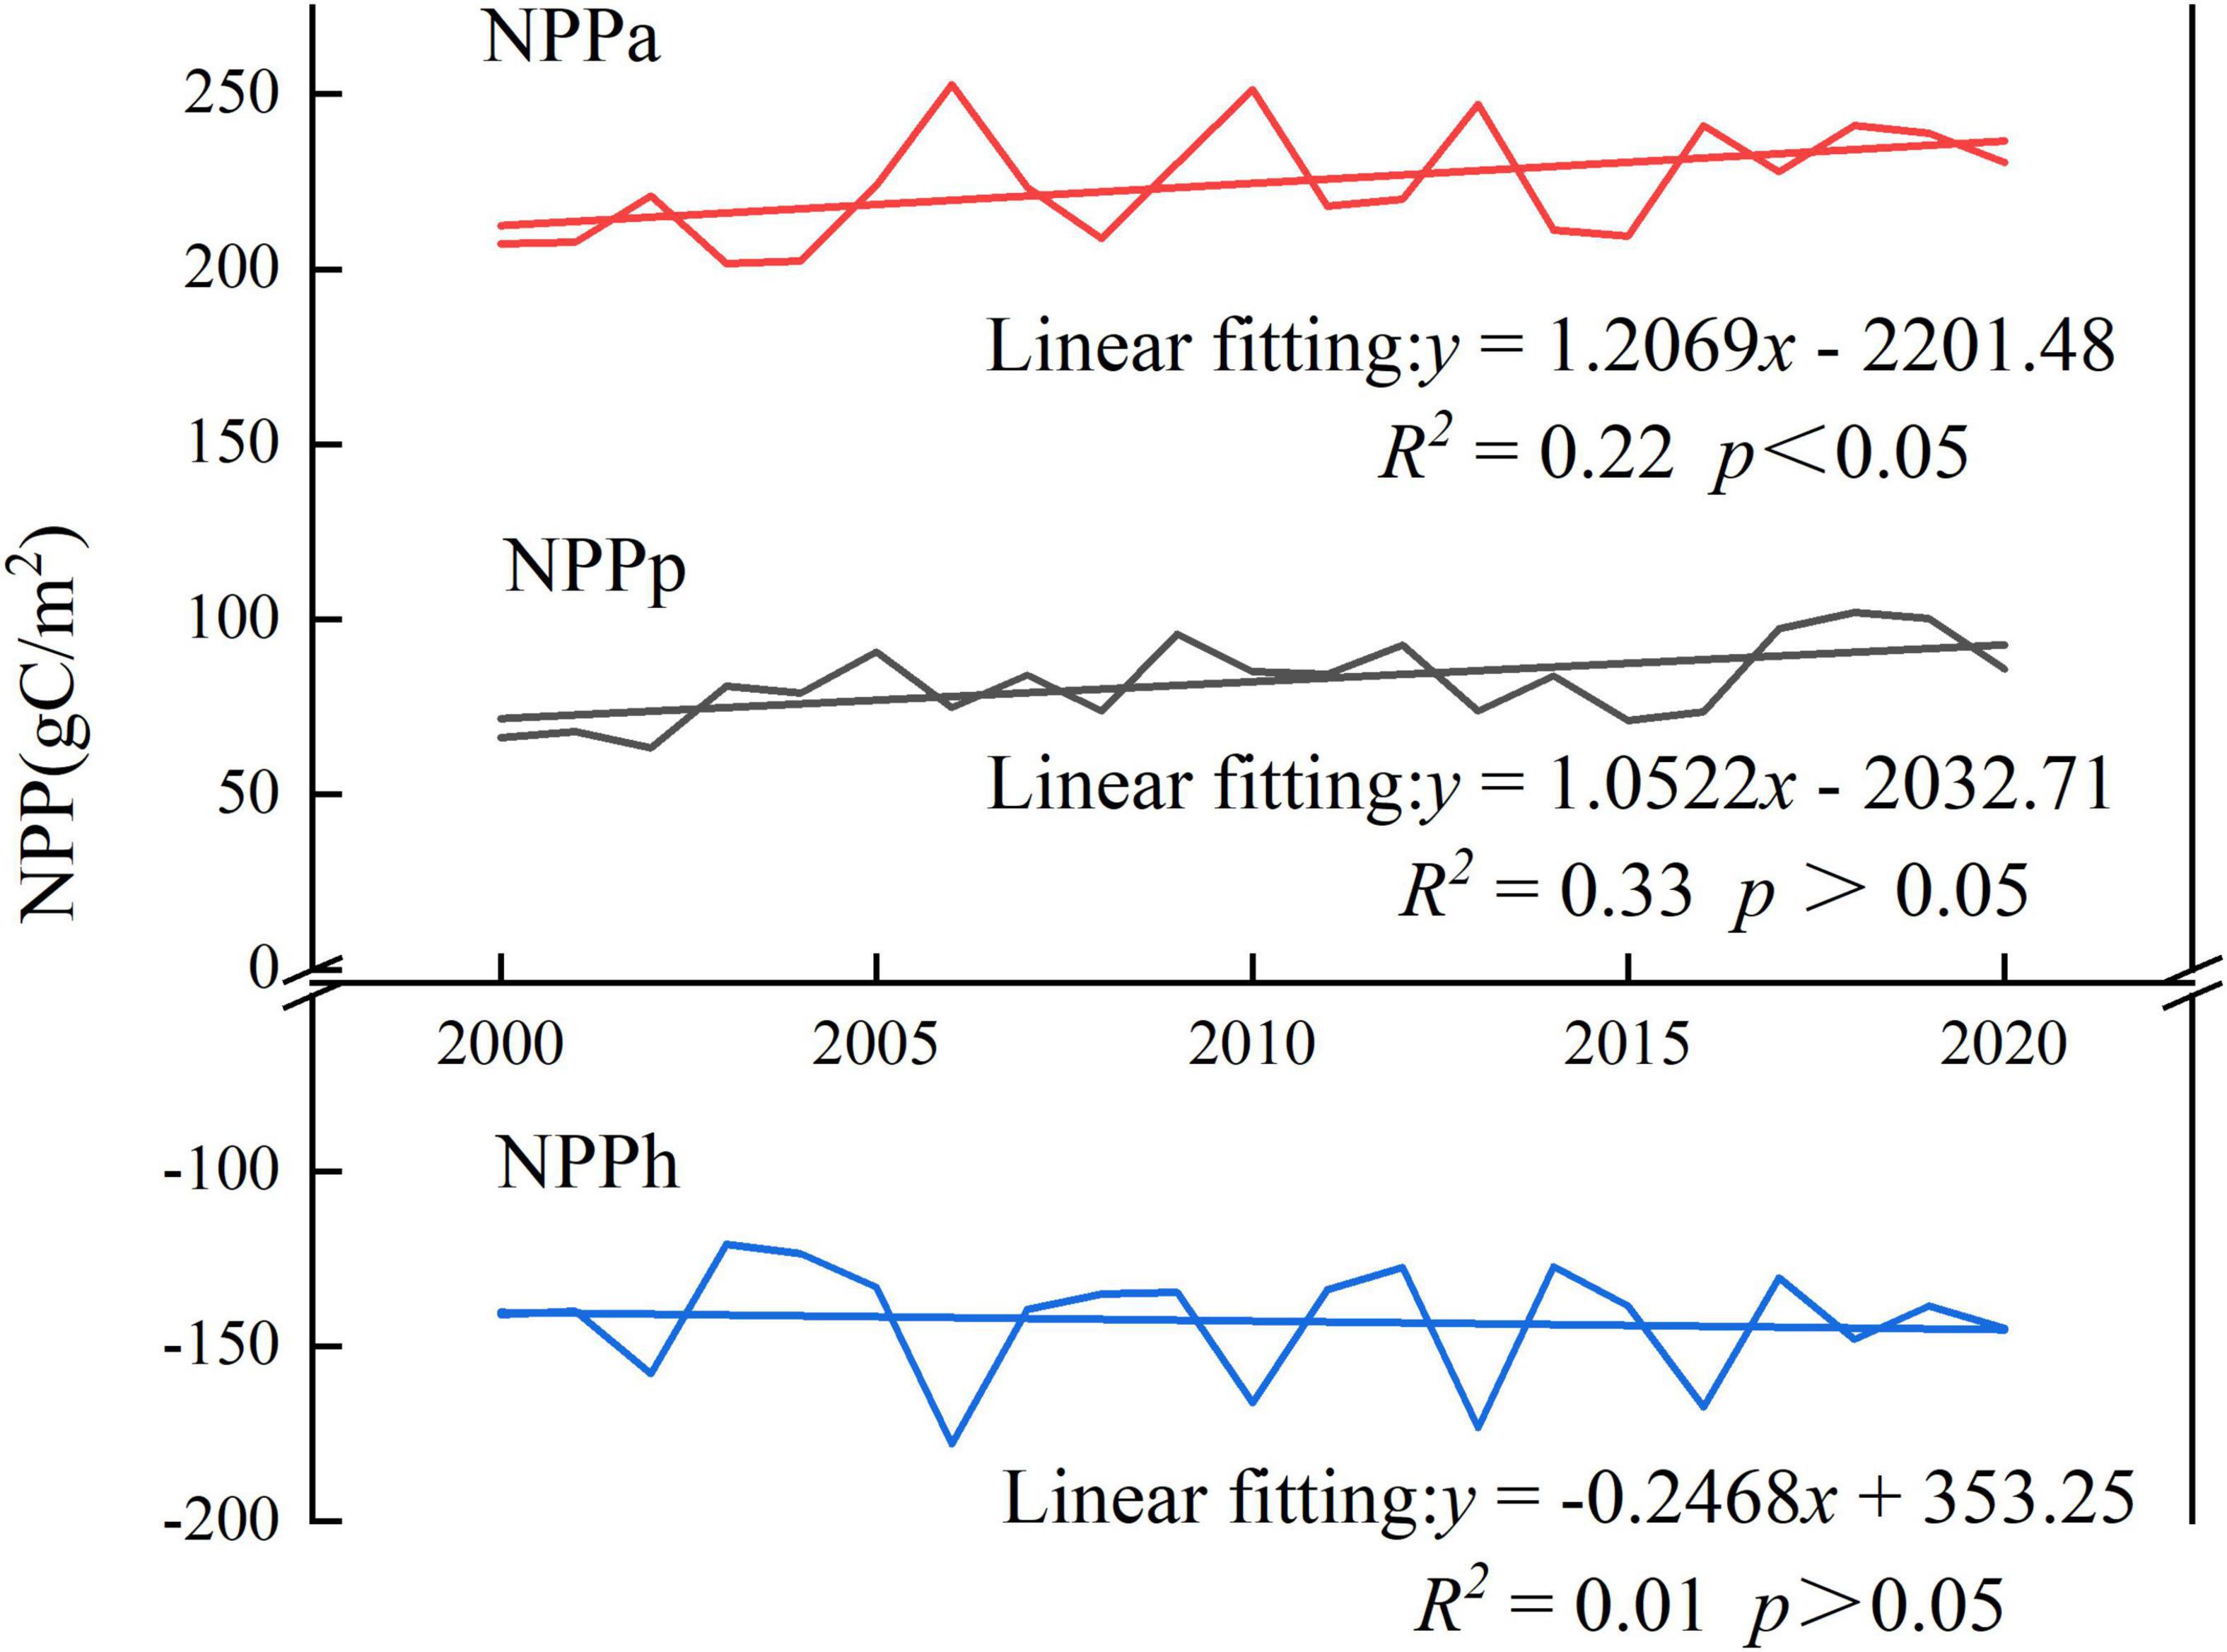
Figure 5. Variations of NPP of wetland vegetation in the YRSR between 2000 and 2020.
According to the spatial distribution (Figure 6), between 2000 and 2020, NPPp of the marsh wetland vegetation in the YRSR had the same spatial heterogeneity as NPPa, exhibiting the spatial characteristics of the decreasing trend from southeast to northwest, while NPPh exhibiting the spatial characteristics of the increasing trend from southeast to northwest. According to slope analysis, the average NPPp of marsh wetland vegetation in the YRSR increased by 1.05 gC/m2a between 2000 and 2020, accounting for 100% of the increased area, and the increase rate in the southeast region of the YRSR was significantly higher in comparison to that in the northwest region. NPPa increased by 1.21 gC/m2a on average, accounting for 95.79% of the increased area, and the decreased area was primarily distributed in the Zoige Plateau. The average decrease of NPPh was 0.25 gC/m2a, and the decreased area accounted for 67.18%; the increased area was concentrated in the Zoige Plateau, located in the southeast of the YRSR. In general, the NPP of marsh wetland vegetation in the YRSR was increasing, and NPPp exhibited a similar spatial distribution pattern to NPPa but was considerably different from NPPh. In comparison to the changing trend of NPP of marsh wetland vegetation in the YRSR, the increase of NPPa was greater than NPPp, which demonstrated that human activities have a positive impact on the NPP of marsh wetland vegetation. However, the area where NPPa decreases was approximately the same as where NPPh increases, primarily distributed in the Zoige Plateau located in the southeast of the YRSR, which indicated that there is an adverse impact of human activities in this region on the NPP of marsh wetland vegetation.
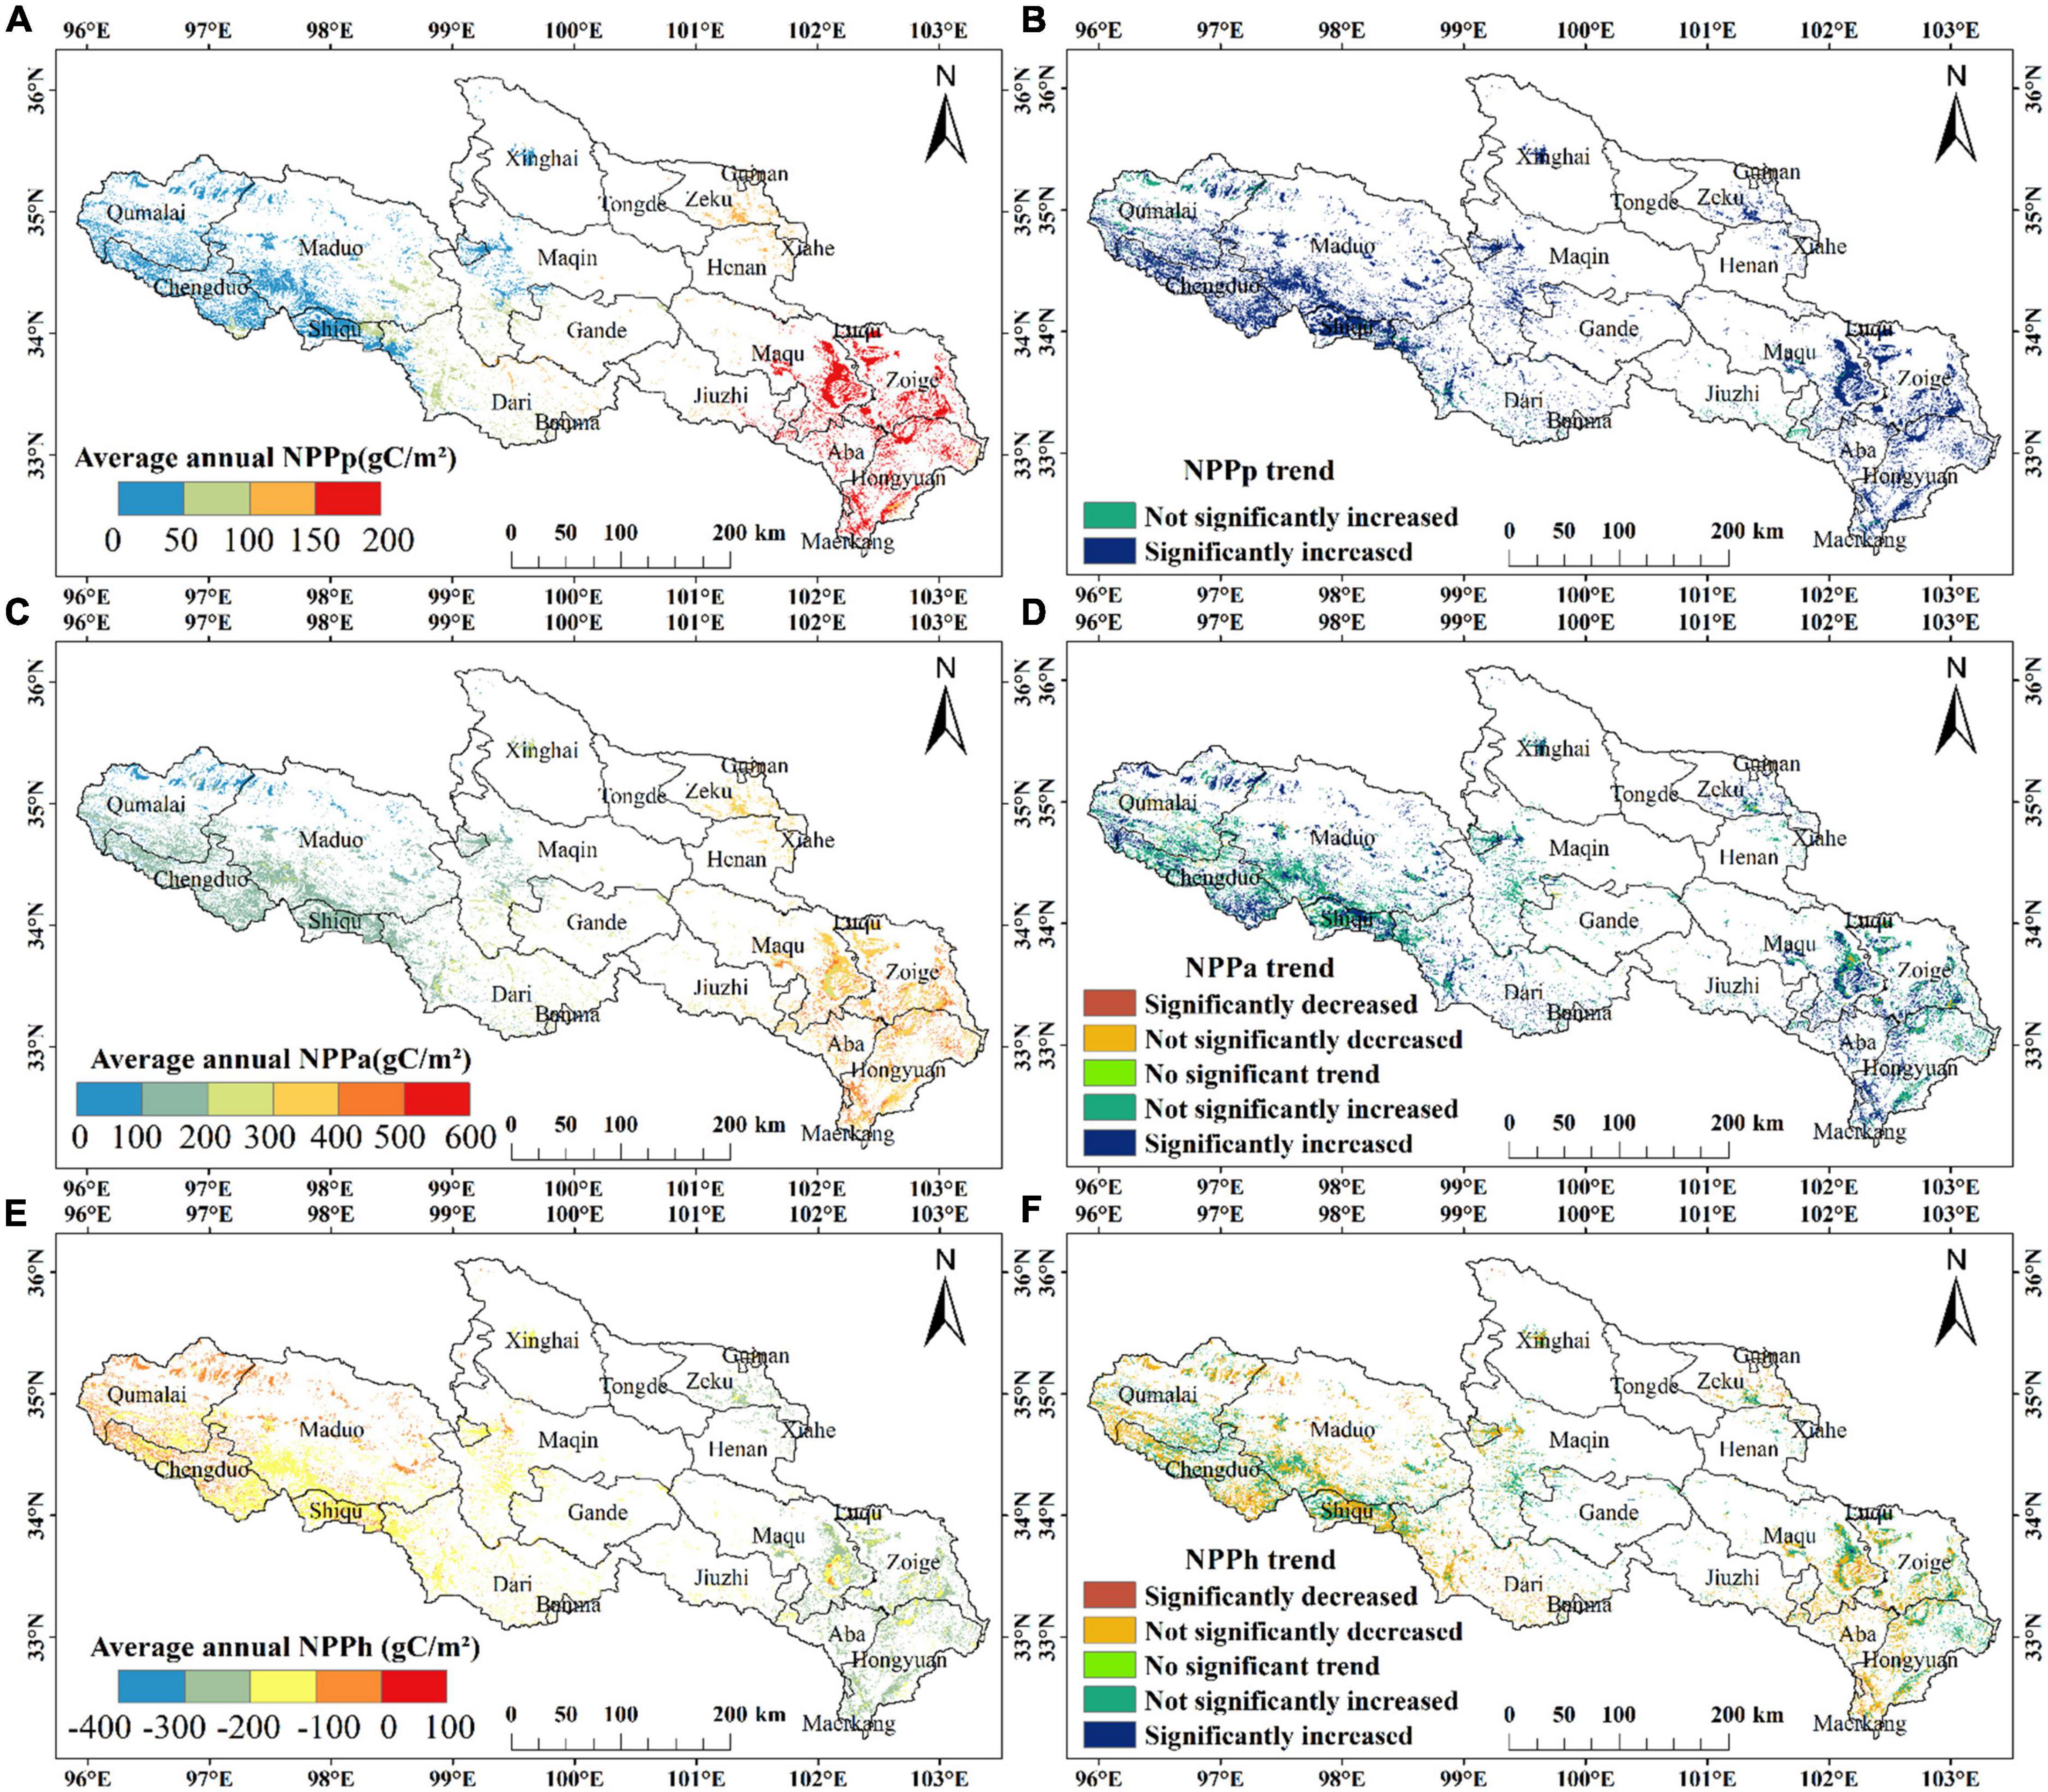
Figure 6. Spatial distribution of NPP of marsh wetland vegetation in the YRSR between 2000 and 2020. (A) NPPp between 2000 and 2020. (B) NPPp changing trend. (C) NPPa between 2000 and 2020. (D) NPPa changing trend. (E) NPPh between 2000 and 2020. (F) NPPh changing trend.
3.4. Correlation between climate factors, human activities, and NPP
3.4.1. Correlation analysis between climate factors and NPP
According to the correlation analysis between the NPP of marsh wetland vegetation and climate factors in the YRSR from 2000 to 2020 (Figure 7), the correlation coefficient between NPPa and temperature was between −0.82 and 0.79, with an average correlation coefficient being 0.01, and 50.85% of NPPa was positively correlated with temperature; the average correlation coefficient between NPPa and precipitation was between −0.83 and 0.78, with an average correlation coefficient being 0.11, and 41.93% of NPPa was positively correlated with precipitation. The correlation coefficient between NPPh and temperature was between −0.79 and 0.79, with an average correlation coefficient being 0.11, and 49.76% of NPPh was positively correlated with temperature; the correlation coefficient between NPPh and precipitation was between −0.79 and 1, with an average correlation coefficient being 0.32, and 75.62% of NPPh was positively correlated with precipitation. Overall, the correlation between NPP and precipitation of marsh wetland vegetation in the YRSR was higher in comparison to that between NPP and temperature, but the degree of correlation was relatively low.
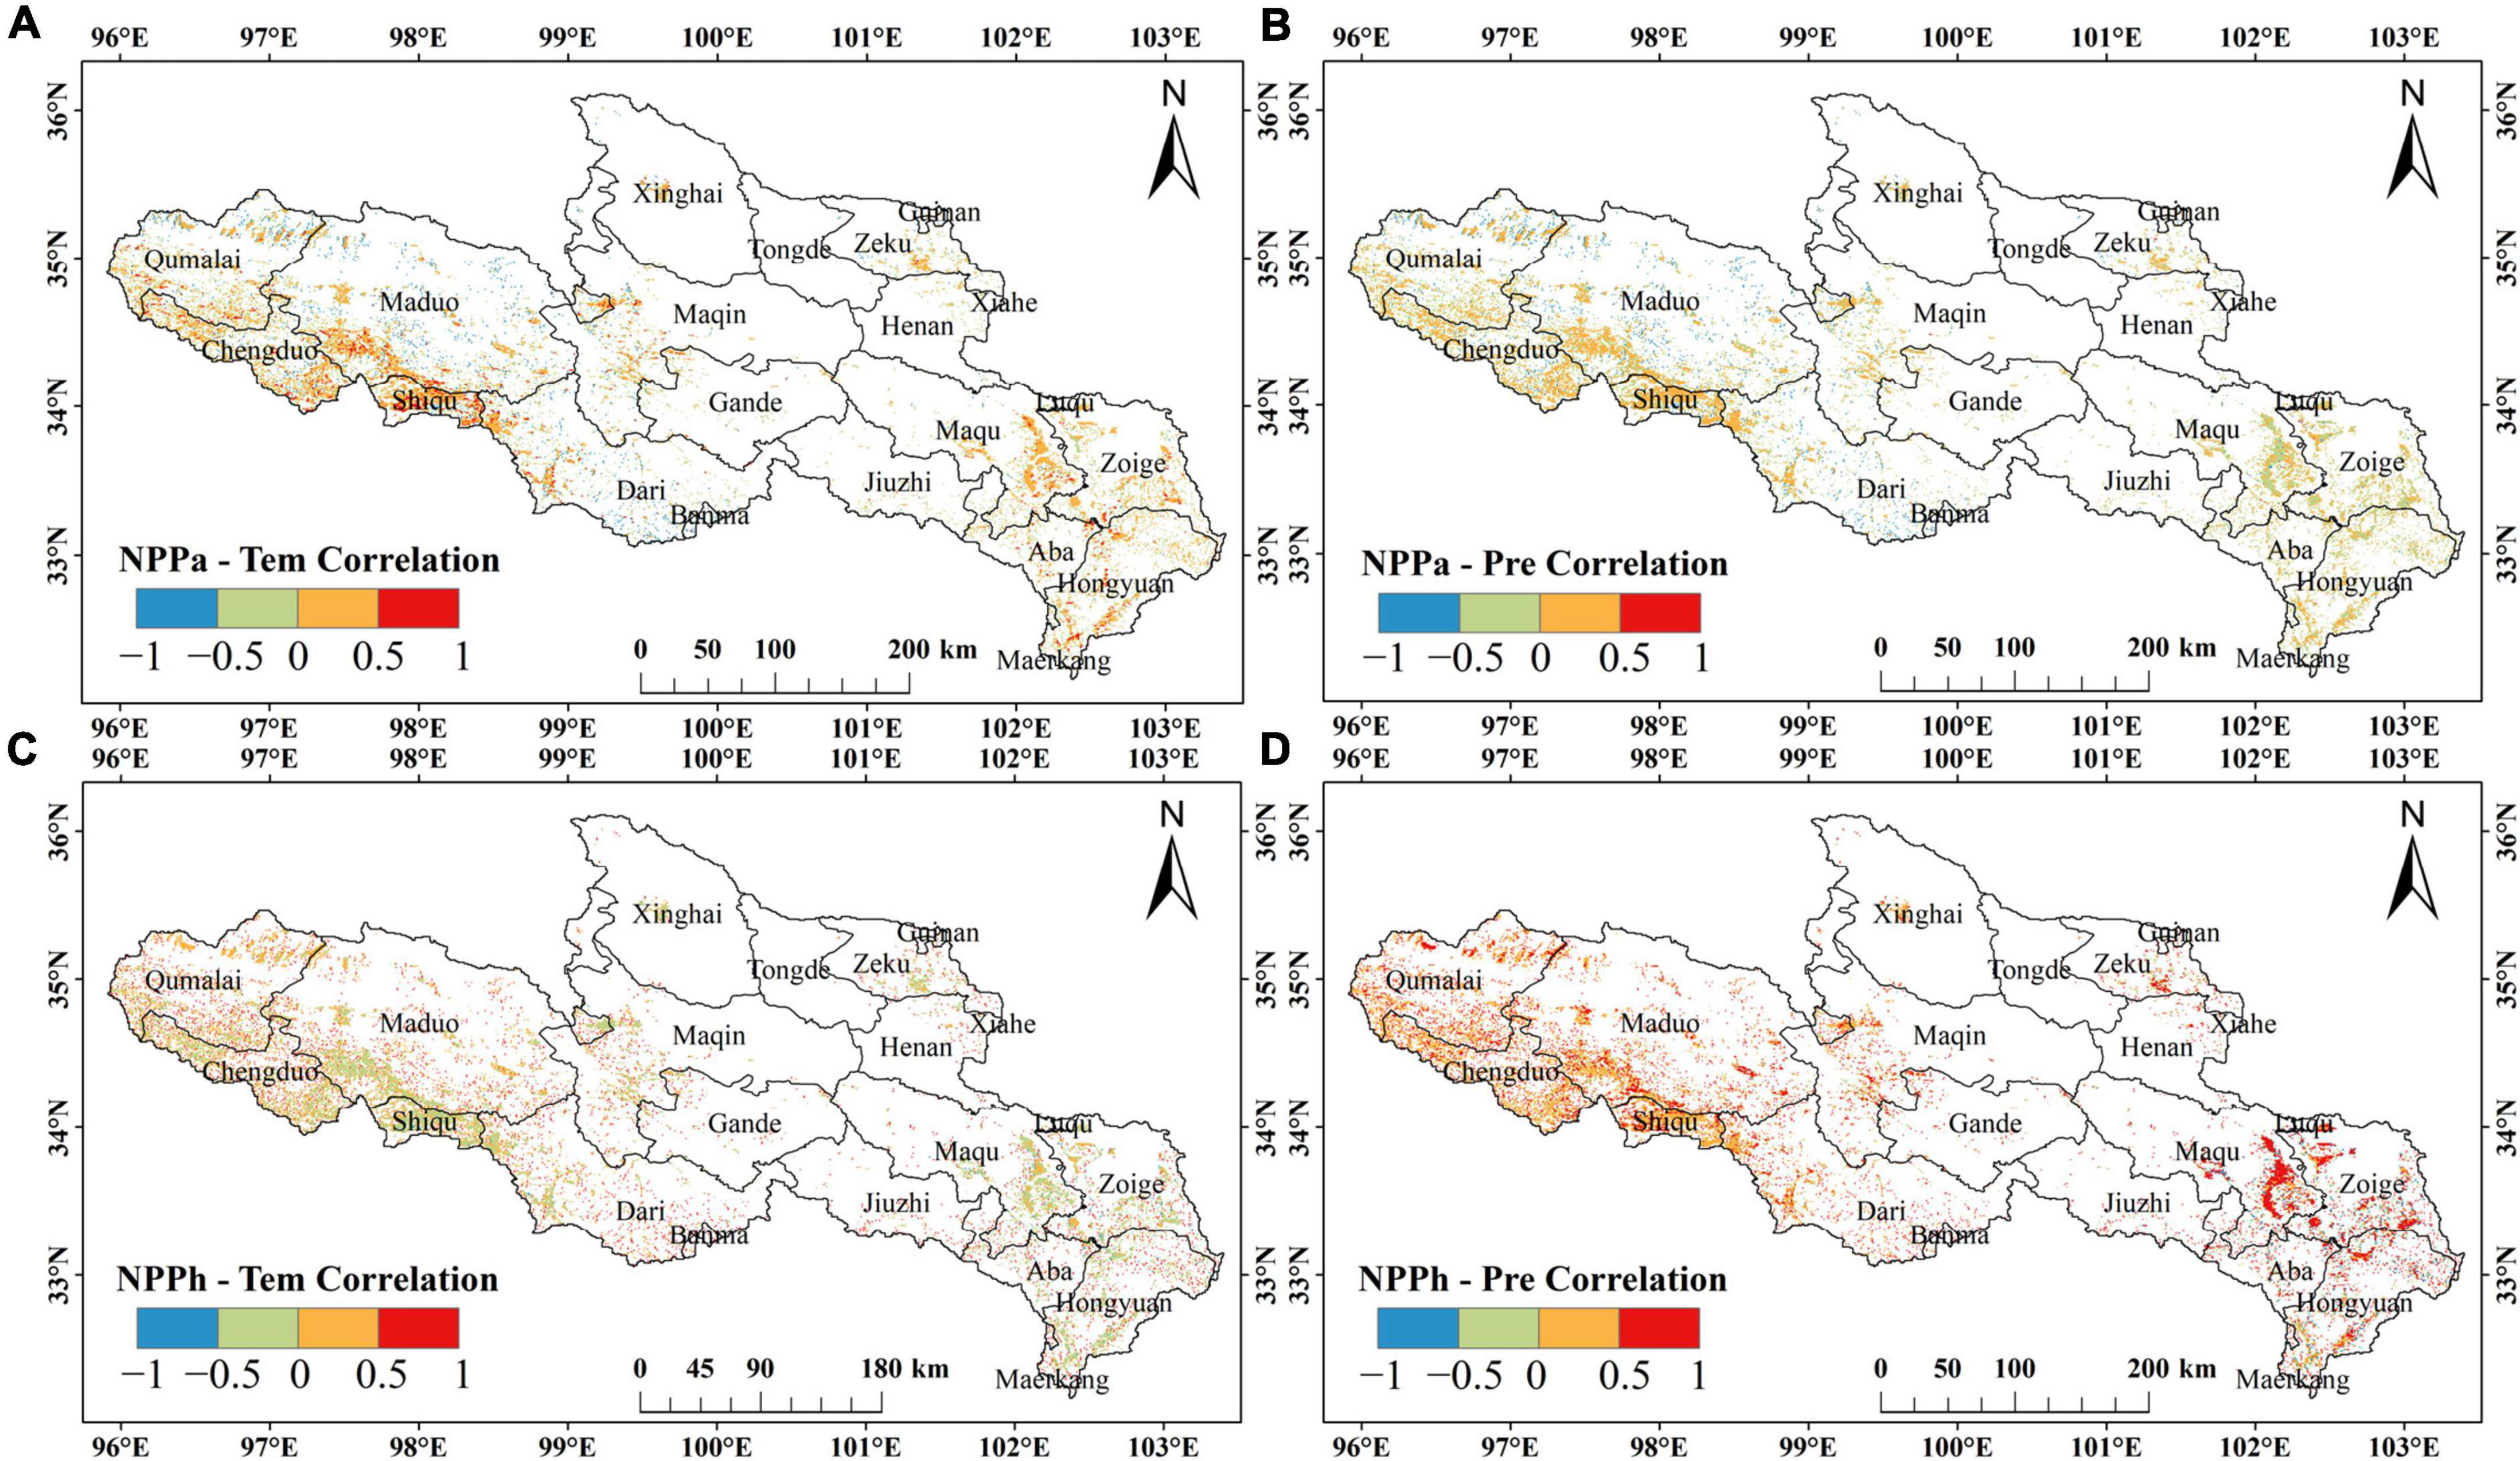
Figure 7. Spatial distribution of correlation analysis between NPP and climate factors of marsh wetland vegetation in the YRSR between 2000 and 2020. (A) NPPa and temperature. (B) NPPa and precipitation. (C) NPPh and temperature. (D) NPPh and precipitation.
3.4.2. Correlation analysis between human activities and NPP
The change of human activities was expressed by the number of livestock units per person in the YRSR from 2000 to 2020. The results of correlation analysis with NPP show that the number of livestock units per person was negatively correlated with NPPh (P < 0.01, r = −0.773), but no significant positive correlation with NPPa (P < 0.05, r = 0.226).
3.5. Relative contribution of climate change and human activities to NPP changes of marsh wetland vegetation
The relative contribution of climate-dominated and human-dominated to NPPa change was quantitatively assessed by superimposing the changing trends of NPPp, NPPa, and NPPh of marsh wetland vegetation in the YRSR between 2000 and 2020 (Figure 8). A total of 95.76% of NPPa of the wetland vegetation in the YRSR was increasing, of which 66.29% was influenced by climate change; it was primarily distributed in the southeast and central areas, which was also the area with the largest increase of the marsh wetland precipitation in the YRSR. A total of 29.47% of NPPa of the marsh wetland vegetation was influenced by human activities, primarily distributed in the northwest of the YRSR. The regions with reduced NPPa of marsh wetland vegetation were mainly distributed in sporadic areas of Zoige, Hongyuan, and Maqu counties in the southeast of the YRSR, accounting for 4.24%, almost all of them being influenced by human activities. Overall, the NPPa of marsh wetland vegetation in the YRSR exhibited an increasing trend between 2000 and 2020, with climate change being the dominate factor for the increase of NPPa. In the northwest of the YRSR, the contribution of human activities to the restoration of marsh wetland increased annually, while in the Zoige Plateau in the southeast of the YRSR, the NPPa of marsh wetland vegetation decreased as a result of human activities.
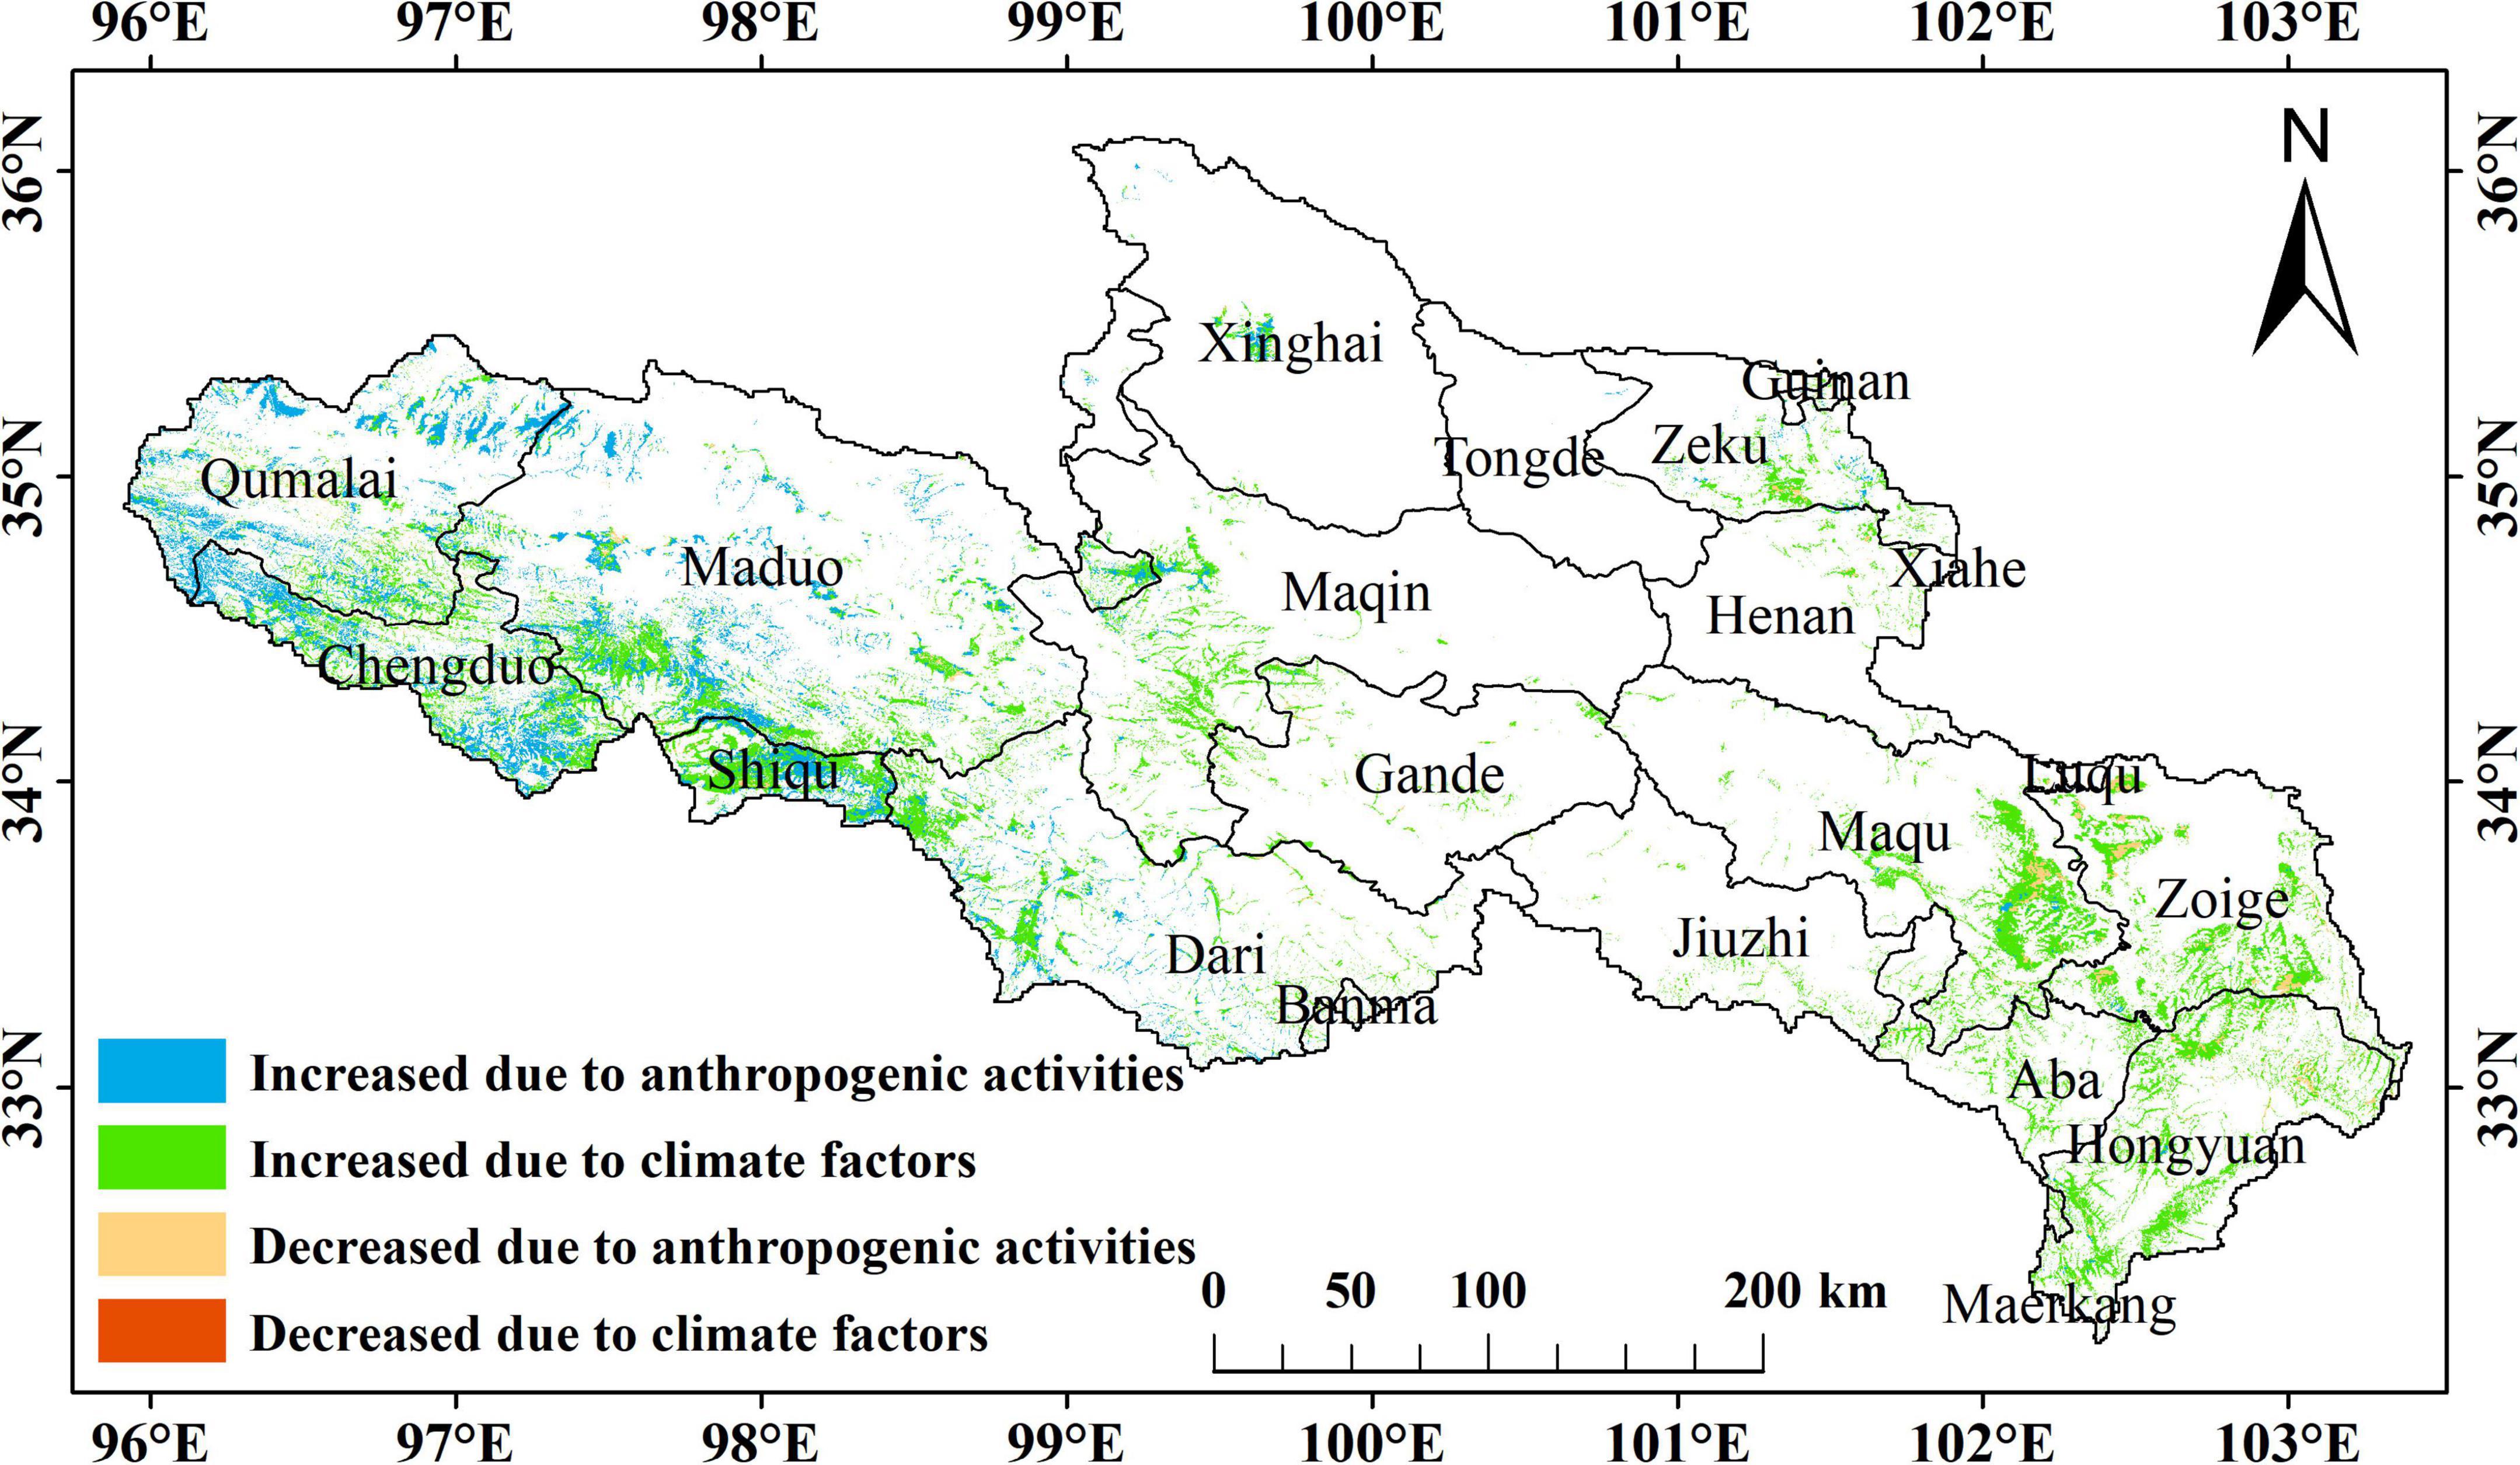
Figure 8. Spatial distribution of driving factors of NPPa change of marsh wetland vegetation in the YRSR between 2000 and 2020.
4. Discussion
4.1. NPP changes
In this study, the NPPp of marsh wetland vegetation in the YRSR between 2000 and 2020 was stimulated using the Zhou Guangsheng model, and the NPPa of marsh wetland vegetation was download from MOD17A3 product, and the NPPh of marsh wetland vegetation was calculated by the difference between them, which simplified the complex change mechanism of marsh wetland (Cloern et al., 2021) and allowed for quantitative evaluation of the driving mechanism of marsh wetland change. However, NPP estimation results might vary owing to the limitations of data sources, research area, and model methods. In this study, between 2000 and 2020, the NPPp of marsh wetland vegetation in the YRSR ranged between 63.21 and 101.93 gC/m2, with an average value of 82.23 gC/m2 and an average increase of 1.05 gC/m2a; The range of NPPa was between 201.75 and 252.71 gC/m2, with an average value of 224.53 gC/m2 and an average increase of 1.21 gC/m2a; The range of NPPh was between −120.86 and −178.00 gC/m2, with an average value of −143.36 gC/m2 and an average decrease of 0.25 gC/m2a. The estimated NPP values of marsh wetland in similar research were different, but the spatial distribution trend of decreasing from southeast to northwest was approximately the same. For example, using MODIS17A3 NPP data, Shen et al. obtained that the average NPP of marshes on the Qinghai-Tibet Plateau from 2000 to 2020 was about 184.37 ± 11.12 gC/m2a, and shows a trend of increasing gradually from northwest to southeast (Shen et al., 2022). The YRSR is located in the eastern part of the Qinghai-Tibet Plateau, the average NPPa of marsh vegetation in this study (224.53 gC/m2) is higher than the average NPP of marshes on the Qinghai-Tibet Plateau, meanwhile, the distribution trend of NPPa in marsh vegetation of this study is also gradually increasing from northwest to southeast. Besides, Yan et al. (2022) used CASA model to estimate the NPP of zoige plateau marsh wetland in the southeast of the YRSR from 2000 to 2015, ranging from 206.04 to 250.23 gC/m2, it is almost consistent with the NPPa of marsh vegetation in the YRSR obtained by using MOD17A3 product (201.75∼252.71 gC/m2). Tang et al. used CASA model to estimate the change of NPP in the YRSR from 2000 to 2017. The average NPP was 301.6 gC/m2, and the distribution trend was decreasing from southeast to northwest (Tang and Lin, 2021). It is higher than the NPP (224.53 gC/m2) of marsh wetland vegetation in our study, because grassland is the main vegetation type in the YRSR., accounting for about 89.75%, so the estimated value of NPP is higher, but the spatial distribution trend of NPP is consistent with our study. Compared with the above research, it can be proved that the NPP of marsh vegetation in the YRSR obtained by using MODIS17A3 product in this study is accurate. The northwest of the YRSR located in the inland hinterland was weakly affected by the warm and humid air current in the Pacific Ocean. Less precipitation and the lower temperature limited the growth and development of marsh wetland vegetation in the northwest of the YRSR, resulting in the lower NPP of marsh wetland vegetation in the northwest of the YRSR in comparison to that in the southeast (Tang and Lin, 2021). In this study, the NPPh was obtained by Formula (9), which was negative because NPPp was lower than NPPa in some areas. This shows that the ecological restoration measures affected by human activities have supplemented the NPP of marsh wetland vegetation, that is, human activities have promoted the restoration of marsh wetland vegetation in the YRSR. This is similar to the quantitative research results of vegetation NPP changes in Qinghai-Tibet Plateau in recent years. Since 2000, the vegetation in Qinghai-Tibet Plateau has changed from over-utilization to moderate protection, Under the influence of human activities, the area where vegetation NPP increases is expanding (Chen et al., 2020; Zhang et al., 2021). The NPPa of marsh wetland vegetation in the YRSR was increasing, indicating that the NPPa of marsh wetland vegetation was in a recovery state as a whole, while NPPh exhibited a decreasing trend, indicating that the overall impact of human activities was positive. In some regions of the Zoige Plateau in the southeast of the YRSR, NPPa exhibited a decreasing trend, and NPPh exhibited a negative effect, indicating that the NPPa of marsh wetland vegetation in this region was primarily reduced by human activities. The results obtained were consistent with those of similar studies (Guo et al., 2020; Ma et al., 2022; Yan et al., 2022), proving the accuracy and reliability of the NPP estimation result of this study.
4.2. Impacts of climate change and human activities on NPP
Between 2000 and 2020, the annual average temperature of the marsh wetland in the YRSR ranged from −4.20 to −3.07°C. The average temperature in 21 years was −3.51°C, with an average temperature increase rate being 0.16°C/10a. The annual precipitation of marsh wetland ranged from 464.73 to 663.35 mm; the average precipitation in 21 years was 558.03 mm, with an average water increase rate being 48.57 mm/10a. The spatial distribution pattern was decreasing from southeast to northwest, the temperature and precipitation exhibited an increasing trend, and the increasing trend from northwest to southeast was progressively obvious, which was consistent with the climate change trend distribution of earlier research results (Wang et al., 2015; Zhang, 2015; Wang et al., 2020), that is, the climate of the whole Qinghai-Tibet Plateau was warm and humid as a result of global warming. According to the correlation analysis between climate factors and NPP of marsh wetland vegetation, there was a positive correlation between NPP and precipitation in most regions of the YRSR, which was higher in comparison to the positive correlation with temperature. The spatial distribution and changing trend of precipitation were basically consistent with the NPP of marsh wetland vegetation, indicating that the overall increase of precipitation was the important factor affecting the increase of NPP of marsh wetland vegetation in the YRSR. However, there was a strong correlation between the temperature and the changes in the NPP of marsh wetland vegetation in some regions of Shiqu and Chengduo counties in the northwest of the YRSR, indicating that the influences of precipitation and temperature on the NPP of marsh wetland vegetation were complex and interactive (Guo et al., 2020). Glaciers and frozen soil melt as a result of increased precipitation and temperature, enriching the water supply of marsh wetland and increasing the NPP of marsh wetland vegetation in the YRSR which was approximately the same as the results of earlier studies (Ke et al., 2017; Hong et al., 2022; Zhang B. et al., 2022). Although the population and livestock in the YRSR have increased to varying degrees, the decrease of the number of livestock units per person shows that the overgrazing situation in this area has been controlled, which is one of the important reasons for the increase of NPP of marsh wetland vegetation in the YRSR from 2000 to 2020. The number of livestock units per person in the northwest of the YRSR has decreased especially obviously, therefore, affected by human activities, more NPP has been added in this region. However, in the southeast of the YRSR, the number of livestock units per person increased, which made the NPP in this area decrease due to human activities (Yan et al., 2022). The results of correlation analysis show that human activities are negatively correlated with NPPh, also demonstrates the NPP of marsh wetland vegetation in the YRSR has been effectively supplemented by human activities.
4.3. Relative contribution of climate change and human activities on marsh dynamics
According to the contribution rate analysis of this study, between 2000 and 2020, 66.29% of NPPa of the marsh wetland vegetation increased under the influence of climate change, which was primarily distributed in the southeast and central regions of the YRSR; 29.47% of NPPa of the marsh wetland vegetation increased under the influence of human activities, which was primarily distributed in the northwest part of the YRSR. The decrease in NPPa of wetland vegetation was primarily distributed in the sporadic areas of Zoige, Hongyuan, and Maqu counties in the southeast of the YRSR, accounting for 4.24%; almost all of them being influenced by human activities. This was similar to the studies by Yan et al. (2022) on NPP in the Zoige plateau wetland and Zhang F. et al. (2022) on NPP in grassland at the YRSR. That is, some areas in the northwest of the YRSR, such as Maduo, Qumalai, Chengduo, and Shiqu counties, were affected by the environmental protection project of the Three Rivers source, the construction of the Yellow River source national park, and other protection measures. The NPPa of the marsh wetland vegetation in this region was increased as a result of human activities. Although environmental protection projects mitigated some negative impacts of human activities in the Zoige plateau area in the southeast of the YRSR, the adverse human activities, such as the privatization of pastures, construction expansion, and drainage channel laying, have resulted in more fragmentation of marsh wetland (Yan and Wu, 2005; Li et al., 2020); consequently, the NPPa of marsh wetland vegetation decreased. Overall, even though climate-dominated change continues to play a major role in the increase of NPPa in marsh wetland vegetation in the YRSR, we could observe that the positive effects of human-dominated NPP change are becoming progressively obvious, which are approximately related to the environmental protection policy implemented by the government of China since 2000. For instance, in 2003, the ecological environment of the YRSR was enhanced by the environmental protection project of the Three Rivers source with an investment of 750 million renminbi (RMB) (Shao et al., 2017; Zhao et al., 2018). The wetlands in the YRSR would be further preserved and restored with the 14th Conference of Contracting Parties to the Convention on Wetlands held in China in 2022, and human activities would play a significant role in promoting the restoration of wetlands.
5. Conclusion
In this study, the marsh wetland in the YRSR was used as the object. By the quantitative analysis of NPPp, NPPa, and NPPh of the marsh wetland vegetation, the relative contributions of climate change and human activities to the NPPa change of the marsh wetland vegetation were quantitatively assessed. The results revealed that the ecological environment of marsh wetland in the YRSR was improved between 2000 and 2020 with increased NPP. The warming and humidifying climate, particularly the increase in precipitation, is the leading factor of marsh wetland restoration, but the contribution of human activities to wetland restoration is also increasing. In the process of marsh wetland restoration, scientific policy management and engineering measures have produced excellent results and are becoming progressively remarkable. The area of marsh wetland restoration influenced by human activities would be further enlarged in the future with the implementation of several environmental protection engineering measures. In general, this study adopted a simple but reliable method to analyze the spatial distribution of the relative contributions of climate change and human activities to the NPP change of marsh wetland vegetation and quantitatively assessed the change mechanism of marsh wetland. The research results not only assisted policymakers in understanding the degradation and restoration status of marsh wetland in the YRSR but also helped in formulating future environmental protection policies and had important guiding significance for the sustainable development of marsh wetland.
Data availability statement
Publicly available datasets were analyzed in this study. This data can be found here: http://www.geodata.cn, http://developers.google.cn, and https://data.cnki.net.
Author contributions
ZZ conceived the study, supervised the writing, revised the manuscript, and provided funding support. XF led the writing. TM and BH contributed sections to the manuscript. All authors read and approved the final submission.
Funding
This work was supported by the Key Research and Development and Translational Program of Qinghai Province (No. 2022-QY-225).
Conflict of interest
The authors declare that the research was conducted in the absence of any commercial or financial relationships that could be construed as a potential conflict of interest.
Publisher’s note
All claims expressed in this article are solely those of the authors and do not necessarily represent those of their affiliated organizations, or those of the publisher, the editors and the reviewers. Any product that may be evaluated in this article, or claim that may be made by its manufacturer, is not guaranteed or endorsed by the publisher.
Footnotes
- ^ http://www.geodata.cn (accessed October 2, 2022).
- ^ https://developers.google.cn/earth-engine/datasets/catalog/MODIS_006_MOD17A3HGF (accessed October 2, 2022).
- ^ https://data.cnki.net/ (accessed October 2, 2022).
References
Chen, A. F., Li, R. Y., Wang, H. L., and He, B. (2015). Quantitative assessment of human appropriation of aboveground net primary production in China. Ecol. Modelling 312, 54–60. doi: 10.1016/j.ecolmodel.2015.05.017
Chen, H., Ju, P. J., Zhang, J., Wang, Y. Y., Zhu, Q. A., Yan, L., et al. (2020). Attribution analyses of changes in alpine grasslands on the Qinghai-Tibetan Plateau. Chin. Sci. Bull. 65, 2406–2418. doi: 10.1360/TB-2019-0619
Cloern, J. E., Safran, S. M., Vaughn, L. S., Robinson, A., Whipple, A. A., Boyer, K. E., et al. (2021). On the human appropriation of wetland primary production. Sci. Total Environ. 785:9. doi: 10.1016/j.scitotenv.2021.147097
Dong, L. Q., Yang, W., Zhang, K., Zhen, S., Cheng, X. P., and Wu, L. H. (2020). Study of marsh wetland landscape pattern evolution on the Zoige Plateau due to natural/human dual-effects. Peerj 8:e9904. doi: 10.7717/peerj.9904
Du, J. Z., Wang, G. X., Yang, Y., Zhang, T., and Mao, T. X. (2015). Temporal and spatial variation of the distributive patterns and driving force analysis in the Yangtze River and Yellow River source regions wetland. Acta Ecol. Sin. 35, 6173–6182. doi: 10.5846/stxb201401260196
Gao, H., and Jin, J. X. (2022). Analysis of water yield changes from 1981 to 2018 using an improved Mann-Kendall test. Remote Sens. 14:17. doi: 10.3390/rs14092009
Guo, B., Wang, S., and Wang, M. T. (2020). Spatio-temporal variation of NPP from 1999 to 2015 in Zoige grassland wetland, China. J. Appl. Ecol. 31, 424–432. doi: 10.13287/j.1001-9332.202002.018
Hong, Z. D., Ding, S. Y., Zhao, Q. H., Geng, Z. H., Qiu, P. W., Zhang, J., et al. (2022). Relative contribution of multi-source water recharge to riparian wetlands along the lower Yellow River. J. Environ. Manage. 321:12. doi: 10.1016/j.jenvman.2022.115804
Hou, M. J., Gao, J. L., Ge, J., Li, Y. C., Liu, J., Yin, J. P., et al. (2020). An analysis of dynamic changes and their driving factors in marsh wetlands in the eastern Qinghai-Tibet Plateau. Acta Pratacult. Sin. 29, 13–27. doi: 10.1168/cyxb20191
Ke, L. H., Ding, X. L., Li, W. K., and Qiu, B. (2017). Remote sensing of glacier change in the central Qinghai- Tibet plateau and the relationship with changing climate. Remote Sens. 9:19. doi: 10.3390/rs9020114
Li, H., Zhang, H. Y., Li, Q. X., Zhao, J. J., Guo, X. Y., Ying, H., et al. (2021). Vegetation productivity dynamics in response to climate change and human activities under different topography and land cover in northeast China. Remote Sens. 13:18. doi: 10.3390/rs13050975
Li, Q. J., Zhang, Y., Fu, L., Li, Y. G., Li, F. C., Li, S. T., et al. (2018). Degradation mechanism of mires and recovery technology for them in the source regions of the yellow river. Wetland Sci. 16, 466–471. doi: 10.13248/j.cnki.wetlandsci.2018.04.003
Li, W. L., Xue, P. F., Liu, C. L., Yan, H. P., Zhu, G. F., and Cao, Y. P. (2020). Monitoring and landscape dynamic analysis of alpine wetland area based on multiple algorithms: A case study of Zoige Plateau. Sensors 20:19. doi: 10.3390/s20247315
Lieth, H. (1975). Modeling the primary productivity of the world. Prim. Product. Biosph. 14, 237–263. doi: 10.1007/978-3-642-80913-2_12
Liu, M., Fu, B. L., Xie, S. Y., He, H. C., Lan, F. W., Li, Y. Y., et al. (2021). Comparison of multi-source satellite images for classifying marsh vegetation using DeepLabV3 Plus deep learning algorithm. Ecol. Indic. 125:107562. doi: 10.1016/j.ecolind.2021.107562
Liu, Z. W., Li, S. N., Wei, W., and Song, X. J. (2019). Research progress on alpine wetland changes and driving forces in Qinghai-Tibet Plateau during the last three decades. Chin. J. Ecol. 38, 856–862. doi: 10.13292/j.1000-4890.201903.002
Ma, T., She, Y. D., Zhao, L., Hu, B. X., Feng, X. K., Zhao, J., et al. (2022). Alpine wetland evolution and their response to climate change in the yellow-river-source national park from 2000 to 2020. Water 14:17. doi: 10.3390/w14152351
Mao, D. H., Wang, Z. M., Du, B. J., Li, L., Tian, Y. L., Jia, M. M., et al. (2020). National wetland mapping in China: A new product resulting from object-based and hierarchical classification of Landsat 8 OLI images. ISPRS J. Photogramm. Remote Sens. 164, 11–25. doi: 10.1016/j.isprsjprs.2020.03.020
Mao, D. H., Wang, Z. M., Li, L., Song, K. S., and Jia, M. M. (2014). Quantitative assessment of human-induced impacts on marshes in Northeast China from 2000 to 2011. Ecol. Eng. 68, 97–104. doi: 10.1016/j.ecoleng.2014.03.010
Mo, X. G., Liu, S. X., and Hu, S. (2022). Co-evolution of climate-vegetation-hydrology and its mechanisms in the source region of Yellow River. Acta Geograph. Sin. 77, 1730–1744. doi: 10.11821/dlxb202207011
Ogunsola, O., and Dilau, K. A. (2022). Temperature variability comparison using mann-kendall test. J. Sci. Technol. 14, 29–36. doi: 10.30880/jst.2022.14.01.003
Pan, T., Hou, S., Liu, Y. J., Tan, Q. H., Liu, Y. H., and Gao, X. F. (2020). In fluence of degradation on soil water availability in an alpine swamp meadow on the eastern edge of the Tibetan Plateau. Sci. Total Environ. 722:13. doi: 10.1016/j.scitotenv.2020.137677
Peng, S. Z., Ding, Y. X., Liu, W. Z., and Li, Z. (2019). 1 km monthly temperature and precipitation dataset for China from 1901 to 2017. Earth Syst. Sci. Data 11, 1931–1946. doi: 10.5194/essd-11-1931-2019
Qiu, Z. Q., Mao, D. H., Xiang, H. X., Du, B. J., and Wang, Z. M. (2021). Patterns and changes of wetlands in the yellow river basin for 5 periods. Wetland Sci. 19, 518–526. doi: 10.13248/j.cnki.wetlandsci.2021.04.017
Shao, Q. Q., Cao, W., Fan, J. W., Huang, L., and Xu, X. L. (2017). Effects of an ecological conservation and restoration project in the Three-River Source Region, China. J. Geogr. Sci. 27, 183–204. doi: 10.1007/s11442-017-1371-y
Shen, X. J., Liu, Y. W., Zhang, J. Q., Wang, Y. J., Ma, R., Liu, B. H., et al. (2022). Asymmetric impacts of diurnal warming on vegetation carbon sequestration of marshes in the Qinghai Tibet Plateau. Glob. Biogeochem. Cycles 36:e2022GB007396. doi: 10.1029/2022gb007396
Shen, X. J., Xue, Z. S., Jiang, M., and Lu, X. G. (2019). Spatiotemporal change of vegetation coverage and its relationship with climate change in freshwater marshes of northeast China. Wetlands 39, 429–439. doi: 10.1007/s13157-018-1072-z
Sun, Q. L., Li, B. L., Zhou, C. H., Li, F., Zhang, Z. J., Ding, L. L., et al. (2017). A systematic review of research studies on the estimation of net primary productivity in the Three-River Headwater Region, China. J. Geograph. Sci. 27, 161–182. doi: 10.1007/s11442-017-1370-z
Tang, R., and Lin, H. L. (2021). Quantitative assessment of NPP changes in the Yellow River Source Area from 2001 to 2017. IOP Conf. Ser. 687:012002. doi: 10.1088/1755-1315/687/1/012002
Wang, J. Y., Li, A. N., and Jin, H. A. (2015). A review on research advances in estimation models for net primary production of vegetation in wetlands. Wetland Sci. 13, 636–644. doi: 10.13248/j.cnki.wetlandsci.2015.05.018
Wang, R., He, M., and Niu, Z. G. (2020). Responses of alpine wetlands to climate changes on the Qinghai-Tibetan Plateau based on remote sensing. Chin. Geograph. Sci. 30, 189–201. doi: 10.1007/s11769-020-1107-2
Wang, Y. F., Lv, W. W., Xue, K., Wang, S. P., Zhang, L. R., Hu, R. H., et al. (2022). Grassland changes and adaptive management on the Qinghai-Tibetan Plateau. Nat. Rev. Earth Environ. 3, 668–683. doi: 10.1038/s43017-022-00330-8
Wang, Y. L., Wang, X., Li, C. H., Wu, F. F., and Yang, Z. F. (2015). Spatiotemporal analysis of temperature trends under climate change in the source region of the Yellow River, China. Theor. Appl. Climatol. 119, 123–133. doi: 10.1007/s00704-014-1112-4
Xiang, S. A., Guo, R. Q., Wu, N., and Sun, S. C. (2009). Current status and future prospects of zoige marsh in eastern Qinghai-Tibet Plateau. Ecol. Eng. 35, 553–562. doi: 10.1016/j.ecoleng.2008.02.016
Xie, J. L., Lu, Z. X., and Feng, K. (2022). Effects of climate change and human activities on aeolian desertification reversal in Mu US Sandy Land, China. Sustainability 14:12. doi: 10.3390/su14031669
Xu, D. Y., Kang, X. W., Zhuang, D. F., and Pan, J. J. (2010). Multi-scale quantitative assessment of the relative roles of climate change and human activities in desertification–A case study of the Ordos Plateau, China. J. Arid Environ. 74, 498–507. doi: 10.1016/j.jaridenv.2009.09.030
Xue, Z. S., Lyu, X. G., Chen, Z. K., Zhang, Z. S., Jiang, M., Zhang, K., et al. (2018). Spatial and temporal changes of wetlands on the Qinghai-Tibetan Plateau from the 1970s to 2010s. Chin. Geograph. Sci. 28, 935–945. doi: 10.1007/s11769-018-1003-1
Yan, F. Q. (2022). Effects of climate changes on net primary productivity variation in the marsh area of the Sanjiang Plain. Front. Ecol. Evol. 10:11. doi: 10.3389/fevo.2022.1002397
Yan, F. Q., Zhang, S. W., Liu, X. T., Yu, L. X., Chen, D., Yang, J. C., et al. (2017). Monitoring spatiotemporal changes of marshes in the Sanjiang Plain, China. Ecol. Eng. 104, 184–194. doi: 10.1016/j.ecoleng.2017.04.032
Yan, W. C., Wang, Y. Y., Chaudhary, P., Ju, P. J., Zhu, Q. A., Kang, X. M., et al. (2022). Effects of climate change and human activities on net primary production of wetlands on the Zoige Plateau from 1990 to 2015. Glob. Ecol. Conserv. 35:13. doi: 10.1016/j.gecco.2022.e02052
Yan, Z. L., and Wu, N. (2005). Rangeland privatization and its impacts on the Zoige wetlands on the Eastern Tibetan Plateau. J. Mt. Sci. 2, 105–115. doi: 10.1007/bf02918326
Yin, L., Dai, E. F., Zheng, D., Wang, Y. H., Ma, L., and Tong, M. (2020). What drives the vegetation dynamics in the Hengduan Mountain region, southwest China: Climate change or human activity? Ecol. Indic. 112:12. doi: 10.1016/j.ecolind.2019.106013
Yuan, F. F., Liu, J. H., Berndtsson, R., Hao, Z. C., Cao, Q., Wang, H. M., et al. (2020). Changes in precipitation extremes over the source region of the yellow river and its relationship with teleconnection patterns. Water 12:15. doi: 10.3390/w12040978
Zhang, B., Niu, Z. G., Zhang, D. Q., and Huo, X. L. (2022). Dynamic changes and driving forces of alpine wetlands on the Qinghai-Tibetan Plateau based on long-term time series satellite data: A case study in the Gansu Maqu Wetlands. Remote Sens. 14:21. doi: 10.3390/rs14174147
Zhang, F., Hu, X. S., Zhang, J., Li, C. Y., Zhang, Y. P., and Li, X. L. (2022). Change in alpine grassland NPP in response to climate variation and human activities in the Yellow River source zone from 2000 to 2020. Sustainability 14:15. doi: 10.3390/su14148790
Zhang, Q., Yuan, R. Y., Singh, V. P., Xu, C. Y., Fan, K. K., Shen, Z. X., et al. (2022). Dynamic vulnerability of ecological systems to climate changes across the Qinghai-Tibet Plateau, China. Ecol. Indic. 134:11. doi: 10.1016/j.ecolind.2021.108483
Zhang, X. Q. (2015). Climate change impacts on wetlands of the yellow river headwaters. Nat. Environ. Pollut. Technol. 14:217.
Zhang, Y., Hu, Q. W., and Zou, F. L. (2021). Spatio-temporal changes of vegetation net primary productivity and its driving factors on the Qinghai-Tibetan plateau from 2001 to 2017. Remote Sens. 13:1566. doi: 10.3390/rs13081566
Zhao, D. D., He, H. S., Wang, W. J., Wang, L., Du, H. B., Liu, K., et al. (2018). Predicting wetland distribution changes under climate change and human activities in a mid- and high-latitude region. Sustainability 10:14. doi: 10.3390/su10030863
Zhao, L., Zou, D. F., Hu, G. J., Du, E. J., Pang, Q. Q., Xiao, Y., et al. (2020). Changing climate and the permafrost environment on the Qinghai-Tibet (Xizang) plateau. Permafr. Periglac. Process. 31, 396–405. doi: 10.1002/ppp.2056
Keywords: marsh wetland, climate variation, human activities, quantitative assessment, vegetation NPP
Citation: Feng X, Zhao Z, Ma T and Hu B (2023) A study of the effects of climate change and human activities on NPP of marsh wetland vegetation in the Yellow River source region between 2000 and 2020. Front. Ecol. Evol. 11:1123645. doi: 10.3389/fevo.2023.1123645
Received: 14 December 2022; Accepted: 14 March 2023;
Published: 30 March 2023.
Edited by:
Xiaodong Zhang, Chinese Academy of Forestry, ChinaReviewed by:
Meng Li, Nantong University, ChinaMing Jiang, Northeast Institute of Geography and Agroecology (CAS), China
Liang Yan, Institute of Ecological Conservation and Restoration, Chinese Academy of Forestry, China
Copyright © 2023 Feng, Zhao, Ma and Hu. This is an open-access article distributed under the terms of the Creative Commons Attribution License (CC BY). The use, distribution or reproduction in other forums is permitted, provided the original author(s) and the copyright owner(s) are credited and that the original publication in this journal is cited, in accordance with accepted academic practice. No use, distribution or reproduction is permitted which does not comply with these terms.
*Correspondence: Zhizhong Zhao, 1989990003@qhu.edu.cn