 Anam Nigar
- 1School of Electronics and Information Engineering, Changchun University of Science and Technology, Changchun, China
- 2College of New Energy and Environment, Jilin University, Changchun, China
- 3Department of Zoology, College of Science, King Saud University, Riyadh, Saudi Arabia
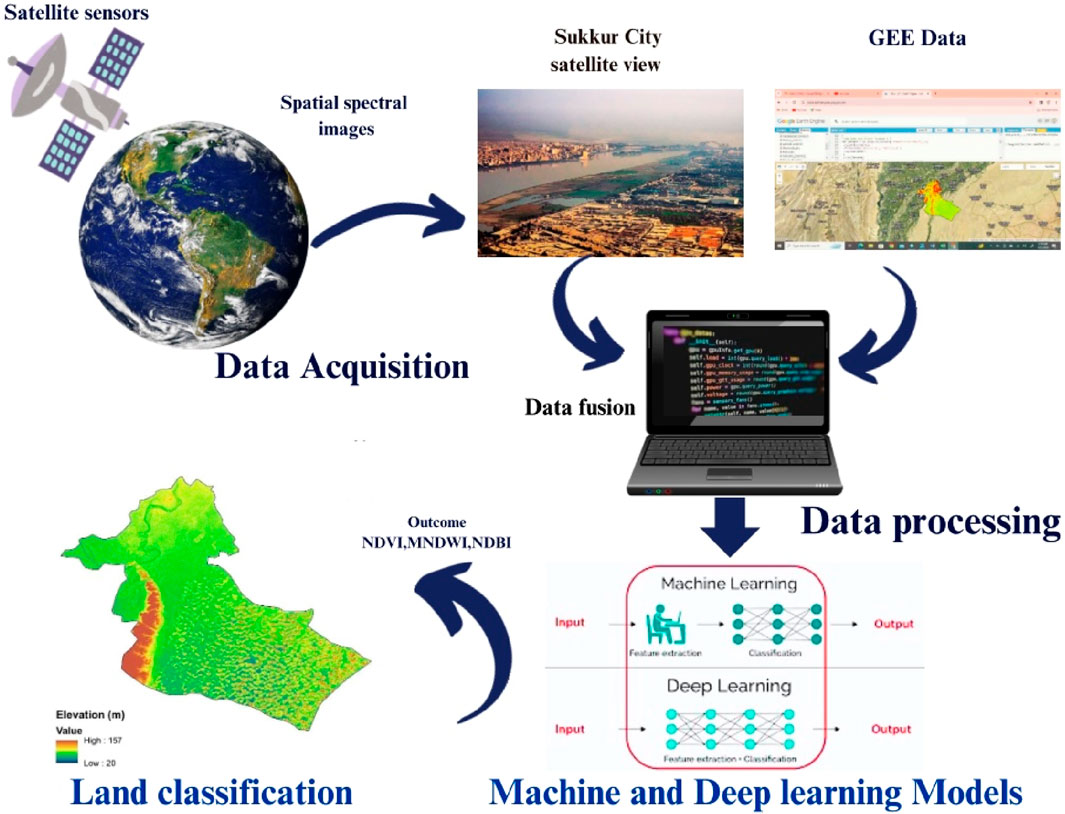
Classifying land use and land cover (LULC) is essential for various environmental monitoring and geospatial analysis applications. This research focuses on land classification in District Sukkur, Pakistan, employing the comparison between machine and deep learning models. Three satellite indices, namely, NDVI, MNDWI, and NDBI, were derived from Landsat-8 data and utilized to classify four primary categories: Built-up Area, Water Bodies, Barren Land, and Vegetation. The main objective of this study is to evaluate and compare the effectiveness of comparison of machine and deep learning models. The machine learning models including Random Forest achieved an overall accuracy of 91.3% and a Kappa coefficient of 0.90. It accurately classified 2.7% of the area as Built-up Area, 1.9% as Water Bodies, 54.8% as Barren Land, and 40.4% as Vegetation. While slightly less accurate, Decision Tree model provided reliable classifications. Deep learning models showed significant accuracy, of Convolutional Neural Networks (CNN) and Recurrent Neural Networks (RNN). The CNN model achieved an impressive overall accuracy of 97.3%, excelling in classifying Water Bodies with User and Producer Accuracy exceeding 99%. The RNN model, with an overall accuracy of 96.2%, demonstrated strong performance in categorizing Vegetation. These findings offer valuable insights into the potential applications of machine learning and deep learning models for perfect land classifications, with implications for environmental monitoring management and geospatial analysis. The rigorous validation and comparative analysis of these models contribute to advancing remote sensing techniques and their utilization in land classification tasks. This research presents a significant contribution to the field and underscores the importance of precise land classification in the context of sustainable land management and environmental conservation.
Highlights
• Compared ML and DL for LULC in Sukkur, Pakistan.
• Random Forest achieved 91.3% accuracy.
• CNN excelled with 97.3% overall accuracy.
• NDVI, MNDWI, NDBI for LULC classification.
• Scientific precision in model validation.
• Significance for environmental conservation.
1 Introduction
The classification of Land Use Land Cover (LULC) plays a critical role in managing resources in developing areas, particularly in addressing challenges posed by rapid population growth (Avtar et al., 2019; Assede et al., 2023). The phenomenon of rapid urbanization emphasizes the crucial role played by accurate LULC classification in mitigating adverse impacts on global energy resources, promoting sustainable planning, efficient resource management, and safeguarding environmental integrity (Magidi et al., 2021; Praticò et al., 2021; Digra et al., 2022). The precision of LULC maps is fundamental, as they enable the systematic categorization of land into distinct classes, providing deep insights into resource utilization and its wide-ranging socioeconomic implications (Choudhury et al., 2023). Researchers extensively rely on these meticulously crafted maps to investigate various environmental issues across spatial scales (Anwar et al., 2022). Notably, changes in LULC can profoundly impact weather conditions and climate patterns, potentially disrupting the delicate water balance in specific geographic regions (Mekonnen et al., 2023). Thus, comprehensive LULC cartography is indispensable for meticulous monitoring, land management, and hazard assessment (Jat Baloch et al., 2022; Acharya et al., 2023). Reducing vegetation cover emerges as a significant driver of elevated land surface temperatures, underscoring the urgent need for proactive land cover management (Moisa et al., 2022).
According to studies, classification techniques, including machine learning (ML) and deep learning (DL) algorithms, play a vital role (Kussul et al., 2017; Jagannathan and Divya, 2021; Digra et al., 2022; Swetanisha et al., 2022; Wang et al., 2022; Azedou et al., 2023; Boonpook et al., 2023; Ebenezer and Manohar, 2023). DL models, demonstrated by Convolutional Neural Networks (CNN) (Jena et al., 2022) and Recurrent Neural Networks (RNN) (Gaafar et al., 2022), have gained importance due to their ability to extract and classify features efficiently (Swetanisha et al., 2022). Spatial data, remote sensing, and machine learning analysis have a wide range of applications, including urban planning, agriculture, resource management, mineralogy for the environmental management and planning (Hussein et al., 2023; Iqbal et al., 2023; Kanakala and Reddy, 2023) and have been used for natural language processing (NLP) (Agga et al., 2022; Vankdothu et al., 2022). Deep learning models are recognized as intelligent modeling approaches, catalyzing advancements in land use modeling (Gaafar et al., 2022). The synergistic Integration of Google Earth Engine (GEE), remote sensing technology, and Geographic Information System (GIS) facilitates the rapid and precise mapping of land use and land cover, among other Earth surface features (Praticò et al., 2021; dos Santos et al., 2023). Geospatial researchers have employed a diverse array of LULC mapping techniques, ranging from conventional methodologies such as Bayesian Maximum Likelihood to advanced machine and deep learning models, including Support Vector Machine (SVM) (Braun et al., 2023), Light Gradient Boosting Machine, Random Forest (RF) (Magidi et al., 2021), and Decision Trees, (Gazzinelli et al., 2017). Furthermore, recent studies have also highlighted the effectiveness of Recurrent Neural Networks (RNN) in LULC analysis (Jeyavathana). One such study used Long Short Term Memory (LSTM) networks for land use scene classification, yielding results comparable to those obtained with CNN (Cao et al., 2019; Swetanisha et al., 2022) used the machine learning models XGBoost and SVM were combined for LULCC in India using Landsat-8 OLI data. Mhanna et al. (2023) applied machine learning and remote sensing to analyze the Orontes River Basin (ORB) from 2004 to 2022. Their findings revealed a 21%–24% decline in cropland areas in Syrian conflict zones after 2013, while Lebanon experienced a 3.4-fold increase. Refugee settlement growth in Lebanon and along the Syrian/Turkish borders exhibited diverse LULC patterns influenced by settlement dynamics. Alshari et al. (2023) also reported machine learning approach for land use/land cover classification, aiming to improve accuracy using Landsat-8 satellites. Their method, ANN-RF, combines artificial neural networks with random forest, outperforming traditional approaches and individual satellite classifiers.
Selecting appropriate techniques for LULC change detection has received relatively less attention by comparing both AI techniques that is DL and ML. Therefore, the reasonable choice of methodologies for monitoring LULC changes is critical for effectively managing agriculture, natural reserves, and energy resources, particularly with rising population growth (Roy et al., 2022). Remote sensing data represents a valuable source of information about Google Earth (Nelson et al., 2022), Empowering a wide range of applications in urban planning, agriculture, natural resource management, and mineralogy (Ouchra et al., 2022). Landsat-8 satellite composite images capture a wide range of spectral variability, To circumvent these challenges, Google Earth Engine (GEE) offers an alternative solution with its extensive data download and storage requirements employed to classify land (Zhao et al., 2024). Thus, GEE is a complimentary cloud-based platform facilitating easy access, visualization, and analysis of satellite imagery at the petabyte scale. This platform is extensively utilized for classifying land cover across various scales, from regional to national and global levels (Abburu and Golla, 2015; Praticò et al., 2021). When flawlessly integrated into the GEE platform, empowers rigorous LULC research in Pakistan, utilizing Landsat-8 satellite imagery (Panhwar et al., 2024; Safi et al., 2024; Zhao et al., 2024). Various satellite-derived Incorporating indices, such as the Normalized Difference Vegetation Index (NDVI) (DeFries and Townshend, 1994; Jat Baloch et al., 2022) Modified Normalized Difference Water Index (Guo et al., 2017), and Normalized Difference Built Index (NDBI) (Ali et al., 2019), are involved in identifying essential land covers features like Vegetation, Built-up areas, barren land, and water bodies. Integrating machine and deep learning models with Geospatial methods Enhances the accuracy of classification for Land Use and Land Cover (LULC) analysis and robustness (Wang et al., 2022; Zafar et al., 2024). Leveraging their strengths and utilizing geospatial data enables more dependable and thorough Land Use and Land Cover (LULC) classification outcomes, allowing for capturing intricate land use dynamics characterized by spatial linkages and patterns (Farshidi et al., 2023; Zafar et al., 2024). It is essential to emphasize that the initial step involves defining image features, necessitating feature extraction to reduce the resource requirements for describing extensive datasets (Shetty et al., 2019; Sertel et al., 2022).
This study introduces a novel approach by exploring the effectiveness of various machine and deep learning algorithms for Land Use and Land Cover (LULC) classification. Our research aims to evaluate the performance of Machine Learning models (DTC, RF) and Deep Learning models (CNN, RNN) using Landsat-8 satellite imagery to classify Water bodies, Built-up areas, Vegetation, and Barren Land across the Sukkur District, Pakistan. Employing a comprehensive workflow in Python and Google Earth Engine (GEE), we compare these algorithms alongside commonly used ones such as Decision Tree Classifier, Random Forest, and Convolutional Neural Network, and assess their accuracy based on metrics including producer accuracy, user accuracy, and kappa coefficient.
2 Study area
The study area is located at geographical coordinate’s 27°42′22″N latitude and 68°50′54″E longitude, as shown in Figure 1. Sukkur is a city situated within the Sindh province in southeastern Pakistan. Geographically, the city is positioned on the western bank of the Indus River, connected to Rohri on the opposite bank by a cantilever bridge (Biagi and Vidale, 2022). Intermediate between these two cities lies the strategically significant island fort of Bhakkar. Historically, Sukkur was enveloped by date palm groves. Regarding population, Sukkur district ranks as the 14th largest city in Pakistan, with an estimated population of approximately 1,639,897 people according to the latest available data (Samo et al., 2022). The city covers an area of 5,165 square kilometers, resulting in a population density of 317.5 individuals per square kilometer as of 2023. The annual population change from 2017 to 2023 is estimated at 1.6% (Bhellar et al., 2023). Sukkur experiences a hot desert climate, which is categorized under the Köppen climate classification as BWh. This climatic classification is characterized by exceedingly hot and hazy summers and relatively warm winters. Sukkur is renowned for its extremely hot summers and is known to be one of the most desirable cities in the region (Abro et al., 2022). Wind speeds in Sukkur remain consistently low throughout the year, while sunshine is abundant.
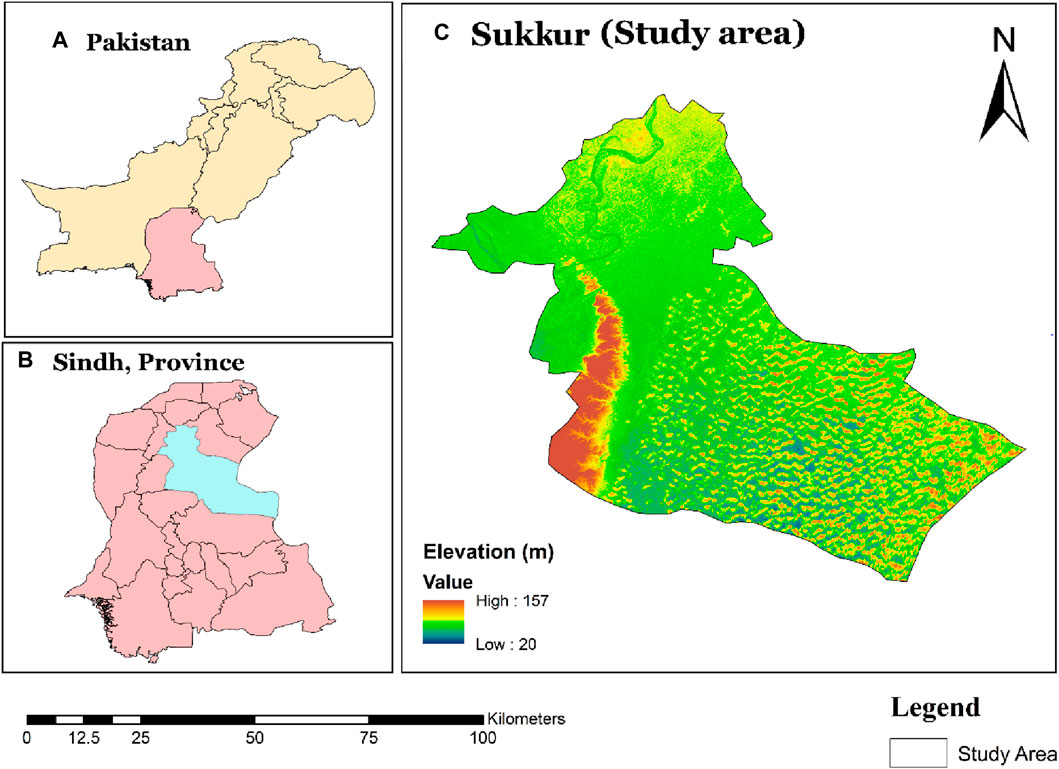
Figure 1. (A) Boundaries of Pakistan. (B) The study site is situated in Sindh, a province of Pakistan. (C) The study area location and elevation data obtained from the Shuttle Radar Topography Mission (SRTM).
Regarding precipitation, the highest recorded annual rainfall in Sukkur was 698 mm (27.5 inches) in 2022, while the lowest annual rainfall, amounting to 0 mm, was documented in 1941. The temperature in Sukkur typically ranges from 46°F to 112°F and seldom falls below 40°F or exceeds 117°F.
3 Materials and methods
3.1 Data set
In this research, data were sourced from the Google Earth Engine (GEE) platform, which can be accessed at https://earthengine.google.com/. GEE offers a substantial repository of Earth observation data, encompassing renowned systems such as MODIS, and Landsat-8 as well as various geospatial datasets, including demographic and climate information. Landsat-8 availability within GEE is facilitated through the United States Geological Survey (USGS) at https://www.usgs.gov/. Furthermore, the software used for the mapping was conducted using ARC GIS 10.8, while machine and deep learning analysis was performed using Python coding.
The Landsat-8 Multi-Spectral Instrument (MSI) featuring moderate resolution is a key data source and provides access to spectral bands used in this study. Detailed information regarding the specific Landsat-8 bands utilized is shown in (Table 1). Landsat-8 imagery from July 2023 was acquired for analysis for the Sukkur region. Notably, the selected imagery for this study had a cloud cover of less than 10%.
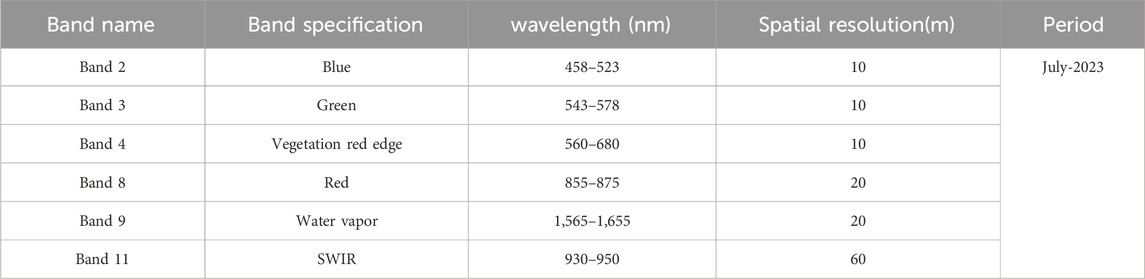
Table 1. Spectral band specifications for Landsat-8 used in the current research.
3.2 Methodology
The methodology we proposed, as shown in (Figure 2) and implemented in the context of Sukkur City, relies entirely on the GEE environment, and Python coding. The initial phase encompasses image Pre-processing data acquisition, involving retrieving composite satellite images from Landsat-8 as shown in (Figure 1) the second phase entails feature selection for creating training and validation datasets. The third phase encompasses the classification process, employing both machine learning and deep learning techniques using Python-based coding. Python requires libraries for classification Some of them are: Python libraries have been imported: OpenCV, Keras, Pandas, TensorFlow, Matplotlib, PyTorch, and SciKitlearn Lastly, the fourth phase involves a comparison of accuracy based on different algorithms of machine and deep learning to derive the outcomes. Subsequent sections provide in-depth elaboration on each of these phases.
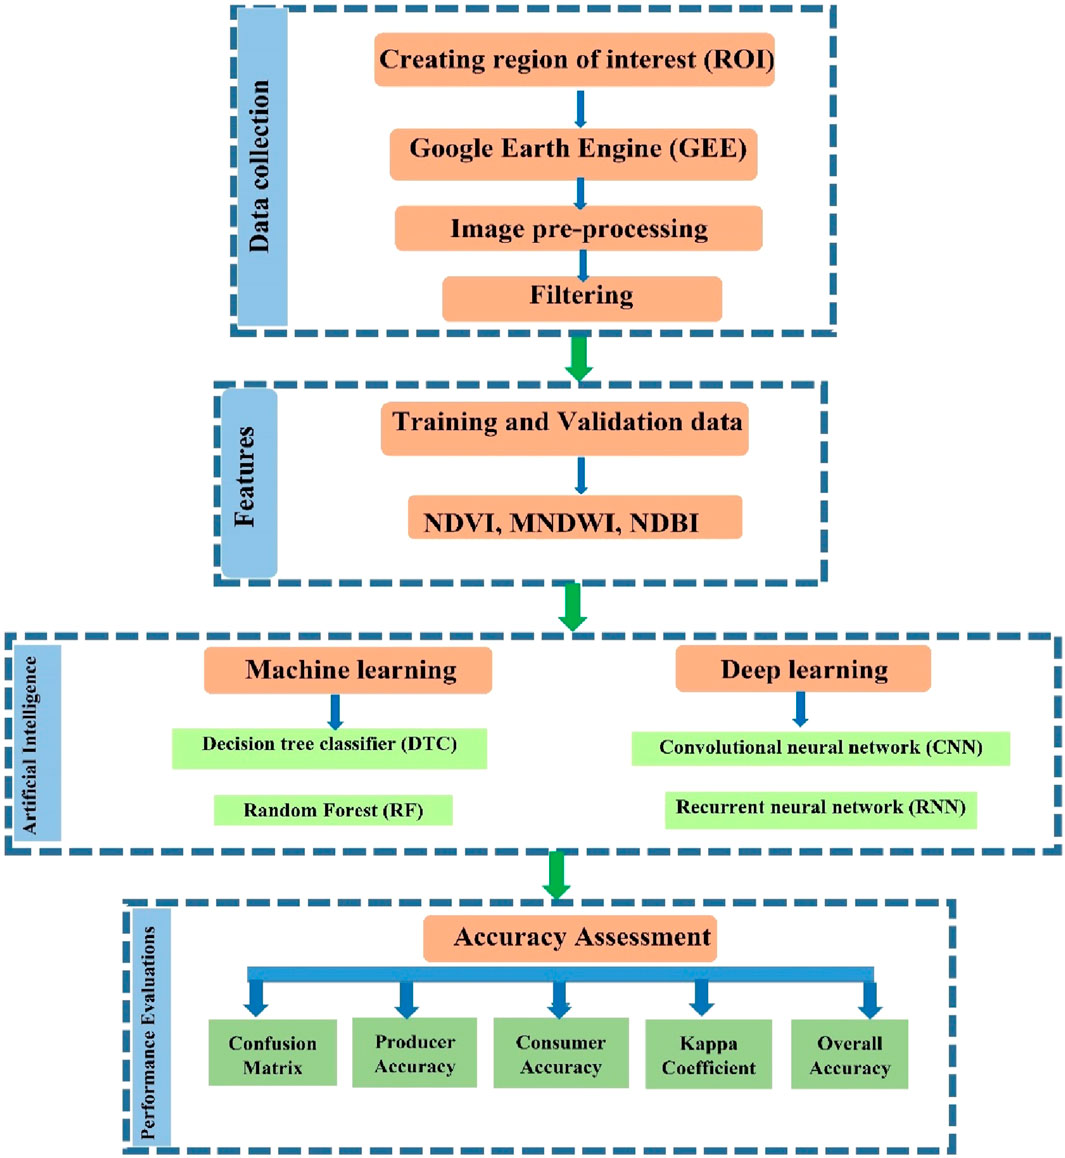
Figure 2. Overall framework of research.
3.3 Image pre-processing
The Landsat-8 data acquired undergo several preprocessing steps to improve image quality and usability. These procedures involve radiometric calibration, atmospheric correction, geometric rectification, and the removal of any noise or artifacts. Following preprocessing, the Landsat-8 data are subjected to image segmentation techniques (Yang et al., 2022), which partition the data into coherent objects or regions by grouping pixels with similar spectral characteristics. This segmentation process allows for the delineation of distinct ground features.
Spectral, textural, and contextual information pertinent to these segmented areas is extracted (Ouchra et al., 2023). The extraction process may involve computing various indices like NDVI, NDBI, MNDWI, and other calculated parameters, which quantitatively represent specific land cover attributes. These extracted features are then employed in classifying land cover types within the Landsat-8 data. For classification, we compare two machine learning algorithms (Random Forest and Decision Trees) and two deep learning algorithms (Convolutional Neural Networks and Recurrent Neural Networks). The classifier is trained using training samples to ensure the creation of precise land cover maps (Ouchra and Belangour). Evaluating the accuracy of land classification involves comparing the results of the classification process with ground truth data or reference datasets. Performance metrics, including overall accuracy and the kappa coefficient, are computed to assess the efficacy of the classification algorithm (Anokye et al., 2024). After generating land cover maps from Landsat-8 data, further analyses can be conducted to extract meaningful insights into environmental alterations, urban development, vegetation dynamics, and other pertinent applications.
Further post-processing steps could include data fusion, change detection, time series analysis, or spatial modeling, facilitating a deeper understanding of observed land cover patterns (Faqe Ibrahim et al., 2023). As shown in Figure 2 this methodology constitutes a complete flowchart utilized in the present study. Following the importation of Landsat-8 imagery into the Google Earth Engine (GEE) platform, data cleaning was performed to Remove undesired pixels through the application of the cloud mask technique (Růžička et al., 2022), as proposed by Zurqani et al. (2022), Rajendiren et al. (2023). In this study, three indices, NDVI, NDBI, and MNDWI, as shown in Figures 3A–C, were used for analysis.
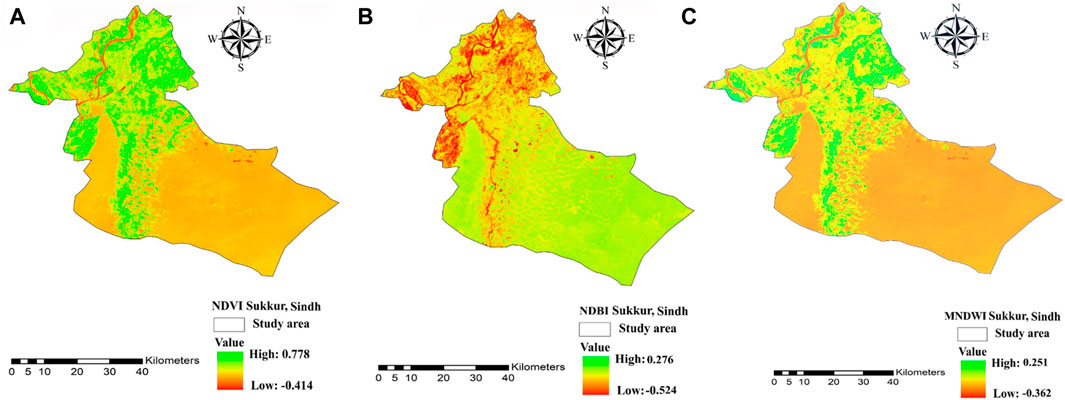
Figure 3. (A) Normalized difference vegetation index. (B) Normalized difference built index. (C) Modified normalized difference water index.
This phenomenon primarily arises from the inherent internal structure of plant leaves. It involves the utilization of two specific bands: one characterized by high reflectance in the near-infrared spectrum (NIR) and the other marked by significant absorption in the red spectrum. NDVI is calculated using the following formula, as detailed in Eq. 1, based on Landsat-8 NIR and red bands (Anyamba and Tucker, 2012).
NDBI is a valuable tool for extracting information regarding Built-up land from remote sensing imagery. When coupled with a well-chosen threshold, NDBI effectively isolates impervious surfaces within urban regions. As explained in (Eq. 2) the computation of NDBI for Landsat-8 images, utilizes data from the Short-Wave Infrared (SWIR) and Near-Infrared (NIR) bands (Kuc and Chormański, 2019).
A significant drawback of McFeeters’ NDWI is its limited ability to effectively reduce signal noise originating from Built-up land cover features, as highlighted (Nugroho, 2013). Xu’s observations revealed that water bodies exhibit higher Absorbance in the Short-Wave Infrared (SWIR) band is contrasted with that in the Near-Infrared (NIR) band, with the built land class showing higher radiation intensity in the SWIR band compared to the NIR band. To address these limitations, introduced the MNDWI (Xu, 2006) which quantifies the normalized Difference between the NIR and SWIR (Band 11), as expressed in Eq. 3.
In the final phase, machine and deep learning models, specifically Decision Trees (DTC), Random Forest (RF), Convolutional Neural Networks (CNN), and Recurrent Neural Networks (RNN), were implemented within the Google Earth Engine (GEE) to instruct the classifier in handling Landsat-8 data. The resultant Land Use and Land Cover (LULC) map has been classified into four categories: Vegetation, Built-up areas, barren land, and water bodies. Detailed descriptions of these classes are mentioned in Table 2.
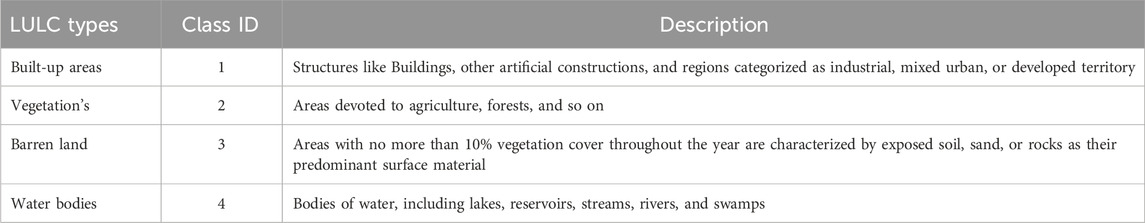
Table 2. Description of classes of land use and land cover.
3.4 Machine and deep learning models
The significance of using Random Forest (RF), Decision Trees (DTC), Convolutional Neural Networks (CNN), and Recurrent Neural Networks (RNN) in conjunction with geospatial methodologies for Land Use and Land Cover (LULC) (Sertel et al., 2022; Swetanisha et al., 2022) employed classification algorithms to determine which ones perform the best in terms of accuracy, producer accuracy, user accuracy, and kappa coefficient. Our suggested work approach is fully developed in the GEE environment, entirely using all its capabilities to test various variable combinations and gather reliable data to enhance each stage of classification, optimize input data acquisition, and ultimately reach the highest levels of accuracy. Additionally (Jamil et al., 2023), these models facilitate the detection of temporal changes, thereby providing important understandings for land management, environmental management, monitoring, and urban planning (Rane et al., 2023).
Upon collecting training data and assembling properties encompassing known class labels and numerical predictor values, the next step involves the instantiation of classifiers and, if necessary, defining their parameters. Within the Google Earth Engine (GEE) platform exists a dedicated 'Classifier’ package designed to manage supervised classification through the machine and deep learning algorithms (Liu et al., 2022). In this study, we utilized four classifiers, namely, RF, DTC, CNN, and RNN. In this phase, we trained these algorithms using the constructed training data. Subsequently, we applied them to classify our composite image collection, considering specific bands to generate a classified map of the study area ultimately.
3.4.1 Random forest (RF)
Random Forest (RF) stands as a widely employed machine learning algorithm conceived by (Li et al., 2016), notable for its unique approach of amalgamating outputs from multiple decision trees to yield a singular result (Kashyap, 2023). This algorithm has garnered popularity owing to its user-friendly nature and adaptability, proficiently addressing both classification and regression problems (Cengiz et al., 2023). The essence of the Random Forest technique lies in its construction of numerous decision trees, thus earning its terminology as a 'forest.’ This forest of decision trees contributes to more accurate predictions by aggregating data from these individual trees. While an individual decision tree typically yields a solitary outcome with a limited scope of categories, the Random Forest harnesses the collective wisdom of a more significant number of decision trees to enhance prediction accuracy. Additionally, it introduces a degree of randomness into the model by selecting the most appropriate feature from a randomly chosen subset of available features (Chang et al., 2022).
One of the foremost advantages of the Random Forest algorithm is its remarkable versatility (Loddo et al., 2023). It seamlessly accommodates regression and classification tasks, offering the added benefit of transparently revealing the relative importance of input features. This adaptability and its nonlinear nature render it exceptionally well-suited to diverse data and scenarios (Pokhariya et al., 2023). This may be stated numerically as Eq. 4. The “Mode” function returns the most common class prediction in the individual trees.
3.4.2 Decision Tree Classifier (DTC)
The Decision Tree Classifier (DTC) is a versatile tool in supervised learning, serving classification and regression tasks (Azam et al., 2023). It generates a tree-like framework in which internal nodes represent attribute tests, branches indicate test results, and leaf nodes hold class labels (Figure 4). The process of tree formation involves recursively dividing the training data into subsets, driven by attribute values, until certain stopping criteria, such as maximum tree depth or the minimum samples necessary for a split, are fulfilled (Lee et al., 2022). During training, the Decision Tree algorithm selects the optimal attribute for data partitioning, typically employing metrics like Entropy or Gini impurity to measure impurity or randomness in subsets Eqs 5, 6 respectively(Disha et al., 2022). The objective is to identify the attribute that maximizes information gain or minimizes impurity post-split. Decision tree algorithms, including CART, C4.5, C5.0, and ID3, can handle diverse data types, such as nonlinear, numerical, and categorical (Dehghani et al., 2023), while accommodating missing values. Impurity metrics, specifically Gini impurity and Entropy, are commonly employed to evaluate split quality. Gini impurity, denoted as “Gini(t)” for a node “t” with “J” classes, quantifies the probability of misclassifying a randomly selected element if it were assigned a label randomly (Ehsani, 2022).
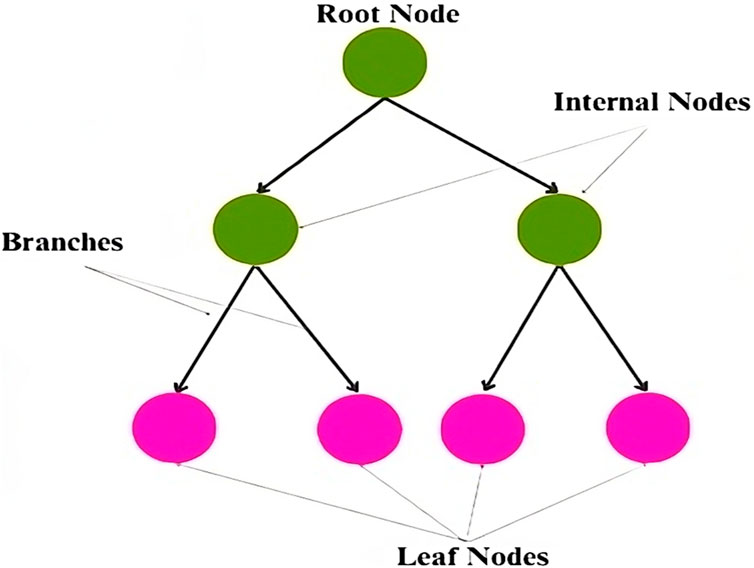
Figure 4. Graphical representation of Decision tree classifier.
Entropy is a measure of the disorder or unpredictability of a node. Entropy “Entropy(t)” is calculated as follows for a node “t” with “J” classes:
In our context, we have a binary classification scenario with two classes. To compute Pj, which represents the percentage of samples belonging to class “j” in node “t,” we first count the number of data points in node “t” for each class, denoted as Nj for j = 1, 2, J. The total number of data points in node “t” is Nt. Subsequently, we can calculate Pj by Eq. 7:
3.4.3 Convolution Neural Network (CNN)
Convolution Neural networks (CNN), a subset of machine learning, play a central role in deep learning algorithms, particularly for image-based tasks, due to their proficiency in capturing local patterns and spatial hierarchies in data (Zhao et al., 2023). They consist of layered nodes, Consisting of an input layer, one or more hidden layers, and an output layer; the network comprises interconnected nodes with corresponding weights and thresholds (Sawant et al., 2023). Activation occurs when a node’s output surpasses the specified threshold, as shown in (Figure 5). These networks utilize filters (kernels) that traverse input images to detect relevant patterns and features, crucial in tasks like land use classification. Pooling layers, such as Max Pooling, are employed to down sample spatial dimensions, reducing computational complexity while preserving essential features and enhancing network robustness and efficiency (Mc Cutchan and Giannopoulos, 2022). Following convolutional and pooling layers, fully connected layers facilitate learning high-level representations and making predictions based on earlier extracted features (Krivoguz et al., 2023). The choice of a loss function, like categorical cross-entropy for multi-class classification, is task-dependent. CNNs are trained using labeled data, with model parameters adjusted during training to minimize the disparity between predicted and actual class labels.
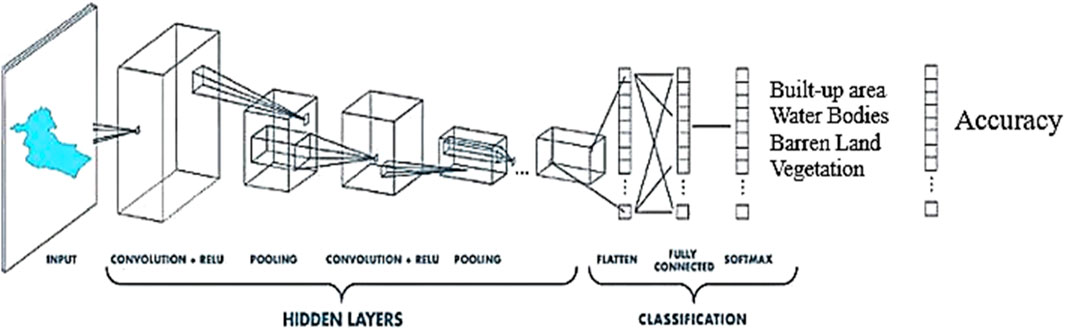
Figure 5. Graphical representation of Convolution Neural Network (CNN).
3.4.4 Recurrent neural network (RNN)
Recurrent Neural Networks (RNNs), a subset of deep learning networks, primarily refer to temporal recurrent neural networks, which specialize in processing sequential data with the critical objective of connecting the current output of a sequence with previous information to establish a recurrent link (Zhao et al., 2023). For visual representation (Figure 6), the central feature of RNNs is the persistent hidden state that spans input and output phases (Wang et al., 2022). This invisible state, alongside input vectors, undergoes updates and subsequently serves as an output alongside output vectors (Stateczny et al., 2022). Notably, the updated hidden state becomes part of the following input, preserving prior information (Moharram and Sundaram, 2023). RNNs find application in Land Use and Land Cover (LULC) classification in remote sensing images, which often encompass temporal and spatial data due to their robust material processing capabilities (Zhao et al., 2023).
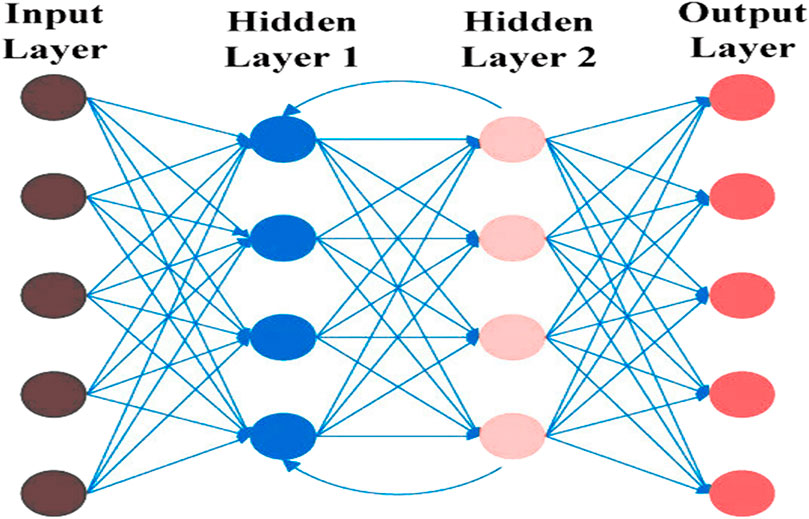
Figure 6. Graphical representation of Recurrent Neural Networks (RNN).
3.5 Accuracy assessment
The assessment of the classification map as described by (Kapishnikov et al.), demonstrated its high quality. Following the Land Use and Land Cover (LULC) classification, the machine and deep learning algorithm’s accuracy was assessed to gauge model performance. To facilitate this Evaluation, points representing Vegetation, water bodies, barren land, and Built-up areas were systematically scripted in Python-based coding and partitioned into datasets for both training and testing, with a split of 70% for training and 30% for testing. The Evaluation relied on a built-in function within Google Earth Engine (GEE) known as the confusion matrix, which validates and quantifies image categorization accuracy. The Kappa coefficient (Kc) and Overall Accuracy (OA) were calculated using Eqs 8, 9, respectively.
where Pn is the total number of pixels, and Pc is the number of correctly identified pixels.
In this process, where N represents the total number of observations, r stands for the number of rows and columns in the error matrix, xii signifies the number of observations in row I and column I, xi+ denotes the marginal total of row I, and x+i represents the marginal total of column i. The user accuracy for each class is determined by calculating the ratio of perfectly classified pixels within that class to the total number of classified pixels. Similarly, the producer’s accuracy is established by determining the proportion of correctly classified pixels within each class of the reference data compared to the total number of pixels within that class. These accuracy measures typically range between −1 and +1, with values exceeding +0.5 indicating strong agreement with the classification (Talukdar et al., 2020).
In classification projects, the validation and accuracy assessment steps are essential. This stage plays an essential role in evaluating models and mapping by determining their reliability and scientific significance. The main aim at this point is to compare the classified image with ground truth data we followed a systematic process (Figure 2) to obtain the dataset. Our approach to evaluating and calculating the accuracy of each classification method represented as the accuracy of map classified, involved generating the set of random points from the ground truth data sets and compared them with the classified data (classified map) (Alam and Mohanty). By using the significance of confusion matrix which lies not only in its ability to quantify various errors made by a prediction algorithm but, more importantly, in its capacity to distinguish and categorize the different types of errors made.
4 Results
4.1 Classifications of land use land cover
In this study, Landsat-8 satellite imagery was utilized for land cover mapping within our designated study area. An operation was conducted to extract reflectance data from Landsat-8 image bands to enable land cover classification based on spectral features. Additionally, we acquired Landsat-8 imagery from July 2023 for the Sukkur region, with a spatial resolution of 10 m for bands B1 to B7. We employed the Google Earth Engine (GEE) cloud platform to address data availability, storage, and preprocessing challenges, which were particularly crucial due to the extensive feature space created by the seven spectral bands and the multiple land cover classes (four classes) in our study area detailed in Table 2. This approach expedited the computation process, as local computation would have been time-consuming.
The ongoing investigation evaluates the efficacy of machine and deep learning methodologies, specifically Random Forest (RF), Decision Tree Classifier (DTC), Convolutional Neural Network (CNN), and Recurrent Neural Network (RNN), For Land Use and Land Cover (LULC) classification in District Sukkur, Pakistan, this investigation involved the computation of three satellite indices (NDVI, NDBI, and MNDWI) from Landsat-8 data. Subsequently, these indices were employed in applying algorithms to classify four primary categories. Built-up Area, Water Bodies, Barren Land, and Vegetation. The resulting LULC map generated by the RF machine learning model is shown in (Figure 7A), revealing that 2.7% (142 km2) is Built-up area, 1.9% (99 km2) is water bodies, 54.8% (2,835 km2) is barren land, and 40.4% (2,089 km2) is Vegetation.
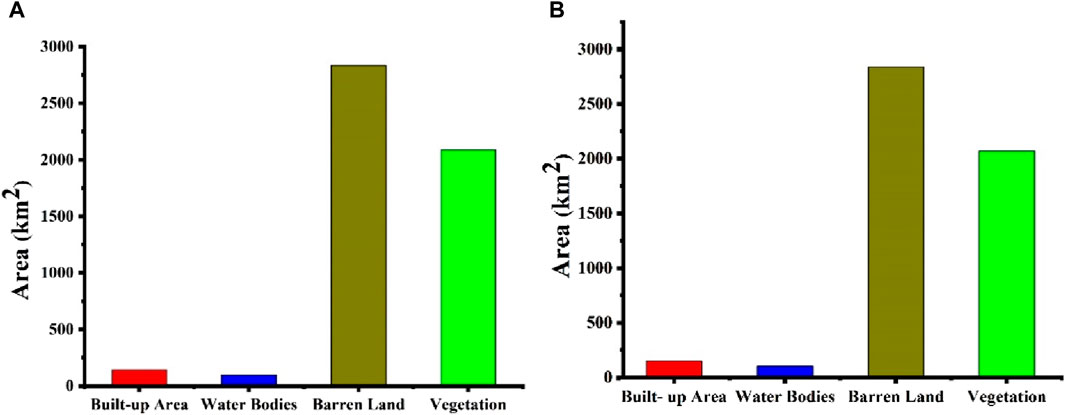
Figure 7. Area of LULC classes in km2 using machine learning models. (A) Random forest models. (B) Decision tree classifier (DTC).
Similarly, the LULC map produced by the DTC model for Sukkur District, Pakistan, is shown in Figure 7B. According to the classification results, 2.8% (149 km2) is Built-up area, 2% (105 km2) is water bodies, 54.9% (2,840 km2) is barren land, and 40.1% (2,070 km2) is Vegetation.
Additionally, our investigation included deep learning models such as CNN and RNN. The outcomes of the CNN model applied to our research region’s Land Use and Land Cover (LULC) map can be observed in Figure 8A. The classification results indicate that 3.8% (201 km2) corresponds to Built-up areas, 2.5% (130 km2) to water bodies, 49% (2,535 km2) to barren land, and 44.5% (2,299 km2) to Vegetation. Similarly, the results of the RNN model applied to the LULC map of our research area, are presented in Figure 8B. The classification outcomes show that 3.6% (190 km2) represents Built-up areas, 2.3% (120 km2) represents water bodies, 49.2% (2,542 km2) corresponds to barren land, and 44.7% (2,314 km2) belongs to Vegetation.
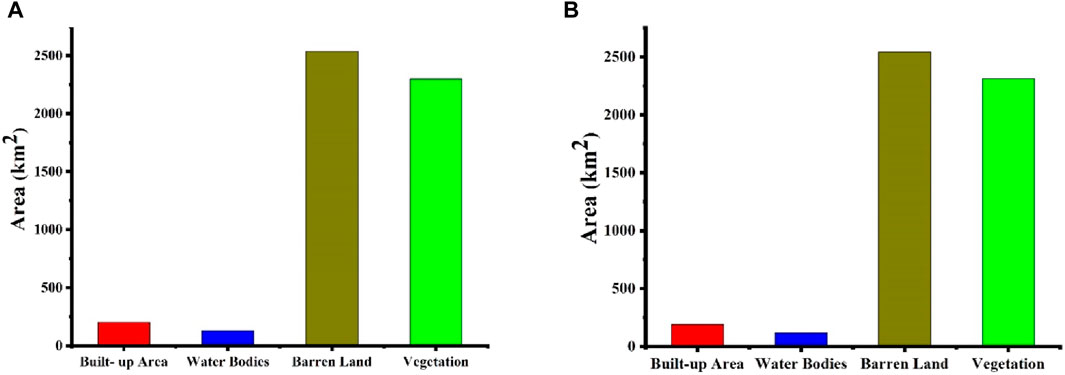
Figure 8. Area of LULC classes in km2 using deep learning models (A) Convolution Neural Network (CNN). (B) Recurrent Neural Network (RNN).
4.2 Performance evaluation of machine and deep learning model
The performance of each model, including RF, DTC, CNN, and RNN, was evaluated based on both the user’s accuracy (UA) and the producer’s accuracy (PA) for each Land Use and Land Cover (LULC) class. We present the UA and PA results individually for each LULC class since the models exhibited varying performance across different land cover types. The specific UA and PA values for each LULC class are provided below.
4.2.1 Radom forest accuracy of user and producer
The Random Forest model achieves the land classification performance. Within the Built-up Area category, the model correctly identifies 157,778 units, encompassing an area of 142 square kilometers, constituting approximately 2.75% of the total study area. The model exhibits a notable User Accuracy of 94.2%, indicating a high probability of precise classification, and a Producer Accuracy of 93%, affirming the model’s reliability. As shown in Figure 9A the Water Bodies category, the Random Forest model accurately classifies 110,000 units, covering an area of 99 square kilometers, equivalent to roughly 1.92% of the total area. Notably, the User Accuracy for Water Bodies reaches an impressive 99.6%, underscoring the model’s exceptional precision, while the Producer Accuracy stands at 98.3%, further emphasizing its reliability. For the Barren Land classification, the model successfully identifies 3,150,000 units, representing a vast area of 2,835 square kilometers, approximately 54.89% of the study area. The Producer Accuracy attains 91.2%, signifying a dependable classification, while the User Accuracy is 90.2%. In the Vegetation category, the Random Forest algorithm proficiently classifies 2,321,111 units, covering an area of 2,089 square kilometers, roughly 40.45% of the total area. The User Accuracy for Vegetation is 92.2%, highlighting the model’s competency, and the Producer Accuracy is 91.2%, further substantiating its reliability. The presented Table 3 provides a comprehensive account of the overall Random Forest model, which achieves an impressive overall accuracy of 91.3%, indicating its capability to accurately classify land cover across all categories within the study area. Moreover, the Kappa coefficient, with a value of 0.90, signifies a strong concurrence between the model’s predictions and the actual land classifications, further affirming the Random Forest model’s robust and dependable performance in this land classification endeavor.
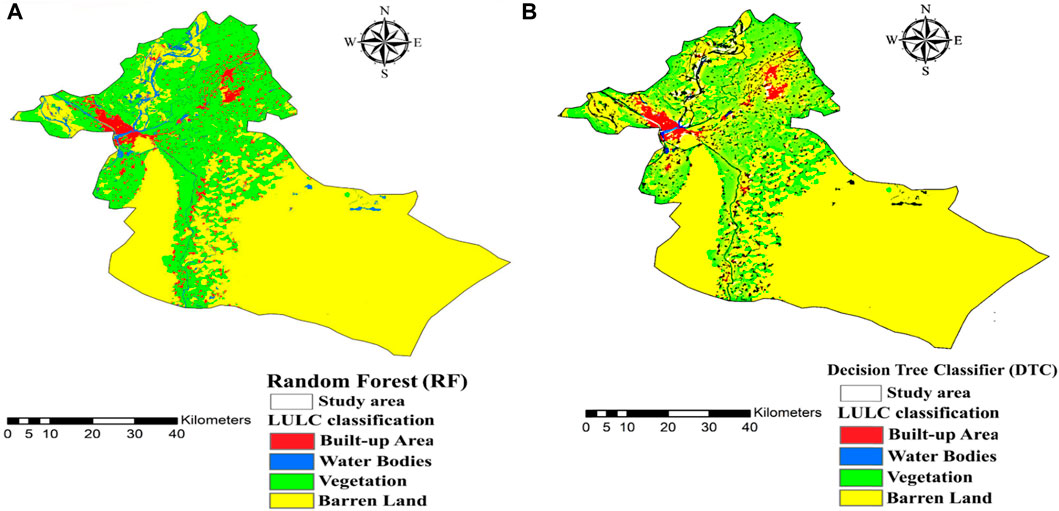
Figure 9. Land use land cover classification results of machine learning models (A) Random Forest (RF), (B) Decision Tree Classifier (DTC).
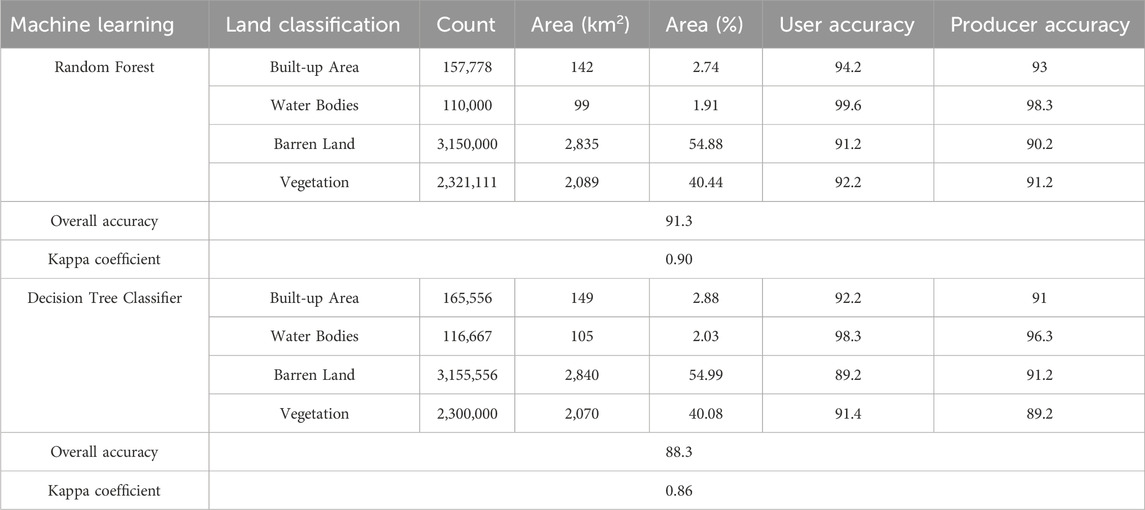
Table 3. Accuracy assessment of machine learning models for the classification of land use land cover.
4.2.2 Decision tree classifier accuracy of user and producer
The decision tree model’s outcomes are as follows Table 3. In the Built-up Area category, the algorithm identifies 165,556 units, encompassing an area of 149 square kilometers (approximately 2.89% of the total area). The User Accuracy for this category stands at 92.2%, while the Producer Accuracy is 91%. Moving to Water Bodies, the model correctly classifies 116,667 units, covering an area of 105 square kilometers (around 2.03% of the total area). Impressively, the User Accuracy for Water Bodies reaches 98.3%, and the Producer Accuracy is 96.3%. As shown in Figure 9B regarding Barren Land, the Decision Tree algorithm classifies a substantial 3,155,556 units with an area of 2,840 square kilometers (about 54.99% of the study area). The Producer Accuracy for this category is 91.2%, while the User Accuracy is 89.2%. In the Vegetation category, the Decision Tree model successfully identifies 2,300,000 units, covering an area of 2,070 square kilometers (approximately 40.08% of the total area). The User Accuracy for vegetation is 91.4%, while the Producer Accuracy is 89.2%. The overall accuracy of the decision tree model is 88.3%, representing the accuracy of the entire land classification process across all categories. Furthermore, the Kappa coefficient for the decision tree model is 0.86, indicating a somewhat lower level of agreement than the random forest model, which suggests a slightly lower performance in agreement between predictions and actual classifications.
In comparison, the random forest model generally outperforms the decision tree model regarding overall accuracy (91.3% vs. 88.3%) and the Kappa coefficient (0.90 vs. 0.86). It exhibits higher User and Producer Accuracy in most land categories, demonstrating its superior performance in accurately classifying land cover within the study area. These results highlight the Random Forest algorithm’s effectiveness and reliability in land classification tasks.
4.3 Performance evaluation of deep learning model
4.3.1 Convolution neural network accuracy of user and producer
The Convolutional Neural Network (CNN) model effectively classifies various land cover categories. Specifically, the model successfully categorizes 223,333 units as Up Area, covering a spatial extent of 201 square kilometers, equivalent to approximately 3.89% of the total study area. The high User Accuracy of 97.2% and a Producer Accuracy of 96.1% in this category indicate a substantial likelihood of accurate identification. Similarly, within the Water Bodies category, the CNN model identifies 144,444 units, encompassing 130 square kilometers or approximately 2.52% of the total study area, with an impressive User Accuracy of 99.5% and a Producer Accuracy of 99.3%. Barren Land, constituting 2,816,667 units and covering 2,535 square kilometers (approximately 49.08% of the study area), is reliably classified with a User Accuracy of 93.6% and a Producer Accuracy of 92.2%. The Vegetation category sees successful classification of 2,554,444 units, covering 2,299 square kilometers or about 44.51% of the total area, with a User Accuracy of 96.9% and a Producer Accuracy of 92.2%. The detailed models in the provided Table 4 and Figure 10A, thus overall, the CNN model achieves an impressive overall accuracy of 97.3% and a Kappa coefficient of 0.93, demonstrating robust agreement between its predictions and the actual classifications across diverse land cover types.
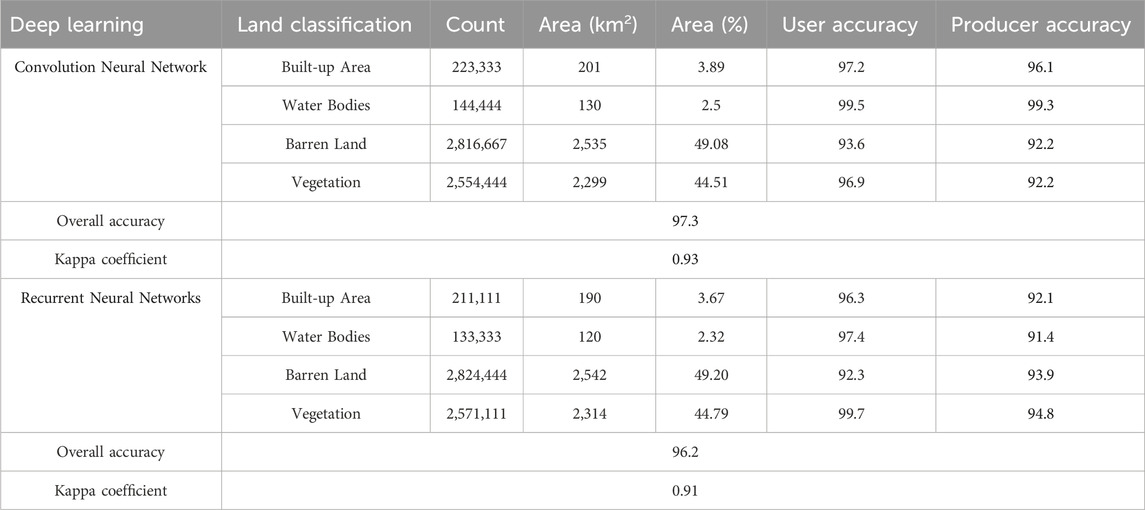
Table 4. Accuracy assessment of deep learning models for land use land cover classification.
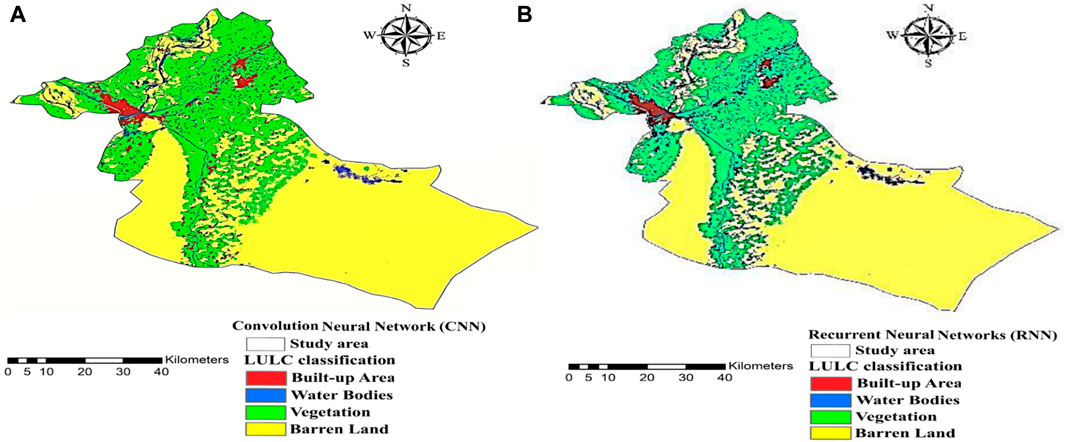
Figure 10. Land use land cover classification results of deep learning models (A) Convolution Neural Network (CNN), (B) Recurrent Neural Network (RNN).
4.3.2 Recurrent neural networks accuracy of user and producer
The outcomes of the RNN model proficiently classify 211,111 units, corresponding to a spatial extent of 190 square kilometers, accounting for approximately 3.68% of the total area. Notably, the User Accuracy in this classification stands at 96.3%, with a corresponding Producer Accuracy of 92.1%. Moving to the Water Bodies category, the RNN model identifies 133,333 units, covering an area of 120 square kilometers (around 2.32% of the total area), achieving a User Accuracy of 97.4% and a Producer Accuracy of 91.4%. Barren Land, comprising 2,824,444 units and spanning an area of 2,542 square kilometers (about 49.21% of the study area), is successfully classified by the RNN model, attaining a User Accuracy of 92.3% and a Producer Accuracy of 93.9%. The RNN algorithm accurately classifies 2,571,111 units in the Vegetation category, encompassing 2,314 square kilometers or approximately 44.79% of the total area. The models are provided Table 4 and Figure 10B. The User Accuracy for Vegetation is notably high at 99.7%, and the Producer Accuracy is 94.8%. Globally, the RNN model achieves an impressive overall accuracy of 96.2% and exhibits a Kappa coefficient of 0.91, indicating substantial concordance between its predictions and the actual land classifications.
In summary, the results of the deep learning-based land classification study demonstrate the effectiveness of both CNN and RNN models in accurately categorizing land cover across various categories. The CNN model showcases higher overall accuracy and a more substantial agreement with actual classifications. The RNN model also performs well but with slightly lower overall accuracy and Kappa coefficient values. These findings provide valuable insights into the potential applications of deep learning for land classification tasks.
4.4 Model validations
The model validations conducted in this study adhere to rigorous scientific protocols to assess the accuracy and reliability of different land classification models. These validations serve as critical benchmarks for evaluating the performance of machine learning and deep learning methodologies in categorizing land cover. Comparing the Random Forest and Decision Tree models, statistical measures such as overall accuracy and the Kappa coefficient were employed (Demir and Sahin, 2022). The Random Forest model exhibited a remarkable overall accuracy of 91.3% with a Kappa coefficient of 0.90, indicating a strong agreement between its predictions and the actual land classifications. In contrast, the Decision Tree model yielded a slightly lower overall accuracy of 88.3% and a Kappa coefficient of 0.86, suggesting a slightly reduced level of agreement. The deep learning models, specifically the Convolutional Neural Network (CNN) and Recurrent Neural Network (RNN), were subjected to similar validations. The CNN model demonstrated exceptional accuracy, achieving an overall accuracy of 97.3% and a Kappa coefficient of 0.93, highlighting a solid concurrence between predictions and actual classifications. Notably, the CNN model excelled in accurately classifying Water Bodies, with User and Producer Accuracy exceeding 99%. The RNN model, while slightly less accurate, with an overall accuracy of 96.2% and a Kappa coefficient of 0.91, still delivered commendable results. It exhibited remarkable accuracy in classifying Vegetation, achieving a User Accuracy of 99.7%. The learning curves of both machine and deep learning models are shown in the (Figures 11A–D). Thus, these model validations adhere rigorously to the standards of scientific investigation, exemplifying robust empirical inquiry. Through systematic evaluation of diverse land classification methodologies, these validations offer invaluable insights into the strengths and limitations of each approach. Furthermore, the results derived from these learning curves underscore the efficacy of both machine learning and deep learning models in accurately categorizing land cover. This precision carries significant implications across various fields, particularly in geospatial analysis and environmental monitoring.
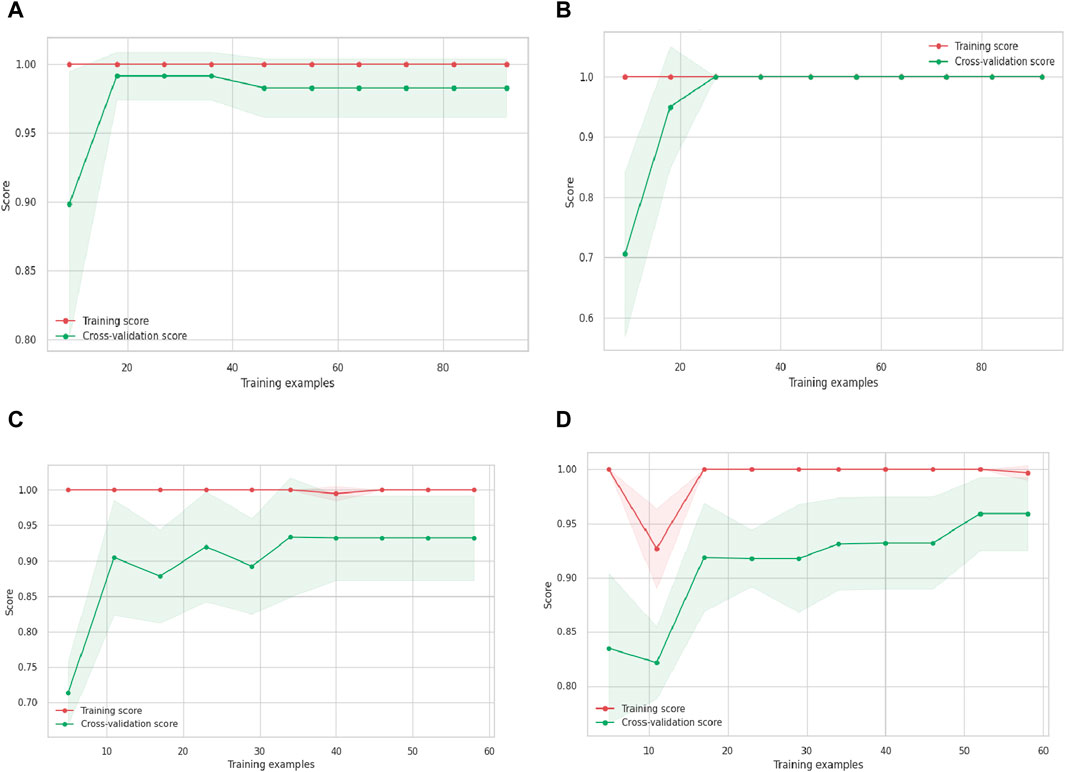
Figure 11. Learning curve of machine and deep learning models (A) Random Forest, (B) Decision Tree Classifier (DTC), (C) Convolution Neural Network, (D) Recurrent Neural Networks.
5 Discussions
The capability for accurate categorization of Land Use and Land Cover (LULC) maps is essential in remote sensing applications. Key factors influencing accuracy include the choice of classifier, quality of training data, terrain variability, datasets utilized, and availability of reference maps. Remote sensing continues to advance through enhanced sensor resolutions, vast accessible data archives, and increased processing capabilities. Google Earth Engine (GEE) has gained significant traction due to its free access to datasets and cloud-based platform offering extensive geospatial analysis and modeling capabilities. Users can access, visualize, and analyze geospatial data worldwide through GEE, which hosts a comprehensive dataset ready for analysis, facilitating the testing of numerous applications. Ongoing improvements to ML and DL algorithms contribute to the effectiveness of GEE in readily producing composite images and performing intricate image processing tasks.
The results obtained in this study were derived from Landsat-8 datasets to evaluate the importance of machine and deep learning classifiers (RF, DTC, CNN, and RNN) and their respective accuracies in land classification. These datasets were employed to map the region of Sukkur, Pakistan, with the aim of delineating the area of each zone or category (Water bodies, Built-up, Barren Land, and Vegetation) and assessing the performance of each classifier utilized in this research. In accordance with our examination of previous studies (Yang et al., 2021; Nelson et al., 2022; Prasad et al., 2022; Sertel et al., 2022; Yang et al., 2022; Sellami and Rhinane, 2023; Zhao et al., 2023; Yari Hesar et al., 2024). From the recent studies, we discovered that the methodology employed in our experimentation could be adapted for mapping and evaluating various areas in different countries or cities. The image classification results were assessed based on the accuracy of each classifier. We computed User’s Accuracy (UA), Producer’s Accuracy (PA), Overall Accuracy (OA), and Kappa Coefficient (Kc) as shown in Tables 3, 4 to evaluate the accuracy outcomes for Land Use and Land Cover (LULC) mapping utilizing the applied algorithms. As discussed in the recent study report by Panhwar et al. (2024) the spatio-temporal variation in land use and land cover (LULC) Sindh Pakistan employed the supervised classification, we have also selected to integrate spectral indices into the training data and the bands of the Landsat-8 satellite image that we utilized. In this study, efforts were made to improve the performance of the classifiers for achieving better classification results in our study area. Spectral indices, including NDVI, MNDWI, and NDBI, were incorporated to aid in this enhancement. According to reports (Amini et al., 2022; Azedou et al., 2023), both the Random Forest and CNN models demonstrated robust performance in LULC classification, achieving impressive overall accuracy. These models accurately categorized Built-up Areas, Water Bodies, Barren Land, and Vegetation. Notably, its high User and Producer Accuracy in most categories underscores its reliability (Dehghani et al., 2023; Kanakala and Reddy, 2023). While slightly less accurate, the Decision Tree classifier and Recurrent Neural Network (RNN) model also provided dependable classifications. The Convolutional Neural Network (CNN) (Raschka et al., 2022), particularly, demonstrates remarkable accuracy and potential for practical applications. Additionally, Random Forest (RF) models exhibited exceptional accuracy in land classification (Gaafar et al., 2022; Kanakala and Reddy, 2023).
In our current investigation, we observed consistent pattern where RF and CNN classifiers demonstrated proficiency in mapping and exhibited outstanding performance, particularly in accurately classifying water bodies and vegetation. The RNN model yielded commendable results, especially in categorizing vegetation. Additionally, barren land emerged as the most accurately classified category of Land Use and Land Cover (LULC) in this study. Previous studies have shown that various classifiers exhibit distinct performance levels when classifying different LULC categories using the same data and study periods (Safi et al., 2024). In our study, we also observed variations in the results of machine and deep learning models for mapping LULC in the study area (Roy et al., 2022). Our findings provide important baseline information for further research and applications in remote sensing using machine and deep learning models, geospatial analysis, and land management.
6 Conclusion
The primary objective of this study was to assess and compare the effectiveness of machine and deep learning classification algorithms in terms of overall accuracy (OA), producer accuracy (PA), user accuracy (UA), and Kappa coefficient (KC). Additionally, we aimed to evaluate the capability of the GEE platform and Landsat-8 data in classifying indices such as NDVI, NDBI, and MNDWI, derived from Landsat-8 data, and classifying four major categories: built-up area, water bodies, barren land, and vegetation. The Random Forest model demonstrated robust performance, achieving an overall accuracy of 91.3% with a Kappa coefficient of 0.90. It accurately classified 2.7% of the area as built-up area, 1.9% as water bodies, 54.8% as barren land, and 40.4% as vegetation. Similarly, the Decision Tree model provided reliable classifications, albeit slightly less accurate with an overall accuracy of 88.3% and a Kappa coefficient of 0.86. It identified 2.8% of the area as built-up area, 2% as water bodies, 54.9% as barren land, and 40.1% as vegetation. Deep learning models, CNN and RNN, demonstrated significant accuracy. The CNN model achieved an overall accuracy of 97.3%, with high User and Producer Accuracy for all categories. Similarly, the RNN model achieved an overall accuracy of 96.2%, with high User and Producer Accuracy. The findings of this study suggest that the GEE platform proves valuable for large-scale categorization tasks globally and nationally, employing various machine learning and deep learning models. Furthermore, it should be suggested that collaboration between governmental agencies, research institutions, and NGOs is vital to establish standardized protocols for land classification implementation. Additionally, maintaining and enhancing Earth observation platforms such as Google Earth Engine, while ensuring accessibility to high-resolution satellite imagery, is essential for effectively monitoring land cover dynamics. These measures enable authorities to make informed decisions and foster sustainable land management practices at regional and national levels.
While our study aimed to comprehensively evaluate the effectiveness of machine and deep learning classifications algorithms for Land Use and Land Cover (LULC) mapping, there are certain limitations to consider, along with avenues for future research and implementations. Based on our research investigations, future studies will focus on investigating unsupervised algorithms, which are expected to offer improved performance in classifying satellite images. This will facilitate the accomplishment of more accurate classification and identification of urban areas within the designated study region of Pakistan.
Data availability statement
The original contributions presented in the study are included in the article/supplementary material, further inquiries can be directed to the corresponding authors.
Author contributions
AN: Writing–original draft, Writing–review and editing. YL: Supervision, Formal Analysis, Investigation, Methodology, Resources, Software, Supervision, Validation, Visualization, Writing–review and editing. MJ: Conceptualization, Data curation, Formal Analysis, Investigation, Methodology, Project administration, Software, Visualization, Writing–original draft. AA: Conceptualization, Project administration, Funding acquisition, Methodology, Software, Visualization, Writing–review and editing. MA: Conceptualization, Data curation, Formal Analysis, Funding acquisition, Writing–review and editing.
Funding
The author(s) declare that no financial support was received for the research, authorship, and/or publication of this article.
Acknowledgments
We extend our appreciation to the Researchers Supporting Project (no. RSP2024R191), King Saud University, Riyadh, Saudi Arabia.
Conflict of interest
The authors declare that the research was conducted in the absence of any commercial or financial relationships that could be construed as a potential conflict of interest.
Publisher’s note
All claims expressed in this article are solely those of the authors and do not necessarily represent those of their affiliated organizations, or those of the publisher, the editors and the reviewers. Any product that may be evaluated in this article, or claim that may be made by its manufacturer, is not guaranteed or endorsed by the publisher.
Abbreviations
AI, Artificial Intelligence; BUA, Built-up area; CNN, Convolution Neural Network; DL, Deep Learning; DTC, Decision Tree Classifier; GEE, Google Earth Engine; GIS, Geographic Information System; KC, Kappa Coefficient; LSTM, Long Short-Term Memory; LULC, Land Use Land Cover; ML, Machine Learning; MNDWI, Modified Normalized Difference Water Index; MSI, Multi-Spectral Instrument; NDBI, Normalized Built index; NDVI, Normalized difference vegetation index; NIR, Near Infrared; NLP, Natural Language Processing; OA, Overall Accuracy; PA, Producer Accuracy; RF, Random Forest; RNN, Recurrent Neural Network; RS, Remote Sensing; SVM, Support Vector Machine; SWIR, Short Wave Infrared; UA, User Accuracy.
References
Abburu, S., and Golla, S. B. (2015). Satellite image classification methods and techniques: a review. Int. J. Comput. Appl. 119 (8), 20–25. doi:10.5120/21088-3779
Abro, K. J., Lakhan, H., and Soomro, A. S. (2022). Factors associated with obstetric fistulae: a snapshot of district larkana and Sukkur, Sindh. J. Soc. Obstetricians Gynaecol. Pak. 12 (2), 156–160.
Acharya, S., Hori, T., and Karki, S. (2023). Assessing the spatio-temporal impact of landuse landcover change on water yield dynamics of rapidly urbanizing Kathmandu valley watershed of Nepal. J. Hydrology Regional Stud. 50, 101562. doi:10.1016/j.ejrh.2023.101562
Agga, A., Abbou, A., Labbadi, M., El Houm, Y., and Ali, I. H. O. (2022). CNN-LSTM: an efficient hybrid deep learning architecture for predicting short-term photovoltaic power production. Electr. Power Syst. Res. 208, 107908. doi:10.1016/j.epsr.2022.107908
Alam, A., and Mohanty, A. (2023). “Predicting students’ performance employing educational data mining techniques,” in Machine learning, and learning analytics (Springer), 166–177.
Ali, M. I., Hasim, A. H., and Abidin, M. R. (2019). Monitoring the built-up area transformation using urban index and normalized difference built-up index analysis. Int. J. Eng. Trans. B Appl. 32 (5), 647–653.
Alshari, E. A., Abdulkareem, M. B., and Gawali, B. W. (2023). Classification of land use/land cover using artificial intelligence (ANN-RF). Front. Artif. Intell. 5, 964279. doi:10.3389/frai.2022.964279
Amini, S., Saber, M., Rabiei-Dastjerdi, H., and Homayouni, S. (2022). Urban land use and land cover change analysis using random forest classification of landsat time series. Remote Sens. 14 (11), 2654. doi:10.3390/rs14112654
Anokye, M., Cui, X., Yang, F., Wang, P., Sun, Y., Ma, H., et al. (2024). Optimizing multi-classifier fusion for seabed sediment classification using machine learning. Int. J. Digital Earth 17 (1), 2295988. doi:10.1080/17538947.2023.2295988
Anwar, Z., Alam, A., Elahi, N., and Shah, I. (2022). Assessing the trends and drivers of land use land cover change in district Abbottabad lower Himalayan Region Pakistan. Geocarto Int. 37 (25), 10855–10870. doi:10.1080/10106049.2022.2040604
Anyamba, A., and Tucker, C. J. (2012). Historical perspective of AVHRR NDVI and vegetation drought monitoring. Remote Sens. drought innovative Monit. approaches 23, 20.
Assede, E. S. P., Orou, H., Biaou, S. S. H., Geldenhuys, C. J., Ahononga, F. C., and Chirwa, P. W. (2023). Understanding drivers of land use and land cover change in Africa: a review. Curr. Landsc. Ecol. Rep. 8, 62–72. doi:10.1007/s40823-023-00087-w
Avtar, R., Tripathi, S., Aggarwal, A. K., and Kumar, P. (2019). Population–urbanization–energy nexus: a review. Resources 8 (3), 136. doi:10.3390/resources8030136
Awad, M. (2023) Google Earth Engine (GEE) cloud computing based crop classification using radar, optical images and Support Vector Machine Algorithm (SVM). IEEE, 71–76.
Azam, Z., Islam, M. M., and Huda, M. N. (2023). Comparative analysis of intrusion detection systems and machine learning based model analysis through decision tree. IEEE Access 11, 80348–80391. doi:10.1109/access.2023.3296444
Azedou, A., Amine, A., Kisekka, I., Lahssini, S., Bouziani, Y., and Moukrim, S. (2023). Enhancing Land Cover/Land Use (LCLU) classification through a comparative analysis of hyperparameters optimization approaches for deep neural network (DNN). Ecol. Inf. 78, 102333. doi:10.1016/j.ecoinf.2023.102333
Bhellar, M. G., Talpur, M. A. H., Khahro, S. H., Ali, T. H., and Javed, Y. (2023). Visualizing travel accessibility in a congested city center: a GIS-based isochrone model and trip rate analysis considering sustainable transportation solutions. Sustainability 15 (23), 16499. doi:10.3390/su152316499
Biagi, P., and Vidale, M. (2022). Lakheen-jo-daro, an Indus civilization settlement at Sukkur in upper Sindh (Pakistan): a scrap copper hoard and human figurine from a dated context. Asian Perspect. 61 (1), 2–27. doi:10.1353/asi.2022.0001
Boonpook, W., Tan, Y., Nardkulpat, A., Torsri, K., Torteeka, P., Kamsing, P., et al. (2023). Deep learning semantic segmentation for land use and land cover types using landsat 8 imagery. ISPRS Int. J. Geo-Information 12 (1), 14. doi:10.3390/ijgi12010014
Braun, A., Warth, G., Bachofer, F., Schultz, M., and Hochschild, V. (2023). Mapping urban structure types based on remote sensing data—a universal and adaptable framework for spatial analyses of cities. Land 12 (10), 1885. doi:10.3390/land12101885
Cao, C., Dragićević, S., and Li, S. (2019). Short-term forecasting of land use change using recurrent neural network models. Sustainability 11 (19), 5376. doi:10.3390/su11195376
Cengiz, A., Budak, M., Yağmur, N., and Balçik, F. (2023). Comparison between random forest and support vector machine algorithms for LULC classification. Int. J. Eng. Geosciences 8 (1), 1–10. doi:10.26833/ijeg.987605
Chang, V., Bhavani, V. R., Xu, A. Q., and Hossain, M. A. (2022). An artificial intelligence model for heart disease detection using machine learning algorithms. Healthc. Anal. 2, 100016. doi:10.1016/j.health.2022.100016
Choudhury, U., Singh, S. K., Kumar, A., Meraj, G., Kumar, P., and Kanga, S. (2023). Assessing land use/land cover changes and urban heat island intensification: a case study of Kamrup Metropolitan District, Northeast India (2000–2032). Earth 4 (3), 503–521. doi:10.3390/earth4030026
DeFries, R. S., and Townshend, J. R. G. (1994). NDVI-derived land cover classifications at a global scale. Int. J. remote Sens. 15 (17), 3567–3586. doi:10.1080/01431169408954345
Dehghani, A. A., Movahedi, N., Ghorbani, K., and Eslamian, S. (2023). “"Decision tree algorithms,” in Handbook of hydroinformatics (Elsevier), 171–187.
Demir, S., and Sahin, E. K. (2022). Comparison of tree-based machine learning algorithms for predicting liquefaction potential using canonical correlation forest, rotation forest, and random forest based on CPT data. Soil Dyn. Earthq. Eng. 154, 107130. doi:10.1016/j.soildyn.2021.107130
Digra, M., Dhir, R., and Sharma, N. (2022). Land use land cover classification of remote sensing images based on the deep learning approaches: a statistical analysis and review. Arabian J. Geosciences 15 (10), 1003. doi:10.1007/s12517-022-10246-8
Disha, R. A., and Waheed, S. (2022). Performance analysis of machine learning models for intrusion detection system using Gini Impurity-based Weighted Random Forest (GIWRF) feature selection technique. Cybersecurity 5 (1), 1. doi:10.1186/s42400-021-00103-8
dos Santos, B. D., de Pinho, C. M. D., Páez, A., and Amaral, S. (2023). Identifying urban and socio-environmental patterns of Brazilian amazonian cities by remote sensing and machine learning. Remote Sens. 15 (12), 3102. doi:10.3390/rs15123102
Ebenezer, P. A., and Manohar, S. (2023). Land use/land cover change classification and prediction using deep learning approaches. Signal, Image Video Process. 18, 223–232. doi:10.1007/s11760-023-02701-0
Ehsani, F. (2022) Customer churn prediction from Internet banking transactions data using an ensemble meta-classifier algorithm.
Faqe Ibrahim, G. R., Rasul, A., and Abdullah, H. (2023). Improving crop classification accuracy with integrated Sentinel-1 and Sentinel-2 data: a case study of barley and wheat. J. Geovisualization Spatial Analysis 7 (2), 22. doi:10.1007/s41651-023-00152-2
Farshidi, S., Farnood Ahmadi, F., and Sadeghi, V. (2023). Modeling and prediction of land use land cover change dynamics based on spatio-temporal analysis of optical and radar time series of remotely sensed images. Earth Sci. Inf. 16 (3), 2781–2793. doi:10.1007/s12145-023-01072-x
Gaafar, A. S., Dahr, J. M., and Hamoud, A. K. (2022). Comparative analysis of performance of deep learning classification approach based on LSTM-RNN for textual and image datasets. Informatica 46 (5). doi:10.31449/inf.v46i5.3872
Gazzinelli, A., Oliveira-Prado, R., Matoso, L. F., Veloso, B. M., Andrade, G., Kloos, H., et al. (2017). Schistosoma mansoni reinfection: analysis of risk factors by classification and regression tree (CART) modeling. PloS one 12 (8), e0182197. doi:10.1371/journal.pone.0182197
Guo, Q., Pu, R., Li, J., and Cheng, J. (2017). A weighted normalized difference water index for water extraction using Landsat imagery. Int. J. remote Sens. 38 (19), 5430–5445. doi:10.1080/01431161.2017.1341667
Hussein, E. E., Jat Baloch, M. Y., Nigar, A., Abualkhair, H. F., Aldawood, F. K., and Tageldin, E. (2023). Machine learning algorithms for predicting the water quality index. Water 15 (20), 3540. doi:10.3390/w15203540
Iqbal, J., Amin, G., Su, C., Haroon, E., and Baloch, M. Y. J. (2023). Assessment of landcover impacts on the groundwater quality using hydrogeochemical and geospatial techniques. Environ. Sci. Pollut. Res., 1–21. doi:10.1007/s11356-023-29628-w
Jagannathan, J., and Divya, C. (2021). Deep learning for the prediction and classification of land use and land cover changes using deep convolutional neural network. Ecol. Inf. 65, 101412. doi:10.1016/j.ecoinf.2021.101412
Jamil, M., Rehman, H., Saqlain Zaheer, M., Tariq, A., Iqbal, R., Hasnain, M. U., et al. (2023). The use of Multispectral Radio-Meter (MSR5) data for wheat crop genotypes identification using machine learning models. Sci. Rep. 13 (1), 19867. doi:10.1038/s41598-023-46957-5
Jat Baloch, M. Y., Zhang, W., Shoumik, B. A. A., Nigar, A., Elhassan, A. A. M., Elshekh, A. E. A., et al. (2022). Hydrogeochemical mechanism associated with land use land cover indices using geospatial, remote sensing techniques, and health risks model. Sustainability 14 (24), 16768. doi:10.3390/su142416768
Jena, B., Nayak, G. K., and Saxena, S. (2022). Convolutional neural network and its pretrained models for image classification and object detection: a survey. Concurrency Comput. Pract. Exp. 34 (6), e6767. doi:10.1002/cpe.6767
Jeyavathana, R. B. (2022). Land use and land cover classification using landsat-8 multispectral remote sensing images and long short-term memory-recurrent neural network (College Park, MD: AIP Publishing).
Kanakala, R., Reddy, K., and V, K. R. (2023). Modelling a deep network using CNN and RNN for accident classification. Meas. Sensors 27, 100794. doi:10.1016/j.measen.2023.100794
Kapishnikov, A., Venugopalan, S., Avci, B., Wedin, B., Terry, M., and Bolukbasi, T. (2018) Guided integrated gradients: an adaptive path method for removing noise, 5050–5058.
Kashyap, P. (2023). “Machine learning algorithms and their relationship with modern technologies,” in Machine learning for decision makers: cognitive computing fundamentals for better decision making (Springer), 165–245.
Krivoguz, D., Chernyi, S. G., Zinchenko, E., Silkin, A., and Zinchenko, A. (2023). Using Landsat-5 for accurate historical LULC classification: a comparison of machine learning models. Data 8 (9), 138. doi:10.3390/data8090138
Kuc, G., and Chormański, J. (2019). Sentinel-2 imagery for mapping and monitoring imperviousness in urban areas. Int. Archives Photogrammetry, Remote Sens. Spatial Inf. Sci. 42, 43–47. doi:10.5194/isprs-archives-xlii-1-w2-43-2019
Kussul, N., Lavreniuk, M., Skakun, S., and Shelestov, A. (2017). Deep learning classification of land cover and crop types using remote sensing data. IEEE Geoscience Remote Sens. Lett. 14 (5), 778–782. doi:10.1109/lgrs.2017.2681128
Lee, S., Lee, C., Mun, K. G., and Kim, D. (2022). Decision tree algorithm considering distances between classes. IEEE Access 10, 69750–69756. doi:10.1109/access.2022.3187172
Li, X., Chen, W., Cheng, X., and Wang, L. (2016). A comparison of machine learning algorithms for mapping of complex surface-mined and agricultural landscapes using ZiYuan-3 stereo satellite imagery. Remote Sens. 8 (6), 514. doi:10.3390/rs8060514
Liu, C., Ma, Q., Luo, Z. J., Hong, Q. R., Xiao, Q., Zhang, H. C., et al. (2022). A programmable diffractive deep neural network based on a digital-coding metasurface array. Nat. Electron. 5 (2), 113–122. doi:10.1038/s41928-022-00719-9
Loddo, A., Di Ruberto, C., Vale, A., Ucchesu, M., Soares, J. M., and Bacchetta, G. (2023). An effective and friendly tool for seed image analysis. Vis. Comput. 39 (1), 335–352. doi:10.1007/s00371-021-02333-w
Magidi, J., Nhamo, L., Mpandeli, S., and Mabhaudhi, T. (2021). Application of the random forest classifier to map irrigated areas using google earth engine. Remote Sens. 13 (5), 876. doi:10.3390/rs13050876
Mc Cutchan, M., and Giannopoulos, I. (2022). Encoding geospatial vector data for deep learning: LULC as a use case. Remote Sens. 14 (12), 2812. doi:10.3390/rs14122812
Mekonnen, E. N., Damene, S., Gebremariam, E., and Nebebe, A. (2023). Geospatially-based land use/land cover dynamics detection, central Ethiopian rift valley. GeoJournal 88 (3), 3399–3417. doi:10.1007/s10708-022-10815-0
Mhanna, S., Halloran, L. J. S., Zwahlen, F., Asaad, A. H., and Brunner, P. (2023). Using machine learning and remote sensing to track land use/land cover changes due to armed conflict. Sci. Total Environ. 898, 165600. doi:10.1016/j.scitotenv.2023.165600
Moharram, M. A., and Sundaram, D. M. (2023). Land use and land cover classification with hyperspectral data: a comprehensive review of methods, challenges and future directions. Neurocomputing 536, 90–113. doi:10.1016/j.neucom.2023.03.025
Moisa, M. B., Dejene, I. N., and Gemeda, D. O. (2022). Integration of geospatial technologies with multiple regression model for urban land use land cover change analysis and its impact on land surface temperature in Jimma City, southwestern Ethiopia. Appl. Geomatics 14 (4), 653–667. doi:10.1007/s12518-022-00463-x
Nelson, P. R., Maguire, A. J., Pierrat, Z., Orcutt, E. L., Yang, D., Serbin, S., et al. (2022). Remote sensing of tundra ecosystems using high spectral resolution reflectance: opportunities and challenges. J. Geophys. Res. Biogeosciences 127 (2), e2021JG006697. doi:10.1029/2021jg006697
Nugroho, J. T. (2013). Identification of inundated area using normalized difference water index (NDWI) on lowland region of Java island. Int. J. Remote Sens. Earth Sci. (IJReSES) 10 (2).
Ouchra, H., and Belangour, A. (2022). Object detection approaches in images: a survey. SPIE, 132–141.
Ouchra, H., Belangour, A., and Erraissi, A. (2022). A comparative study on pixel-based classification and object-oriented classification of satellite image. Int. J. Eng. Trends Technol. 70 (8), 206–215. doi:10.14445/22315381/ijett-v70i8p221
Ouchra, H., Belangour, A., and Erraissi, A. (2023). Machine learning algorithms for satellite image classification using Google Earth Engine and Landsat satellite data: Morocco case study. IEEE Access 11, 71127–71142. doi:10.1109/access.2023.3293828
Panhwar, M. A., Anwar, M. M., and Maitlo, A. A. (2024). Spatio-temporal variation in land use and land cover from 1988 to 2018: a study of district khairpur mir’s, Pakistan. J. Dev. Soc. Sci. 5 (1), 562–571.
Pokhariya, H. S., Singh, D. P., and Prakash, R. (2023). Evaluation of different machine learning algorithms for LULC classification in heterogeneous landscape by using remote sensing and GIS techniques. Eng. Res. Express 5 (4), 045052. doi:10.1088/2631-8695/acfa64
Prasad, P., Loveson, V. J., Chandra, P., and Kotha, M. (2022). Evaluation and comparison of the earth observing sensors in land cover/land use studies using machine learning algorithms. Ecol. Inf. 68, 101522. doi:10.1016/j.ecoinf.2021.101522
Praticò, S., Solano, F., Di Fazio, S., and Modica, G. (2021). Machine learning classification of mediterranean forest habitats in google earth engine based on seasonal sentinel-2 time-series and input image composition optimisation. Remote Sens. 13 (4), 586. doi:10.3390/rs13040586
Rajendiren, N., Ram, S., Vaithalingam, S., Shanmugam, P., Ramasamy, R., and Suresh, M. (2023) Spatial temporal analysis of the mangrove forest using the google earth engine cloud computing platform for Pichavaram. South East Coast of India.
Rane, N., Choudhary, S., and Rane, J. (2023) Leading-edge artificial intelligence (AI) and internet of things (IoT) technologies for enhanced geotechnical site characterization. Available at SSRN 4640926.
Raschka, S., Liu, Y. H., Mirjalili, V., and Dzhulgakov, D. (2022) Machine Learning with PyTorch and Scikit-Learn: develop machine learning and deep learning models with Python. Packt Publishing Ltd.
Roy, P. S., Ramachandran, R. M., Paul, O., Thakur, P. K., Ravan, S., Behera, M. D., et al. (2022). Anthropogenic land use and land cover changes—a review on its environmental consequences and climate change. J. Indian Soc. Remote Sens. 50 (8), 1615–1640. doi:10.1007/s12524-022-01569-w
Růžička, V., Vaughan, A., De Martini, D., Fulton, J., Salvatelli, V., Bridges, C., et al. (2022). RaVÆn: unsupervised change detection of extreme events using ML on-board satellites. Sci. Rep. 12 (1), 16939. doi:10.1038/s41598-022-19437-5
Safi, M. W. A., Imran, A., Arshad, M., Akhtar, M., Ramzan, M., Asif, M., et al. (2024). Landuse/Landcover change analysis using medium resolution images and machine learning algorithms in the cotton landscape of multan and bahawalpur districts, Pakistan. Environ. Eng. Sci. 41 (2), 70–78. doi:10.1089/ees.2023.0159
Samo, A. A., Sayed, R. B., Valecha, J., Baig, N. M., and Laghari, Z. A. (2022). Demographic factors associated with acceptance, hesitancy, and refusal of COVID-19 vaccine among residents of Sukkur during lockdown: a cross sectional study from Pakistan. Hum. Vaccines Immunother. 18 (1), 2026137. doi:10.1080/21645515.2022.2026137
Sawant, S., Garg, R. D., Meshram, V., and Mistry, S. (2023). Sen-2 LULC: land use land cover dataset for deep learning approaches. Data Brief 51, 109724. doi:10.1016/j.dib.2023.109724
Sellami, E. M., and Rhinane, H. (2023). A new approach for mapping land use/land cover using google earth engine: a comparison of composition images. Int. Archives Photogrammetry, Remote Sens. Spatial Inf. Sci. 48, 343–349. doi:10.5194/isprs-archives-xlviii-4-w6-2022-343-2023
Sertel, E., Ekim, B., Ettehadi Osgouei, P., and Kabadayi, M. E. (2022). Land use and land cover mapping using deep learning based segmentation approaches and vhr worldview-3 images. Remote Sens. 14 (18), 4558. doi:10.3390/rs14184558
Shetty, A. R., Ahmed, F. B., and Naik, V. M. (2019). CKD prediction using data mining technique as SVM and KNN with pycharm. Int. Res. J. Eng. Technol. 6 (05), 4399–4405.
Stateczny, A., Bolugallu, S. M., Divakarachari, P. B., Ganesan, K., and Muthu, J. R. (2022). Multiplicative Long short-term memory with improved mayfly optimization for LULC classification. Remote Sens. 14 (19), 4837. doi:10.3390/rs14194837
Swetanisha, S., Panda, A. R., and Behera, D. K. (2022). Land use/land cover classification using machine learning models. Int. J. Electr. Comput. Eng. 12 (2), 2040. (2088-8708). doi:10.11591/ijece.v12i2.pp2040-2046
Talukdar, S., Singha, P., Mahato, S., Pal, S., Liou, Y.-A., Rahman, A., et al. (2020). Land-use land-cover classification by machine learning classifiers for satellite observations—a review. Remote Sens. 12 (7), 1135. doi:10.3390/rs12071135
Vankdothu, R., Hameed, M. A., and Fatima, H. (2022). A brain tumor identification and classification using deep learning based on CNN-LSTM method. Comput. Electr. Eng. 101, 107960. doi:10.1016/j.compeleceng.2022.107960
Wang, J., Bretz, M., Dewan, M. A. A., and Delavar, M. A. (2022). Machine learning in modelling land-use and land cover-change (LULCC): current status, challenges and prospects. Sci. Total Environ. 822, 153559. doi:10.1016/j.scitotenv.2022.153559
Xu, H. (2006). Modification of normalised difference water index (NDWI) to enhance open water features in remotely sensed imagery. Int. J. remote Sens. 27 (14), 3025–3033. doi:10.1080/01431160600589179
Yang, L., Driscol, J., Sarigai, S., Wu, Q., Chen, H., and Lippitt, C. D. (2022). Google Earth Engine and artificial intelligence (AI): a comprehensive review. Remote Sens. 14 (14), 3253. doi:10.3390/rs14143253
Yang, Y., Yang, D., Wang, X., Zhang, Z., and Nawaz, Z. (2021). Testing accuracy of land cover classification algorithms in the qilian mountains based on gee cloud platform. Remote Sens. 13 (24), 5064. doi:10.3390/rs13245064
Yari Hesar, A., Feyzolahpour, M., and Kanani, N. (2024). Evaluating the role of land cover and land use change (LULC) on land surface temperature (LST) and analyzing the relationship between LST and NDVI, NDBI and NDLI indices (study area: abbar city and Kohkan village). Geogr. Hum. Relat.
Zafar, Z., Zubair, M., Zha, Y., Fahd, S., and Nadeem, A. A. (2024). Performance assessment of machine learning algorithms for mapping of land use/land cover using remote sensing data. Egypt. J. Remote Sens. Space Sci. 27 (2), 216–226. doi:10.1016/j.ejrs.2024.03.003
Zhao, S., Tu, K., Ye, S., Tang, H., Hu, Y., and Xie, C. (2023). Land use and land cover classification meets deep learning: a review. Sensors 23 (21), 8966. doi:10.3390/s23218966
Zhao, Z., Islam, F., Waseem, L. A., Tariq, A., Nawaz, M., Islam, I. U., et al. (2024). Comparison of three machine learning algorithms using google earth engine for land use land cover classification. Rangel. Ecol. Manag. 92, 129–137. doi:10.1016/j.rama.2023.10.007
Zurqani, H. A., Al-Bukhari, A., Aldaikh, A. O., Elfadli, K. I., and Bataw, A. A. (2022). “Geospatial mapping and analysis of the 2019 flood disaster extent and impact in the city of ghat in southwestern Libya using google earth engine and deep learning technique,” in Environmental applications of remote sensing and GIS in Libya (Springer), 205–226.
Keywords: land classifications, remote sensing, Python, machine learning, deep learning, Sukkur Pakistan
Citation: Nigar A, Li Y, Jat Baloch MY, Alrefaei AF and Almutairi MH (2024) Comparison of machine and deep learning algorithms using Google Earth Engine and Python for land classifications. Front. Environ. Sci. 12:1378443. doi: 10.3389/fenvs.2024.1378443
Received: 29 January 2024; Accepted: 29 April 2024;
Published: 28 May 2024.
Edited by:
Bahareh Kalantar, RIKEN, JapanReviewed by:
Zerouali Bilel, University of Chlef, AlgeriaPaul Sestras, Technical University of Cluj-Napoca, Romania
Copyright © 2024 Nigar, Li, Jat Baloch, Alrefaei and Almutairi. This is an open-access article distributed under the terms of the Creative Commons Attribution License (CC BY). The use, distribution or reproduction in other forums is permitted, provided the original author(s) and the copyright owner(s) are credited and that the original publication in this journal is cited, in accordance with accepted academic practice. No use, distribution or reproduction is permitted which does not comply with these terms.
*Correspondence: Yang Li, lyang@cust.edu.cn