 Zheng Cao
 Ye Cao
 Zhifeng Wu1*
94% of researchers rate our articles as excellent or good
Learn more about the work of our research integrity team to safeguard the quality of each article we publish.
Find out more
ORIGINAL RESEARCH article
Front. Environ. Sci. , 26 September 2023
Sec. Big Data, AI, and the Environment
Volume 11 - 2023 | https://doi.org/10.3389/fenvs.2023.1228717
Introduction: Mental disorders are considered to be the most significant threat to public health. Mitigation effects of urban green spaces have been widely documented. However, the conclusions are inconsistent because of the representativeness of the original data.
Method: We measured the mental perception of urban green spaces using geospatial big data instead of field observation or questionnaire data. Street view data were applied to calculate urban green space characteristics in three dimensions.
Results: The positive mental perception percentage around the chosen urban parks increased as the buffer diameter decreased. The temporal variations of positive mental perceptions around the selected urban parks exhibited an obvious peak-trough shape. The spatial associations between the positive mental perception percentage and urban green space characteristics varied geographically. The spatial associations became less similar as the spatial buffer diameter decreased. At the same spatial scale level, the green view played a dominant role in the spatial distribution of positive mental perceptions.
Discussion: Shrinking the deviations of urban green space characteristics and increasing the mean and maximum values of urban green space characteristics will favor the improvement of public mental health. This study provides a reference for explaining ecological scientific questions using spatiotemporal big data. It also provides insights into the mechanisms underlying the relationship between ecological processes and public health.
1. People’s perceptions of urban green spaces were extracted from social media data
2. Spatial balance of urban green space in three dimensions was examined
3. The heterogeneous associations between urban green spaces in three dimensions and population-positive perceptions were measured.
Mental health is the foundation of the wellbeing and effective functioning of individuals. It is a state of balance both within oneself and with the environment. According to statistics from the World Health Organization, more than 100 million people suffer from mental health disorders in the Western Pacific Region (Smith, 2014; Baingana et al., 2015). In China, this number reached 200 million in 2017. Among this patient group, one in six people were aged 10–19 years (McClure, 1988; Jing and Zuo, 2000; Lee, 2009). Moreover, 5.73% of the global disease burden is accounted for by mental health issues, which may result in schizophrenia or even suicide. Therefore, an effective assessment of population satisfaction to directly reflect mental health is the foundation to avoid adverse effects on public health.
Urban green spaces are defined as areas that are partially or completely covered by grass, trees, shrubs, or other vegetation. In previous studies, urban green spaces have been considered an important factor in preventing the adverse effects of mental disorders on individuals (Markevych et al., 2017; Dzhambov A. et al., 2018; Dzhambov A. M. et al., 2018). The advantages of urban green spaces for public health are mainly demonstrated by the accessibility for physical exercise and the happiness boost resulting from green views (Dadvand et al., 2012; Richardson et al., 2013; Liu et al., 2019). However, previous studies have mainly focused on the associations between urban green space characteristics and physical health, rather than the associations between urban green space and mental health. Furthermore, inconsistent conclusions were found in related studies. For example, Richardson et al. (2010) found no evidence clarifying the positive influence of urban green spaces on population happiness. However, other studies have suggested that urban green spaces have a strong positive influence on population happiness (Gilchrist et al., 2015; Douglas et al., 2017). Two determinants may explain these inconsistent conclusions. The first is the observation angle of an urban green space. In previous studies, normalized difference vegetation index (NDVI) was chosen to represent the characteristics of urban green spaces. NDVI reflects the greenness of the canopy (Gascon et al., 2016); however, people see a vertical view of greenness. Thus, NDVI is not capable of reflecting a comprehensive view of greenness, which results in uncertainty. The second limitation is the representativeness of the chosen samples. In previous studies, questionnaires were a major way to collect emotional perceptions of green space facilities (Fla and Li, 2015). This method requires a large labor force to obtain only a small number of samples; therefore, data volume is limited. In addition, the questionnaires are usually administered at specific time periods, such as in the morning or during weekends; during these selected time periods, population heterogeneity is usually low (Zhang et al., 2022). For example, elderly people are the major users of green spaces in the morning. This lack of significant population heterogeneity questions the representativeness of the results. Therefore, to comprehensively understand the associations between public health and green spaces, a new index that can fully describe the characteristics of greenness and green space visitor heterogeneity is urgently needed.
Geospatial big data (GBD) refers to the spatial location and time records generated by position-detection equipment during human activities (Li et al., 2016; Basiri et al., 2019). GBD is widely used in human activity-related analysis, such as population mobility pattern detection and precise land use extraction (Xing and Sieber, 2016; Yao et al., 2017; Liu et al., 2018; Jiang and Ren, 2019). Weibo data, which are collected by the Weibo platform, are recognized as a commonly used GDB. Unlike Tencent user datasets or cellular phone signaling data, Weibo data provide text content and location information, which can show expressed happiness (Siqi et al., 2019; Yc et al., 2021). With the development of semantic analysis approaches, population emotional perception for specific things can be readily extracted from the text content on social media. Therefore, it is possible to obtain more representative and comprehensive emotional perceptions of urban greenspace utility by introducing Weibo data.
Thus, we examined three research questions. First, does the population’s emotional perceptions of urban green spaces have spatial-scale effects? Second, are these spatial-scale effects associated with urban green space characteristics? Third, which is the dominant factor affecting people’s perception, NDVI, or vertical view of greenness? We computed NDVI and vertical view greenness from moderate-resolution imaging spectroradiometer (MODIS) data and the Baidu street-view map, respectively. Emotional perceptions were then extracted from Weibo data using specific rules, and their spatial-scale effects were analyzed based on different buffer areas. Finally, the spatial associations between emotional perceptions and urban green space characteristics were examined at different spatial scales. This study provides a new perspective to comprehensively understand the effects of green spaces on public health.
Tianhe District, the political and economic center of Guangzhou, China, is located between 113.25° and 113.43°E and 23.1°-23.23°N. As of 2020, the residential population in Tianhe District was 2.25 million, with more than 50 urban gardens (Figure 1). Since the execution of the admission-free strategy, the number of urban garden visitors has exceeded 700 million. As urbanization and private wealth increase, people are paying more attention to their wellbeing. Urban green spaces have become an important component of public health. As Guangzhou is a first-tier city, the prevalence of smart phones provides an opportunity to collect GBD from the public and favors the quantification of the spatiotemporal associations between urban green space characteristics and population mental perceptions.
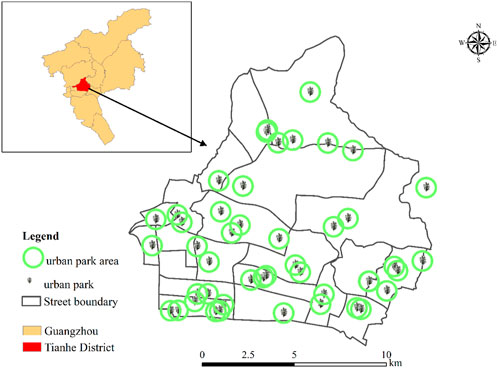
FIGURE 1. Locations of the selected urban gardens.
Weibo data were used to extract the population’s emotional perceptions. More than five million data points were collected from all active Weibo users in Guangzhou between 1 January 2020, and 31 December 2020. The user ID, text content, location longitude, location latitude, and time information were included in these data. User ID is the label for each user. The text content was what the users thought or perceived. Location, longitude, and latitude recorded the location information when the user posted Weibo text content online. Time information reported the time when users posted text content online.
The definition of mental health in this study refers to the emotional perception, which is extracted based on the text content of Weibo data.
In this study, the urban green view was examined in two dimensions, using NDVI and urban green space views. The annual average NDVI value was obtained from MODIS 16 days NDVI data (MOD13Q1). All NDVI data were added and the mean value was computed.
Street-view greenery was measured using street-view imagery and deep-learning segmentation. First, 1,266 sampling points were set randomly at intervals of 100 m to obtain 5,064 images from four directions for a 360 °view image. Street-view imagery was obtained using BaiduMap API (http://lbsyun.baidu.com/) in 2022. Second, a fully convolutional neural network and the ADE20 K training dataset were applied to the segmentation of street views with an accuracy of 79.7% in identifying 150 types of objects in cities, such as greenery (Wang et al., 2019; Rwa et al., 2020). Previous studies have demonstrated that street-view greenery can better reflect human perceptions of urban green spaces. Street-view greenery can be measured as follows:
where
The Bidirectional Encoder Representations from Transformers model (BERT) was used to extract population emotional perception results associated with urban green space utility from Weibo data, which is defined as population emotional perceptions. It is a language encoder that can translate text content into corresponding semantic features, as released by Google in 2018. In this study, Weibo items used were processed as follows (Figure 2): 1) Weibo items were selected based on the following rules: users’ locations were within the chosen urban green spaces and users had a record of return visits to the chosen urban green spaces. 2) The text contents categorized by the above rules were further filtered using keywords related to positive emotional expressions. For example, This garden makes me feel free or A picnic on weekends is a good choice for relaxation. 3) Among the chosen text content, 10,000 items were selected randomly to conduct the BERT training procedure. 4) Based on the training results, all selected Weibo text content was analyzed using BERT. By adjusting the learning rate and number of iterations, the overall accuracy of the classifier using BERT was over 89% (Devlin et al., 2018).
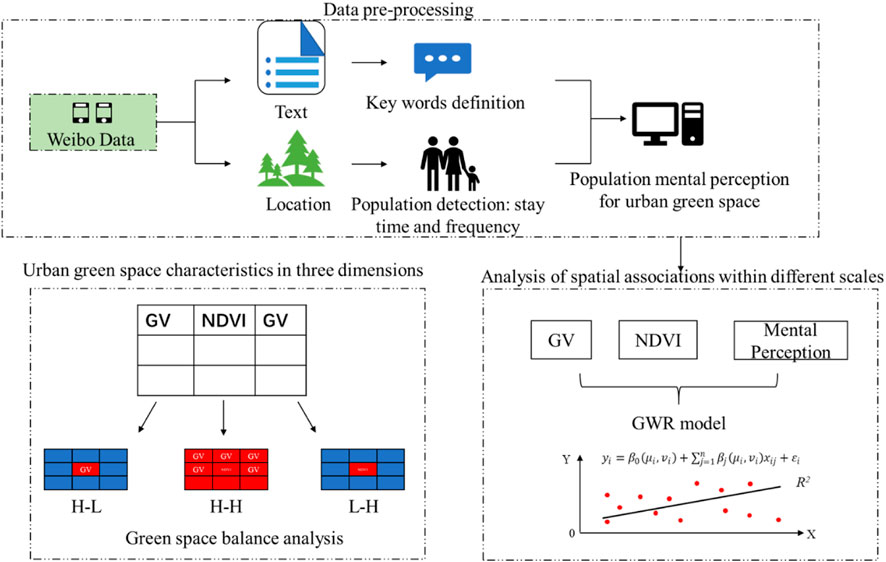
FIGURE 2. Procedures of population emotional perception extractions.
We developed a new index to evaluate the greenness view in urban green spaces, called the spatial balance of the green view in three dimensions. This was assessed from two dimensions: NDVI and vertical green views (Figure 3). The NDVI value and front green view at each grid were compared with the mean value of NDVI and front green view in the study areas. Consequently, four categories of spatial balance of the green view in the three dimensions were obtained: high values of both front green view and NDVI (H-H), high value of front green view and low value of NDVI (H-L), low value of front green view and high value of NDVI (L-H), and low values of both front green view and NDVI (L-L).
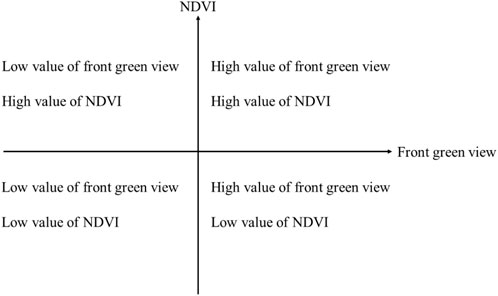
FIGURE 3. Evaluation of spatial balance of green view in three dimensions.
A GWR model was applied to examine the spatial associations between population emotional perceptions and urban green space characteristics in the three dimensions. Unlike the least-squares method, the location information is regarded as an independent variable participating in the calculations. The equation used is as follows:
where
The percentage of population with positive emotional perceptions of urban green space varied spatiotemporally (Figure 4). The monthly percentage of positive emotional perception for urban green spaces ranged between 60.84% and 71.68%. The monthly mean value of the percentage of population with positive emotional perception for urban green spaces had obvious peak-trough shapes. Troughs were observed in February, May, August, and November, while peaks were observed in January, March, July, October, and December. The temporal trend of the monthly percentage of positive emotional perception for urban green space increased, with a slope of 0.003. A decreasing trend in the monthly percentage of positive emotional perception for urban green space was observed as the spatial buffer diameter decreased. The lowest value of the monthly percentage of positive emotional perception for urban green space was found in the 400-m spatial buffer; the slope of the decrease was 0.006.
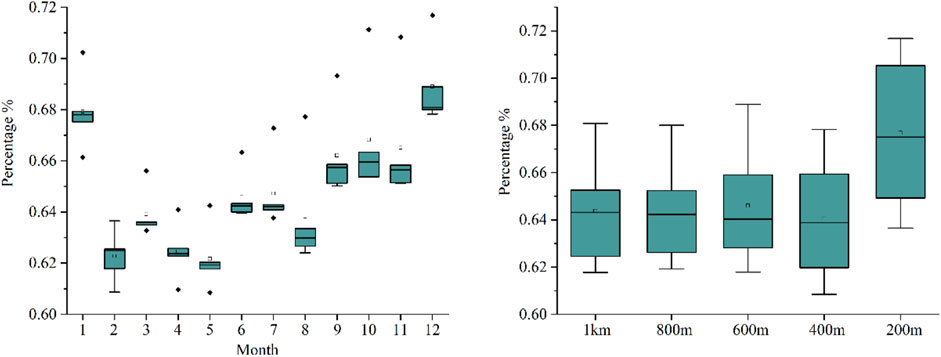
FIGURE 4. Spatiotemporal variation of urban emotion perceptions around urban green space within different radiuses.
The four types of spatial balance of the urban green view in the three dimensions varied dramatically (Figure 5). Among the four types, the percentage of L-H accounted for the majority, with a minimum percentage of 38.46% in the 200-m spatial buffer and the largest percentage of 50.70% in the 800-m spatial buffer. H-H ranked second, followed by L-L and H-L. The four types of spatial balance of the urban green view in the three dimensions showed different change trends in different spatial buffers. H-H and H-L increased from the 200-m spatial buffer to the 600-m spatial buffer and then deceased. In contrast, L-L decreased from the 200-m spatial buffer to the 400-m spatial buffer and then increased. L-H showed an increasing trend in all spatial buffers.
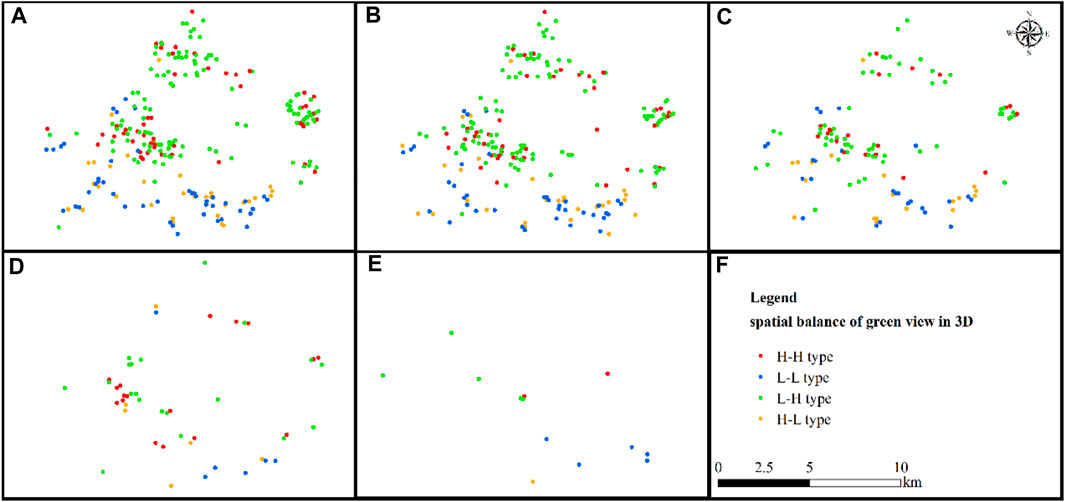
FIGURE 5. Spatial balance of urban green view in the three dimensions around urban pocket green space within different buffer diameters. (A–F) indicated the spatial balance within different buffers (200 m, 400 m, 600 m, 800 m, and 1 km).
Table 1 shows the spatial associations between population emotional perceptions and the urban greenspace characteristics in the three dimensions. As R2 implies, spatial associations between population emotional perceptions and urban green space characteristics of the three dimensions decrease as the diameter of the spatial buffer decreases. The most significant decreasing slope was found between population emotional perceptions and the standard deviation of the front green view, maximum value of the front green view, and maximum value NDVI as the diameter of the spatial buffer decreased. The average value of the front green view, maximum value of the front green view, average value of NDVI, and maximum value of NDVI positively explained the spatial distribution of population emotional perceptions within different spatial buffers. The other factors were found to have negative explanatory power for the spatial distribution of population emotional perceptions within different spatial buffers. According to the coefficient, the explanatory power of the front green view decreased as the diameter of the spatial buffer decreased. However, the explanatory power of NDVI increased and then decreased as the diameter of the spatial buffer decreased. The most significant explanatory power of NDVI was found within 800–1000-m spatial buffers.
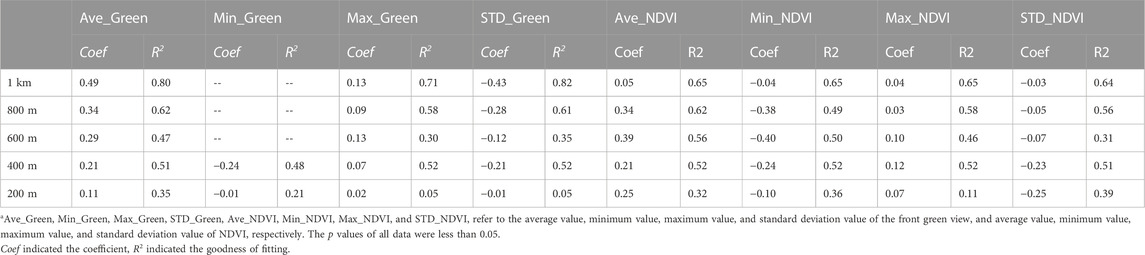
TABLE 1. Spatial associations between population emotional perceptions and urban green space characteristics in the three dimensions.
In this study, we expanded on previous studies on the associations between population mental health and urban green spaces in the following aspects. First, the present study introduces social media data to reflect the perception of urban green spaces instead of questionnaire survey data to improve data representativeness. Second, it provides management implications for improving the efficiency of urban greenspace design by measuring its links with people’s perception within different spatial scales in three dimensions to improve mental health.
In previous studies, field investigations such as site observations and questionnaires from urban park users have been used to collect information on mental perception in limited study areas (Dzhambov and Dimitrova, 2014; Bahriny and Bell, 2021). This method is time and labor-intensive. Data collected in traditional surveys are limited, and representativeness is questioned for its lack of characteristic population diversity. In our study, we used social media data to obtain mental perceptions of urban green spaces. Consistent with previous studies, this type of data has confirmed its validity in related research (Chen et al., 2020; Huang et al., 2022). In densely populated cities such as Beijing, Shenzhen, and Wuhan, social media data showed spatial heterogeneity in urban green space check-ins (Fla and Li, 2015; Zhang et al., 2015). Specifically, social media enables urban green space visitors to share their feelings and experiences regarding travel attitudes through photographs, words, and emotions in online blogs. Moreover, online blogs provide location-based services that combine travel attitudes and location information. Many studies have reported highly positive associations between social media data and official visitor statistics. Thus, crowdsourced geospatial data can be reliably leveraged to estimate population perception of urban green spaces. However, it should be noted that social media data are sample-bias data. Most social media data, including Weibo data, are collected from smartphones. Aged people or children less than 5 years old are equipped with non-smartphones. Thus, social media data are less representative of these population groups. Analysis results based on these data might reflect the mental health perception of the population aged 20–60 (Marx, 2013; Chen et al., 2016).
Consistent with previous studies, we concluded that urban green spaces are closely associated with positive population perceptions. This association varied spatiotemporally (Lachowycz et al., 2012; Lachowycz and Jones, 2013; Cohen-Cline et al., 2015). At the same buffer diameter level, the spatial association between the green view and population perception was more significant than that between NDVI and population perception. This association decreased as buffer diameter decreased. As demonstrated in previous studies, urban green space improves population mental condition in two ways: providing physical exercise places and reducing mental stress through scenic views. Epidemiological evidence from western countries and Beijing indicates that people visiting urban green spaces tend to undertake low-intensity activities, such as walking or jogging. Previous studies have also stated that extreme temperature events and air pollution trigger the onset of anxiety, a type of mental disorder. Negative mental perceptions are related to 5-hydroxytryptamine deficiency (Sung et al., 2011; Cai et al., 2016). This neurotransmitter is also involved in thermoregulation, which could result in an increased physiological vulnerability to extreme temperatures in patients with anxiety (Hasegawa et al., 2005). The temperature regulation effects of urban green spaces efficiently reduce the occurrence of this phenomenon. Moreover, urban green spaces provide accessibility for social contact. This contact provides a way to vent negative feelings. In this study, NDVI was used instead of EVI. Two reasons may be accountable: 1) green view based on the street view data can reflect the vertical view of plants. 2) NDVI is more comprehensive and popular used in previous studies.
Our results are inconsistent with those of previous studies. There were no significant associations between the minimum value of green views and mental perceptions of urban green spaces. This may be due to the methods used to obtain the urban greenspace view data. In this study, street-view pictures were used to extract the urban greenspace view. The core of urban green-view extraction is the segmentation of the street view. However, the coverage of the street-view images is uneven. This results in underestimation of urban green space. Thus, the observed close associations may be reduced in the lower green-view areas.
Despite the above-mentioned strengths, this study had some limitations. First, we focused on the urban green spaces located in the downtown areas of Guangzhou for insufficient street green images in rural areas. Second, urban green-view data were extracted from street-view images in September 2021, while the mental perception data were measured using Weibo data throughout 2020, leading to a temporal mismatch between the two datasets.
The findings of this research indicate that close associations exist between urban green space characteristics in the three dimensions and positive population mental perceptions. Spatial-scale effects were also observed for this association. The explanatory power of the urban greenspace characteristics decreased as the spatial scale decreased.
The original contributions presented in the study are included in the article/Supplementary material, further inquiries can be directed to the corresponding author.
Ethical review and approval was not required for the study on human participants in accordance with the local legislation and institutional requirements. Written informed consent from the participants was not required to participate in this study in accordance with the national legislation and the institutional requirements.
ZC is responsible for Conceptualization and writing. YC performed the data analysis. ZW conducted the data pre-procession. All authors contributed to the article and approved the submitted version.
This study was supported by the National Natural Science Foundation of China (No. 41901219), Natural Science Foundation of Guangdong Province (2023A1515011341), and Guangzhou Basic Research and Application Project (SL 2022A04J01107).
The authors thank the editor and reviewers for their helpful comments and suggestions.
Author YC was employed by China National Heavy Duty Truck Group Co., Ltd.
The remaining authors declare that the research was conducted in the absence of any commercial or financial relationships that could be construed as a potential conflict of interest.
All claims expressed in this article are solely those of the authors and do not necessarily represent those of their affiliated organizations, or those of the publisher, the editors and the reviewers. Any product that may be evaluated in this article, or claim that may be made by its manufacturer, is not guaranteed or endorsed by the publisher.
Bahriny, F., and Bell, S. (2021). Traditional versus modern? Perceptions and preferences of urban park users in Iran. Sustainability 13 (4), 2036. doi:10.3390/su13042036
Baingana, F., al'Absi, M., Becker, A. E., and Pringle, B. (2015). Global research challenges and opportunities for mental health and substance-use disorders. Nature 527 (7578), S172–S177. doi:10.1038/nature16032
Basiri, A., Haklay, M., Foody, G., and Mooney, P. (2019). Crowdsourced geospatial data quality: Challenges and future directions. Int. J. Geogr. Inf. Sci. 33 (8), 1588–1593. doi:10.1080/13658816.2019.1593422
Cai, J., Meng, X., Wang, C., Chen, R., Zhou, J., Xu, X., et al. (2016). The cold effects on circulatory inflammation, thrombosis and vasoconstriction in type 2 diabetic patients. Sci. Total Environ. 568, 271–277. doi:10.1016/j.scitotenv.2016.06.030
Chen, B. Y., Yuan, H., Li, Q., Shaw, S.-L., Lam, W. H. K., and Chen, X. (2016). Spatiotemporal data model for network time geographic analysis in the era of big data. Int. J. Geogr. Inf. Sci. 30 (6), 1041–1071. doi:10.1080/13658816.2015.1104317
Chen, Y., Yue, W., and La Rosa, D. (2020). Which communities have better accessibility to green space? An investigation into environmental inequality using big data. Landsc. Urban Plan. 204, 103919. doi:10.1016/j.landurbplan.2020.103919
Cohen-Cline, H., Turkheimer, E., and Duncan, G. E. (2015). Access to green space, physical activity and mental health: A twin study. J. Epidemiol. Community Health 69 (6), 523–529. doi:10.1136/jech-2014-204667
Dadvand, P., de Nazelle, A., Figueras, F., Basagaña, X., Su, J., Amoly, E., et al. (2012). Green space, health inequality and pregnancy. Environ. Int. 40, 110–115. doi:10.1016/j.envint.2011.07.004
Devlin, J., Chang, M. W., Lee, K., and Toutanova, K. (2018). Bert: Pre-Training of deep bidirectional Transformers for language understanding. (Amsterdam, Netherlands: Elsevier).
Douglas, O., Lennon, M., and Scott, M. (2017). Green space benefits for health and well-being: A life-course approach for urban planning, design and management. Cities 66, 53–62. doi:10.1016/j.cities.2017.03.011
Dzhambov, A., Hartig, T., Markevych, I., Tilov, B., and Dimitrova, D. (2018a). Urban residential greenspace and mental health in youth: Different approaches to testing multiple pathways yield different conclusions. Environ. Res. 160, 47–59. doi:10.1016/j.envres.2017.09.015
Dzhambov, A. M., and Dimitrova, D. D. (2014). Elderly visitors of an urban park, health anxiety and individual awareness of nature experiences. Urban For. Urban Green. 13 (4), 806–813. doi:10.1016/j.ufug.2014.05.006
Dzhambov, A. M., Markevych, I., Tilov, B. G., and Dimitrova, D. D. (2018b). Residential greenspace might modify the effect of road traffic noise exposure on general mental health in students. Urban For. Urban Green. 34, 233–239. doi:10.1016/j.ufug.2018.06.022
Fla, B., and Li, Z. (2015). Using multi-source big data to understand the factors affecting urban park use in Wuhan. Urban For. Urban Green. 43. doi:10.1016/j.ufug.2019.126367
Gascon, M., Cirach, M., Martínez, D., Dadvand, P., Valentín, A., Plasència, A., et al. (2016). Normalized difference vegetation index (NDVI) as a marker of surrounding greenness in epidemiological studies: The case of Barcelona city. Urban For. Urban Green. 19, 88–94. doi:10.1016/j.ufug.2016.07.001
Gilchrist, K., Brown, C., and Montarzino, A. (2015). Workplace settings and wellbeing: Greenspace use and views contribute to employee wellbeing at peri-urban business sites. Landsc. Urban Plan. 138, 32–40. doi:10.1016/j.landurbplan.2015.02.004
Hasegawa, H., Ishiwata, T., Saito, T., Yazawa, T., Aihara, Y., and Meeusen, R. (2005). Inhibition of the preoptic area and anterior hypothalamus by tetrodotoxin alters thermoregulatory functions in exercising rats. J. Appl. Physiology 98 (4), 1458–1462. doi:10.1152/japplphysiol.00916.2004
Huang, J.-H., Floyd, M. F., Tateosian, L. G., and Aaron Hipp, J. (2022). Exploring public values through Twitter data associated with urban parks pre- and post- COVID-19. Landsc. Urban Plan. 227, 104517. doi:10.1016/j.landurbplan.2022.104517
Jiang, B., and Ren, Z. (2019). Geographic space as a living structure for predicting human activities using big data. Int. J. Geogr. Inf. Sci. 33 (4), 764–779. doi:10.1080/13658816.2018.1427754
Jing, Q., and Zuo, Q. (2000). “1 mental health problems of Chinese school children,” in International perspectives on child and adolescent mental health. Editors N. N. Singh, J. P. Leung, and A. N. Singh (Amsterdam, Netherlands: Elsevier), 1–20.
Lachowycz, K., Jones, A. P., Page, A. S., Wheeler, B. W., and Cooper, A. R. (2012). What can global positioning systems tell us about the contribution of different types of urban greenspace to children's physical activity? Health & Place 18 (3), 586–594. doi:10.1016/j.healthplace.2012.01.006
Lachowycz, K., and Jones, A. P. (2013). Towards a better understanding of the relationship between greenspace and health: Development of a theoretical framework. Landsc. Urban Plan. 118, 62–69. doi:10.1016/j.landurbplan.2012.10.012
Lee, S. (2009). Mental illness in China. Lancet 374 (9695), 1063–1064. doi:10.1016/s0140-6736(09)61699-8
Li, S., Dragicevic, S., Castro, F. A., Sester, M., Winter, S., Coltekin, A., et al. (2016). Geospatial big data handling theory and methods: A review and research challenges. ISPRS J. Photogrammetry Remote Sens. 115, 119–133. doi:10.1016/j.isprsjprs.2015.10.012
Liu, X., Niu, N., Liu, X., Jin, H., Ou, J., Jiao, L., et al. (2018). Characterizing mixed-use buildings based on multi-source big data. Int. J. Geogr. Inf. Sci. 32 (4), 738–756. doi:10.1080/13658816.2017.1410549
Liu, Y., Wang, R., Grekousis, G., Liu, Y., and Li, Z. (2019). Neighbourhood greenness and mental wellbeing in Guangzhou, China: What are the pathways? Landsc. Urban Plan. 190, 103602. doi:10.1016/j.landurbplan.2019.103602
Markevych, I., Schoierer, J., Hartig, T., Chudnovsky, A., Hystad, P., Dzhambov, A. M., et al. (2017). Exploring pathways linking greenspace to health: Theoretical and methodological guidance. Environ. Res. 158, 301–317. doi:10.1016/j.envres.2017.06.028
McClure, G. M. G. (1988). Adolescent mental health in China. J. Adolesc. 11 (1), 1–10. doi:10.1016/s0140-1971(88)80018-6
Richardson, E. A., Pearce, J., Mitchell, R., and Kingham, S. (2013). Role of physical activity in the relationship between urban green space and health. Public Health 127 (4), 318–324. doi:10.1016/j.puhe.2013.01.004
Rwa, B., Yi, L., Xw, C., Ye, L., and Yao, Y. A. (2020). Relationship between eye-level greenness and cycling frequency around metro stations in shenzhen, China: A big data approach. Sustain. Cities Soc. 59, 102201. doi:10.1016/j.scs.2020.102201
Siqi, Z., Jianghao, W., Cong, S., Xiaonan, Z., and Matthew, K. (2019). Air pollution lowers Chinese urbanites' expressed happiness on social media. Nat. Hum. Behav. 3, 237–243. doi:10.1038/s41562-018-0521-2
Smith, K. (2014). Mental health: A world of depression. Nature 515 (7526), 180–181. doi:10.1038/515180a
Sung, T.-I., Chen, M.-J., Lin, C.-Y., Lung, S.-C., and Su, H.-J. (2011). Relationship between mean daily ambient temperature range and hospital admissions for schizophrenia: Results from a national cohort of psychiatric inpatients. Sci. Total Environ. 410-411, 41–46. doi:10.1016/j.scitotenv.2011.09.028
Wang, R., Yang, B., Yao, Y., Bloom, M. S., Dong, G., Yuan, Y., et al. (2019). Residential greenness, air pollution and psychological well-being among urban residents in Guangzhou, China. Sci. Total Environ. 711, 134843. doi:10.1016/j.scitotenv.2019.134843
Xing, J., and Sieber, R. E. (2016). A land use/land cover change geospatial cyberinfrastructure to integrate big data and temporal topology. Int. J. Geogr. Inf. Sci. 30 (3), 573–593. doi:10.1080/13658816.2015.1104534
Yao, Y., Liu, X., Li, X., Zhang, J., Liang, Z., Mai, K., et al. (2017). Mapping fine-scale population distributions at the building level by integrating multisource geospatial big data. Int. J. Geogr. Inf. Sci. 31 (6), 1–25. doi:10.1080/13658816.2017.1290252
Yc, A., Jz, A., Wei, W. B., and Bing, Z. A. (2021). Effects of urban parks on residents' expressed happiness before and during the COVID-19 pandemic. Landsc. Urban Plan. 212, 104118. doi:10.1016/j.landurbplan.2021.104118
Zhang, J., Cheng, Y., Mao, Y., Cai, W., and Zhao, B. (2022). What are the factors influencing recreational visits to national forest parks in China? Experiments using crowdsourced geospatial data. Urban For. Urban Green. 72, 127570. doi:10.1016/j.ufug.2022.127570
Keywords: urban pocket green space, emotional expression, social media big data, urban sensing, street veiw data
Citation: Cao Z, Cao Y and Wu Z (2023) Associations between greenspace characteristics and population emotion perceptions in three dimensions. Front. Environ. Sci. 11:1228717. doi: 10.3389/fenvs.2023.1228717
Received: 25 May 2023; Accepted: 01 September 2023;
Published: 26 September 2023.
Edited by:
Gareth Neighbour, The Open University, United KingdomReviewed by:
Kyle D. Buck, United States Environmental Protection Agency (EPA), United StatesCopyright © 2023 Cao, Cao and Wu. This is an open-access article distributed under the terms of the Creative Commons Attribution License (CC BY). The use, distribution or reproduction in other forums is permitted, provided the original author(s) and the copyright owner(s) are credited and that the original publication in this journal is cited, in accordance with accepted academic practice. No use, distribution or reproduction is permitted which does not comply with these terms.
*Correspondence: Ye Cao, ODQ1NDM5NTQzQHFxLmNvbQ==; Zhifeng Wu, Z3p1d3pmQDE2My5jb20=
Disclaimer: All claims expressed in this article are solely those of the authors and do not necessarily represent those of their affiliated organizations, or those of the publisher, the editors and the reviewers. Any product that may be evaluated in this article or claim that may be made by its manufacturer is not guaranteed or endorsed by the publisher.
Research integrity at Frontiers
Learn more about the work of our research integrity team to safeguard the quality of each article we publish.