 Hugo Gonçalves Silva
- 1Departamento de Física, Escola de Ciência e Tecnologia (ECT), Universidade de Évora, Évora, Portugal
- 2Laboratório Associado de Energia, Transporte e Aeronáutica (LAETA), Universidade de Évora, Évora, Portugal
- 3INEGI Alentejo, Universidade de Évora, Évora, Portugal
- 4LPTPME Laboratory, Department of Physics, Materials Science, New Energies and Applications Research Group, Faculty of Sciences, Mohammed 1st, University, Oujda, Morocco
- 5Instituto Português do Mar e da Atmosfera (IPMA), Rua C do Aeroporto, Lisboa, Portugal
Hydrogen is expected to become a dominant energy vector in a scenario where renewable energies will prevail over other conventional sources. This suggests that beyond its conventional industrial applications, such as in the chemical industry, hydrogen is poised to find numerous additional uses, including serving as a fuel for internal combustion engines. Consequently, global demand is expected to surge significantly, necessitating the implementation of large-scale hydrogen production units from renewable sources. This is particularly pronounced in Europe, where recent energy directives have set ambitious targets in this regard. Consequently, it becomes imperative to evaluate potential locations suitable for hosting these hydrogen production facilities. In this study, particular attention is directed towards photovoltaic-fed water electrolysis as a method for hydrogen production. This choice is informed by the maturity and affordability of these technologies, coupled with the abundant solar energy resource available in Southern Europe. To this end, it is utilized 23 years of hourly meteorological data obtained from the Portuguese Meteorological Service. This dataset enables the development of typical meteorological year files for nearly 90 stations across mainland Portugal. These files were inputted into a model simulating a 120 MWp photovoltaic plant, utilizing the System Advisor Model. The electricity generated by this plant was subsequently used to simulate the hydrogen production using an in-house developed model for the electrolyser. Finally, the simulation results were used to develop the first atlas for Solar Hydrogen production capacity and cost in Portugal. The techno-economic results indicate that annual specific hydrogen production can achieve values above 30 kg/kWp, with the levelized cost of hydrogen below 4.0 €/kg, especially, in the southern regions (Alentejo and Algarve) and the central-east area (Beira Interior). This makes these regions highly attractive for hosting large-scale photovoltaic hydrogen production plants and very competitive in the hydrogen market, especially with neighbouring countries like Morocco and Spain.
Highlights
• This work uses 23 years of 1-h meteorological data from the Portuguese Meteorological Service to develop typical meteorological years for 89 stations in mainland Portugal.
• A separation model was calibrated for a reference station in the South of Portugal and used to determine diffuse horizontal irradiance and direct normal irradiance.
• A model of a 120 MWp photovoltaic power plant was used, System Advisor Model, to yield electricity production.
• The photovoltaic power production values were fed into a model of an electrolyser plant to determine the annual hydrogen production.
• The techno-economic analysis reveals annual specific hydrogen production values above 30 kg/kWp, and levelized cost of hydrogen below 4 €/kg, in the southern regions (Alentejo and Algarve) and the central-east area (Beira Interior)
• A benchmark analysis concludes that Portugal is very competitive in the “green” hydrogen market, when compared with neighbouring countries like Morocco and Spain.
1 Introduction
Combustion is a main source of atmospheric pollution (Conceição et al., 2016) producing both particulate and gaseous pollutants. These became prevalent in industrial and urban areas (Silva et al., 2014; Silva et al., 2016; Matthews et al., 2019). Since “green” hydrogen is a non-pollutant alternative, it is expected to become a dominant energy vector in the future, where pollution is being substantially reduced. In fact, hydrogen benefits from two advantages in comparison to conventional fuels: it has the highest gravimetric energy density, and (essentially) the only product of the combustion process is water (Sterner and Stadler, 2019). These bring advantages like higher autonomies, in comparison to battery run electric cars, at (almost) null levels of pollutants. Moreover, adaption of internal combustion engines running on conventional fuels to hydrogen is a common practice today. Such technology would then appear to solve the mobility problem, yet, it has its downfalls. For example, the low ignition energy that makes it a dangerous gas, and the low volumetric energy density that implies the use of very high pressures of up to 700 atm. Such challenges are expected to be overcome with significant research efforts being done in order to do so (Rasul et al., 2022). Moreover, the use of hydrogen is not restricted to internal combustion engines, but it has many additional applications. For example, plans are set in different countries to blend hydrogen into the natural gas grid as a transition measure (Rosenow, 2022). Hydrogen is also considered to store renewable energy avoiding curtailment in periods of significant production and reduced demand (Sterner and Stadler, 2019). Another example is synthetic fuels production via Fisher-Tropsch process (Partidário et al., 2020).
More fundamentally, hydrogen could provide sustainability and energetic independence to Europe, if it is produced from renewable sources and within European borders. In fact, from the different technologies able to produce hydrogen from renewable energy (Holladay et al., 2009; Yue et al., 2021), water electrolysis (Schmidt et al., 2017; Bunge et al., 2022) combined with wind or photovoltaic power seem to be the most mature and affordable technologies. Thus, most of the investments expected on this field are considering those (Olabi et al., 2021). Relevant to this is the abundance of solar energy in the South of Europe (e.g., PVGIS, 2022). This makes photovoltaic power very suitable for hydrogen production. Obviously, the case can also be made for concentrated solar power (CSP) plants (Lopes et al., 2019; Lopes et al., 2020; Tavares et al., 2022). In which improvements, like the use of residual heat from the electrolysers to pre-heat the heat transfer fluid, could be implemented (Merrouni et al., 2016a; Merrouni et al., 2016b). But, this technology would certainly have a higher cost than photovoltaic power plants.
In this context, Portugal has excellent conditions to produce hydrogen from solar energy. Recent studies, focused on the assessment of solar resource in this country, have shown mean annual availabilities as high as 2,028 kWh/m2/year for global horizontal irradiance (GHI) (Silva et al., 2020) and 2,097 kWh/m2/year for direct normal irradiance (DNI) (Cavaco et al., 2021) for the South of the country. As a matter of fact, Portugal, relying on the National Energetic and Climate Plan for 2030 (PNEC 2030a, 2023), has set resolute targets for the integration of renewable energy into the energy production system. This plan aims at a goal of 47% of renewable energy by 2030 and 64% by 2040 (Partidário et al., 2020). In this scenario modest targets have been set for hydrogen production by water electrolysis that would have an installed capacity of only 160 MW by 2030 and 400 MW by 2040, while production by biomass gasification would have similar capacities and availabilities. Nevertheless, these targets are being updated to more ambitious ones (PNEC 2030b, 2023). In fact, the Portuguese National Strategy for Hydrogen (PNSH 2030, 2020) has set more assertive targets for 2030. By that year hydrogen should cover 5% of final energy use, 2 GW of electrolyser capacity should be installed, 15% of injection of hydrogen into the natural gas grid should be guaranteed, and 50 to 100 fuelling stations for mobility purposes should be installed. These targets make it indispensable to accurately evaluate the potential of hydrogen production and its costs for Portugal. These also require the development of an hydrogen capacity atlas to better visualise the results and encourage policymakers and stakeholders to invest in this promising energy sector.
In fact, mapping the potential of hydrogen is an interesting research subject that recently attracts the attention of researchers. For instance (Nasser and Hassan, 2024a; Nasser and Hassan, 2024b) evaluated and mapped the potential of hydrogen production in Egypt from solar and wind. Several scenarios of the renewables share were used, and the authors found that the hydrogen power density can reach 57.1 kg/m2. On the same vein (Nasser and Hassan, 2024a; Nasser and Hassan, 2024b), assessed and developed an atlas of hydrogen production for the Middle East and North Africa (MENA) region. One of the pertinent results in this study is the cost of hydrogen that ranges between 2.12 and 3.89 $/kg while hybridizing the solar and wind technologies.
Moreover, one of the main inconveniences related to the hydrogen atlas development (for a region or a country)- is the accuracy of the data used and the number of the points used to generate the maps. Having access to a significant number of measurement points is usually a critical factor that impact the accuracy of the developed map (Azouzoute et al., 2019). Also, the measurement points should be very well distributed and covering the whole surface of the investigated country (Ouchani et al., 2021).
As such, this work uses 23 years of 1-h meteorological data from the Portuguese Meteorological Service (Instituto Português do Mar e da Atmosfera - IPMA) covering 89 stations in mainland Portugal. The data is employed to develop Typical Meteorological Years (TMY), according to the method explained in (Kalogirou, 2014), for each station. In terms of radiation the meteorological data only has GHI and no DNI nor diffuse horizontal irradiance (DHI) measurements are available, thus there was the need to estimate them. At this point a decision was made to use the separation model developed by (Abreu et al., 2019) to determine DHI and from it DNI. This model was developed for 1-min data, but is also suitable for 1-h data, as shown below, as data noise is reduced by the averaging process. Moreover, the model parameters were calibrated for a reference station in the South of Portugal, operated by the Portuguese Institute for Earth Sciences (Instituto de Ciências da Terra – ICT). This station measured simultaneously DNI, GHI, and DHI, using a standard Sun Tracker equipment, for 4 years. This calibration process leads to a good agreement between the modelled and the measured data, where the error is 2.5% for the DNI and 3.9% for the DHI. More details about this can be found in the methodology section. Furthermore, a model of a 120 MWp photovoltaic power plant was developed using the PVWatts (no financial model) option of System Advisor Model (SAM, 2024). SAM was developed by the National Renewable Energy Laboratory in the United States (Blair et al., 2014). The power plant model was fed with the TMY from the 89 stations in mainland Portugal. The resulting 1-h photovoltaic power production values were subsequently fed into a model of an electrolyser plant previously developed (Touili et al., 2018; Touili et al., 2022). This allowed to determine the annual hydrogen production on each station. The results are presented in annual mass of hydrogen produced per installed nominal power (annual specific hydrogen production) and levelized cost of hydrogen (LCOH2). These are mapped using a geographical information system (GIS) software to identify suitable places to install these facilities. Finally, the techno-economic analysis reveals annual specific hydrogen production values above 30 kg/kWp, and LCOH2 below 4 €/kg, in the southern regions (Alentejo and Algarve) and the central-east area (Beira Interior). This makes these regions very attractive and competitive in the hydrogen market, especially when compared with neighbouring countries like Morocco and Spain.
It is important to highlight that this study not only presents the first atlas for Solar Hydrogen production capacity and cost in Portugal, but it is developed with high accuracy. In fact, the simulations are done using high quality in-situ GHI data for a long-term period (that reduces the impact of inter-annual variation, Tavares et al., 2024) and a good land coverage with 89 measurement locations. This may be of high interest for the policymakers and the investors to boost “green” hydrogen projects in Portugal.
The paper is organized as follows: in Section 2 the methodology implemented is described; in Section 3 the results of the analysis are presented and are discussed in Section 4; finally, in Section 5 conclusions are drawn.
2 Methodology
This section is dedicated to present and discuss the different methods used in this study. The first part will discuss the technique used to model DNI and DHI data. While the second part will discuss the models used to simulate the electricity production as well as the hydrogen production and cost.
2.1 Measurements and filters
In this study it is considered the meteorological data from IPMA’s national network. This comprises more than 90 stations, well distributed across Portugal, and having a large data coverage period, reaching 23 years. Out of those stations, 89 were selected as having more than 5 years of data. Details on the stations can be found in Supplementary Appendix Table SA1 in the appendix and (Silva et al., 2020; Tavares et al., 2022). As mentioned before, the network measures only the GHI component and did not measure DHI nor DNI. Thus, these parameters have been estimated, as described below.
Measurements of GHI were performed every hour using Kipp&Zonen CM11 and Hukseflux LP02 pyranometers, with the CM11 model being used in most of IPMA’s stations. Both pyranometers are secondary standard instruments according to the International Organization of Standardization (ISO 9060:1990, 2018). It is worth mentioning that detailed information regarding the pyranometers calibration and maintenance is not available, due to the large number of stations and their spatial distribution. Thus, in some cases, measurements might be affected by absence of calibration, malfunction, or soiling (Conceição et al., 2018; Merrouni et al., 2020). Regarding other meteorological variables measured at IPMA’s stations, air temperature and relative air humidity were recorded at a height of 1.5 m, from which the corresponding hourly averages are utilized for the analysis. Wind speed is recorded at a height of 10 m, with the averages of the last 10 min of each hour utilized (IPMAa, 2024). Air temperature and relative humidity measurements were made mainly with both Vaisala HMP45 (humidity accuracy at +20°C ± 1% RH, temperature accuracy at 20°C ± 0.2°C) and HMP155 sensors [humidity accuracy at +15 … +25°C - ±1% RH (0 … 90% RH), temperature accuracy ±(0.1 + 0.0017 × |temperature|) °C]. Whereas wind speed was mainly measured with both Vaisala WAA 151 cup anemometer [accuracy with characteristic transfer function (standard deviation) ± 0.17 m/s (0.38 mph), with simple transfer function Uf = 0.1 × R ± 0.5 m/s (1.12 mph)] and Gill ultrasonic sensors Windsonic 75 (accuracy ± 2% at 12 m/s) (IPMAb, 2024).
Among the meteorological network, a high precision meteorological (HPM) station is used as reference. This station is located at the ICT observatory (University of Évora – lat.: 38.567676; lon.: -7.911757). The HPM is able to measure the three components of solar irradiation simultaneously and separately with high accuracy. The GHI and DHI were both measured using Kipp&Zonen CMP11 pyranometer. This is a secondary class instrument with an average accuracy of
To ensure that the used irradiation measurements have high quality, a quality control procedure was performed for all the available measuring stations from IPMA’s network, as well as the ICT station. Data points that do not follow the proposed filters, as described in (Gueymard and Ruiz-Arias, 2016), were rejected:
1.
2. GHI > 0, DHI > 0, DNI ≥ 0;
3. DNI < 1100 + 0.03 ×
4. DNI <
5. DHI < 0.95 ×
6. GHI < 1.50 ×
7. DHI/GHI < 1.05 for GHI > 50 and
8. DHI/GHI < 1.10 for GHI > 50 and
In these equations,
2.2 Data gap filling
Data gaps in time series are frequent as a consequence of equipment malfunction (e.g., datalogger failure, electrical supply shot-down) or maintenance works. Hence, gap filling methods are required. In this study the gap filling method follows previous work done by the authors, details can be found in Silva et al. (2020); Tavares et al. (2022). Thus, data gaps of one or 2 h are filled by linear interpolation from the non-missing values. For missing periods of more than 2 h in a day, a geographical interpolation is made. In this interpolation, the algorithm selects the four closest neighbouring stations of the station to which data gaps are being filled and determines the long-term linear regression coefficients (slope and interception) between this station and the neighbouring ones. With those long-term linear regressions, up to four data points can be determined for each data point missing. The final value that will fill the data gap will be the average value of those four values. For example, for a missing GHI value in one station, the GHIs from the other four stations allow the determination of four GHI values for that station, through the long-term linear regression, which are averaged to estimate a value for the missing GHI. Differently to what was done in Silva et al. (2020); Tavares et al. (2022), after the geographical interpolation a new linear interpolation for data gaps of one or 2 h was performed. It should be said that interpolation of wind data was accomplished by the projection of wind speed and direction into its x and y components.
2.3 Typical meteorological year
Similarly to what was done in Tavares et al. (2022) the method developed in Hall et al. (1978) is followed. It estimates TMY by concatenating twelve typical meteorological months (TMM) from the complete time-series comprising 23 years of data. The determination of the TMM, from each calendar month, is accomplished by the use of Finkelstein–Schafer (FS) daily values (Finkelstein and Schafer, 1971). These coefficients compare cumulative frequency distribution functions (CDFs) of different meteorological parameters: mean, maximum and minimum daily value of air temperature, mean daily relative humidity, maximum and mean daily values of the wind speed, and daily global horizontal solar irradiation availability; for every month of every year to their long-term distribution. Comprehensive details for this method can be found in chapter two of Kalogirou (2014) and in Abreu (2016); Abreu et al. (2018).
2.4 Separation model
To simulate the DHI and DNI data a separation model is used, where the DHI is estimated from GHI, and these two parameters are used to assess DNI. According to the recent work (Yang, 2022), a considerable amount of separation models exists in the literature that can be used for that purpose. Out of these, the model by Abreu et al. (2019) is highlighted by the fact that it only uses one parameter, the clearness index -
This is a considerable improvement in relation with other models that include more parameters like Engerer2 (Engerer, 2015) and Yang4 (Yang, 2022). Because it simplifies the procedure to obtain
Moreover, Abreu’s model was originally developed for 1-min solar irradiation data but in our case is applied to 1-h data. This is feasible due to the averaging procedure acting as a low-pass filter. Therefore, if the model demonstrates proficiency with 1-min data, as demonstrated in (Yang, 2022), it is expected to perform even better with 1-h data. This is due to noise reduction resulting from the averaging process. Below, it will be discussed the accuracy of the modelled DNI for the HPM reference station in Évora.
According to Abreu’s model (Abreu et al., 2019) the diffuse fraction is defined as:
In which, the clearness index is defined by:
and
In Eq. 2
and
With this set of equations (Eqs 1–11), it is possible to estimate both DHI and DNI from GHI. Furthermore, 4 years of solar irradiation, from 2016 to 2019, recorded at the HPM, are used to validate and calibrate the separation model. In Figure 1 DNI, GHI and DHI measurements at this station are presented.
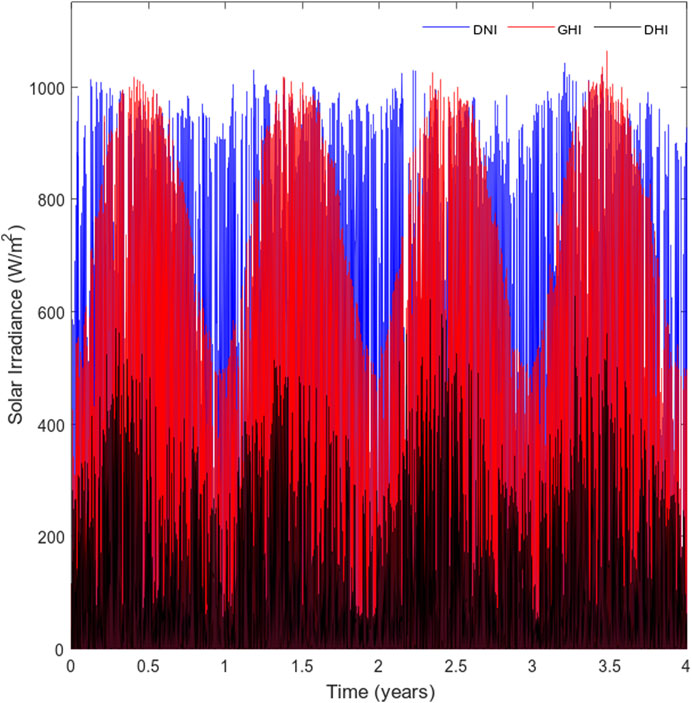
Figure 1. Hourly radiation data: DNI, GHI, and DHI (W/m2); used to calibrate de separation model. It was measured in Évora and comprises the years 2016–2019.
A validation of the separation model is performed by adjusting the model parameters to the HPM data of 2016, 2017 and 2018, and use GHI from 2019 to model DNI. The modelled DNI is then compared with the measured DNI for 2019. In Figure 2A the modelled DNI and the observed DNI are represented against each other, showing good agreement between both. As a matter of fact, the linear regression shows a R2-coefficient of 0.95, which confirms such agreement. Moreover, the root mean square error (RMSE) is equal to 81 W/m2, the mean bias error (MBE) is equal to 56 W/m2, and the mean absolute error (MAE) equal to −13 W/m2, which are all small values. Comparing the modelled and observed DNI annual availabilities,
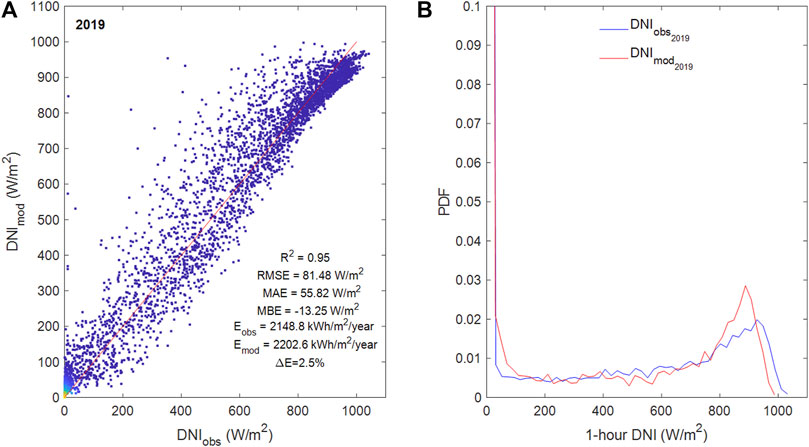
Figure 2. Modelled and observed hourly DNI data for 2019: (A) modelled vs. observed data; (B) probability density functions (PDF).
To calibrate the model, the 4 years (2016–2019) of common GHI, DHI and DNI data of the HPM reference station are used, Figure 1. The observed
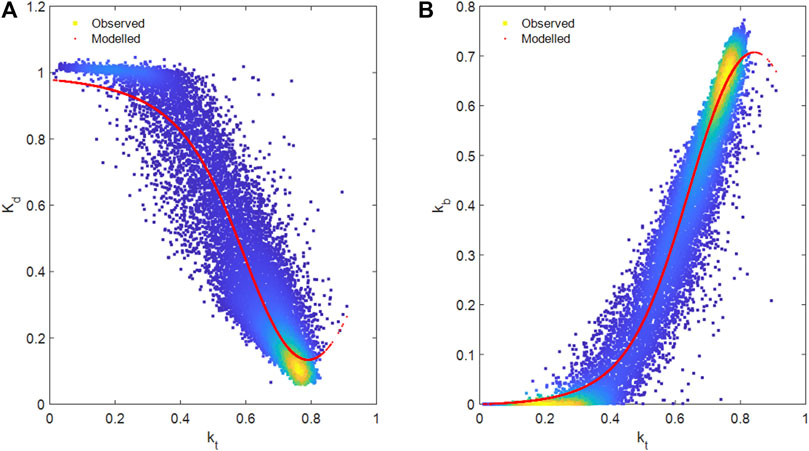
Figure 3. Representation of (A) the diffuse fraction -
Finally, the calibrated parameters are used to estimate DHI and DNI from the GHI in the TMY, these are then used to simulate the power production as described below.
It should be said that the methodology developed in this section has two limitations: only 4 years of data were used for the model calibration, and the calibration parameters are assumed to be valid for the entire country. Both limitations should not impact in the results found for hydrogen production. On the one hand, the interannual variability of solar radiation is low in Portugal (Silva et al., 2020; Tavares et al., 2024). Therefore, the inclusion of more years of data should not change considerably the model calibration. On the other hand, Portugal is a small country having a similar climate throughout its mainland region. Thus, it is not expected that the calibration parameters should vary significantly over it.
2.5 Power plant model
To simulate the electricity production of the selected power plant it is used SAM software (SAM, 2024). This is a freely available financial and performance model designed to facilitate decision making in renewable energy system projects (Blair et al., 2014). The simulated PV power plant is a fixed module with a nominal capacity of 120 MWp. The PVWatts (no financial model) option was selected. The simulation details are listed below:
1. Nominal power: 120 MWdc;
2. Module type: standard;
3. DC to AC ration: 1.2;
4. Rated inverter size: 100 MWac;
5. Inverter efficiency: 96%;
6. Array type: fixed open rack;
7. Tilt angle: optimun tilt angle is determined by equation 22.48 of (Lorenzo, 2011) for each latitude (L) -
8. Azimuth: 180;
9. Ground coverage ratio: 0.3;
10. System loss: soiling – 2%; shading – 1%; mismatch – 2%; connections – 0.5%; light-induced degradation 1.5%; nameplate – 1%; age: 1%; availability – 3%; total system losses – 13.18%.
The TMY for each station is fed into the simulator and hourly electricity production values from the photovoltaic power plants are achieved. The following parameters are recorded and passed to the electrolyser model: AC inverter output power; DC inverter input power; system power generated; ambient temperature; DNI; DHI; GHI.
It is worth mentioning that SAM software is one of the most widely used simulation tool for PV applications. Additionally, it was shown to have a very low average deviation from real measurements of only 0.75%, according to Umar et al. (2018).
2.6 Electrolyser techno-economic model
To simulate the hydrogen production, the electrolysis script is executed using the electricity production data as input from all the locations. The used electrolyser is based on Proton Exchange Membrane (PEM) technology. This decision is grounded on numerous advantageous attributes of this technology. These include durability, high efficiency, and, most notably, its compatibility with electricity fluctuations from intermittent sources. As this is the case for PV plants (Touili et al., 2018). The calculation of hydrogen production is performed using the following formula (Touili et al., 2022):
here
On completion of the calculation of the hydrogen production, the economic analysis can be performed. One of the most used metrics for similar studies is the LCOH2 production. The LCOH2 accounts for the project expenses through its lifetime as well as its technical aspects. This allows a fair assessment and comparison of the economic viability of hydrogen production projects between different technologies and locations. The LCOH2 is expressed as follows (Amrani et al., 2024):
In which
The investment cost associated with the electrolyser
The electrolyser capital cost
In this equation
Regarding the investment cost of the PV plant (
Here
3 Results
3.1 Typical meteorological years
Following the procedure explained in Section 2.3, TMY are determined for each station considered in this study. After that, the calibrated Abreu’s model, Section 2.4, is used to estimate DHI and DNI from GHI data in the TMY. Irradiance values below a solar zenith angle of 85° were considered in this analysis, despite their small contribution to electricity production. Such values were obtained by interpolation between the last point before sunrise and the first point with solar zenith angle above 85° in the morning, and the last value with solar zenith angle above 85° and the first value after sunset in the evening. With this procedure it is guaranteed that there are no data gaps in the TMY file, which is a necessary condition to use these files in SAM. The final .csv files contained rows with the following data (in the same order as in the file): GHI, DNI, DHI, ambient temperature, relative humidity, and wind speed.
For the sake of clarity DNI, GHI and DHI from TMY of selected stations (Lisboa – LIS, Sines – SIN, Beja – BEJ and Pampilhosa da Serra – PAM) are represented in Figure 4. The three components of solar irradiance follow the expected patterns observed in Portugal, e.g., in the HPM station at Évora, Figure 1. Detailed discussion of similar data can be found in (Silva et al., 2020; Tavares et al., 2022). Moreover, GHI and DNI availability maps were already presented in those works and for that reason these will not be represented here.
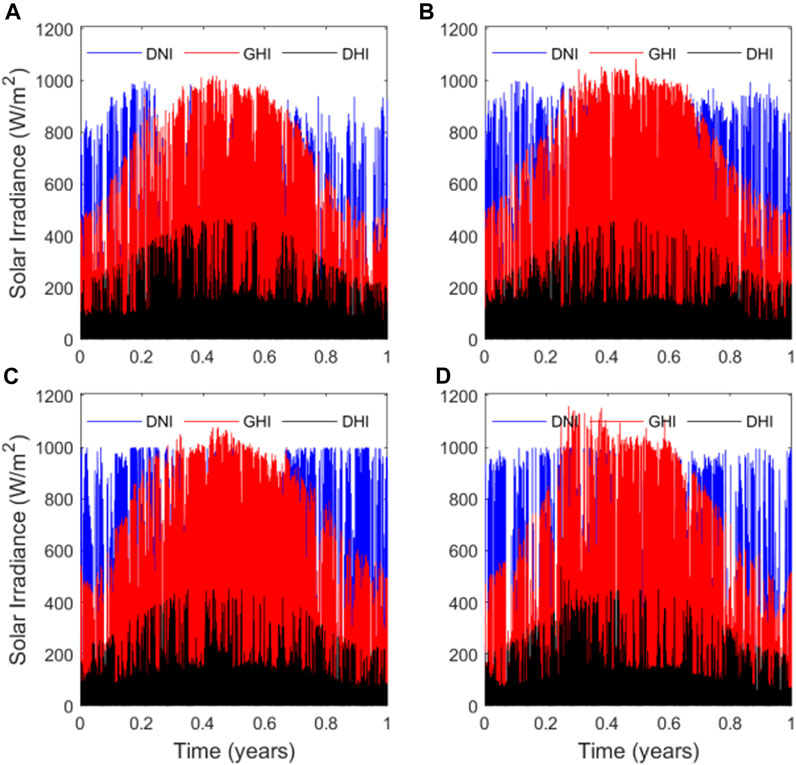
Figure 4. Hourly radiation data: DNI, GHI and DHI (W/m2) for the Typical Meteorological Year (TMY) on selected stations: (A) LIS; (B) SIN; (C) BEJ; (D) PAM; for sake of comparison.
3.2 PV plant simulation
The TMY files are now fed into the SAM photovoltaic power plant simulator described in Section 2.5. As it was done in the previous section the hourly PV production, inverter power: DC input and AC output, for the four selected stations are represented in Figure 5. The data shows a reduction in production in the Winter months followed by maxima in Spring and Fall.and A shallow reduction is observed in the Summer months, as a consequence of the high temperatures felt in that time of the year.
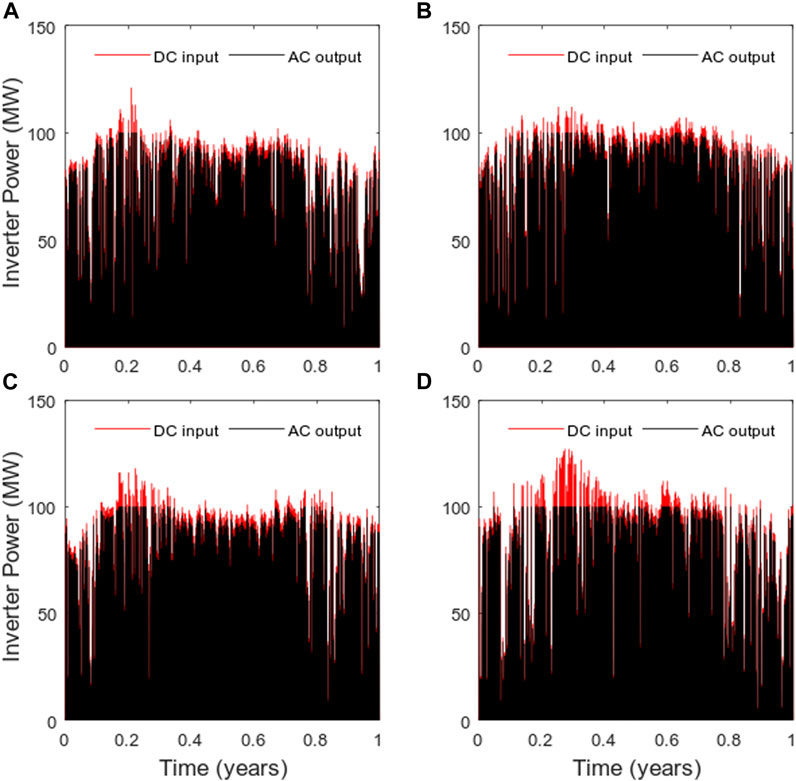
Figure 5. Hourly inverter power: DC input (in red) and AC output (in green) on selected stations: (A) LIS; (B) SIN; (C) BEJ; (D) PAM; for sake of comparison.
The important variable for hydrogen production is the DC input inverter power. Thus, annual electricity production values are presented in Supplementary Appendix Table SA1 of the appendix and represented in a map in Figure 6. It can be realised that there is a tendency for an increase in electricity production following the north-west to south-east direction, with higher values being found in the south (in the regions of Alentejo and Algarve) and in the central-east area (in the region of Beira Interior). Making these regions attractive for PV investments in Portugal. As expected, this tendency for increase is similar to what was found in solar irradiance (Silva et al., 2020; Tavares et al., 2022) and CSP production (Tavares et al., 2022; Tavares et al., 2024).
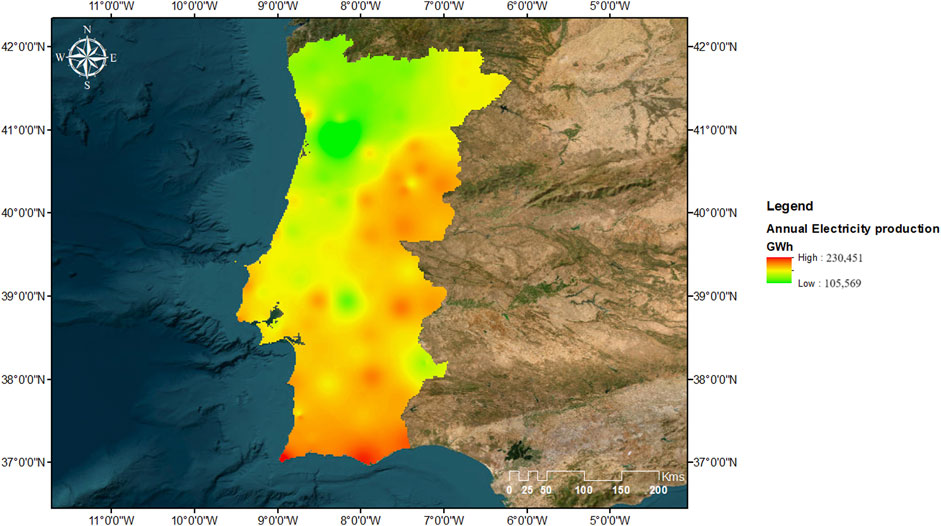
Figure 6. Annual electricity production (GWh) map for continental Portugal simulated from the IPMA’s ground stations TMY using System Advisor Model (SAM).
Furthermore, as can be concluded from the analysis of Supplementary Appendix Table SA1 the highest values of annual electricity production are found in Sagres (south-west) and Faro (south-east). In these locations the production is as high as 230 GWh and 224 GWh per year, respectively. These correspond to capacity factors of 21.9% and 21.3%, which are very attractive figures.
3.3 Hydrogen production
Additionally, electricity production is used to estimate hydrogen production following the procedure described in Section 2.6. Similarly to what was done in previous sections, the hourly hydrogen production is represented for the four selected stations in Figure 7. As presumed, the hydrogen production follows the same tendency of the DC input inverter power, since the electrolyser model is linear. Interestingly, in the annual hydrogen production map, Figure 8, it is evident the north-west to south-east direction of production increase. It is further highlighted that the higher values of production are found for the same regions as electricity production: the south (in the regions of Alentejo and Algarve) and the central-east area (in the region of Beira Interior) of the country. This means that these regions have the potential for the lowest values of LCOH2, as will be discussed in the next section.
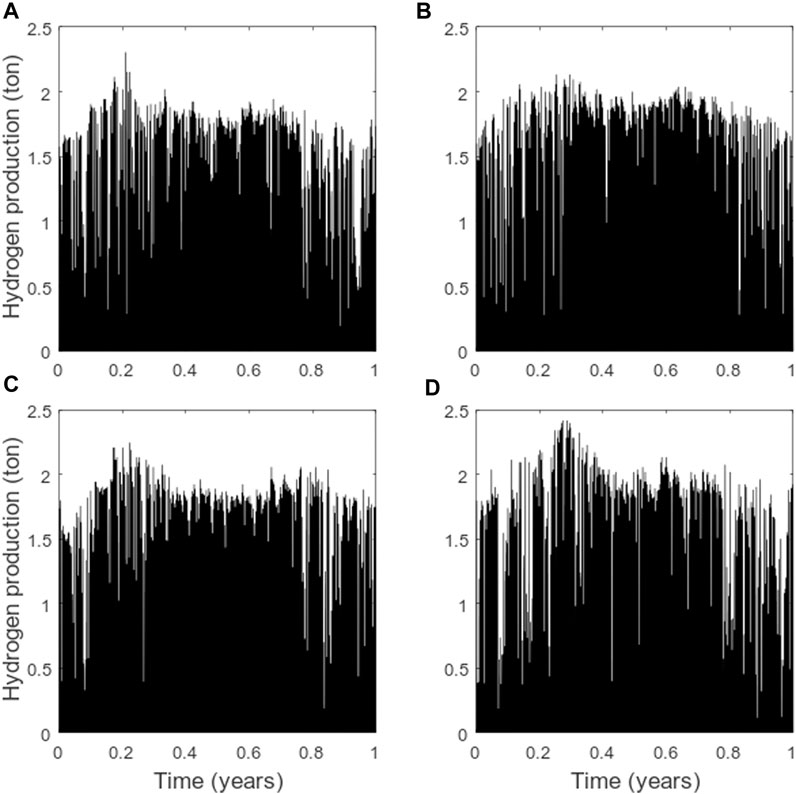
Figure 7. Hourly hydrogen production on selected stations: (A) LIS; (B) SIN; (C) BEJ; (D) PAM; for sake of comparison.
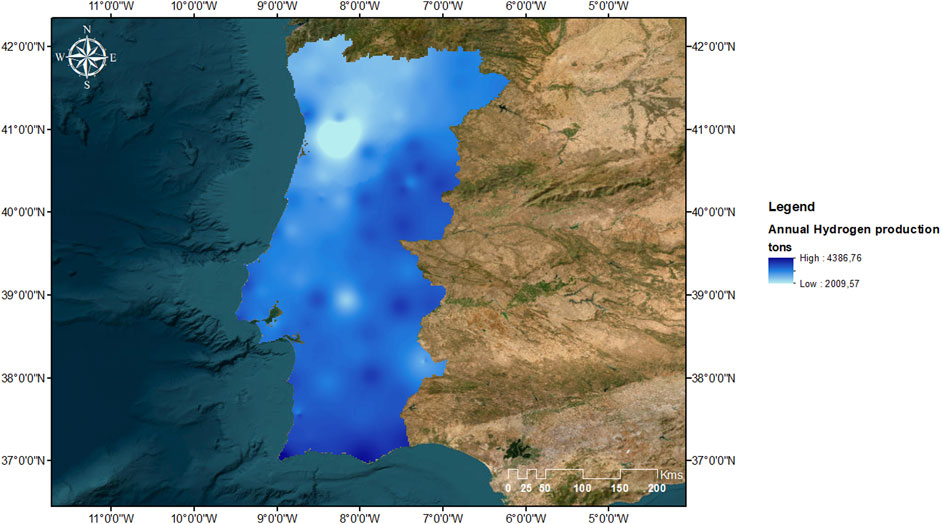
Figure 8. Annual hydrogen production (ton) map for continental Portugal calculated from SAM’s simulations of electricity production.
In fact, Supplementary Appendix Table SA1 shows again that the highest values of annual hydrogen production are found in Sagres (south-west) and Faro (south-east) with values as high as 4 387tons and 4,265 tons per year, which reveal to be very attractive figures.
4 Discussion
To further extract information from these results the tecno-economic analysis is here discussed.
First, to extract information independent of the PV power plant capacity, the annual hydrogen production values found in this study are divided by the nominal capacity of the simulated power plant to determine the annual specific hydrogen production. It is defined as the annual mass of hydrogen produced per installed nominal power. This estimation gives the interested reader reliable figures for future investments in Portugal. They are presented in Tabel 1 of the appendix for each station considered in this study and are mapped in Figure 9. As it would be expected there is again an increase in the annual specific hydrogen production in the north-west to south-east direction following the same trend as both electricity and hydrogen production. The regions with the higher annual specific hydrogen production are, as expected, the south (in the regions of Alentejo and Algarve) and the central-east area (in the region of Beira Interior) of Portugal. These regions show benchmark values of annual specific hydrogen production above 30 kg/kWp per year. In fact, Sagres (south-west) and Faro (south-east), have the higher annual specific productions of 36.56 kg/kWp and 35.54 kg/kWp, respectively.
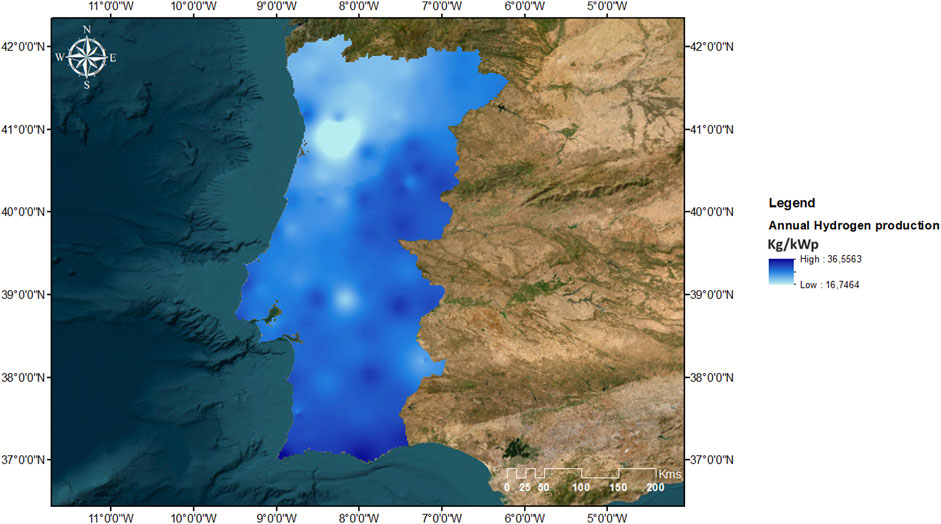
Figure 9. Annual specific hydrogen production (kg/kWp) map for continental Portugal obtained from annual hydrogen production dividing by the nominal power plant capacity (120 MWp).
Second, a map of the LCOH2 for Portugal is presented in Figure 10 and the values related to each location are presented in Supplementary Appendix Table SA1 of the appendix. As it can be noticed there is a north-west to south-east trend for LCOH2 reduction. Some locations in Portugal, especially, the regions of Alentejo and Algarve and the Beira Interior, have the potential to produce hydrogen with LCOH2 below 4.0 €/kg. This is very interesting as these locations are considered as highly suitable for implementing solar-driven hydrogen production units. As a matter of fact, Sagres (south-west) and Faro (south-east), have the lower LCOH2 of 3.476 €/kg and 3.562 €/kg, respectively.
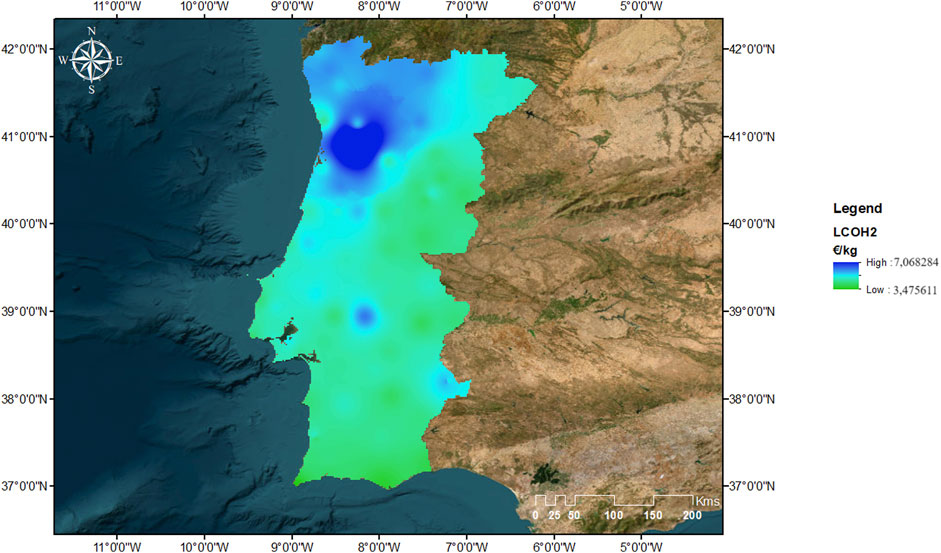
Figure 10. Levelized Cost of Hydrogen (LCOH2) map continental Portugal obtained from tecno-economic analysis of hydrogen production. *Conversion between dollars and euros updated on 30 of November 2023.
To better evaluate the position of the Portugal on the “green” hydrogen market, a benchmark of the LCOH2 has been made with reference countries in the world, see Figure 11. In the plot the lowest LCOH2 values found for each country are represented. As illustrated, Portugal has the potential to become a key player in solar hydrogen production, as the €/kg is the lowest in Europe. Moreover, it is very close to the prices determined for the northern African countries. The comparison is made with the following countries: Nederland (Roest et al., 2020), Spain (Matute et al., 2022), Tunisia (Barhoumi et al., 2022), Chile (Garcia and Oliva, 2023), Germany (George et al., 2022), and Morocco (Amrani et al., 2023).
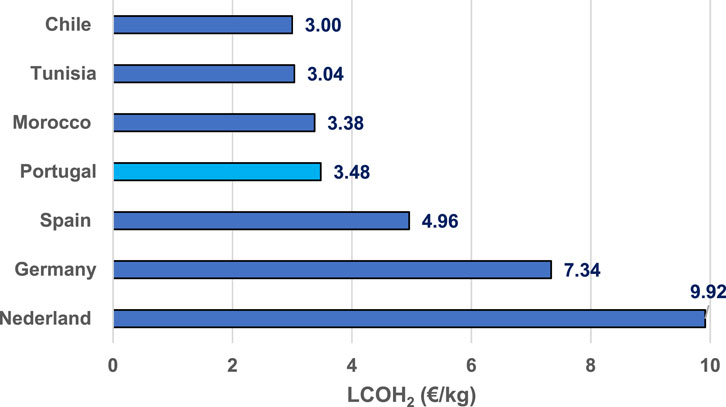
Figure 11. Benchmark of Levelized Cost of Hydrogen (LCOH2) in Portugal compared with reference countries in the world. The lowest LCOH2 values found for each country are represented.
Besides, it should be said that intensive research is going on related with the techno-economic analysis of production of hydrogen from renewable sources, mainly, solar and wind. For that reason, a substantial amount of works is being published in the literature recently on this subject. Among the most recent are (Al-Ghussain et al., 2024): that used PVGIS data to perform a techno-economic analysis of production of hydrogen in California (USA) (Fabianek and Madlener, 2024); that used reanalysis data to compare the “green” hydrogen capabilities in two different sites, one in California and other in Northern Germany (Mansir et al., 2024); that used meteorological data from NASA database to do a techno-economic analysis of photovoltaic and wind energy based hydrogen production for three cities in Saudi Arabia (Baghel et al., 2024); that performed the analysis for five different locations using meteorological data in India (Hussam et al., 2024); that used meteorological data from NASA database to perform a techno-economic analysis of “green” hydrogen production in a single location in Kuwait.
These studies highlight the uniqueness of the present study. This is because it reveals that most studies involving hydrogen production from renewable sources can be basically divided into two categories: mapping of hydrogen production using satellite and simulations derived data; using meteorological data to study only several case studies and do not perform the mapping. Nevertheless, the present work uses ground measured meteorological data from an extensive network, 89 stations, with nearly 23 years of 1-h records. What, in the one hand, allows for an accurate mapping of the hydrogen production from solar energy. And, in the other hand, brings value to the meteorological data.
Additionally, this work allows to draw some conclusions in terms of energy policy and decision making. As it was mentioned in the introduction the Portuguese National Strategy for Hydrogen (PNSH 2030, 2020) has set the goal of 15% of injection of “green” hydrogen into the natural gas grid until 2030. Considering the natural gas yearly consumption in Portugal and the differences in the heating values due to the blend, the amount of hydrogen required per year can be calculated. In fact, it can be found that it is required nearly 82,500 000 kg of hydrogen per year to fulfil the 15% objective. Thus, according to the findings of this study, such objective will require the installation of approximately 2.75 GWp in photovoltaic power plants in the best performing regions (Beira Interior, Alentejo and Algarve) that have a “green” hydrogen potential of production above 30 kg/kWp. Moreover, according to the Portuguese General Directorate of Energy and Geology (in Portuguese “Direção Geral de Energia e Geologia”) in 2023 there were 3.9 GWp of photovoltaic power installed (DGEG, 2024). This means that this capacity would have to increase in 70% only to satisfy the “green” hydrogen production needs until 2030. This is a relevant figure that policymakers should have to have in consideration while making strategic decisions in the national energy transition.
Furthermore, it should be added that while the results found in this study cannot be directly used to draw conclusions to other regions. This is because the results depend considerably on the regional meteorology. The methodology developed in this work can be easily replicated to other regions supporting decision making there.
To wrap up, this study assessed the techno-economic potential of PV hydrogen production for Portugal. As a result it publishes the atlas of the hydrogen potential in this country for the first time. This can be considered as a first phase of the project implementation, but, several challenges and deeper analysis should be considered for a better and optimal implementation of “green” hydrogen production units. First thing that must be assessed is the site selection where land occupation, slope and proximity to cities should be evaluated among other site selection criteria (Jbaihi et al., 2021; Dehshiri and Firoozabadi, 2023). In addition to that and after selecting the best location for the hydrogen project implementation, a feasibility analysis should be conducted by evaluating the meteorological parameters influencing the operation of the PV modules, like soiling (Merrouni et al., 2017) and high temperature values (Merrouni et al., 2016a; Merrouni et al., 2016b; Perraki and Kounavis, 2016; Ammari et al., 2022). Finally, durability of the PV modules (Aghaei et al., 2022) and the electrolyser (Zhang et al., 2022; Norazahar et al., 2024) should be assessed to have a more precise economical model. This would lead to a better project bankability and profitability (Mehdi et al., 2023).
5 Conclusion
The main conclusion of this study is that the south (in the regions of Alentejo and Algarve) and the central-east (in the region of Beira Interior) areas of Portugal have benchmark techno-economic values for “green” hydrogen production. In terms of mass of hydrogen produced per installed nominal power, these regions have annual values above 30 kg/kWp. In terms of levelized cost of hydrogen they have values below 4.0 €/kg. These values make these regions highly attractive for hosting large-scale photovoltaic hydrogen production plants and very competitive in the hydrogen market, especially with neighbouring countries like Morocco and Spain.
To accomplish the 15% of injection of “green” hydrogen into the natural gas grid until 2030 this work predicts the need to install approximately 2.75 GWp in photovoltaic power plants in the best performing regions just mentioned. This means that the installed photovoltaic capacity in Portugal would have to increase in 70% only to satisfy the “green” hydrogen production needs until 2030.
Future work would cross geographical information on road accesses, land availability (besides natural reserves and urban zones) and surface inclination, with the techno-economic results presented in this study to pin-point locations for “green” hydrogen production in Portugal.
Data availability statement
The raw data supporting the conclusions of this article will be made available by the authors, without undue reservation.
Author contributions
HGS: Conceptualization, Data curation, Formal Analysis, Investigation, Methodology, Project administration, Software, Supervision, Validation, Writing–original draft, Writing–review and editing. AA: Data curation, Formal Analysis, Investigation, Methodology, Validation, Writing–original draft, Writing–review and editing. ST: Formal Analysis, Investigation, Methodology, Writing–review and editing. JN: Data curation, Investigation, Resources, Writing–review and editing.
Funding
The author(s) declare that financial support was received for the research, authorship, and/or publication of this article. The authors acknowledge Fundação para a Ciência e a Tecnologia (FCT) for its financial support via the project UIDB/50022/2020 (LAETA Base Funding). HGS declares that his work has received funding from a Project financed by the European Union through the Clean Hydrogen Partnership. The project is called H2tALENT—“Alentejo Green Hydrogen Valley delivers an integrated full-chain sustainable hydrogen ecosystem with technical, economic, social and environmental benefits and superior upscaling/replicability”. It has the reference: HORIZON-JTI-CLEANH2-2023-06-02; and Grant Agreement n. 101137611.
Acknowledgments
HGS wants to acknowledge João Batista, Angélica Gaspar, and Paulo Canhoto for interesting discussions about the work developed here and to Ailton Tavares for sharing his Matlab® code, these proved to be fundamental contributions to the work. Moreover, he wants to express his gratitude to the Physics Department of the University of Évora for supporting his work. He is willing to share his Matlab® code with interested readers.
Conflict of interest
The authors declare that the research was conducted in the absence of any commercial or financial relationships that could be construed as a potential conflict of interest.
The author(s) declared that they were an editorial board member of Frontiers, at the time of submission. This had no impact on the peer review process and the final decision.
Publisher’s note
All claims expressed in this article are solely those of the authors and do not necessarily represent those of their affiliated organizations, or those of the publisher, the editors and the reviewers. Any product that may be evaluated in this article, or claim that may be made by its manufacturer, is not guaranteed or endorsed by the publisher.
Supplementary material
The Supplementary Material for this article can be found online at: https://www.frontiersin.org/articles/10.3389/fenrg.2024.1380543/full#supplementary-material
References
Abreu, E. F., Canhoto, P., and Costa, M. J. (2019). Prediction of diffuse horizontal irradiance using a new climate zone model. Renew. Sustain. Energy Rev. 110, 28–42. doi:10.1016/j.rser.2019.04.055
Abreu, E. F. M. (2016). Solar resource assessment and modelling of a photovoltaic system linked to madeira island’s electric grid (in Portuguese). Master Thesis. Évora (Portugal): University of Évora.
Abreu, E. F. M., Canhoto, P., Prior, V., and Melicio, R. (2018). Solar resource assessment through long-term statistical analysis and typical data generation with different time resolutions using GHI measurements. Renew. Energy 127, 398–411. doi:10.1016/j.renene.2018.04.068
Achour, Y., Berrada, A., Arechkik, A., and El Mrabet, R. (2023). Techno-Economic Assessment of hydrogen production from three different solar photovoltaic technologies. Int. J. Hydrogen Energy 48, 32261–32276. doi:10.1016/j.ijhydene.2023.05.017
Aghaei, M., Fairbrother, A., Gok, A., Ahmad, S., Kazim, S., Lobato, K., et al. (2022). Review of degradation and failure phenomena in photovoltaic modules. Renew. Sustain. Energy Rev. 159, 112160. doi:10.1016/j.rser.2022.112160
Al-Ghussain, L., Alrbai, M., Al-Dahidi, S., and Lu, Z. (2024). Integrated assessment of green hydrogen production in California: life cycle Greenhouse gas Emissions, Techno-Economic Feasibility, and resource variability. Energy Convers. Manag. 311, 118514. doi:10.1016/j.enconman.2024.118514
Allouhi, A. (2020). Management of photovoltaic excess electricity generation via the power to hydrogen concept: a year-round dynamic assessment using Artificial Neural Networks. Int. J. Hydrogen Energy 45, 21024–21039. doi:10.1016/j.ijhydene.2020.05.262
Ammari, N., Mehdi, M., Merrouni, A. A., El Gallassi, H., Chaabelasri, E., and Ghennioui, A. (2022). Experimental study on the impact of soiling on the modules temperature and performance of two different PV technologies under hot arid climate. Heliyon 8 (11), e11395. doi:10.1016/j.heliyon.2022.e11395
Amrani, S. E., Merrouni, A. A., Touili, S., and Dekhissi, H. (2023). A multi-scenario site suitability analysis to assess the installation of large scale photovoltaic-hydrogen production units. Case study: eastern Morocco. Energy Convers. Manag. 295, 117615. doi:10.1016/j.enconman.2023.117615
Amrani, S. E., Merrouni, A. A., Touili, S., Ouali, H. A. L., and Dekhissi, H. (2024). An AHP-GIS combination for site suitability analysis of hydrogen production units from CSP &PV solar power plants in Morocco. Int. J. Hydrogen Energy 56, 369–382. doi:10.1016/j.ijhydene.2023.12.165
Azouzoute, A., Merrouni, A. A., and Gennioui, A. (2019). Accuracy measurement of pyranometer vs reference cell for PV resource assessment. Energy Procedia 157, 1202–1209. doi:10.1016/j.egypro.2018.11.286
Baghel, N., Manjunath, K., and Kumar, A. (2024). Techno-economic analysis of hybrid renewable power generation system under different climatic zones in India. Electr. Eng. doi:10.1007/s00202-024-02318-7
Barhoumi, E. M., Okonkwo, P. C., Farhani, S., Belgacem, I. B., Zghaibeh, M., Mansir, I. B., et al. (2022). Techno-economic analysis of photovoltaic-hydrogen refueling station case study: a transport company Tunis-Tunisia. Int. J. Hydrogen Energy 47 (58), 24523–24532. doi:10.1016/j.ijhydene.2021.10.111
Blair, N., Dobos, A. P., Freeman, J., Neises, T., Wagner, M., Ferguson, T., et al. (2014). System advisor model, sam 2014.1.14: general description; NREL rep. No. TP-6A20-61019, 13. Golden, CO, USA: Natl. Renew. Energy Lab. doi:10.2172/1126294
Bunge, L., Silva, H. G., Cruz, P. L., and Iten, M. (2022). Testing of a low-cost dry cell prototype for oxyhydrogen production. Designs 6 (5), 79. doi:10.3390/designs6050079
Cavaco, A., Canhoto, P., and Collares-Pereira, M. (2021). Procedures for solar radiation data gathering and processing and their application to DNI assessment in southern Portugal. Renew. Energy. 163, 2208–2219. doi:10.1016/j.renene.2020.10.075
Conceição, R., Melgão, M., Silva, H. G., Nicoll, K., Harrison, R. G., and Reis, A. H. (2016). Transport of the smoke plume from Chiado’s fire in Lisbon (Portugal) sensed by atmospheric electric field measurements. Air Qual. Atmos. Health 9 (3), 275–283. doi:10.1007/s11869-015-0337-4
Conceição, R., Silva, H. G., Mirão, J., Godestein, M., Fialho, L., Narvarte, L., et al. (2018). Saharan dust transport to Europe and its impact on photovoltaic performance: a case study of soiling in Portugal. Sol. Energy 160, 94–102. doi:10.1016/j.solener.2017.11.059
Dehshiri, S. S. H., and Firoozabadi, B. (2023). A novel four-stage integrated GIS based fuzzy SWARA approach for solar site suitability with hydrogen storage system. Energy 278 (A), 127927. doi:10.1016/j.energy.2023.127927
(DGEG (2024). Direção Geral de Energia e Geologia: Energia em Números. Available at: https://www.dgeg.gov.pt/pt/destaques/energia-em-numeros-edicao-2024/ (Accessed July 24, 2024).
Engerer, N. A. (2015). Minute resolution estimates of the diffuse fraction of global irradiance for southeastern Australia. Sol. Energy 116, 215–237. doi:10.1016/j.solener.2015.04.012
Fabianek, P., and Madlener, R. (2024). Techno-economic analysis and optimal sizing of hybrid PV-wind systems for hydrogen production by PEM electrolysis in California and Northern Germany. Int. J. Hydrogen Energy 67, 1157–1172. doi:10.1016/j.ijhydene.2023.11.196
Finkelstein, J. M., and Schafer, R. E. (1971). Improved goodness-of-fit tests. Biometrika 58, 641–645. doi:10.2307/2334400
Garcia, M. G., and Oliva, S. H. (2023). Technical, economic, and CO2 emissions assessment of green hydrogen production from solar/wind energy: the case of Chile. Energy 278, 127981. doi:10.1016/j.energy.2023.127981
George, J. F., Müller, V. P., Winkler, J., and Ragwitz, M. (2022). Is blue hydrogen a bridging technology? - the limits of a CO2 price and the role of state-induced price components for green hydrogen production in Germany. Energy Policy 167, 113072. doi:10.1016/j.enpol.2022.113072
Gueymard, C. A., and Ruiz-Arias, J. A. (2016). Extensive worldwide validation and climate sensitivity analysis of direct irradiance predictions from 1-min global irradiance. Sol. Energy 128, 1–30. doi:10.1016/j.solener.2015.10.010
Hall, I. J., Prairie, R. R., Anderson, H. E., and Boes, E. C. (1978). “Generation of a typical meteorological year,” in Proceedings of the 1978 Annual Meeting of the American Section of the International Solar Energy Society, Denver, CO, 669–671.
Holladay, J. D., Hu, J., King, D. L., and Wang, Y. (2009). An overview of hydrogen production technologies. Catal. Today 139 (4), 244–260. doi:10.1016/j.cattod.2008.08.039
Hussam, W. K., Barhoumi, E. M., Abdul-Niby, M., and Sheard, G. J. (2024). Techno-economic analysis and optimization of hydrogen production from renewable hybrid energy systems: shagaya renewable power plant-Kuwait. Int. J. Hydrogen Energy 58, 56–68. doi:10.1016/j.ijhydene.2024.01.153
IPMAa (2024). Rede de Estações Meteorológicas. Available at: https://www.ipma.pt/pt/otempo/obs.superficie/ (Accessed January 30, 2024).
IPMAb (2024). Parques Meteorológicos e Equipamentos. Available at: https://www.ipma.pt/pt/educativa/observar.tempo/index.jsp?page=ema.index.xml (Accessed January 30, 2024).
ISO 9059:1990 (2014). Solar energy—calibration of field pyrheliometers by comparison to a reference pyrheliometer. International Organization for Standardization. Available at: https://www.iso.org/standard/16628.html (Accessed January 30, 2024).
ISO 9060:1990 (2018). Solar energy—specification and classifications of instruments for measuring hemispherical solar and direct solar radiation, international organization for standardization. Available at: https://www.iso.org/standard/16629.html (Accessed January 30, 2024).
Jbaihi, O., Ouchani, F. Z., Merrouni, A. A., Cherkaoui, M., Maaroufi, M., and Ghennioui, A. (2021). Site assessment for wet and dry concentrated solar power plant integration using an analytical hierarchy process–geographic information system approach: a case study in the marrakesh-safi region. Energy Technol. 9 (5), 2001135. doi:10.1002/ente.202001135
Kalogirou, S. A. (2014). “Chapter 2 – environmental characteristics,” in Solar energy engineering: processes and systems. second edition (Elsevier), 51–92.
Lopes, F., Conceição, R., Silva, H. G., Fasquelle, T., Salgado, R., Canhoto, P., et al. (2019). Short-term forecasts of DNI from an integrated forecasting system (ECMWF) for optimized operational strategies of a central receiver system. Energies 12, 1368. doi:10.3390/en12071368
Lopes, F. M., Conceição, R., Fasquelle, T., Silva, H. G., Salgado, R., Canhoto, P., et al. (2020). Predicted direct solar radiation (ECMWF) for optimized operational strategies of linear focus parabolic-trough systems. Renew. Energies 151, 378–391. doi:10.1016/j.renene.2019.11.020
Lorenzo, E. (2011). “Chapter 22 – energy collected and delivered by PV modules,” in Handbook of photovoltaic science and engineering. Editors A. Luque, and S. Hegedus 2nd edition (Hoboken, NJ: Wiley), 984–1042.
Mansir, I. B., Okonkwo, P. C., and Farouk, N. (2024). Techno-economic optimization of a photovoltaic-wind energy based hydrogen production system: a case study of different cities of Saudi Arabia. Energy and Environ., 1–29. doi:10.1177/0958305X241248373
Matthews, J. C., Wright, M. D., Clarke, D., Morley, E. L., Silva, H., Bennett, A. J., et al. (2019). Urban and rural measurements of atmospheric potential gradient. J. Electrost. 97, 42–50. doi:10.1016/j.elstat.2018.11.006
Matute, G., Yusta, J. M., Beyza, J., and Monteiro, C. (2022). Optimal dispatch model for PV-electrolysis plants in self-consumption regime to produce green hydrogen: a Spanish case study. Int. J. Hydrogen Energy 47 (60), 25202–25213. doi:10.1016/j.ijhydene.2022.05.270
Mehdi, M., Ammari, N., Merrouni, A. A., El Gallassi, H., Dahmani, M., and Ghennioui, A. (2023). An experimental comparative analysis of different PV technologies performance including the influence of hot-arid climatic parameters: toward a realistic yield assessment for desert locations. Renew. Energy 205, 695–716. doi:10.1016/j.renene.2023.01.082
Merrouni, A. A., Conceição, R., Mouaky, A., Silva, H. G., and Ghennioui, A. (2020). CSP performance and yield analysis including soiling measurements for Morocco and Portugal. Renew. Energy 162, 1777–1792. doi:10.1016/j.renene.2020.10.014
Merrouni, A. A., Mezrhab, A., Ghennioui, A., and Naimi, Z. (2017). Measurement, comparison and monitoring of solar mirror's specular reflectivity using two different Reflectometers. Energy Procedia 119, 433–445. doi:10.1016/j.egypro.2017.07.045
Merrouni, A. A., Mezrhab, A., Moussaoui, M. A., and Ouali, H. A. (2016b). Integration of PV in the Moroccan buildings: simulation of a small roof system installed in Eastern Morocco. Int. J. Renew. Energy Res. 6 (1), 306–314. doi:10.20508/ijrer.v6i1.2997.g6787
Merrouni, A. A., Ouali, H. A. L., Moussaoui, M. A., and Mezrhab, A. (2016a). “Analysis and comparison of different heat transfer fluids for a 1MWe parabolic trough collector,” in IEEE International Conference on Electrical and Information Technologies (ICEIT), Tangiers, Morocco, 4–7 May 2016, 510–515. doi:10.1109/EITech.2016.7519653
Nasser, M., and Hassan, H. (2024a). Egyptian green hydrogen Atlas based on available wind/solar energies: power, hydrogen production, cost, and CO2 mitigation maps. Int. J. Hydrogen Energy 50, 487–501. doi:10.1016/j.ijhydene.2023.09.127
Nasser, M., and Hassan, H. (2024b). Feasibility analysis and Atlas for green hydrogen project in MENA region: production, cost, and environmental maps. Sol. Energy 268, 112326. doi:10.1016/j.solener.2024.112326
Norazahar, N., Khan, F., Rahmani, N., and Ahmad, A. (2024). Degradation modelling and reliability analysis of PEM electrolyzer. Int. J. Hydrogen Energy 50, 842–856. doi:10.1016/j.ijhydene.2023.07.153
Olabi, A. G., Abdelghafar, A. A., Baroutaji, A., Sayed, E. T., Alami, A. H., Rezk, H., et al. (2021). Large-vscale hydrogen production and storage technologies: current status and future directions. Int. J. Hydrogen Energy 46 (45), 23498–23528. doi:10.1016/j.ijhydene.2020.10.110
Ouchani, F., Jbaihi, O., Merrouni, A. A., Maaroufi, M., and Ghennioui, A. (2021). Yield analysis and economic assessment for GIS-mapping of large scale solar PV potential and integration in Morocco. Sustain. Energy Technol. Assessments 47, 101540. doi:10.1016/j.seta.2021.101540
Partidário, P., Aguiar, R., Martins, P., Rangel, C. M., and Cabrita, I. (2020). The hydrogen roadmap in the Portuguese energy system - developing the P2G case. Int. J. Hydrogen Energy 45 (47), 25646–25657. doi:10.1016/j.ijhydene.2019.10.132
Perraki, V., and Kounavis, P. (2016). Effect of temperature and radiation on the parameters of photovoltaic modules. J. Renew. Sustain. Energy 8, 013102. doi:10.1063/1.4939561
PNEC2030a (2023). National energy and climate plans 2021-2030. Available at: https://commission.europa.eu/energy-climate-change-environment/implementation-eu-countries/energy-and-climate-governance-and-reporting/national-energy-and-climate-plans_en#national-energy-and-climate-plans-2021-2030 (accessed on January 30, 2024).
PNEC2030b (2023). Portugal - draft updated NECP 2021-2030. Available at: https://commission.europa.eu/publications/portugal-draft-updated-necp-2021-2030_en (accessed on January 30, 2024).
PNSH2030 (2020). National Strategy for hydrogen. Available at: https://www.dgeg.gov.pt/en/transversal-areas/international-affairs/energy-policy/national-strategy-for-hydrogen/ (accessed on January 30, 2024).
PVGIS (2022). Photovoltaic geographical information system. Available at: https://re.jrc.ec.europa.eu/pvg_tools/en/#MR (accessed on January 30, 2024).
Rasul, M. G., Hazrat, M. A., Sattar, M. A., Jahirul, M. I., and Shearer, M. J. (2022). The future of hydrogen: challenges on production, storage and applications. Energy Convers. Manag. 272, 116326. doi:10.1016/j.enconman.2022.116326
Roest, E., Snip, L., Fens, T., and Wijk, A. (2020). Introducing power to-H3: combining renewable electricity with heat, water and hydrogen production and storage in a neighbourhood. Appl. Energy 257, 114024. doi:10.1016/j.apenergy.2019.114024
Rosenow, J. (2022). Is heating homes with hydrogen all but a pipe dream? An evidence review. Joule 6, 2225–2228. doi:10.1016/j.joule.2022.08.015
SAM (2024). System advisor model (SAM). Available at: https://sam.nrel.gov/ (accessed on January 30, 2024).
Schmidt, O., Gambhir, A., Staffell, I., Hawkes, A., Nelson, J., and Few, S. (2017). Future cost and performance of water electrolysis: an expert elicitation study. Int. J. Hydrogen Energy 42 (52), 30470–30492. doi:10.1016/j.ijhydene.2017.10.045
Silva, H. G., Abreu, E. F. M., Lopes, F. M., Cavaco, A., Canhoto, P., Neto, J., et al. (2020). Solar irradiation data processing using estimator MatriceS (SIMS) validated for Portugal (southern Europe). Renew. Energies 147 (1), 515–528. doi:10.1016/j.renene.2019.09.009
Silva, H. G., Conceição, R., Khan, M. A. H., Matthews, J. C., Wright, M. D., Collares-Pereira, M., et al. (2016). Atmospheric electricity as a proxy for air quality: relationship between potential gradient and pollutant gases in an urban environment. J. Electrost. 84, 32–41. doi:10.1016/j.elstat.2016.08.006
Silva, H. G., Conceição, R., Melgão, M., Nicoll, K., Mendes, P. B., Tlemçani, M., et al. (2014). Atmospheric electric field measurements in urban environment and the pollutant aerosol weekly dependence. Environ. Res. Lett. 9, 114025. doi:10.1088/1748-9326/9/11/114025
Tavares, A. M., Conceição, R., Lopes, F. M., and Silva, H. G. (2022). Development of a simple methodology using meteorological data to evaluate concentrating solar power production capacity. Energies 15 (20), 7693. doi:10.3390/en15207693
Tavares, A. M., Conceição, R., Lopes, F. M., and Silva, H. G. (2024). Influence of interannual variability on solar resource and its long-term effect on solar photovoltaic and concentrated power plants production capacity. (in preparation).
Touili, S., Bouaichi, A., Merrouni, A. A., Amrani, A., Amrani, A. E., Hassouani, Y. E., et al. (2022). Performance analysis and economic competiveness of 3 different PV technologies for hydrogen production under the impact of arid climatic conditions of Morocco. Int. J. Hydrogen Energy. 47, 31596–31613. doi:10.1016/j.ijhydene.2022.07.088
Touili, S., Merrouni, A. A., Azouzoute, A., El Hassouani, Y., and Amrani, A. (2018). A technical and economical assessment of hydrogen production potential from solar energy in Morocco. Int. J. Hydrogen Energy. 43, 22777–22796. doi:10.1016/j.ijhydene.2018.10.136
Touili, S., Merrouni, A. A., Hassouani, Y. E., Amrani, A., and Rachidi, S. (2020). Analysis of the yield and production cost of large-scale electrolytic hydrogen from different solar technologies and under several Moroccan climate zones. Int. J. Hydrogen Energy. 45, 26785–26799. doi:10.1016/j.ijhydene.2020.07.118
Umar, N., Bora, B., Banerjee, C., and Panwar, B. S. (2018). Comparison of different PV power simulation softwares: case study on performance analysis of 1 MW grid-connected PV solar power plant. Int. J. Eng. Sci. Invent. 7 (7), 11–24.
Valeria, J. C., Cervantes, I., Cervantes-Ortiz, C. A., and González-Huerta, R. A. (2022). Key aspects in quantifying massive solar hydrogen production: energy intermittence, water availability and electrolyzer technology. J. Clean. Prod. 371, 133550. doi:10.1016/j.jclepro.2022.133550
Yang, D. (2022). Estimating 1-min beam and diffuse irradiance from the global irradiance: a review and an extensive worldwide comparison of latest separation models at 126 stations. Renew. Sustain. Energy Rev. 159, 112195. doi:10.1016/j.rser.2022.112195
Yue, M., Lambert, H., Pahon, E., Roche, R., Jemei, S., and Hissel, D. (2021). Hydrogen energy systems: a critical review of technologies, applications, trends and challenges. Renew. Sustain. Energy Rev. 146, 111180. doi:10.1016/j.rser.2021.111180
Keywords: meteorological data, separation model, typical meteorological year, photovoltaic power plant, water electrolysis, hydrogen production, levelized cost of hydrogen
Citation: Silva HG, Alami Merrouni A, Touili S and Neto J (2024) Determination of photovoltaic hydrogen production potential in Portugal: a techno-economic analysis. Front. Energy Res. 12:1380543. doi: 10.3389/fenrg.2024.1380543
Received: 01 February 2024; Accepted: 28 June 2024;
Published: 18 July 2024.
Edited by:
Sudhakar Kumarasamy, Universiti Malaysia Pahang, MalaysiaReviewed by:
Abhishek Kumar Singh, University of Twente, NetherlandsMarttin Gundupalli Paulraj, University of Alberta, Canada
Copyright © 2024 Silva, Alami Merrouni, Touili and Neto. This is an open-access article distributed under the terms of the Creative Commons Attribution License (CC BY). The use, distribution or reproduction in other forums is permitted, provided the original author(s) and the copyright owner(s) are credited and that the original publication in this journal is cited, in accordance with accepted academic practice. No use, distribution or reproduction is permitted which does not comply with these terms.
*Correspondence: Hugo Gonçalves Silva, hgsilva@uevora.pt