
94% of researchers rate our articles as excellent or good
Learn more about the work of our research integrity team to safeguard the quality of each article we publish.
Find out more
ORIGINAL RESEARCH article
Front. Energy Res. , 22 July 2022
Sec. Process and Energy Systems Engineering
Volume 10 - 2022 | https://doi.org/10.3389/fenrg.2022.943339
This article is part of the Research Topic Internal Flow Mechanism of Modern Hydraulic Machinery View all 20 articles
In order to study the effect of alternating fluid–solid action on the dynamic characteristics of the runner of a reversible hydraulic turbine, a reversible hydraulic turbine model is used as the research object, and the two-way fluid–solid coupling method is used to iteratively calculate and analyze the fluid and structural equations to obtain the effect of the reversible hydraulic turbine on the runner under the two-way fluid–solid coupling action of the runner of the reversible hydraulic turbine under typical operating conditions. The results showed that under the influence of a high-speed water ring area under a certain working condition, the incoming flow direction forms a certain impulse angle with the blade, and under the joint action of the runner rotating at high speed, the vortex structure is generated in the blade area, and the speed change in the inlet area has a large random fluctuation, which is not conducive to the stability of the runner area and causes a strong pressure pulsation at the inlet. Under different working conditions, the runner stress area phenomenon is obvious, concentrated in the runner blade inlet side and the upper crown, lower ring connection. The maximum deformation region appears in the lower region of the middle of the blade inlet. The comparison of the modal analysis shows that the dynamic stress frequency caused by the dynamic interference is very unlikely to trigger the resonance of the runner.
With the proposal of the goal of “a carbon peak” in 2030 and the vision of “carbon neutralization” in 2060, green and low carbon has become synonymous with current industrial development (Li et al., 2021; Li et al., 2022). Hydraulic machinery with clean and efficient characteristics is attracting much attention. Reversible hydraulic turbine high head, ultra-high head, and other performance indicators become the need of industrial development. However, there is a complex coupling vibration problem of solid blades submerged in fluid. The internal turbulence excitation of the unit operation is intense, and the instability is very prominent. The runner is prone to fatigue fracture, which affects the safe and stable operation of the unit (Zhu et al., 2012; Wang et al., 2012) . Therefore, it is important to reveal the dynamics of hydraulic turbine rotor blades and establish a sound theoretical system (Zheng et al., 2016; Zhang et al., 2021; Yue et al., 2017).
Fluid–solid coupling mainly studies the fluid–solid interaction and the interference phenomenon of interaction. Researching so far, for different theoretical problems, many solutions have been developed. Some scholars use Newton’s method to study the overall solution of strong coupling with large displacement, which is expensive and time-consuming and not suitable for solving complex practical engineering problems (Heil, 2003; Wood et al., 2010). For example, using the boundary element-based method and considering the damping effect of the surrounding water flow, the deformation problem is studied using the time-domain FSI analysis method (Lee et al., 2014).
The high reliability of experimental studies in the research method is also essential to test the results of theoretical and numerical analysis. Many experts and scholars use advanced measurement techniques and equipment to observe deformation problems in fluid–solid coupling tests (Kalmbach and Breuer, 2013), and the remote sensing device composed of different damping caused by the vibration aspects are taken into account for in-depth exploration and research (Seidel et al., 2012). However, due to the diversity of water flow and the complexity of the internal structure of hydraulic machinery, direct observation of the internal coupling of hydraulic machinery seems impractical (Li et al., 2021), which hinders the research on the fluid–solid mechanism of hydraulic machinery by scientific researchers. With the development of computer technology and image processing technology, a new independent discipline computational fluid dynamics (CFD) is gradually derived on the basis of classical fluid dynamics and numerical calculation methods (Li et al., 2021). It replaces the continuous physical quantities in the time domain and space domain of the original physical field with the set of physical quantities of finite discrete points and applies certain principles and methods to establish algebraic equations about the relationship between physical quantities of discrete points. The approximate solution of the flow field is obtained by solving the algebraic equations. Due to its small investment, short time-consuming, and visualization of the internal flow characteristics of fluid machinery, CFD has quickly become an important means to study the cavitation characteristics of hydraulic machinery (Liang et al. 2020). Zheng et al. (2016). In order to study the influence of runner dynamic characteristics and internal flow field of cross-flow hydraulic turbine under fluid–solid coupling, the coupling solution of its solid domain and fluid domain is performed by using CFX and ANSYSAPDL, and compared with the measured values, and it is found that the coupling effect will reduce the hydraulic performance of the runner to some extent, which provides a reference for the blade transient response and runner hydraulic performance prediction in practical engineering. Hu et al. (2016) used the finite volume method for the fluid domain and the finite element method for the solid domain to study the fluid–solid coupling of the flexible airfoil under the action of water flow. It is found that the blade deformation caused by the fluid–solid coupling will lead to the change of the dynamic pressure frequency of the blade, and its airfoil impulse angle and water flow velocity will have some influence on the blade deformation. Zhu et al. (2012) took a mixed-flow hydraulic turbine as an example and carried out process simulation to calculate the blade stress distribution, based on which fatigue analysis was performed and optimized to reduce the maximum stress to improve the fatigue life. Wang et al. (2012) predicted the fatigue life of a hydraulic turbine runner during start-up, steady operation, and stopping and optimized the leaf root area where the stress is concentrated to improve the fatigue life.
Therefore, this study takes a reversible hydraulic turbine runner as the research object and analyzes the influence of alternating fluid–solid coupling on the dynamic characteristics of the runner blade under the variable operating conditions of the reversible hydraulic turbine and obtains the conclusions related to the stress, strain, and vibration of the runner area. This study provides a theoretical reference for the design of reversible hydraulic turbine blades.
The object of this study is a reversible hydraulic turbine model, and the overflow components consist of a worm shell, fixed guide vane, movable guide vane, runner, and tailpipe, and the schematic diagram is shown in Figure 1, and the specific parameters are shown in Table 1.
In order to ensure that the numerical calculation results are feasible and reliable, this meshing is performed using the sub-function ICEM of commercial software ANSYS for full flow channel hexahedral meshing. In order to eliminate the errors arising from the number of meshes, mesh-independence verification is required. Seven different sets of meshes are generated by choosing different mesh scales. The calculation conditions (a0 = 33 mm, Q11 = 0.66 m3/s, and n11 = 70.8 r/min) are taken, and the constant calculation is performed. By comparing the efficiency characteristics, it is found that the efficiency basically does not change with the increase of grid number, and the runner blade y + under this working condition meets the turbulence model requirements, and finally the grid quality of minimum 0.4 or more is adopted, and the total number of grids is about 6.1 million for calculation. The mesh quality is shown in Table 2 the finite element mesh of the solid region is generated in transient structure, and the number of mesh cells is 289,230. The mesh division results are shown in Figure 2.

FIGURE 2. Schematic diagram of the partial grid of the flow field and structural field of the reversible turbine. [(A) Local grid schematic (B) Reversible turbine runner structure field grid].
In this study, the model reversible hydraulic turbine with movable guide vane a0 = 33 mm was selected for numerical calculation reliability verification. Five operating points are selected as shown in Table 3, for which constant numerical calculations are performed. Figure 3 shows the reversible hydraulic turbine experimental setup. The results of the numerical calculations are converted to unit speed and unit flow rate with the following equations:
where n11 is the unit speed (rpm), Q11 is the unit flow rate (L/s), n is the speed (rev/min), Q is the flow rate (L/s), H is the working head (m), and D2 is the nominal diameter of the runner (m).
Q11 and n11 were obtained by conversion, and then the n11–Q11 characteristic curve was plotted. The n11–Q11 characteristic curve obtained by the conversion is compared with the test curve, and the results are shown in Figure 4. Through comparison, the two have a high degree of agreement and the error value is kept near 4%, which meets the requirements of engineering research. Figure 5 shows the comparison of efficiency for different working conditions, and the difference between the experimental and calculated efficiency is around 1.4%. Therefore, the model selected for this numerical calculation has high reliability.
The pressure pulsations are measured over all operating ranges of turbine operating conditions and at the cavitation factor of the power plant unit. It is necessary to measure the amplitude and frequency of pressure pulsations between the worm shell, runner, and guide vane as well as between the top cover and the upper crown of the runner. The sensor arrangement should be located where the maximum pressure pulsation amplitude can be measured. The pressure pulsations are recorded and analyzed. Spectrum analysis of the collected data should be performed to determine the main frequency and amplitude of the pressure pulsation. ΔH is used to represent the degree of pressure pulsation in the turbine/pump, and H is the amplitude of the turbine/pump, and H is the turbine head/pump head, which is the characteristic amplitude. According to the IEC60193-1999 “hydraulic turbine, storage pump, and pump turbine model acceptance test,” 18 characteristic amplitude values using statistics were recorded, and given probability range (for example, 97%) values beyond this probability range will be ignored, so the pressure pulsation peak is derived by the confidence method, and the confidence level is consistent with the model test as far as possible. Since the turbine pressure pulsation test is performed in the full range of operating conditions, the corresponding pressure pulsation amplitude is 97% of the peak confidence level. Each operating point and each measurement signal were analyzed, and the test results are shown in Table 4.
Reversible turbines have frequent changes under operating conditions and complex and variable flow conditions. The application of SST k-w in ANSYS can accurately capture surface vortices and near-wall flow, which is applicable to a wide range of applications (Liang et al., 2020). Therefore, this turbulence model is selected for numerical calculation. The inlet and outlet pressures are 404300 pa and 101325 pa, respectively. Interface coupling and SIMPLEC velocity pressure coupling algorithm are used to solve the time-averaged N-S equation. The residual value is set to 10–6, and the iteration time step is set to 10−4s. The steady-state numerical calculation of the whole flow field of pump turbine is carried out first, and the convergent steady-state result is taken as the initial value of transient calculation. During transient numerical calculation, the time step is set to 3.867 × 10⁻⁴ s, and 120 steps are required for one rotation, and each time step is rotated by 3°. In terms of a solid domain, normal temperature clean water is used as the medium, the density is 1 g/cm3, and the viscosity is 1cp; the model material of pump turbine runner is structural steel, the density is 7850kg/m3, and the elastic modulus is 166.67 Gpa. Poisson’s ratio is 0.3. Fixed constraints are imposed on the central part of the runner, the centrifugal force is applied through the angular velocity counterclockwise around the z-axis, the gravity direction is the negative direction of the z-axis, and the fluid domain acts on the water pressure of the structure by increasing the fluid–structure coupling surface.
For the bi-directional fluid–solid coupling study of hydraulic turbine conditions of reversible hydraulic turbine, dynamic treatment of the runner basin is required, so the dynamic mesh update method of spring smoothing and local reconstruction is needed for the runner area mesh. The fluid domain and the solid domain are iterated several times, and the node non-boundary in the computational domain undergoes relative displacement changes and reaches a new equilibrium. The spring smooth method is based on the principle given in Eqn. 3. The original is replaced by the newly generated mesh, backward to the newly generated mesh difference.
where
When the reversible turbine is operating under the optimal working condition, the direction of water flow at the inlet of the runner is close to its inlet angle, and the relative resistance of water flow becomes smaller. But in the case of partial working condition Q5 (larger unit speed and smaller flow rate), the water flow state is relatively complex, and the water flow and blade placement angle will produce a rush angle, which will cause the effective flow rate to be reduced, forming a more obvious high-speed water ring phenomenon. Not only the phenomenon, but it will also cause this chaotic water flow state wave to the rotor blade. From the blade inlet section, vortex development can be seen in Figure 6, in the impulse angle, stronger centrifugal force and blade coupling under the composite effect, blade working surface, and blade between the formation of unstable vortex structure. The existence of the vortex causes the instability of the water flow, making the blade by the water repeatedly hit the intensity of the increase; cavitation performance due to the vortex generation also produces a certain degree of decline. There is a separation flow–complex flow where chaotic water flow filled in the leafless area and between the rotor blades.
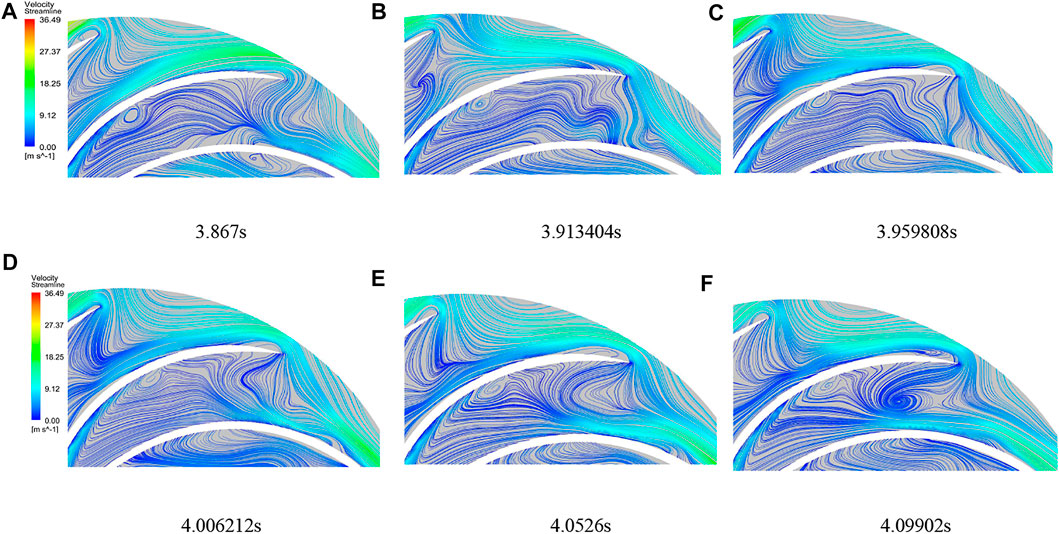
FIGURE 6. Blade inlet section position flow line diagram. [(A–F) are the flow diagrams of the inlet area of the runner at different times].
As the velocity distribution of the blade inlet section is extremely uneven, in order to study the impact of the velocity of the incoming impulse angle on the rotor blade inlet, the velocity extraction line is established in the vertical direction of the blade profile tangent line, and the incoming impulse angle is triangulated according to the fluid flow velocity. Two runner blade inlet velocities are selected for calculation and analysis, as shown in Figure 7. There is a certain impulse angle in the blade under this condition; at the same time, the blade inlet velocity change law analysis found: when a regional velocity fluctuation of the blade is larger, there is an obvious trough; when two regional velocity fluctuations are smaller, in this region, there is no more obvious peak and trough. Not only that but also both did not appear at the same time point to increase or decrease the same or common peak and valley values, that in the runner high-speed rotation, no leaf area and blade between the existence of a large speed difference and strong static and dynamic interference make the blade inlet area speed and direction change fluctuations, and there is strong randomness. This effect on the blade inlet area of the blade will not only produce a relatively larger force and ensure the safety of the runner from producing harm but also have the possibility of partial resonance.
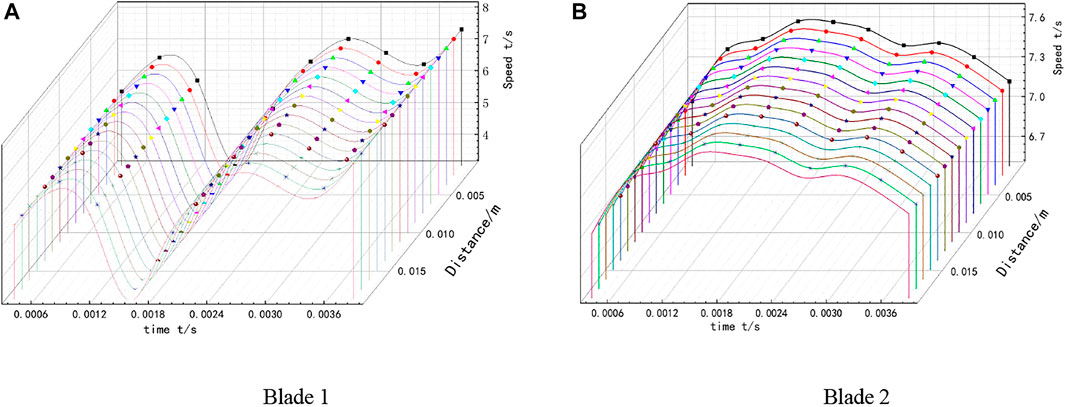
FIGURE 7. Variation of blade inlet speed with time. [(A,B) are the velocity variation curves of different guide vane inlet areas].
The Q2 and Q5 working conditions were selected for the non-constant pressure pulsation analysis. In order to obtain the pressure changes in the flow field, three fluid domain measurement points are set for the bi-directional fluid–solid coupling rotor blade area, and the monitoring points are shown in Figure 8.
Figure 9 shows the frequency domain waterfall plots of pressure pulsations at each monitoring point on the blade area of the runner area under the two operating conditions of the turbine under bi-directional fluid–solid coupling calculation. The pressure pulsations are mostly dominated by low frequencies, as shown in Figure 9A. The first main frequency reaches 78.7 at 5fn, and the second main frequency reaches 51.4 at 13fn, which is 34.6% lower than the first main frequency amplitude. Near the inlet of the rotor, i.e., near the bladeless area, there is a strong dynamic interference, and the branch water flow coming out through the movable guide vane gathers in this part and then diverges again after the rotor blades. Therefore, the flow pattern here is complex, with a large number of vortices and more violent pressure pulsation. When the two-way fluid–solid coupling is considered, the slight deformation of the runner blade area also produces a certain degree of disturbance to the flow field, which intensifies the pressure pulsation of the reversible turbine and has a certain influence on the fundamental frequency of the pressure pulsation, so the pressure pulsation amplitude in this part of 25fn–60fn produces some fluctuation phenomenon, as shown in Figure 9B. Under Q5 working condition, compared with Q2 working condition, the pressure pulsation in the first 15fn is much intense, the first main frequency reaches 99.4 at 3fn, the second main frequency is 38.6 at 7fn, and the main frequency increases by 26.3%. Compared with Q2 working condition, the flow rate in this working condition is reduced but the speed is relatively high, the water flow into the rotor is much complicated, and the velocity flow line distribution is extremely uneven, which increases the flow field. The random and instability of the flow field, which will make the runner blade under this working condition by the water pressure to become larger, are not conducive to the safe operation of the runner blade. ZL1 monitoring point in the two working conditions of the pressure pulsation amplitude is significantly greater than the other two monitoring points and there are strong fluctuations. ZL2 is in the middle of the blade position, the water flow channel is reduced, the effective overflow is less, there is a structural steel blade before and after the restraint of water movement, and the water in the front blade and after the reaction force of the blade there is a certain amount of mutual resistance to the filling situation. ZL3 resistance to the filling effect exists and is in the connection with the tailpipe, and the pressure difference between the front and rear is larger, so the pressure pulsation of the monitoring point will be less than that of ZL1. Pressure pulsation will also be less than that of the ZL1 situation.
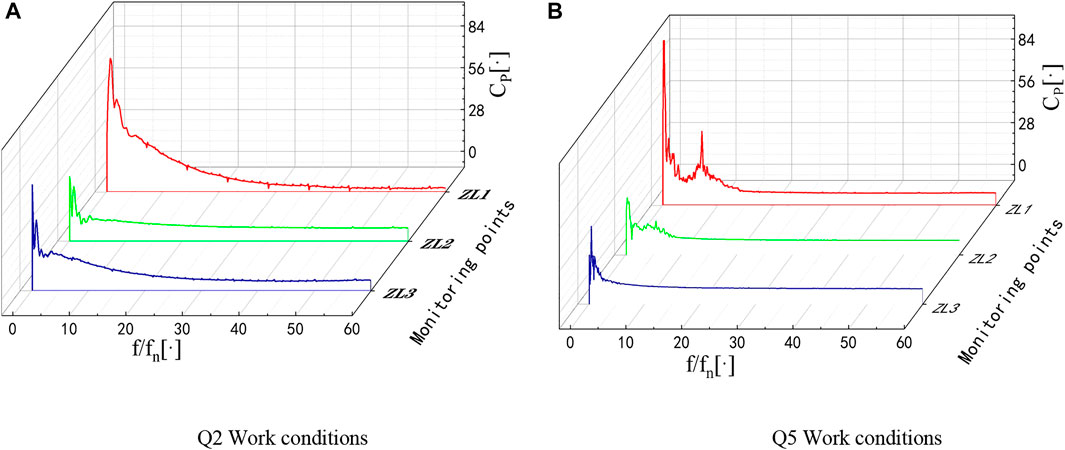
FIGURE 9. Reversible turbine runner area pressure pulsation frequency domain waterfall diagram. [(A,B) are Q2 and Q5 working conditions respectively].
Influenced by many secondary flows, different moments under the blade stress distribution have changed, there is an uneven stress distribution in the blade inlet, the stress area is concentrated in the blade inlet in the front of the high-pressure area, and the maximum stress in the blade is near the lower ring connection place, as shown in Figure 10. Figure 11 shows the stress and deformation diagram of the runner under Q2 working condition. Figure 12 shows the maximum stress and deformation fluctuation curve under this condition. So, in the upper ring under the crown of the T-shaped connection, a part of the stress exists leading to abrupt change of the situation. Due to the periodically repeated action of the water in the runner blade, the blade formed a different degree of stress distribution and selected different moments under the fluid on the blade surface as maximum stress, taken as the deformation situation for analysis. The 1 S results were selected to perform the analysis. Figure 11 shows the two working conditions of the runner blade stress; the blade working surface stress distribution trend from the inlet side to the middle of the blade gradually reduced, and this pressure distribution trend is in line with the hydraulic machinery blade pressure law. In the Q2 working condition, the runner blade stress presents “a C”-type distribution, the stress is concentrated in the upper and lower side of the blade inlet, the middle stress is small, and the blade tail end stress tends to zero. The maximum stress in 0.1–0.3 s changes drastically and then appears as slight up and down fluctuations. For the blade deformation, the inlet position directly impact gravity, centrifugal force, and high-pressure high-speed fluid on the thin blade, and there is a big stress difference in the middle and the two ends; the middle of the blade inlet has no restraint, making deformation maximum parts concentrated in the middle of the blade; because of the model structure material reasons, the overall deformation variable is small. The maximum deformation is only about 0.01 mm, and the trend of change and the maximum stress changes are roughly the same but there is a certain hysteresis. The deformation in the middle is the largest and gradually spreads to the surrounding area and gradually decreases.

FIGURE 10. Local enlargement of stress concentration area. [(A,B) are local enlargements of stress concentration areas at different locations].

FIGURE 11. Stress and deformation diagram under the Q2 working condition. [(A,B) are the stress and deformation diagrams for this working condition].
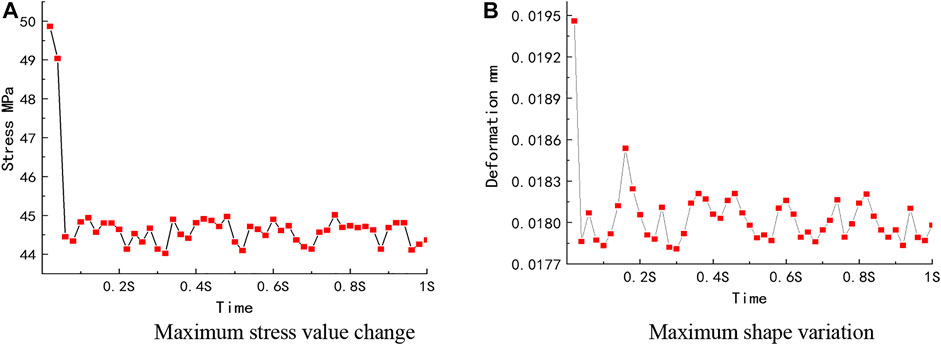
FIGURE 12. Maximum stress and deformation change curve under Q2 working condition. [(A,B) are the maximum stress and deformation value fluctuation curves under this working condition].
Figure 13 shows the stress and deformation diagram of the runner under Q5 working condition. Figure 14 shows the maximum stress and deformation fluctuation curve under this condition. Under the Q5 working condition, the runner blade stress is a “D”-type distribution, that is, the stress is concentrated in the middle of the blade inlet and the upper and lower side of the stress is small, but the maximum stress part is still in the lower side of the blade and the same will undergo sudden change of stress situation. The stress distribution with the time change is not big, but this condition stresses maximum value change more strongly, changes amplitude more than 15%, and in the subsequent time the maximum stress value in 55 MPa fluctuates up and down; the stress value is greater than that of Q2 condition. The deformation position is concentrated in the middle of the blade inlet, but the overall variation is larger than that of the Q2 condition, and the maximum value of deformation shows a large and small phenomenon, which is not conducive to the safe operation of the reversible hydraulic turbine.

FIGURE 13. Stress and deformation diagram under the Q5 working condition. [(A,B) are the stress and deformation diagrams for this working condition].
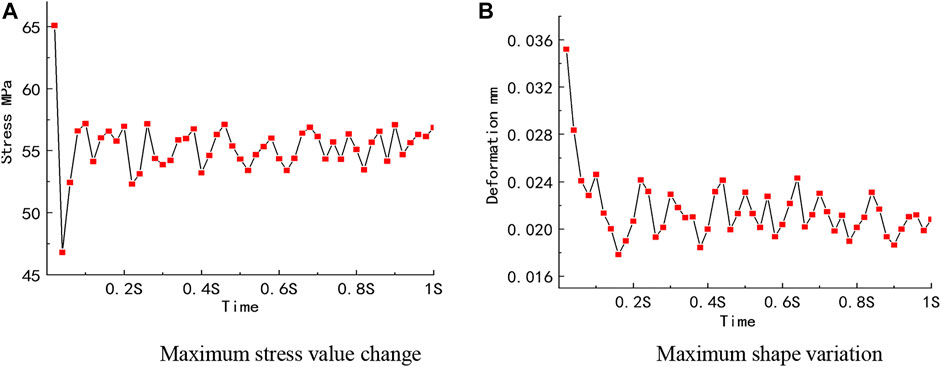
FIGURE 14. Maximum stress and deformation change curve under Q5 working conditions. [(A,B) are the maximum stress and deformation value fluctuation curves under this working condition].
In order to obtain the inherent frequencies of the reversible turbine runner, the existing models were analyzed in dry mode, prestressed mode, and wet mode for the sixth-order nodal modal analysis, respectively. In Figure 15, it can be seen that the difference between the dry mode and the dry mode vibration frequency under pre-stress in the rotor blade area is very small, and to some extent, the rotor blade is not affected by the pre-stress on its fixed frequency. The overall vibration trend increases with the increase of the order. The first- and second-order and the fifth- and sixth-order vibration frequencies have similar regular changes. Due to the additional mass force of the water medium in the wet mode and the damping diffusion effect, the vibration frequency of the wet mode starts to differ from the dry mode in the fourth order, and the increasing rate of frequency in the wet mode becomes smaller by about 5.1%. Because the influence of water on the vibration becomes larger in the higher-order cases, the frequency difference is about 11% at the sixth order, which has a tendency to increase gradually.
Since the study involves the submerged reversible turbine runner, the wet mode analysis is more suitable for the actual operating environment of the reversible turbine runner so that the numerical calculation results are closer to the actual situation. Therefore, it is necessary to further analyze the modal vibration pattern of the reversible hydraulic turbine runner under wet mode. Figure 16 shows the first six orders of the wet mode vibration pattern of the reversible hydraulic turbine runner. The first- and second-order formations are left–right and front–back oscillations, respectively. The deformation is symmetrically distributed, and the maximum deformation is at the farthest point of the runner oscillation. The third-order vibration pattern is rotation around the axis left up, and the largest variable is located at the lower ring. The fourth-order model is up-and-down vibration along the central axis, the deformation is centrally symmetric at the main axis, and the largest deformation is at the upper crown of the runner. The fifth- and sixth-order mode vibration pattern is more similar, producing larger bending deformation at the center, with smaller deformation at the upper part, and the larger deformation is concentrated at the upper and lower crown and lower ring areas. The first-, second-, third-, and fourth-order modal vibration patterns are all vibration phenomena of the whole structural part of the runner, while the fifth- and sixth-order modal vibration patterns are bending deformation at a certain position. Since the connection between the upper crown and the main shaft is specified as a fixed constraint, the deformation in the area near it is low. The larger deformation area is concentrated at the edge of the upper crown and lower ring. The deformation of the runner blade is relatively uniform and decreases gradually along the runner from the inlet. The stress concentration area is distributed near the connection of the runner blade with the upper crown and lower ring, which is easy to produce fatigue damage and creates a hidden danger to the safety of the reversible hydraulic turbine.
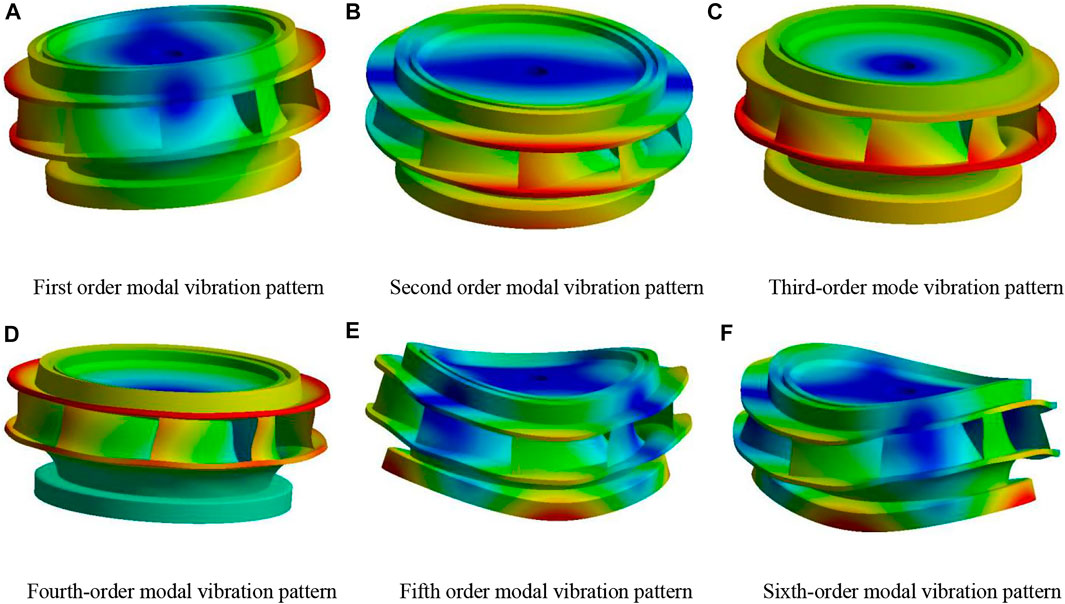
FIGURE 16. Sixth-order modal vibration pattern of the runner of a reversible hydraulic turbine. [(A–F) are the first, second, third, fourth, fifth and sixth order mode vibration patterns respectively].
Table 5 shows reversible hydraulic turbine runner’s first six orders of vibration frequency comparison and hydraulic excitation force–frequency comparison. The hydraulic turbine speeds to get the runner rotational frequency fn were 17.2 Hz and 21.4 Hz, while the blade passing frequencies 9fn were 154.8 Hz and 192.648 Hz. The guide vane passing frequencies 20fn were 344 Hz and 428 Hz. The main frequencies of pressure pulsation at the internal flow field monitoring points are 3fn, 5fn, 7fn, and 13fn. Compared with the inherent frequency of the runner, there is a big difference. The minimum residual (guide vane passing frequency 20fn) is also at 46.03%, far exceeding the safety residual threshold of 20%, so the possibility of a resonance phenomenon of dynamic stress is very small.

TABLE 5. Comparison of the first six orders of vibration frequency of the runner of reversible hydraulic turbine.
1 Under high-speed and small flow conditions by the influence of high-speed water ring region, there is a large random fluctuation of speed change in the inlet region. The vortex structure is generated in the blade area, which is not conducive to the stability of the runner area, and the gradual development of the vortex also reduces the blade cavitation performance, and there is a certain safety risk.
2 In the case of considering the two-way fluid–solid coupling, the pressure pulsation in the fundamental frequency region exacerbates the pressure pulsation fluctuations. The blade inlet is influenced by the pressure pulsation of the static and dynamic interference in the bladeless area, which gradually decreases along the flow path direction. The water flow state is more complex under Q5 conditions, and the pressure pulsation is high and unstable, which increases the risk of runner blade fatigue.
3 Through the two-way fluid–solid coupling analysis of the runner area, it can be seen that the hydraulic turbine stress is concentrated at the inlet of the runner blade and distributed in the area near the connection between the runner blade and the upper crown and lower ring; the maximum deformation is concentrated in the middle of the blade, which is prone to fatigue damage.
4 Using the acoustic-solid coupling technique, the inherent frequencies of the runner in the three cases were obtained and compared with the pulsation frequencies in the main frequency region of the blade passage frequency, guide vane passage frequency, and its pressure pulsation analysis, and it was found that the difference was large and the possibility of resonance was small.
The original contributions presented in the study are included in the article/Supplementary Material; further inquiries can be directed to the corresponding author.
LX wrote and improved the manuscript. QL provided guidance and advice on writing the manuscript. ZL provided guidance on the analysis of the study. ZL provided guidance on handling the test apparatus, and GX provided guidance on the tests.
This study was supported by the National Natural Resources Foundation of China (52066011) under the project name “Study on the effect of the change of movable guide vane wing shape on the internal flow characteristics of water pump turbine.”
The authors declare that the research was conducted in the absence of any commercial or financial relationships that could be construed as a potential conflict of interest.
All claims expressed in this article are solely those of the authors and do not necessarily represent those of their affiliated organizations, or those of the publisher, the editors, and the reviewers. Any product that may be evaluated in this article, or claim that may be made by its manufacturer, is not guaranteed or endorsed by the publisher.
Heil, M. (2003). An Efficient Solver for the Fully-Coupled Solution of Large-Displacement Fluid-Structure Interaction Problems in Print in: Computer Methods in Applied Mechanics and Engineering (January 2003) [J]. (Preprint submitted to elsevier sciencecomputer methods in applied mechanicsandengineering).
Hu, S., Lu, C., and He, Y. (2016). Fluid-structure Interaction Simulation of Three-Dimensional Flexible Hydrofoil in Water Tunnel. Appl. Math. Mech.-Engl. Ed. 37 (1), 15–26. doi:10.1007/s10483-016-2011-9
Kalmbach, A., and Breuer, M. (2013). Experimental PIV/V3V Measurements of Vortex-Induced Fluid-Structure Interaction in Turbulent Flow-A New Benchmark FSI-PfS-2a. J. fluids Struct. 42 (42), 369–387. doi:10.1016/j.jfluidstructs.2013.07.004
Lee, H., Song, M-C., Suh, J-C., and Chaung, B. J. (2014). Hydro-elastic Analysis of Marine Propellers Based on a BEM-FEM Coupled FSI Algorithm [J]. Int. Nav. Archit. Ocean Eng. 6 (3), 562-577. doi:10.2478/ijnaoe-2013-0198
Li, Q., Chen, X., Cai, T., Guo, Y., and Wei, M. (2021). Study on the Influence of Non-synchronous Guide Vanes on Unit Characteristics under Different Arrangements[J]. J. Sol. Energy 42 (08), 23–31. doi:10.19912/j.0254-0096.tynxb.2019-0769
Li, W., Li, Z., Qin, Z., Yan, S., Wang, Z., and Peng, S. (2022). Influence of the Solution pH on the Design of a Hydro-Mechanical Magneto-Hydraulic Sealing Device. Eng. Fail. Anal. 135, 106091. doi:10.1016/j.engfailanal.2022.106091
Li, Z., Cheng, C., Peng, S., and Ma, B. (2021a). Theoretical Analysis of Entropy Generation at the Blade Interface of a Tubular Turbine under Cooperative Conditions [J]. Front. Energy Res. 9. doi:10.3389/fenrg.2021.788416
Li, Z., Li, W., Li, W., Wang, Q., Xiang, R., Cheng, J., et al. (2021b). Effects of Medium Fluid Cavitation on Fluctuation Characteristics of Magnetic Fluid Seal Interface in Agricultural Centrifugal Pump. Int. J. Agric. Biol. Eng. 14 (6), 85–92. doi:10.25165/j.ijabe.20211406.6718
Liang, W., Huang, H., Wu, Z., Dong, W., Yan, X., and Liu, Y. (2020). Analysis of Internal Flow Field and Unidirectional Fluid-Structure of Crown Cavity Structure on Mixed-Flow Turbine [J]. J. Hydraulic Eng. 51 (11), 1383–1392+1400.
Seidel, U., Hübner, B., Löfflad, J., and Faigle, P. (2012). Evaluation ofRSI-Induced Stressesin Francis Runners [J]. Iop Conf. Ser. Earthandenvironmental Sci. 15 (5), 52010. doi:10.1088/1755-1315/15/5/052010
Wang, X. F., Li, H. L., and Zhu, F. W. (2012). The Calculation of Fluid-Structure Interaction and Fatigue Analysis for Francis Turbine Runner [J]. Iop Conf. Ser. earth Environ. Sci. 15 (5), 52014. doi:10.1088/1755-1315/15/5/052014
Wood, C., Gil, A. J., Hassan, O., and Bonet, J. (2010). Partitioned Block-Gauss-Seidelcoupling for Dynamic Fluid-Structure Interaction [J]. Comput. Struct. 88 (23-24), 1367–1382. doi:10.1016/j.compstruc.2008.08.005
Yue, Z., Zheng, Y., Kan, K., Chen, Y., Li, D., and Zang, W. (2017). Turbine Strength and Modal Analysis of Reversible Hydraulic Turbine in a Pumped Storage Power Station Based on Fluid-Structure Interaction [J]. Hydropower Energy Sci. 35 (02), 181–184+152.
Zhang, J., Song, H., Zhang, F., Cai, H., Lai, L., and Hong, Q. (2021). Rotor Strength and Modal Analysis of Water Turbine with Shunt Vane [J]. J. Drainage Irrigation Mach. Eng. 39 (10), 981–986.
Zheng, X., Wang, L., and Weng, K. (2016). Dynamic Characteristics Analysis of Cross-Flow Turbine Based on Bidirectional Fluid-Structure Interaction [J]. Trans. Chin. Soc. Agric. Eng. 32 (04), 78–83.
Keywords: water pump turbines, bidirectional fluid–structure interaction, modal analysis, eddy, vibration
Citation: Xin L, Li Q, Li Z, Xie G and Wang Q (2022) Analysis of Runner Dynamics of Reversible Hydraulic Turbine by Alternating Fluid–Solid Action. Front. Energy Res. 10:943339. doi: 10.3389/fenrg.2022.943339
Received: 13 May 2022; Accepted: 15 June 2022;
Published: 22 July 2022.
Edited by:
Kan Kan, College of Energy and Electrical Engineering, ChinaReviewed by:
Xiuli Mao, Northwest A&F University, ChinaCopyright © 2022 Xin, Li, Li, Xie and Wang. This is an open-access article distributed under the terms of the Creative Commons Attribution License (CC BY). The use, distribution or reproduction in other forums is permitted, provided the original author(s) and the copyright owner(s) are credited and that the original publication in this journal is cited, in accordance with accepted academic practice. No use, distribution or reproduction is permitted which does not comply with these terms.
*Correspondence: Qifei Li, lqfy@lut.cnmailto:lqfy@lut.cn
Disclaimer: All claims expressed in this article are solely those of the authors and do not necessarily represent those of their affiliated organizations, or those of the publisher, the editors and the reviewers. Any product that may be evaluated in this article or claim that may be made by its manufacturer is not guaranteed or endorsed by the publisher.
Research integrity at Frontiers

Learn more about the work of our research integrity team to safeguard the quality of each article we publish.