 Yangyang Wei
 Yuhui Shi1
95% of researchers rate our articles as excellent or good
Learn more about the work of our research integrity team to safeguard the quality of each article we publish.
Find out more
ORIGINAL RESEARCH article
Front. Energy Res. , 11 January 2023
Sec. Process and Energy Systems Engineering
Volume 10 - 2022 | https://doi.org/10.3389/fenrg.2022.1026886
This article is part of the Research Topic Design, Simulation and Optimization of Hydraulic Machinery, Volume II View all 9 articles
The unsteady flow characteristics of pump as hydraulic turbine play a vital role in its safe and stable operation, while the ultra-low specific-speed centrifugal pump may face more stability problems due to the limitations of its flow conditions under the turbine working condition. Therefore, in this study, the unsteady characteristics of an ultra-low specific-speed centrifugal pump under turbine conditions are studied using a numerical simulation method, and the numerical simulation is verified using an experimental method. Based on the hydraulic losses of each flow passage component, the energy characteristics of pump as turbine (PAT) are established, and the distribution pattern of total pressure fluctuation in the turbine is studied. The results show that the rotor–stator interaction between the impeller and the tongue makes the hydraulic performance and the internal flow field change periodically. The pressure fluctuation intensities at the tongue, blade inlet edge, and balance hole are large, and the total pressure fluctuation in the three areas is intense in space and time. The internal flow characteristics at typical blade positions show that the secondary flow phenomena such as separation flow and wake flow near the tongue make the pressure gradient larger, which is an important influence mode of the rotor–stator interaction. This study provides a reference and guidance for the unsteady study of low specific-speed PAT.
Due to the asymmetry of the volute and the interaction between the tongue and the impeller, the low specific-speed centrifugal pump exhibits extremely complex unsteady three-dimensional flow characteristics in both pump and turbine conditions. Scholars have never stopped researching pumps and pump as turbine (PAT) (Ebrahimi et al., 2020; Kandi et al., 2021; Zhou et al., 2022). The research results of centrifugal pumps are relatively mature and systematic, while those of PAT are relatively lacking. With the intensification of global climate problems in recent years, PAT has become one of the research hotspots in the field of hydraulic machinery and energy-saving energy storage (Balacco et al., 2021; Cao et al., 2021; El-Emam et al., 2022).
Based on the gradient optimization algorithms and incomplete sensitivity methods (Derakhshan et al., 2008), Derakhshan et al. (2009) redesigned the shape of the PAT radial impeller blade and obtained an increase in the torque, head, and efficiency by 4.258, 1.97, and 2.2%, respectively. Derakhshan and Nourbakhsh (2008) developed a new method for determining the best efficiency point (BEP) for a PAT. The head and flow values obtained by this method agree well with the experimental data. For small hydropower projects, Agarwal (2012) concluded that PAT is a relatively economical engineering solution, and the optimal head and flow range of pump-turbine are clarified. Yang et al. (2012) proposed a correlation formula for the hydraulic performance parameters of the PAT by analyzing and summarizing the experimental data and compared it with the existing empirical formulas. In addition, many scholars summed up and deduced the prediction relationship of hydraulic performance by summarizing the experimental data and theoretical analysis, which can be used to predict the hydraulic performance of the PAT within a certain specific speed range (Tan and Engeda, 2016; Barbarelli et al., 2017; Rossi and Renzi, 2017; Huang et al., 2018; Zhang et al., 2021a; El-Emam et al., 2021). With the development of computer technology and fluid theory, a numerical simulation based on computational fluid dynamics (CFD) has been widely used in fluid machinery research. Yang et al., (2021) used CFD to study the effect of blade fillets on PAT performance and found that the efficiency was improved by 8.09% at 1,500 rpm. Adu et al. (2021) studied the effect of splitter blades on the performance of PATs under different rotational speeds and flow rates. The maximum deviations of efficiency between numerical data and experimental values under different working conditions were 5.6 and 2.6%, respectively. Wang et al. (2017) compared impellers with backward bent blades; the efficiency of the forward bent blades was increased by 7.93%, and the high efficiency zone was widened. Based on the theoretical model, Liu et al. (2019) proposed an iterative flow-based method to determine the optimal efficiency point in PAT.
Moreover, the operation stability of PAT is closely related to pressure fluctuations and unsteady flow patterns. Zhang et al. (2019) and Binama et al. (2021) studied the formation mechanism of the PAT flow structure through numerical simulation. They found that the flow field and pressure field were both distorted as the flow rate decreased. The increase of the impeller speed can weaken the pressure pulsation level at high flow rates. Morabito et al. (2021) studied the effect of the volute tongue on the hydraulic performance of the PAT based on the experimental data. The tongue interfered with the flow at the runner inlet and produced local distortion in the velocity field, thereby reducing the hydraulic performance of the PAT. Based on the calculation results of the internal flow field obtained by CFD simulation, a multivariate regression method was used to establish a correlation model between the geometric parameters of the tongue and the hydraulic performance of PAT. Liu and Lei (2018) found that when the mixed-flow pump worked as turbine, the existence of the tip clearance induced the tip leakage flow that interacts with the main flow, resulting in unstable flow and complex vortex structures in the channel.
To sum up, the research on PAT is mostly concentrated on mixed-flow pumps and other medium and high specific-speed pumps and mainly focuses on the performance prediction and fluctuations in internal and external characteristics However, there is still a lack of research on the evolution law of impeller inlet velocity and energy characteristics in ultra-low specific-speed centrifugal pumps under turbine condition. In this study, the evolution law of unsteady flow field in an ultra-low specific-speed centrifugal pump as turbine and the unsteady variation law of impeller inlet velocity are studied, and the evolution mechanism of the flow field in low-power hydraulic PAT is revealed, which provides theoretical guidance for the improved design and development of design method of low-power hydraulic PAT.
The basic external characteristic parameters of centrifugal pumps include the head and efficiency. The dimensionless head coefficient and efficiency are shown in Eq. 1 and 2, respectively:
where H represents the head, m; u2 is the circumferential velocity of the impeller outlet, m/s; P1 and P2 are the inlet and outlet total pressure, Pa; Ws is the shaft power, W; and Q is the flow rate, m3/s.
Another vital parameter is pressure fluctuation, and the average value of pressure fluctuation is calculated as follows:
Pressure fluctuation intensity is the variance coefficient of pressure fluctuation:
where
The dimensionless pressure fluctuation coefficient is as follows:
where CP is the dimensionless pressure fluctuation coefficient, and ρ is the density of the medium, kg/m3.
To study the variation of external characteristics, the total pressure difference can be used to calculate the hydraulic loss of the flow components. The total pressure coefficient of each flow passage component is defined as follows:
Total pressure coefficient of the volute:
Total pressure coefficient of the impeller:
where the subscripts w and r represent the volute and impeller, respectively; out and in represent the outlet and inlet of overflow components; and tp represents the total pressure. Due to the work of the impeller, the total pressure difference between the inlet and outlet of the impeller is not equal to the hydraulic loss.
The dimensionless coefficient of impeller work is defined as follows:
where A2 is the impeller outlet area.
The power coefficient of impeller passage is Wc, and it is calculated as follows:
where MP and MS represent the fluid torques on the pressure side (PS) and suction side (SS) of the flow channel, respectively.
In this study, an ultra-low specific-speed centrifugal pump reverses as a hydraulic turbine. Under the pump condition, the designed flow Qd and head H are 10 m3/h and 80 m, respectively, and the rotational speed n and the specific rotational speed ns are 2,900 rev/min and 21, respectively. The rotational speed of the turbine condition is the same as that of the pump condition, and the specific speed is calculated using Eq. 10.
To accurately calculate the working performance of PAT, this study numerically simulates the flow structure in the whole flow field. The calculation domain of the model centrifugal pump includes five parts: inlet pipe, impeller, pump chamber, volute, and outlet pipe. The computing domain is meshed using ANSYS ICEM, and the hexahedral structured grid is adopted for the computing domain. In addition, the blade surface and volute tongue are locally refined.
The inlet boundary condition is specified as the pressure inlet, and the outlet adopts the opening condition to prevent the backflow problem with the reference pressure set as 1 atm. The rotational speed under the turbine condition is the same as that under the pump condition. A smooth non-slip wall is selected for all walls, and a transient rotor–stator is selected for the rotor–stator interface under unsteady conditions. The time step of the unsteady calculation is equal to the time that the impeller rotates 1°. The finite volume method based on the finite element method is adopted, in which the convection term is discretized by a high-resolution scheme. This scheme combines the advantages of upwind difference and central difference. On the basis of avoiding the oscillation defect of central difference, the results are as accurate as possible. The unsteady term adopts second-order Euler backward difference to improve the accuracy. In the turbulent transport equation, the unsteady term is a second-order difference, and the convection term is an upwind difference. Considering the factors such as calculation cost and calculation accuracy, the SST k-ω model is finally selected as the turbulence model (Han et al., 2021; Wei et al., 2021).
Figure 1 shows the PAT experimental system. The test rig is composed of a water tank, booster pump, control valve, electromagnetic flowmeter, pressure transmitter, high-frequency dynamic pressure sensor, dynamometer, variable frequency control cabinet, and other equipment.
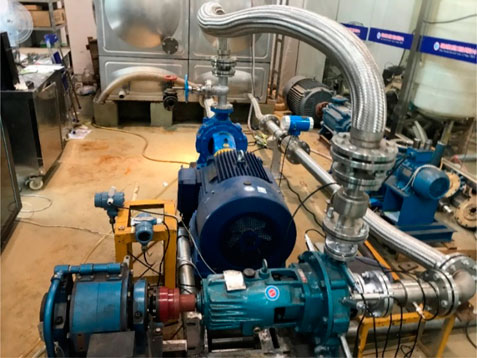
FIGURE 1. PAT experimental system.
In numerical calculation, the basic guarantee for the credibility of numerical calculation is to ensure the independence of time and space step size. In this study, three sets of grid generations are adopted, and the number of grids corresponding to each set is 2.01×10⁶ (G1), 5.12×10⁶ (G2), and 7.48×10⁶ (G3). Figure 2 shows the comparison of numerical simulation results and experimental data under three PAT grids. The head increases as the flow rate increases, and the error of grid G1 is relatively larger than the other two; the maximum difference reaches 7.7%. However, for grids G2 and G3, the differences between the experimental and numerical results are less than 0.45%, which means that the simulation results are in good agreement with the measured data. Therefore, in this study, the SST turbulence model can be used to study the internal and external characteristics of the pump as a turbine.
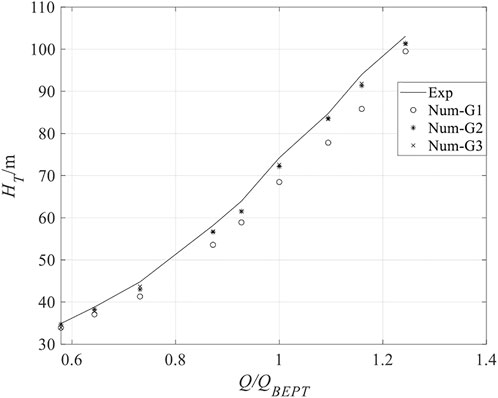
FIGURE 2. Grid independence verification.
Figure 3 shows the head and efficiency curve of the ultra-low specific-speed centrifugal pump as a turbine. It can be seen from the figure that the head of the pump gradually increases with the increase in flow rate; meanwhile, its efficiency increases at first and then decreases. The flow rate at the highest efficiency point is Qbep = 52 m3/h, which is much larger than that at the highest efficiency point of pump mode. In order to facilitate the study of unsteady external characteristics, the circumferential angle between the suction surface at the trailing edge of the blade and the tip of the volute tongue is defined as ε. When the blade is located at the tongue, ε = 0°.
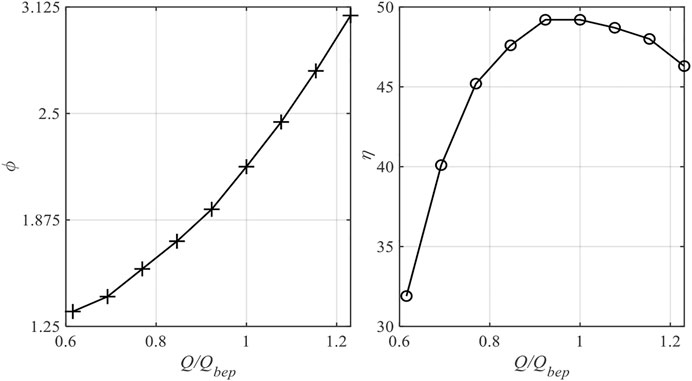
FIGURE 3. Head and efficiency curve of PAT.
Figure 4 shows an unsteady curve of the head coefficient in a rotating period of the impeller. The curve shows notable periodicity with three evident peaks and troughs, which is explicitly caused by the rotor–stator interaction (RSI) of the impeller and tongue. With the increase in flow rate, the fluctuation intensity of the head increases gradually. At a low flow rate, the unsteady head changes very little. When the blade is at the tongue position, the water head changes slightly. At a high flow rate, the unsteady head gradually decreases with the blade getting away from the tongue. When ε is at 0, 120, and 240°, the head curve is in the trough. At this time, the blade is located at the tongue, and as it is away from the tongue, the head increases dramatic and then gradually decreases to the next trough. Moreover, there is a secondary fluctuation at the trough. It contributes to the RSI between the trailing edge of the SS, PS, and the tongue, leading to the flow field fluctuation and the occurrence of secondary fluctuation. With the flow rate increasing, the fluctuation range of the head coefficient gets larger, which indicates that the influence of RSI between the impeller and tongue on the flow field is intensified (Zhang et al., 2021b).
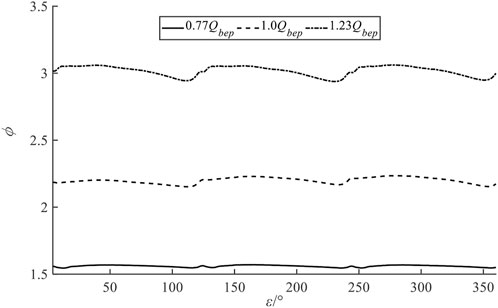
FIGURE 4. Transient variation of head coefficient in a single impeller rotation cycle.
Figure 5 shows the total pressure coefficient fluctuation curve of the impeller and volute in a single impeller cycle. The fluctuation trends of the total pressure loss of the volute and the total pressure drop of the impeller are similar to those of the head coefficient, and the dramatic change occurs when the blade is located at the tongue. The total pressure drop of the impeller is much larger than that of the volute, but the fluctuation intensity of the total pressure loss of the volute is greater than that of the total pressure drop coefficient of the impeller. It indicates that the RSI between the impeller and the tongue has a greater impact on the flow field of the volute. Combined with the head variation, it can be seen that the sharp fluctuation of the head curve is mainly caused by the large variation of the volute pressure drop.
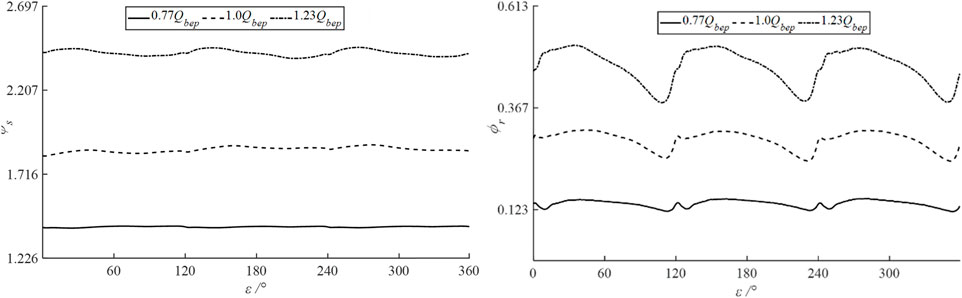
FIGURE 5. Total pressure coefficients of impeller (left) and volute in a single impeller cycle.
To further study the variation law of impeller shaft power, Figure 6 shows the variation curve of flow channel power during an impeller rotation period. At a low flow rate, the blade load coefficient changes largely around ε = 0°. At this time, the RSI between the trailing edge of blade SS and the tongue leads to the change of the flow field near the outlet of the flow channel. With the rotation of the blade away from the tongue, the blade load coefficient increases gradually. At ε = 120°, the peak appears, and then, with the rotation of the impeller, the load coefficient decreases gradually. At the BEP, the fluctuation trend is similar to that at low flow, but the highest value appears at ε = 50°. At a high flow rate, as the blade rotates to ε = 120°, the fluctuation amplitude is significantly higher than that at other flow rates. Then, the shaft power of the blade decreases gradually with the impeller rotating. When ε is about 200°, the shaft power begins to increase gradually, and the change trend is opposite to that at the low flow rate.
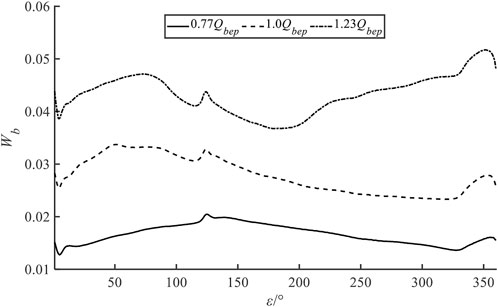
FIGURE 6. Shaft power variation of impeller passage in a single impeller cycle.
For an incompressible fluid, the total pressure represents fluid mechanical energy. Figure 7 shows the average distribution of total pressure and the variance distribution of total pressure in a single impeller cycle under different flow rates. At a low flow rate, the total pressure gradually decreases from the volute inlet to the impeller outlet. The local low total pressure zone appears in the anterior part of the volute tongue septum and outside of the volute inlet tube. In the impeller, the maximum total pressure appears at the impeller inlet around the blade PS, and the total pressure increases slightly at the position of the balance hole. In the front of the tongue, the variance distribution of total pressure is significantly different. The total pressure variance value is larger at the impeller blade inlet, which means that the flow field fluctuates violently at the tongue and the inlet of the impeller. Under the BEP, the total pressure difference between the PS and SS of the impeller blade rises further. In addition, the total pressure difference of the impeller inlet is higher than that of the outlet side. Compared with the low flow rate, the circumferential distribution of total pressure in the volute is more even. The maximum total pressure variance at the BEP appears in the SS of the impeller blade, followed by the total pressure variance around the blade inlet and tongue. This is attributed to a strong periodic vortex on the SS of the blade under the effect of the RSI, resulting in a large change in the total pressure on the SS. At a high flow rate, the variance distribution inside the impeller is similar to that at the BEP, but its variance is larger, and the variance in the spiral section of the volute is significantly higher than that in other regions. The variances of the tongue, blade inlet, and balance hole vary a lot, indicating that the total pressure fluctuation in these regions is relatively intense.
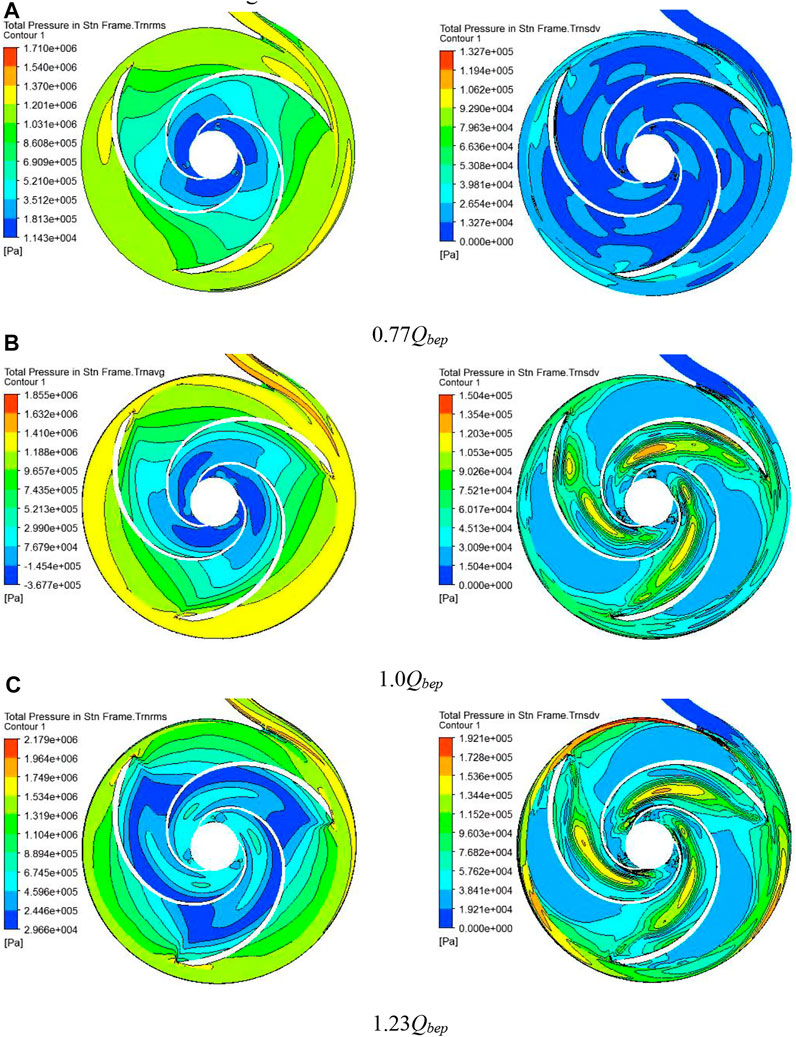
FIGURE 7. Distribution of total pressure and total pressure variance at three flow rates. (A): 0.77 Qbep; (B):1.0 Qbep; (C): 1.23 Qbep.
The evolution of the vortex is the cause of mechanical energy loss in turbulence flow, and the deformation of the vortex is mainly led by a velocity gradient. The Q criterion is used to define the vortex structure in this study, which is defined as follows:
Here, the Q criterion represents the balance between the shear strain rate and vortex intensity.
Figure 8 shows the vortex core distribution at the impeller outlet and the balance hole under small flow conditions. The leakage flow of the balance hole is a leakage vortex generated in the impeller channel. The velocity in the vortex core area decreases, and the pressure increases. Therefore, there is a notable high-pressure area near the balance hole in Figure 8. The vorticity at the outlet of the impeller is large, which indicates that the shear deformation rate of the fluid at the outlet is large, and the hydraulic loss is also large.
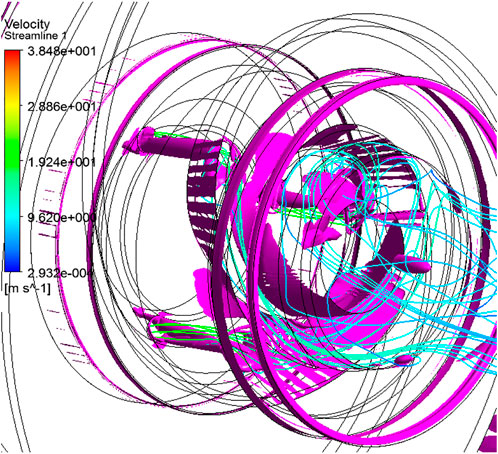
FIGURE 8. Vortex structures identified by Q criterion at three flow rates.
The periodic variation of head and shaft power under PAT conditions indicates that the internal flow also has the same fluctuation, which also affects the pressure pulsation. The variation of the average pressure coefficient of the volute in a rotating period is shown in Figure 9. The pressure of the volute increases with the flow rate. For the volute outlet, the pressure from 0° to 20° and 345° to 360° increases rapidly, which indicates the existence of a large pressure gradient around the tongue. For the near-wall of the volute, the pressure at the tongue increases rapidly, while the pressure at the inlet of the volute decreases dramatically. These phenomena indicate that there is a low-pressure zone at the tongue and the volute inlet, which is caused by the fluid inertia force and the separation flow of the tongue. In general, the pressure at the volute outlet is smaller than that at the near-wall of the volute due to the low velocity near the wall.
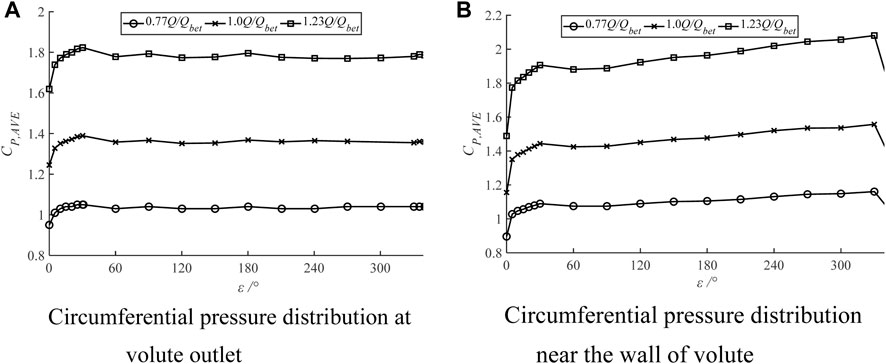
FIGURE 9. Pressure distribution of volute along circumferential direction. (A): Circumferential pressure distribution at volute outlet; (B) Circumferential pressure distribution near the wall of volute.
The pressure coefficient change of the monitoring points near the tongue is shown in Figure 10. The pressure variation trend of the three monitoring points is consistent under a low flow rate. With the increase in flow rate, the pressure coefficient and fluctuation intensity of monitoring points increase. Furthermore, due to the effect of inertial force, the flow velocity at point MP3 is larger, and the pressure is far less than that at other locations.
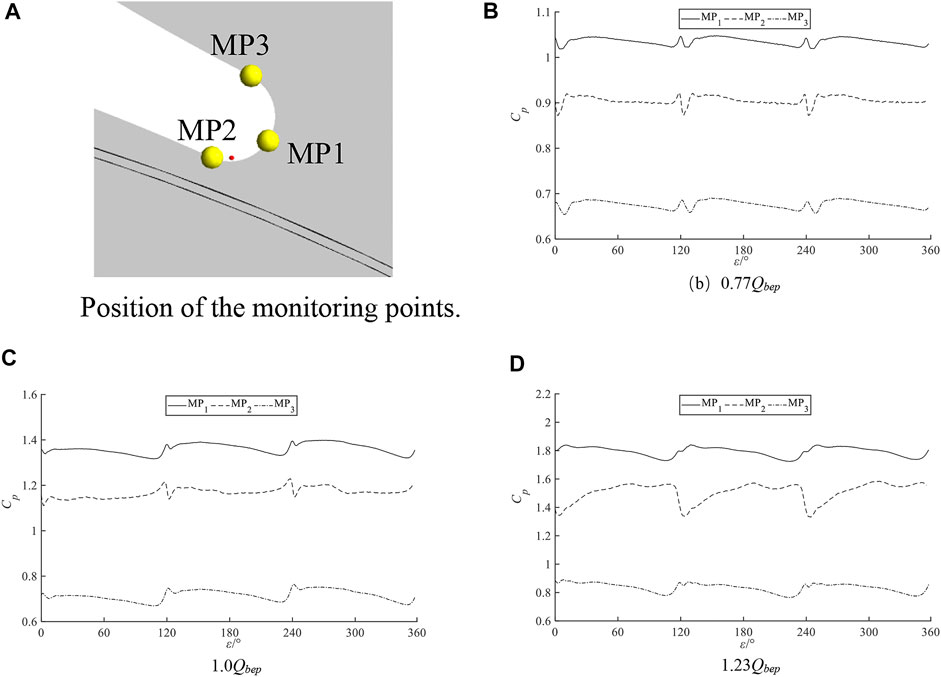
FIGURE 10. Variation of pressure coefficient at monitoring points. (A): Position of the monitoring points; (B): 0.77 Qbep; (C):1.0 Qbep; (D): 1.23 Qbep.
Figure 11 shows the distribution of average pressure and pressure fluctuation intensity in the impeller. The pressure decreases from the inlet to the outlet of the impeller, and the pressure gradient in the outlet gets larger with the increase of the flow rate. At the low flow rate, the lowest pressure appears at the impeller outlet and the balance hole. At BEP, the pressure at the balance hole is higher than that at the impeller outlet. The minimum pressure of the impeller appears in the middle area of the blade, which gradually shifts to the impeller inlet, with the flow rate increasing to 1.23Qbep. As the flow rate increases, the area of high-pressure pulsation intensity gradually expands from the balance hole to the middle of the impeller channel, which is caused by RSI and balance hole leakage.
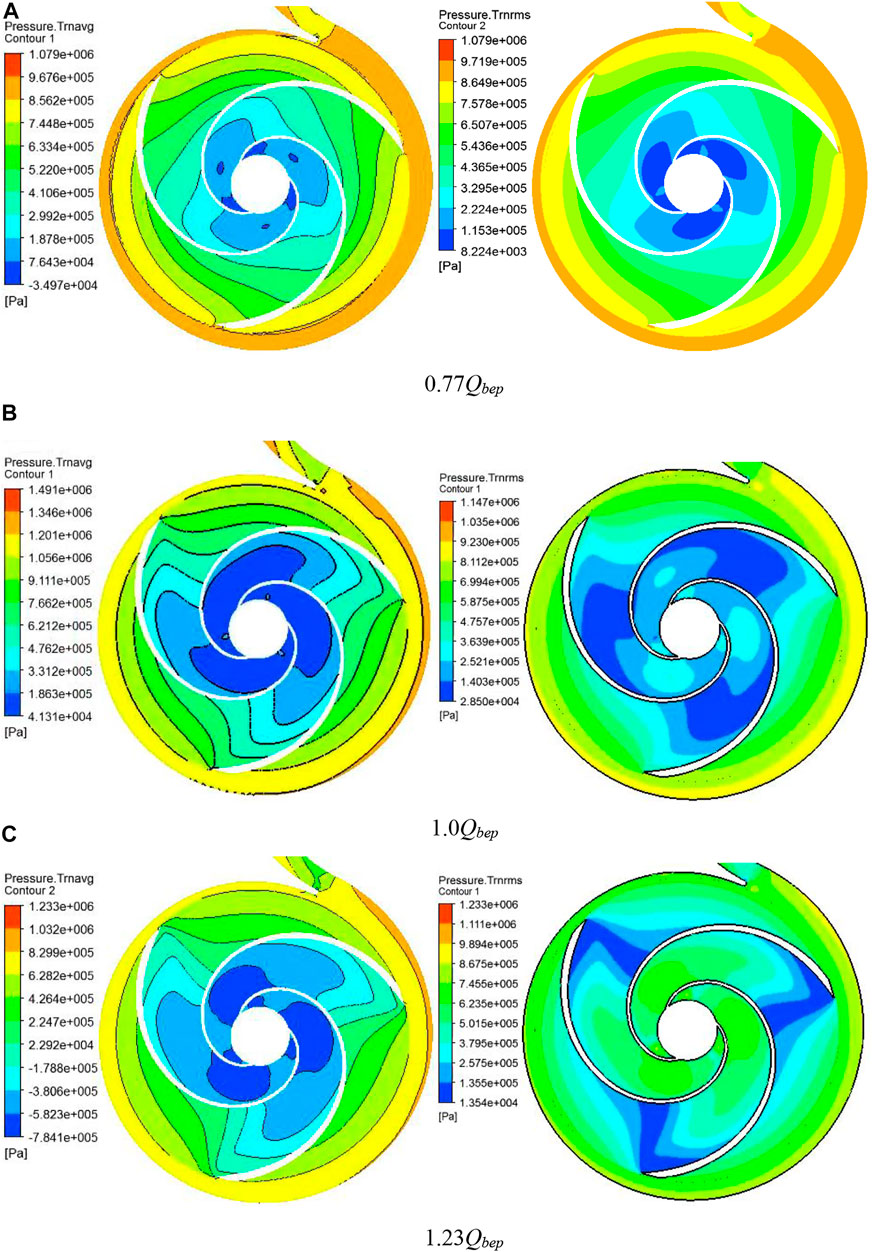
FIGURE 11. Distribution of mean pressure and pressure fluctuation intensity in the impeller. (A): 0.77 Qbep; (B):1.0 Qbep; (C): 1.23 Qbep.
The five significant instants in Figure 8 are selected to explore the principle of RSI, and the corresponding impeller positions are shown in Figure 12. Figure 13 shows the pressure coefficient distribution at the volute outlet under BEP. At T1, the tongue is located in channel C. The pressure is lower upstream (0°–40°) of the tongue, while the pressure is higher downstream (280°–360°). The channel pressure increases along the impeller rotation direction. At T2, the SS of the flow channel C get close to the tongue, inducing a low-pressure region, while the PS exists in a high-pressure zone. At T3, the PS of channel A is close to the tongue, leading to an increase in the pressure on the PS. There is still a low-pressure area upstream of the tongue. The pressure distribution of channels B and C is similar. At T4, the high-pressure region of PS of channel A enlarges, and the pressure changes of other channels are small. At T5, the pressure of the volute outlet reaches the lowest, and the low-pressure area near the SS of the channel is large. The high-pressure area still exists downstream of the tongue. In general, when the PS of the channel is close to the tongue, the pressure of the volute outlet increases gradually. When the flow channel is away from the tongue, the pressure of the volute outlet gradually decreases.
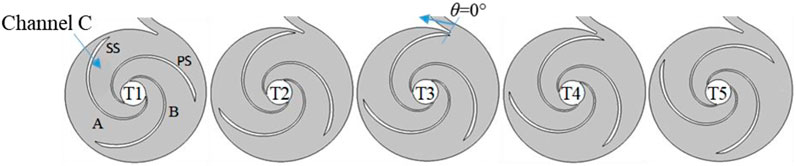
FIGURE 12. Typical position of the impeller.
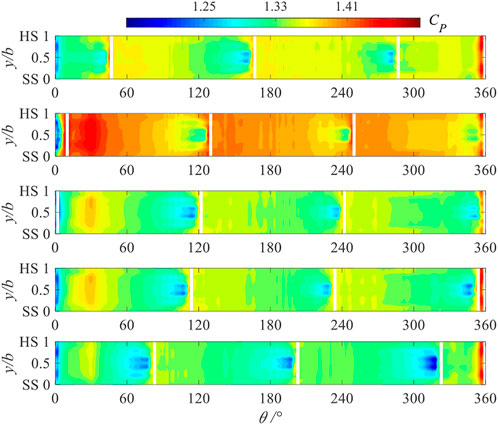
FIGURE 13. Distribution of pressure coefficient in the volute outlet at BEP.
Figure 14 shows the radial velocity distribution of the volute outlet under the BEP. In the low-pressure region near the SS of the flow channel, the radial velocity is negative with a large value, while it presents a positive value at the tongue. In the regions of y/b = 0.25 and 0.75, the radial velocity is lower due to the effect of the cover plates. At y/b = 0 and 1, the radial velocity is negative because the fluid enters the pump chamber. At T1, there is a notable negative value area at the PS of channel C and at the low-pressure region. The absolute value of the negative radial velocity of channel C is less than that of channel A and channel B, which indicates that RSI has an influence on the radial velocity of the fluid. The tongue has a certain blocking effect, preventing the fluid from entering the impeller. At T2, the radial inflow velocity in channel C keeps decreasing while it presents a rise in other channels. At T3, the radial velocity reaches the minimum value. At T4, the tongue is located in channel A, and the negative radial velocity region near the SS of channel A reduces. As the impeller rotates to the T5 position, the negative radial velocity region near the SS of channel A increases, but the radial inflow velocity upstream of the tongue gets small.
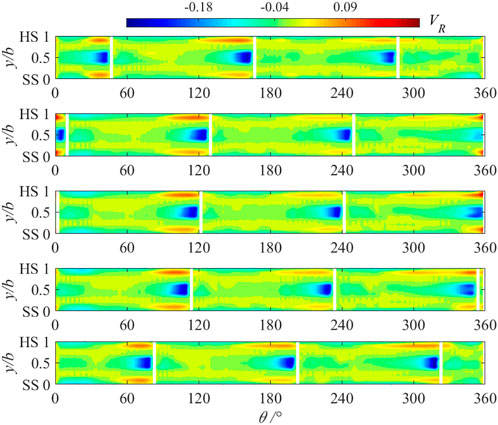
FIGURE 14. Distribution of radial velocity in the volute outlet under BEP.
Figure 15 shows the distribution of the circumferential velocity and flow angle at the volute outlet under BEP. The high circumferential velocity is mainly located at the regions of y/b = 0.75 and 0.25. At T1, the circumferential velocity is relatively small upstream of the tongue (0°–40°), and it is relatively large in other positions. A local high-velocity region appears near the SS of the channel. At T2, the circumferential velocity increases at the SS of channel B and channel C and decreases in channel A. A small value appears at the downstream channel C of the tongue (350°–360°). At T3, there is a large region of low circumferential velocity near the SS of channel C, and the change of circumferential velocity in channels A and B is small. At T4, the circumferential velocity decreases at the PS of channel A and changes slightly elsewhere. At T5, a high circumferential velocity region appears at the low-pressure zone of channel C. The value of the circumferential velocity in runner C increases as a whole, but that in other positions shows little change. The distribution of flow angle is similar to that of radial velocity. Due to the large radial velocity on the blade SS, there is a large negative flow angle area. A small positive flow angle appears at y/b = 0.25 and 0.75, which is attributed to the influence of the front and rear cover. In conclusion, the tongue has a great influence on the flow field of the flow channel near the tongue.
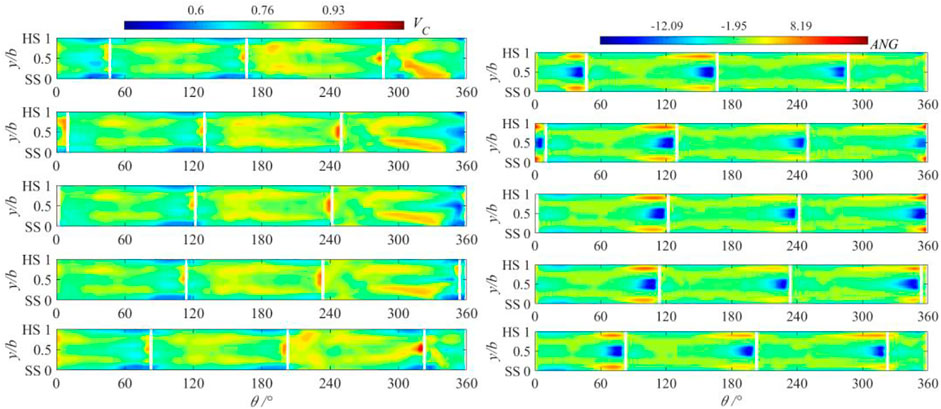
FIGURE 15. Distribution of circumferential velocity and flow angle in the volute outlet at BEP.
Figure 16 presents the pressure distribution on the PS and SS of the flow channel C under five different impeller positions. At the T1 position, the region of the PS near the impeller outlet and the middle region of the suction side (R1) are in lower pressure, which is caused by the vortex motion caused by the leakage of the balance hole. As the impeller rotates to the T2 position, the pressure in region R1 increases, the pressure difference between PS and SS increases, and the power of the flow channel also increases. As the impeller rotates to the T3 position, the pressure of region R1 decreases, but the range of the low-pressure area in the zone of SS near the impeller outlet enlarges, and the pressure on the outer edge of the blade increases. At the same time, the power of the flow channel reaches the minimum value. At the T4 position, the pressure on the PS of the flow channel increases while the pressure on the SS decreases. At this time, the runner power has increased. When the impeller rotates to the T5 position, the pressure on the leading edge of the blade PS is low, and the low-pressure area is large. The pressure on the trailing edge of the SS decreases significantly. On the whole, the inlet pressure change of the channel has a major impact on the impeller work.
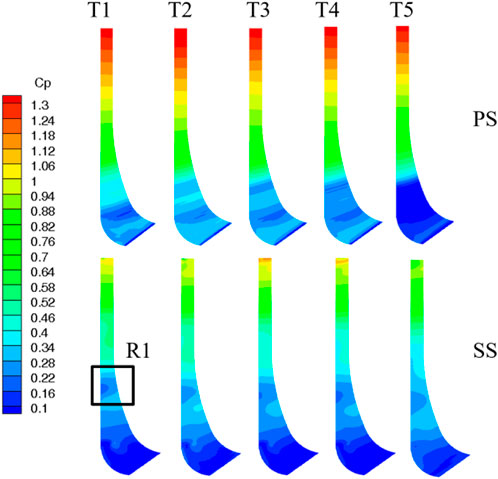
FIGURE 16. Pressure distribution on the PS and SS of the flow channel C under the impeller positions.
Figure 17 shows the streamlined distribution of the middle section plane of the five impeller positions under BEPs. The internal vortex flow of PAT is notable. There is a large vortex in the region with low pressure near the flow channel outlet and a relatively small vortex in the region with high pressure around the flow channel inlet. At the T1 position, three vortex structures appear at the SS of this channel, and their influence range is from the inlet to the outlet of the flow channel. When the impeller rotates to the position of T2, the vortex in the low-pressure region tends to enlarge to the impeller inlet, and the small vortex begins to appear at the inlet of the flow channel, which blocks the passage, resulting in the increase of the channel inlet pressure. As the impeller rotates to the T3 position, the influence area of the large vortex is reduced due to the blocking effect of the tongue, and the channel pressure near the impeller inlet increases, causing the power of the flow channel to decrease. When the impeller continues to rotate away from the volute tongue, the intensity of the vortex structures all increases, resulting in the decrease of the pressure in the channel.
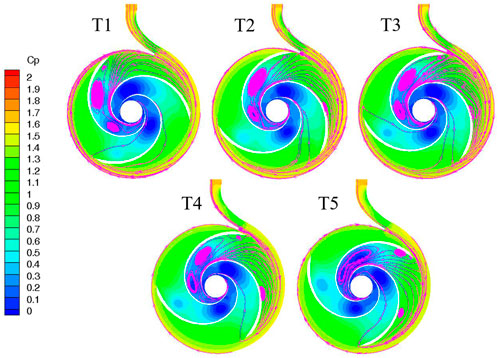
FIGURE 17. Streamline distribution of the middle section plane of the impeller positions.
Furthermore, the pressure gradient at the inlet elbow of the volute is large, which is caused by the high fluid velocity and the large inertial force in this position. Under the action of the impeller rotation, the upstream area of the tongue has a larger flow velocity and a lower pressure. At the position of the volute tongue, the fluid with a small flow cross-section flows around the tongue into the corresponding impeller channel and mixes with the high-pressure mainstream, which makes the pressure gradient around the tongue very large.
This study explores the transient hydraulic performance of an ultra-low specific-speed centrifugal pump under turbine conditions. The numerical simulation method verified by experiments is used to study the internal flow characteristics, and the unsteady fluctuation of hydraulic characteristics and the rotor–stator interaction are explored.
The minimum value of the unsteady head occurs when the blade passes through the tongue. With the increase of flow rate, the fluctuation range of the head coefficient increases, and the influence of the impeller tongue rotor–stator interaction on the flow field intensifies. The total pressure loss of the impeller and the volute change periodically with the rotation of the impeller, but the total pressure loss of the volute fluctuates violently, and the total pressure loss of the impeller fluctuates relatively smoothly. The leakage flow from the balance hole leads to large vorticity at the impeller outlet, which leads to large hydraulic losses. The periodic variation of the impeller power is due to the influence of the blade load and the impeller channel power by the interaction of the rotor and the stator. The pressure inside the volute increases sharply at the tongue, and the pressure increase outside the volute is greater than the pressure increases inside the volute. For the entire PAT, the areas with larger pressure fluctuations are the blade trailing edge area and the balance hole outlet.
There is a large negative radial velocity region between the pressure surface side and the back side of the channel, and the negative radial velocity value on the back side is higher than that on the pressure surface side. When the flow passage is close to the tongue, the negative value area on the side of the pressure surface gradually increases. The rotor–stator interaction between the impeller and tongue affects the pressure and velocity distribution of the whole volute. In the area upstream of the tongue (about 0°–20°), the pressure is low, and the velocity and liquid flow angle are high. As the pressure surface of the passage approaches the tongue, the pressure on the pressure surface first increases and then decreases, and the liquid flow angle gradually decreases. When the passage is far away from the tongue, the pressure first decreases and then increases, and the radial velocity and circumferential velocity both decrease.
The flow separation on the back of the impeller passage leads to a large eddy flow in this area. With the rotation of the impeller, the large eddy moves alternately to the inlet and outlet of the passage, resulting in different effects on the pressure on the back of the passage. When the flow rate is large, the influence area of the large eddy becomes larger, which not only affects the back pressure distribution but also affects the middle and front area of the pressure surface. The movement of small vortices in the middle and rear area of the pressure surface will affect the pressure at the outer edge of the pressure surface. This kind of pressure change on the pressure surface and suction surface leads to the periodic fluctuation of channel power and shaft power.
The original contributions presented in the study are included in the article/Supplementary Material; further inquiries can be directed to the corresponding authors.
Conceptualization, YW and WS; methodology, QZ; software, YS; validation, WS and QZ; formal analysis, YS; investigation, YW; resources, WS; data curation, YS; writing—original draft preparation, WY; writing—review and editing, QZ; visualization, WS; supervision, YW and YS; project administration, WS; and funding acquisition, QZ. All authors have read and agreed to the published version of the manuscript.
This work was supported by the Jiangsu Province Universities Natural Sciences Foundation (Grant No. 20KJB570002), Project of self-made experimental instruments and equipment of Jiangsu University (Grant No. ZZYQSB202206), and the National Key Research and Development Program (Grant No. 2019YFB2005300).
The author QZ is employed by Kunming Drainage Facilities Management Co., Ltd.
The remaining authors declare that the research was conducted in the absence of any commercial or financial relationships that could be construed as a potential conflict of interest.
All claims expressed in this article are solely those of the authors and do not necessarily represent those of their affiliated organizations, or those of the publisher, the editors, and the reviewers. Any product that may be evaluated in this article, or claim that may be made by its manufacturer, is not guaranteed or endorsed by the publisher.
Adu, D., Du, J., Darko, R., Ofosu Antwi, E., and Aamir Shafique Khan, M. (2021). Numerical and experimental characterization of splitter blade impact on pump as turbine performance. Sci. Prog. 104 (2), 003685042199324–003685042199579. doi:10.1177/0036850421993247
Agarwal, T. (2012). Review of pump as turbine (PAT) for micro-hydropower. Int. J. Emerg. Technol. Adv. Eng. 2 (11), 163–169.
Balacco, G., Binetti, M., Caggiani, L., and Ottomanelli, M. (2021). A novel distributed system of e-vehicle charging stations based on pumps as turbine to support sustainable micromobility. Sustainability 13 (4), 1847. doi:10.3390/su13041847
Barbarelli, S., Amelio, M., Florio, G., and Scornaienchi, N. (2017). Procedure selecting pumps running as turbines in micro hydro plants. Energy Procedia 126, 549–556. doi:10.1016/j.egypro.2017.08.282
Binama, M., Kan, K., Chen, H., Zheng, Y., Zhou, D. Q., Su, W. T., et al. (2021). A numerical investigation into the PAT hydrodynamic response to impeller rotational speed variation. Sustainability 13 (14), 7998. doi:10.3390/su13147998
Cao, Z., Deng, J., Zhao, L., and Lu, L. (2021). Numerical research of pump-as-turbine performance with synergy analysis. Processes 9 (6), 1031. doi:10.3390/pr9061031
Derakhshan, S., Mohammadi, B., and Nourbakhsh, A. (2009). Efficiency improvement of centrifugal reverse pumps. J. Fluids Eng. 131, 021103. doi:10.1115/1.3059700
Derakhshan, S., Mohammadi, B., and Nourbakhsh, A. (2008). Incomplete sensitivities for 3D radial turbomachinery blade optimization. Comput. Fluids 37 (10), 1354–1363. doi:10.1016/j.compfluid.2008.01.002
Derakhshan, S., and Nourbakhsh, A. (2008). Experimental study of characteristic curves of centrifugal pumps working as turbines in different specific speeds. Exp. Therm. Fluid Sci. 32 (3), 800–807. doi:10.1016/j.expthermflusci.2007.10.004
Ebrahimi, S., Riasi, A., and Kandi, A. (2020). Selection optimization of variable speed pump as turbine (PAT) for energy recovery and pressure management. Energy Convers. Manag. 227, 113586. doi:10.1016/j.enconman.2020.113586
El-Emam, M., Zhou, L., Shi, W., Han, C., Bai, L., and Agarwal, R. (2021). Theories and applications of CFD–DEM coupling approach for granular flow: A review. Arch. Comput. Methods Eng. 28, 4979–5020. doi:10.1007/s11831-021-09568-9
El-Emam, M., Zhou, L., Yasser, E., Bai, L., and Shi, W. (2022). Computational methods of erosion wear in centrifugal pump: A state-of-the-art review. Arch. Comput. Methods Eng. 29, 3789–3814. doi:10.1007/s11831-022-09714-x
Han, Y., Zhou, L., Bai, L., Shi, W., and Agarwal, R. (2021). Comparison and validation of various turbulence models for U-bend flow with a magnetic resonance velocimetry experiment. Phys. Fluids 33, 125117. doi:10.1063/5.0073910
Huang, W., Yang, K., Guo, X., Ma, J., Wang, J., and Li, J. (2018). Prediction method for the complete characteristic curves of a francis pump-turbine. Water 10 (2), 205. doi:10.3390/w10020205
Kandi, A., Moghimi, M., Tahani, M., and Derakhshan, S. (2021). Optimization of pump selection for running as turbine and performance analysis within the regulation schemes. Energy 217, 119402. doi:10.1016/j.energy.2020.119402
Liu, M., Tan, L., and Cao, S. (2019). Theoretical model of energy performance prediction and BEP determination for centrifugal pump as turbine. Energy 172, 712–732. doi:10.1016/j.energy.2019.01.162
Liu, Y., and Lei, T. (2018). Tip clearance on pressure fluctuation intensity and vortex characteristic of a mixed flow pump as turbine at pump mode. Renew. Energy 129, 606–615. doi:10.1016/j.renene.2018.06.032
Morabito, A., Vagnoni, E., Matteo, M., and Hendrick, P. (2021). Numerical investigation on the volute cutwater for pumps running in turbine mode. Renew. Energy 175, 807–824. doi:10.1016/j.renene.2021.04.112
Rossi, M., and Renzi, M. (2017). Analytical prediction models for evaluating pumps-as-turbines (PaTs) performance. Energy Procedia 118, 238–242. doi:10.1016/j.egypro.2017.07.011
Tan, X., and Engeda, A. (2016). Performance of centrifugal pumps running in reverse as turbine: Part Ⅱ-systematic specific speed and specific diameter based performance prediction. Renew. Energy 99, 188–197. doi:10.1016/j.renene.2016.06.052
Wang, T., Kong, F., Xia, B., Bai, Y., and Wang, C. (2017). The method for determining blade inlet angle of special impeller using in turbine mode of centrifugal pump as turbine. Renew. Energy 109, 518–528. doi:10.1016/j.renene.2017.03.054
Wei, Y., Yang, Y., Zhou, L., Jiang, L., Shi, W., and Huang, G. (2021). Influence of impeller gap drainage width on the performance of low specific speed centrifugal pump. J. Mar. Sci. Eng. 9 (2), 106. doi:10.3390/jmse9020106
Yang, H., Zhu, L., Xue, H., Duan, J., and Deng, F. (2021). A numerical analysis of the effect of impeller rounding on centrifugal pump as turbine. Processes 9 (9), 1673. doi:10.3390/pr9091673
Yang, S., Shahramet, D., and Kong, F. Y. (2012). Theoretical, numerical and experimental prediction of pump as turbine performance. Renew. Energy 48 (1), 507–513. doi:10.1016/j.renene.2012.06.002
Zhang, J., Appiah, D., Zhang, F., Yuan, S., Gu, Y., and Asomani, S. N. (2019). Experimental and numerical investigations on pressure pulsation in a pump mode operation of a pump as turbine. Energy Sci. Eng. 7 (4), 1264–1279. doi:10.1002/ese3.344
Zhang, Y., Zang, W., Zheng, J., Cappietti, L., Zhang, J., Zheng, Y., et al. (2021). The influence of waves propagating with the current on the wake of a tidal stream turbine. Appl. Energy 290, 116729. doi:10.1016/j.apenergy.2021.116729
Zhang, Y., Zhang, Z., Zheng, J., Zhang, J., Zheng, Y., Zang, W., et al. (2021). Experimental investigation into effects of boundary proximity and blockage on horizontal-axis tidal turbine wake. Ocean. Eng. 225, 108829. doi:10.1016/j.oceaneng.2021.108829
Zhou, L., Hang, J., Bai, L., Krzemianowski, Z., El-Emam, M. A., Yasser, E., et al. (2022). Application of entropy production theory for energy losses and other investigation in pumps and turbines: A review. Appl. Energy 318, 119211. doi:10.1016/j.apenergy.2022.119211
A2 Area of the impeller outlet [m^2]
CPsdv Dimensionless pressure fluctuation intensity [-]
Cp Pressure coefficient [-]
D1 Diameter of pump inlet [mm]
D2 Diameter of pump outlet [mm]
Di Diameter of impeller outlet [mm]
H Design head [m]
g Gravity [m/s^2]
Mn Torque [N•m]
MP Moment of the fluid acting on the pressure side of the flow channel [N•m]
MS Moment of the fluid acting on the pressure side of the flow channel [N•m]
nd Rotating speed [r/min]
ns Rotating speed [-]
N Number of samples [-]
P1 Total pressure of the pump inlet [Pa]
P2 Total pressure of the pump outlet [Pa]
p(i) Pressure of the monitor point [Pa]
Pw,out,tp Total pressure of the volute outlet [Pa]
Pw,in,tp Total pressure of the volute inlet [Pa]
Pr,out,tp Total pressure of the impeller outlet [Pa]
Pr,in,tp Total pressure of the impeller inlet [Pa]
Q Flow rate [m3/s]
Qd Design flow rate [m3/s]
Q Flow rate [m^3/s]
Qd Design flow rate [m^3/s]
Qbep Flow rate at best efficiency point [m^3/s]
u2 Circumferential velocity [m/s]
Ws Shaft power [W]
Wsft Dimensionless coefficient of impeller work [-]
Z Number of impeller blade [-]
η Efficiency [%]
ρ Density [kg/m3]
CFD Computational fluid dynamics
BEP Best efficiency point
SS Suction side of the blade
PS Pressure side of the blade
RSI Rotor–stator interaction.
Keywords: low specific-speed, pump as turbine, hydraulic performance, pressure pulsation, rotor–stator interaction
Citation: Wei Y, Shi Y, Zhang Q and Shi W (2023) Numerical investigation of unsteady pressure pulsation characteristics in an ultra-low specific-speed centrifugal pump as a turbine. Front. Energy Res. 10:1026886. doi: 10.3389/fenrg.2022.1026886
Received: 24 August 2022; Accepted: 20 September 2022;
Published: 11 January 2023.
Edited by:
Yuquan Zhang, Hohai University, ChinaReviewed by:
Yu-Liang Zhang, Quzhou University, ChinaCopyright © 2023 Wei, Shi, Zhang and Shi. This is an open-access article distributed under the terms of the Creative Commons Attribution License (CC BY). The use, distribution or reproduction in other forums is permitted, provided the original author(s) and the copyright owner(s) are credited and that the original publication in this journal is cited, in accordance with accepted academic practice. No use, distribution or reproduction is permitted which does not comply with these terms.
*Correspondence: Yangyang Wei, d3l5QHVqcy5lZHUuY24=; Weidong Shi, d2RzaGlAbnR1LmVkdS5jbg==
Disclaimer: All claims expressed in this article are solely those of the authors and do not necessarily represent those of their affiliated organizations, or those of the publisher, the editors and the reviewers. Any product that may be evaluated in this article or claim that may be made by its manufacturer is not guaranteed or endorsed by the publisher.
Research integrity at Frontiers
Learn more about the work of our research integrity team to safeguard the quality of each article we publish.