
95% of researchers rate our articles as excellent or good
Learn more about the work of our research integrity team to safeguard the quality of each article we publish.
Find out more
ORIGINAL RESEARCH article
Front. Endocrinol. , 09 August 2023
Sec. Obesity
Volume 14 - 2023 | https://doi.org/10.3389/fendo.2023.1187781
 Qin-He Zhang1†Li-Hua Chen1†Qi An1†Peng Pi2Yi-Fan Dong2Ying Zhao1Nan Wang1Xin Fang1Ren-Wang Pu1Qing-Wei Song1Liang-Jie Lin3Jing-Hong Liu1Ai-Lian Liu1*
Purpose: To determine the renal sinus fat (RSF) volume and fat fraction (FF) in normal Chinese subjects using MRI fat fraction mapping and to explore their associations with age, gender, body mass index (BMI) and ectopic fat deposition.
Methods: A total of 126 subjects were included in the analysis. RSF volume and FF, visceral adipose tissue (VAT) and subcutaneous adipose tissue (SAT) area, and hepatic and pancreatic FFs were measured for each subject. The comparisons in gender were determined using two-tailed t-tests or the nonparametric Mann-Whitney U-test for normally or non-normally distributed data for continuous variables and the chi-square test for categorical variables. Comparisons of RFS volume and FF between right and left kidneys were determined using paired sample t-tests. Multivariable logistic models were performed to confirm whether RSF differences between men and women are independent of VAT or SAT area. When parameters were normally distributed, the Pearson correlation coefficient was used; otherwise, the Spearman correlation coefficient was applied.
Results: The RSF volumes (cm3) of both kidneys in men (26.86 ± 8.81 for right and 31.62 ± 10.32 for left kidneys) were significantly bigger than those of women (21.47 ± 6.90 for right and 26.03 ± 8.55 for left kidneys) (P < 0.05). The RSF FFs (%) of both kidneys in men (28.33 ± 6.73 for right and 31.21 ± 6.29 for left kidneys) were significantly higher than those of the women (23.82 ± 7.74 for right and 27.92 ± 8.15 for left kidneys) (P < 0.05). The RSF differences between men and women are independent of SAT area and dependent of VAT area (except for right RSF volume). In addition, the RSF volumes and FFs in both kidneys in the overall subjects show significant correlations with age, BMI, VAT area, hepatic fat fraction and pancreatic fat fraction (P < 0.05). However, the patterns of these correlations varied by gender. The RSF volume and FF of left kidney were significantly larger than those of the right kidney (P < 0.05).
Conclusion: The association between renal sinus fat and ectopic fat deposition explored in this study may help establish a consensus on the normal values of RSF volume and FF for the Chinese population. This will facilitate the identification of clinicopathological changes and aid in the investigation of whether RSF volume and FF can serve as early biomarkers for metabolic diseases and renal dysfunction in future studies.
The renal sinus (RS) is a space that forms the medial border of the kidney and is surrounded by the renal parenchyma laterally. The upper part of renal arteries, veins, lymphatic vessels, nerves, renal pelvis, and major and minor calices are all located within the RS. As a kind of ectopic fat (e.g., liver, pancreas, skeletal muscle, and/or heart fat), renal sinus fat (RSF) refers to the variable amount of ectopic perivascular fat that distributed surrounds the structures within the RS (1), and is a compartment of visceral fat. The accumulation of RSF holds significant importance as it can potentially lead to compression of the renal veins and arteries that pass through this adipose tissue (2).
RSF may have effects on hypertension, cardiovascular risk and renal dysfunction (3–5). Recently, there is increased interest on the study of association between RSF and type 2 diabetes mellitus (T2DM). Larger RSF volume has been reported to be associated with lower glomerular filtration rate (GFR) and increased renal vascular resistance in T2DM patients (6). Furthermore, RSF volume was positively associated with several metabolic risk factors including HbA1c level and urinary albumin-to-creatinine ratio in T2DM patients (7).
Because conventional anthropometric measures of adiposity fail to capture the organ-specific fat deposition, advanced imaging techniques are indispensable for exploring the plausible implications of RSF accumulation on human health. Volumetric analysis of RSF by computed tomography (CT) and magnetic resonance imaging (MRI) and assessment of its association with metabolic and cardiovascular risks have been previously reported (6–10).
However, compared with RSF volume, little is known about the quality of RSF, which can be associated with adipose tissue dysfunction (5). An MRI iterative decomposition of water and fat with echo asymmetry at least-square estimation-iron quantification (IDEAL-IQ) method enables accurate measurement of fat content, with a low flip angle for suppressing the T1 effects and multi-echo acquisition for water-fat separation and correction of the T2* effects. It is currently considered the best non-invasive technique for assessing fat fraction (FF) and fat volume (11).
The associations of pancreatic volume, pancreatic fat, and hepatic fat with age, gender, and ectopic fat have been explored in normal subjects in previous studies (12–18). However, also as a kind of ectopic fat, RSF and its physiological changes in normal subjects are still unclear. To the best of our knowledge, to date, there was lack of studies about investigating normal quantitative metrics of the RSF volume and especially RSF FF as well as their correlations with biometric parameters (e.g., age and gender) and other ectopic adipose tissues (e.g., hepatic fat and pancreatic fat).
In this study, we hypothesized that RSF was associated with age, gender, body mass index (BMI) and ectopic fat deposition. Therefore, the purpose of this study was to determine RSF volume and FF in normal Chinese subjects using MRI fat fraction mapping and to assess the associations of RSF with age, gender, BMI and ectopic fat deposition.
This was a retrospective study of clinically suspicious cases of abdominal disease between January 2017 and August 2020. All patients underwent upper-middle abdominal MRI examination (including IDEAL-IQ imaging). Similar to the previous studies (10, 19, 20), participants who met at least one of the following criteria were excluded (1): age < 18 years (2); a history of heavy drinking (alcohol consumption ≥ 30 g per week in men or ≥ 20 g per week in women in the last 10 years) (3); evidence of cirrhosis, malignant liver tumor, large benign liver tumor, liver post-hepatectomy, decompensated liver diseases; evidence of other liver diseases, including viral hepatitis, autoimmune liver diseases, drug-induced liver injury, etc. (4); evidence of pancreas diseases (5); intrahepatic bile or pancreatic duct dilation (6); evidence of ascites, mesenteric injuries, huge abdominal mass, abdominal wall edema, post-ostomy (7); radiotherapy, chemotherapy, immunosuppressive therapy, antiviral therapy, and endocrine therapy (8); pregnancy (9); hypertension and/or T2DM (10); a history of renal surgery, hydronephrosis, renal sinus mass, renal dysfunction or renal malformation. Finally, a total of 126 subjects (46 men and 80 women) were included in the analysis. The Ethical Committee approved the study.
In this study, the MRI scanner (GE Medical Systems, Inc., Waukesha, WI, USA) with an eight-channel phased-array body coil was used. The patients fasted for 4-6 hours and were trained to exhale and hold their breath for more than 20 seconds before scanning. The subjects were placed in the supine position during examination. A three-plane localization imaging gradient-echo sequence was performed at the beginning of acquisition. IDEAL-IQ was acquired and scanning parameters were shown in Table 1.
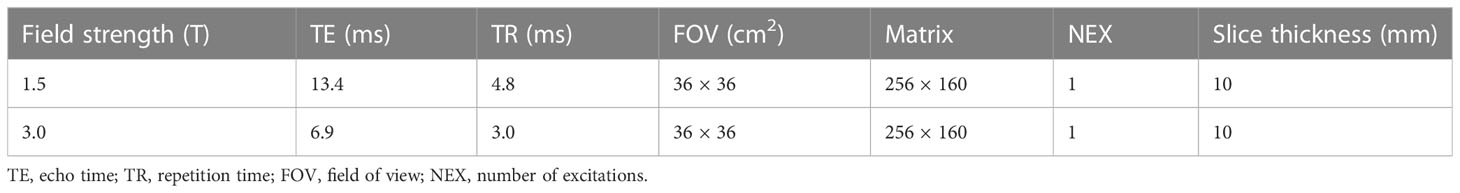
Table 1 IDEAL-IQ scanning parameters.
RSF was defined by an ectopic perivascular fat depot around renal hilum, which is in close contact with renal vasculature, lymphatic vessel, renal pelvis and calyces (10). All slices of upper-middle abdominal MRI fat fraction map were chosen for RSF analysis (about 20 – 24 slices, slice thickness 10 mm) using the open-source software ITK-SNAP (v.3.6.0, http://www.itksnap.org/), and RSF was manually segmented. Based on the sketch of the renal anatomy (21), RSF of both kidneys was identified on MRI FF map by a straight-line tangent to the margins of parenchyma beside the renal hilum in axial slices. Then the bilateral renal sinus adipose tissue manually segmented with structures of renal lymphatics, veins, and the ureters removed. Since adipose tissue exhibits high signal intensity on the FF map, the labeling of RSF started from the upper pole of the kidney with the high signal tissues in the renal sinus area labelled, and continued downward until reaching the lower pole of the kidney (Figure 1). Finally, the RSF volume and FF of right and left kidneys were automatically calculated using homemade software based on MATLAB (MATLAB R2018a).
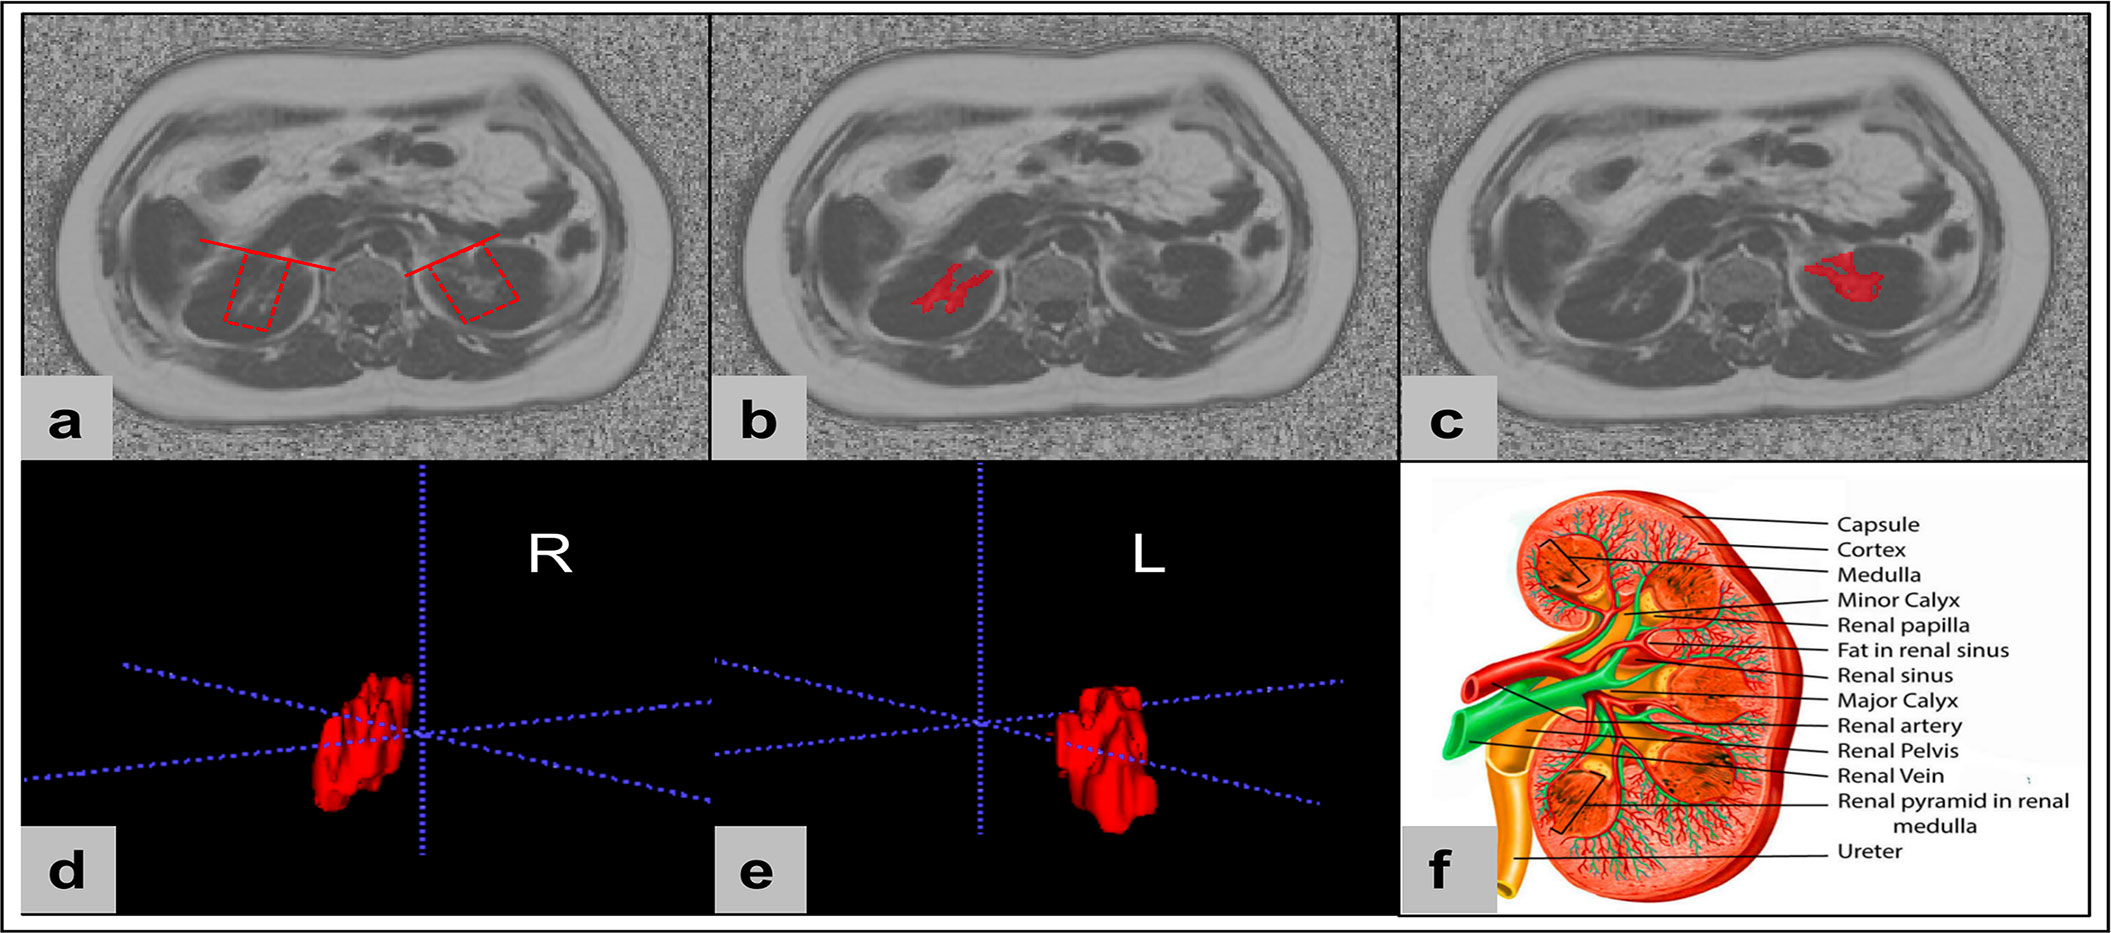
Figure 1 The renal sinus fat was manually conducted using the open-source software ITK-SNAP (v.3.6.0, http://www.itksnap.org/). Renal sinus fat of both kidneys was identified on MRI fat fraction maps by a straight-line tangent to the margins of parenchyma beside the renal hilum in axial slices (A). Then the bilateral renal sinus adipose tissues were manually segment with structures of renal lymphatics, veins, and the ureters removed (B, C). Finally, the renal sinus fat volume and FF of right and left kidneys were automatically calculated based on the 3D segmentations (D, E). Sketch of the renal anatomy (F) (Source: [21] distributed under the terms of the Creative Commons Attribution 4.0 International License (https://reativecommons.org/licenses/by/4.0/, accessed on the 1 March 2023) © 2023, StatPearls Publishing LLC).
Area (cm2) of VAT and SAT was semi-automatically measured on the axial FF images by Image J (National Institutes of Health, USA), as previously described (11). The abdominal fat was determined at the L1-L2 level and did not include intestinal loops.
On the post-processing platform (Intellispace portal v9.0, ISP v9.0, Philips Healthcare, Best, the Netherland), the software algorithm (multimodality tumor tracking, MMTT) could recognize the 3D margins of the liver on FF maps, and the whole liver was then semi-automatically traced with necessary manual corrections. The main portal vein, inferior vena cava, and the gallbladder were manually removed. After liver segmentation, the whole hepatic FF was automatically calculated (11).
The whole pancreatic FF was calculated using the same method as for liver avoiding extra-pancreatic adipose tissue and vessel (11).
The intra- and inter-observer variability were determined by repeated analysis of 30 random selected patients more than 4 weeks apart by the same observer and by the renal sinus fat measurements of the same patient by a second independent observer. Two radiologists were blinded to the grouping.
All data were analyzed using GraphPad Prism (Version 8.4.0, GraphPad software, LLC). The Kolmogorov-Smirnov test was used to test the normality of the variables. Normally distributed data were expressed as means ± standard deviations, and non-normally distributed data were expressed as medians and ranges (25th, 75th percentiles). The intraclass correlation coefficient (ICC) was used to check the consistency of the two observers: ICC < 0.4 indicated poor consistency; 0.4 ≤ ICC ≤ 0.75 indicated moderate consistency; ICC > 0.75 indicated good consistency. The comparisons of RFS volume and FF, and clinical and demographic characteristics in gender were determined using the independent-sample t tests for normally distributed continuous variables, and using the non-parametric Mann-Whitney U-test for non-normally distributed continuous variables. Multiple linear regression was performed to confirm whether RSF volume and FF differences between men and women are independent of VAT or SAT area. The comparisons of RFS volume and FF between right and left were determined using paired sample t-tests. When parameters were normally distributed, the Pearson correlation coefficient was used; otherwise, the Spearman correlation coefficient was applied. Correlation coefficients were interpreted as follows: weak, 0 - 0.4; moderate, 0.4 - 0.7; and strong, 0.7 - 1.0. In addition, we performed sex-stratified analyses. A two-tailed P value < 0.05 was considered to be statistically significant. There was no multiplicity adjustment of P-values.
A total of 126 patients with a median age of 56 years and a mean BMI of 23.64 kg/m2 were finally included in the study. Clinical and demographic characteristics are summarized in Table 2.
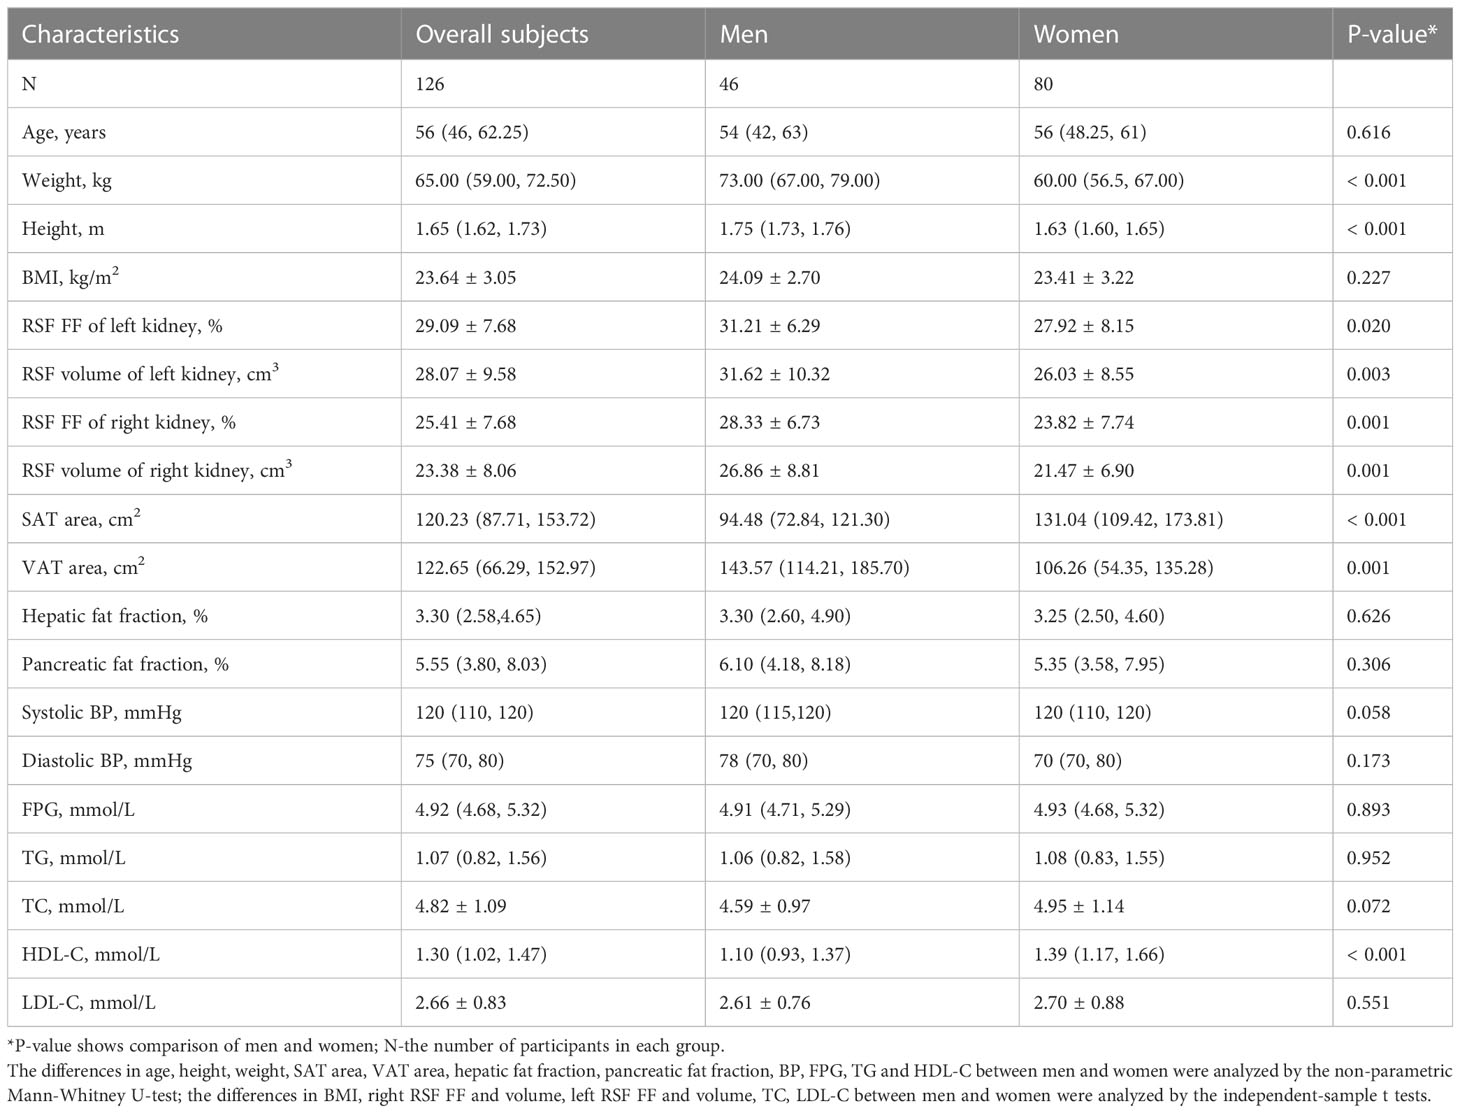
Table 2 Clinical characteristics of the study subjects.
The data consistency is shown in Table 3. The ICC values were all higher than 0.9, which suggested good inter-observer and intra-observer agreement.
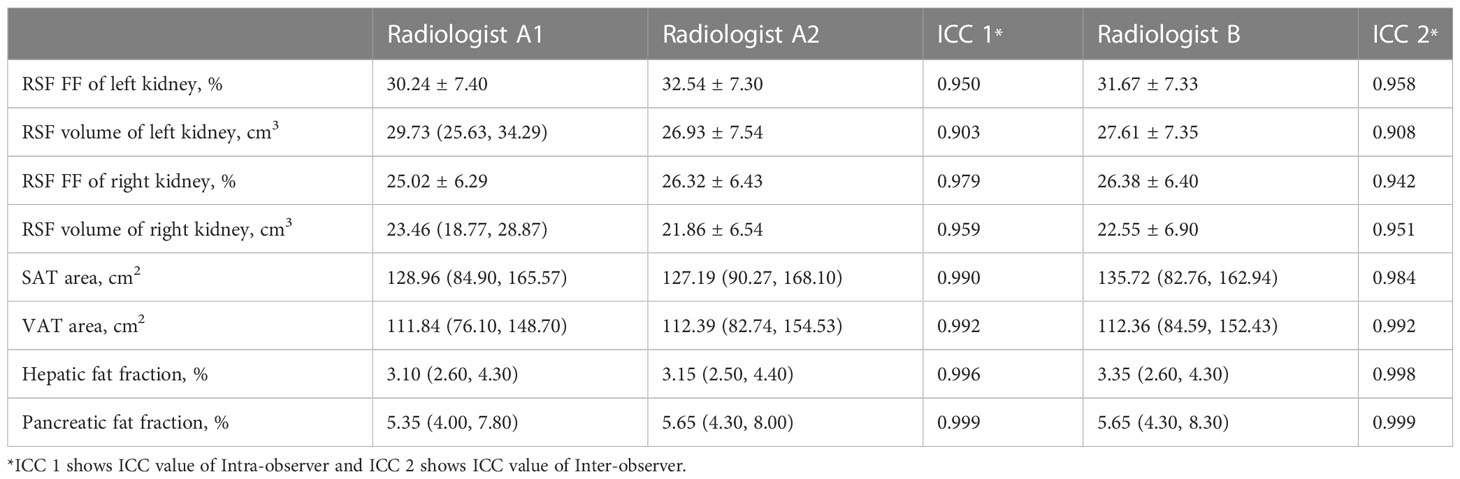
Table 3 Two-observer measurement consistency.
It was found that the RSF volumes (cm3) in men were 26.86 ± 8.81 for right and 31.62 ± 10.32 for left kidneys. The RSF volumes in women (cm3) were 21.47 ± 6.90 for right and 26.03 ± 8.55 for left kidneys. The RSF volumes of both kidneys in men were significantly higher than those in women (P < 0.05) (Table 2; Figure 2).
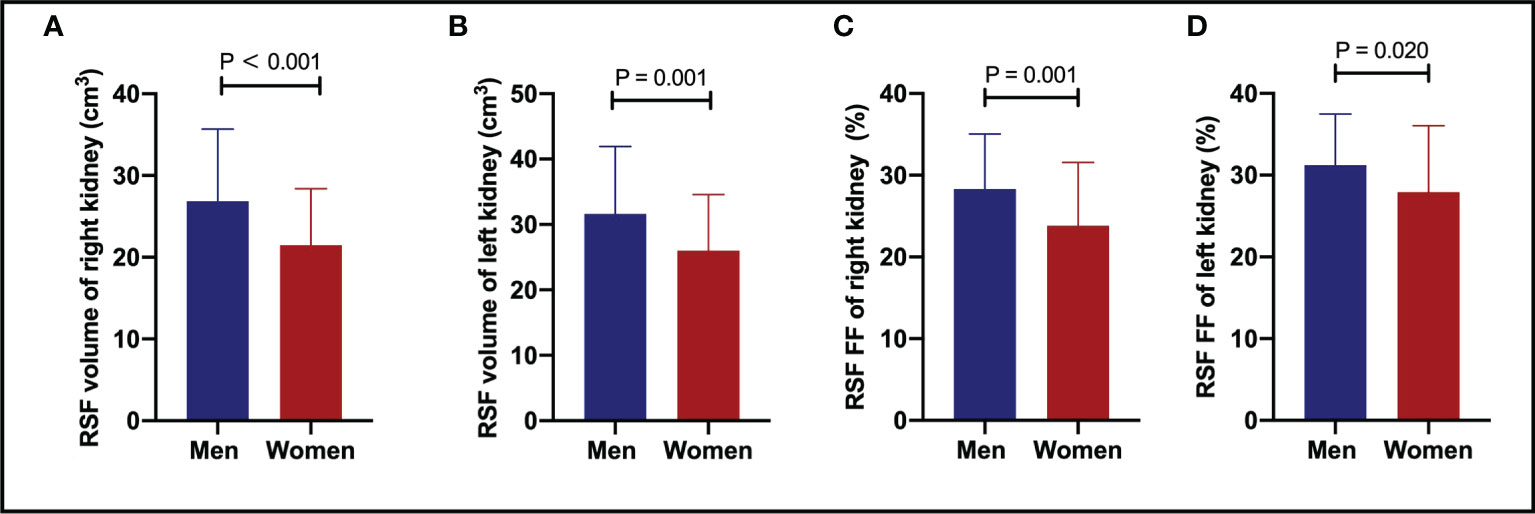
Figure 2 The comparisons of RSF volumes of right (A) and left (B) kidneys, and RSF FFs of right (C) and left (D) kidneys between genders. Both the RSF volume and FF of both kidneys in men were significantly larger than those in women (P < 0.05). RSF, renal sinus fat; FF, fat fraction.
In addition, it was also found that the RSF FFs (%) in men were 28.33 ± 6.73 for right and 31.21 ± 6.29 for left kidneys. The RSF FFs in women (%) were 23.82 ± 7.74 for right and 27.92 ± 8.15 for left kidneys. The RSF FFs of both kidneys in men were significantly higher than those in women (P < 0.05) (Table 2; Figure 2).
Furthermore, results of linear regression analyses for RSF volume and FF between men and women are shown in Table 4. The results showed that all RSF differences between men and women are independent of SAT area, and there were more RSF volume and FF in men (All β > 0). Yet, after adjusting for VAT area, only the right RSF volume showed significant difference between men and women.
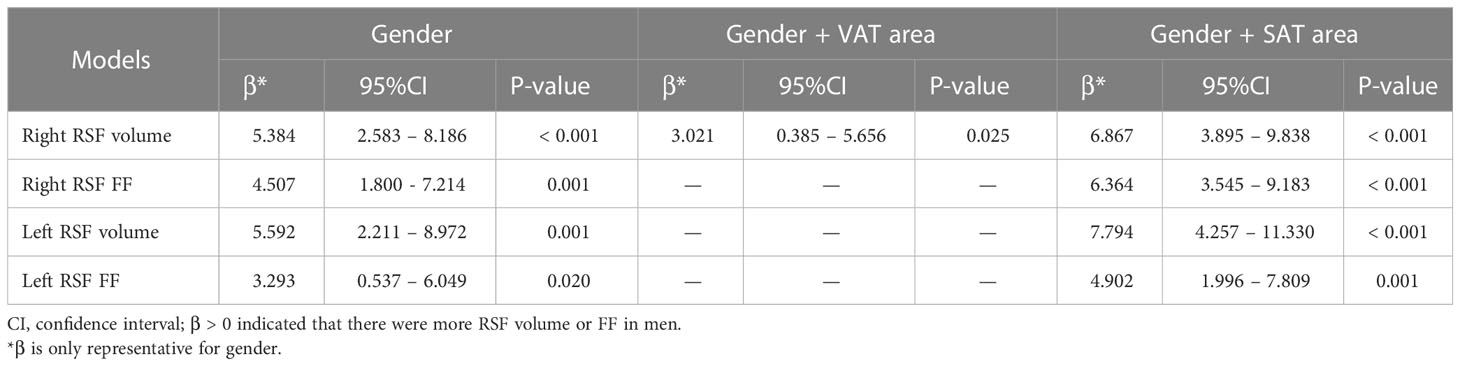
Table 4 Multiple linear regression for RSF volume and FF of left and right kidney in gender.
It was found that there was a significant correlation (P = 0.006, r = 0.245) in the overall subjects between the RSF volume of right kidney and the age (Figure 3A), but not for RSF volume of the left kidney (P = 0.075, r = 0.159). In addition, there were significant correlations (P < 0.001, r = 0.367 for right kidney, and P<0.001, r = 0.314 for left kidney) between the RSF FFs in both kidneys and the age in the overall subjects (Figure 3B).
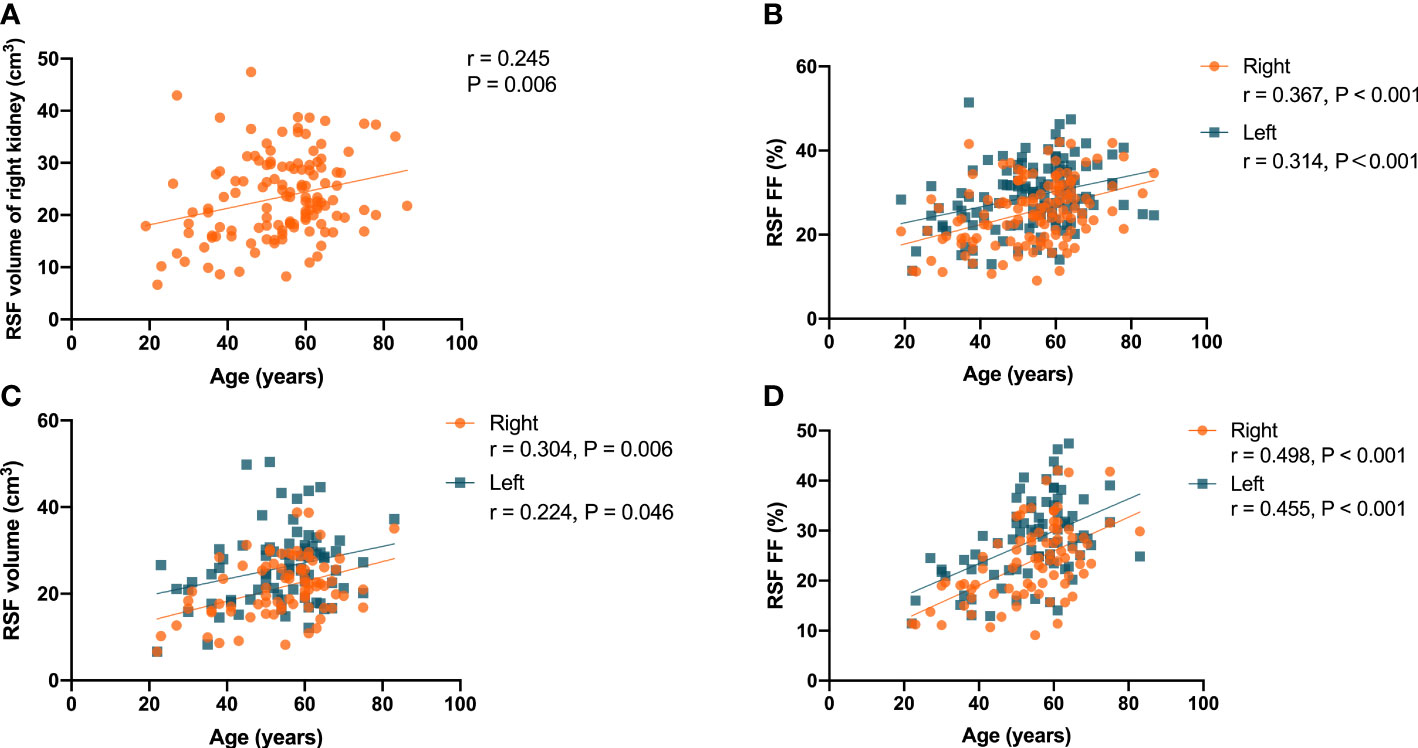
Figure 3 Correlation of the RSF volume in right kidney with the age in all subjects (A); correlations the RSF FF in both kidneys with age in all subjects (B); correlations of the RSF volume (C) and RSF FF (D) in both kidneys with the age in women subjects.
In women, there were correlations (P = 0.006, r = 0.304 for right kidney, and P = 0.046, r = 0.224 for left kidney) between the RSF volumes in both kidneys and the age (Figure 3C). In addition, there were correlations (P < 0.001, r = 0.498 for right kidney, and P < 0.001, r = 0.455 for left kidney) between the RSF FFs in both kidneys and the age (Figure 3D).
However, there was no significant correlation of RSF volumes or FFs in both kidneys with the age in men.
It was found that there were correlations (P = 0.001, r = 0.302 for right kidney, and P<0.001, r = 0.319 for left kidney) of the RSF volumes in both kidneys with BMI in the overall subjects (Figure 4A). In addition, it was also found that there were correlations (P = 0.002, r = 0.274 for right kidney, and P = 0.018, r = 0.210 for left kidney) of the RSF FFs in both kidneys with BMI in the overall subjects (Figure 4B).
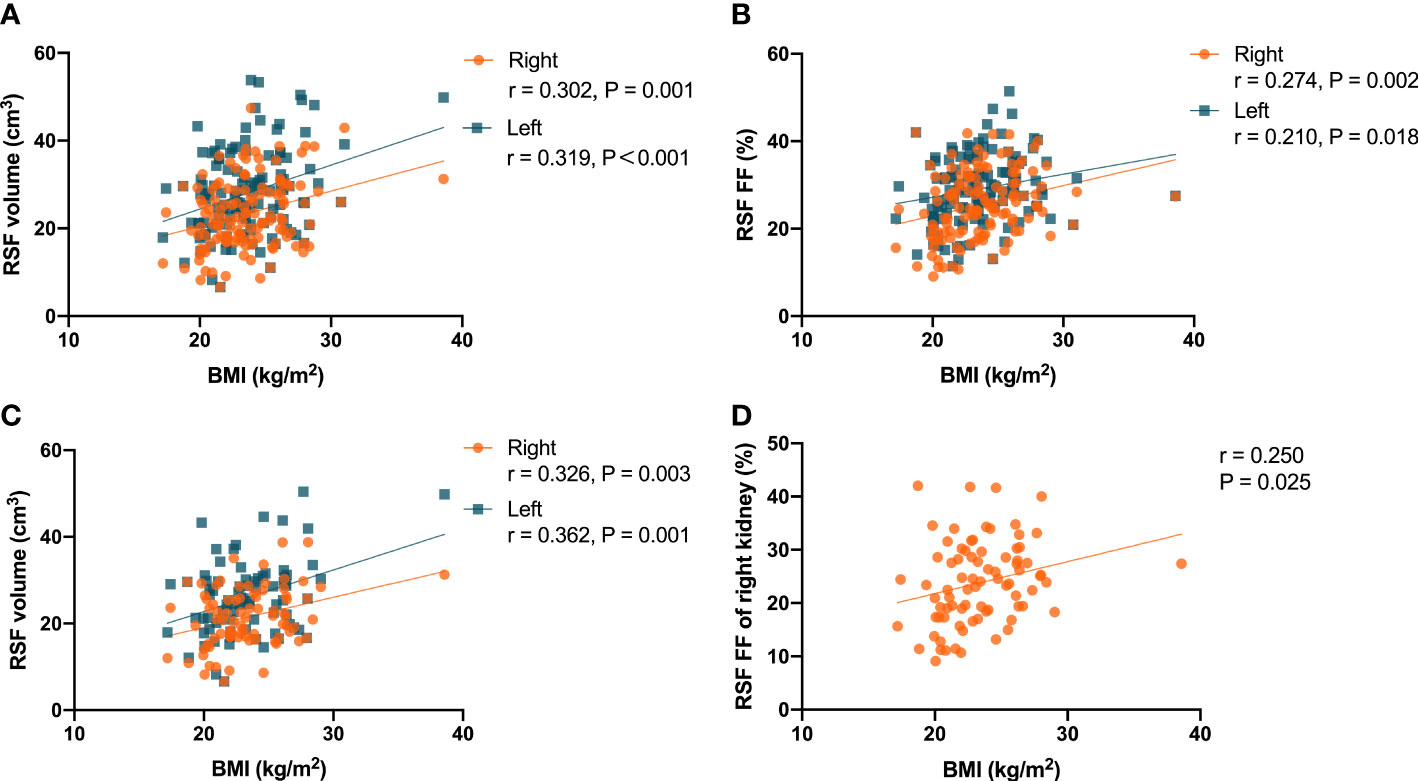
Figure 4 Correlations between the RSF volumes in both kidneys and BMI in the all subjects (A); Correlations between the RSF FFs in both kidneys and BMI in the all subjects (B); Correlations between the RSF volumes in both kidneys and BMI in women subjects (C); Correlation between the RSF FF in right kidney and BMI in women subjects (D).
In women, it was found that there were correlations (P = 0.003, r = 0.326 for right kidney, and P = 0.001, r = 0.362 for left kidney) between the RSF volumes in both kidneys and BMI (Figure 4C). In addition, it was also found that there was a correlation (P = 0.025, r = 0.250) between the RSF FF in right kidney and BMI, but not for the RSF FF in left kidney (P = 0.138, r = 0.167) (Figure 4D).
However, in men, it was found that there was no correlation (P = 0.120, r = 0.232 for right kidney, and P = 0.160, r = 0.213 for left kidney) between the RSF volumes in both kidneys and BMI. In addition, there was no correlation (P = 0.073, r = 0.267 for right kidney, and P = 0.079, r = 0.262 for left kidney) between the RSF FFs in both kidneys and BMI.
It was found that there was no significant correlation in the overall subjects between the RSF volume and FF in both kidneys and the SAT area.
In women, it was found that there were correlations (P = 0.023, r = 0.253 for right kidney, and P = 0.037, r = 0.234 for left kidney) between the RSF volumes in both kidneys and the SAT area (Figure 5A). In addition, it was found that there were correlations (P = 0.002, r = 0.343 for right kidney, and P = 0.013, r = 0.276 for left kidney) between the RSF FFs in both kidneys and the SAT area (Figure 5B).
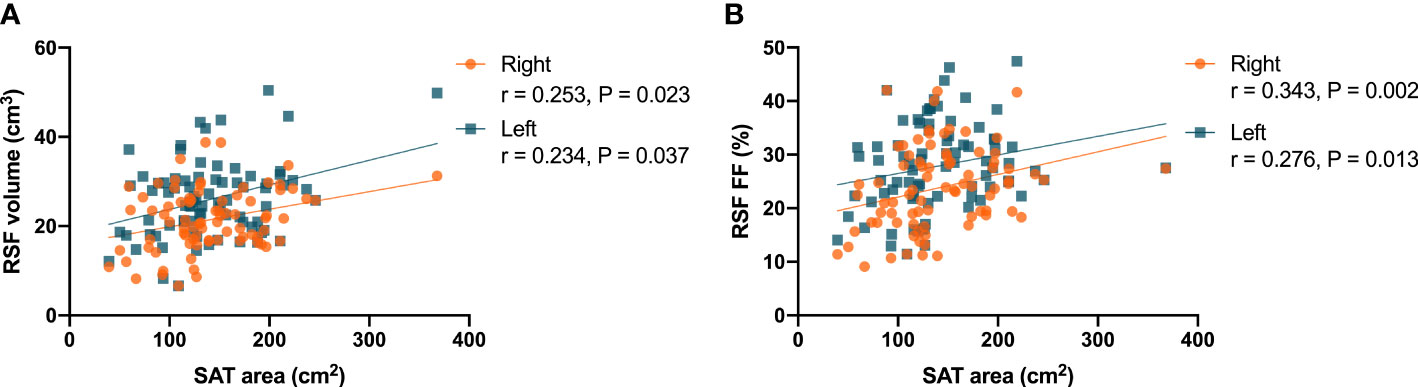
Figure 5 Correlations between the RSF volumes in both kidneys and the SAT area (A) in women; Correlations between the RSF FFs in both kidneys and the SAT area (B) in women.
However, in men, it was found that there was no significant correlation between the RSF volumes and FFs in both kidneys and the SAT area.
It was found that there were correlations (P < 0.001, r = 0.458 for right kidney, and P < 0.001, r = 0.456 for left kidney) in the overall subjects between the RSF volumes in both kidneys and the VAT area (Figure 6A). In addition, it was also found that there were correlations (P < 0.001, r = 0.604 for right kidney, and P < 0.001, r = 0.529 for left kidney) in the overall subjects between the RSF FFs in both kidneys and the VAT area (Figure 6B).
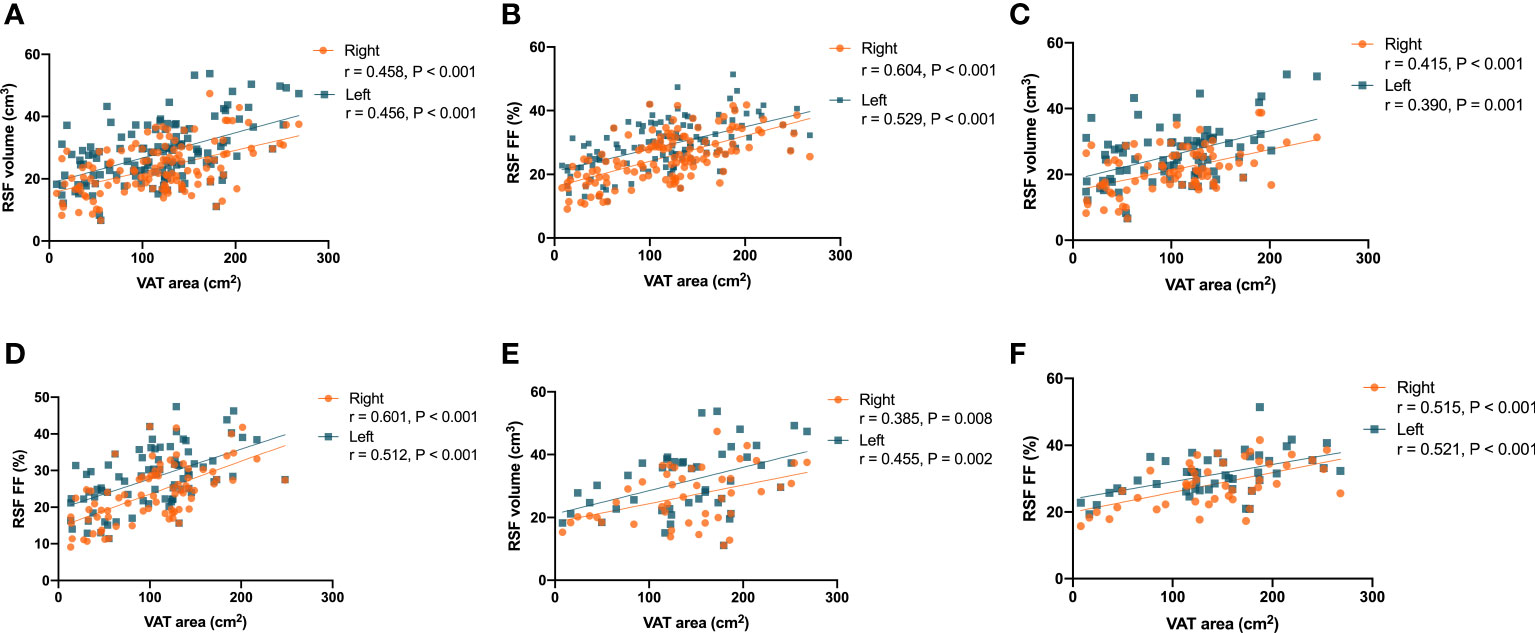
Figure 6 Correlations between the RSF volumes in both kidneys and the VAT area in the overall subjects (A); Correlations between the RSF FFs in both kidneys and the VAT area in the overall subjects (B); Correlations between the RSF volumes in both kidneys and the VAT area in women (C); Correlations between the RSF FFs in both kidneys and the VAT area in women (D); Correlations between the RSF volumes in both kidneys and the VAT area in men (E); Correlations between the RSF FFs in both kidneys and the VAT area in men (F).
The correlations between RSF volumes and FFs in both kidneys of different genders and the VAT area were similar to that observed in the total study population. In women, it was found that there were correlations (P < 0.001, r = 0.415 for right kidney, and P = 0.001, r = 0.390 for left kidney) between the RSF volumes in both kidneys and the VAT area (Figure 6C). In addition, it was also found that there were correlations (P < 0.001, r = 0.601 for right kidney, and P < 0.001, r = 0.512 for left kidney) between the RSF FFs in both kidneys and the VAT area (Figure 6D).
In men, it was found that there were correlations (P = 0.008, r = 0.385 for right kidney, and P = 0.002, r = 0.455 for left kidney) between the RSF volumes in both kidneys and the VAT area (Figure 6E). In addition, it was also found that there were correlations (P < 0.001, r = 0.515 for right kidney, and P < 0.001, r = 0.521 for left kidney) between the RSF FFs in both kidneys and the VAT area (Figure 6F).
It was found that there were correlations (P = 0.005, r = 0.248 for right kidney, and P = 0.007, r = 0.237 for left kidney) in the overall subjects between the RSF volumes in both kidneys and the hepatic fat fraction (Figure 7A). In addition, it was also found that there were correlations (P < 0.001, r = 0.333 for right kidney, and P < 0.001, r = 0.334 for left kidney) in the overall subjects between the RSF FFs in both kidneys and the hepatic fat fraction (Figure 7B).
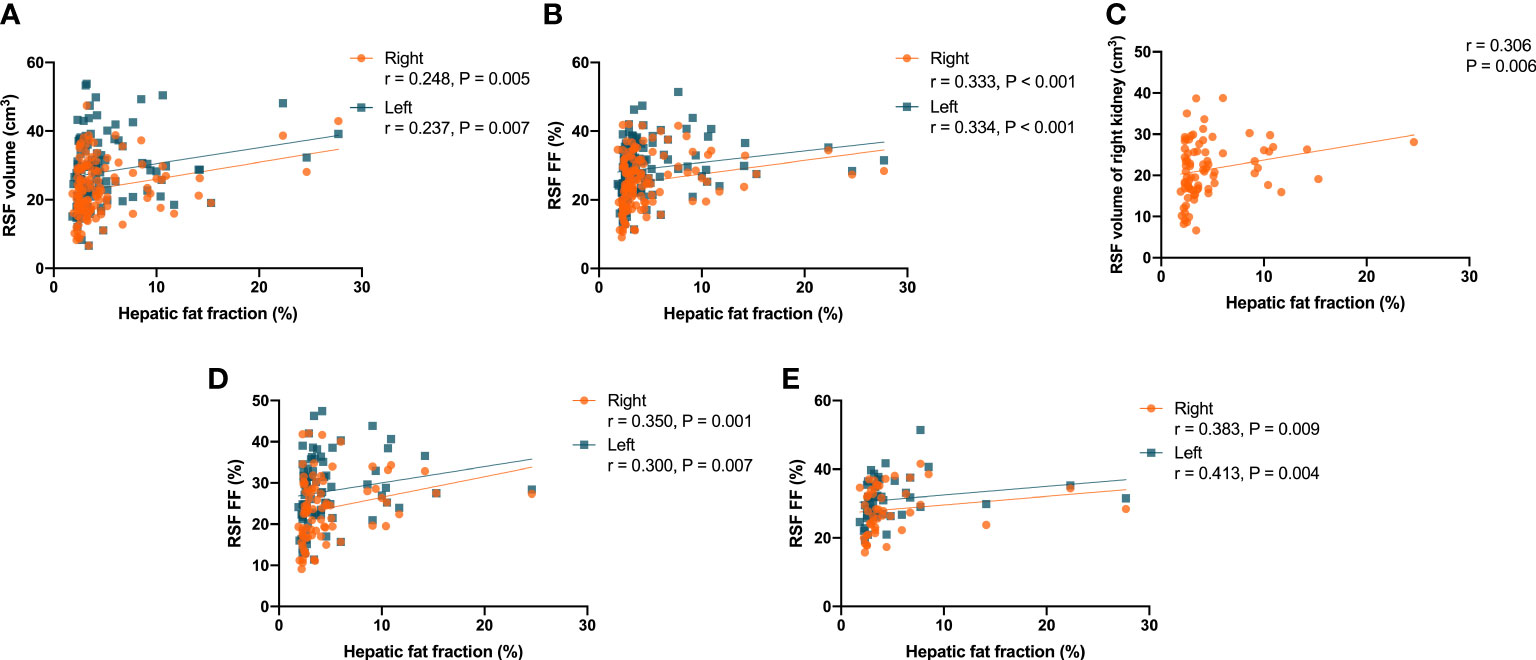
Figure 7 Correlations between the RSF volumes in both kidneys and the hepatic fat fraction in the overall subjects (A); Correlations between the RSF FFs in both kidneys and the hepatic fat fraction in the overall subjects (B); Correlation between the RSF volume in right kidney and the hepatic fat fraction in women (C); Correlations between the RSF FFs in both kidneys and the hepatic fat fraction in women (D); Correlations between the RSF FFs in both kidneys and the hepatic fat fraction in men (E).
In women, it was found that there was a correlation (P = 0.006, r = 0.306) between the RSF volume in right kidney and the hepatic fat fraction, but not for the RSF volume in left kidney (P = 0.070, r = 0.203) (Figure 7C). In addition, it was also found that there were correlations (P = 0.001, r = 0.350 for right kidney, and P = 0.007, r = 0.300 for left kidney) between the RSF FFs in both kidneys and the hepatic fat fraction (Figure 7D).
However, in men, it was found that there was no correlation between the RSF volumes in both kidneys and the hepatic fat fraction. Yet, it was found that there were correlations (P = 0.009, r = 0.383 for right kidney, and P = 0.004, r = 0.413 for left kidney) between the RSF FFs in both kidneys and the hepatic fat fraction (Figure 7E).
It was found that there were correlations (P < 0.001, r = 0.317 for right kidney, and P = 0.001, r = 0.294 for left kidney) between the RSF volumes in both kidneys and the pancreatic fat fraction in the overall subjects (Figure 8A). In addition, it was also found that there were correlations (P < 0.001, r = 0.490 for right kidney, and P < 0.001, r = 0.438 for left kidney) in the overall subjects between the RSF FFs in both kidneys and the pancreatic fat fraction (Figure 8B).
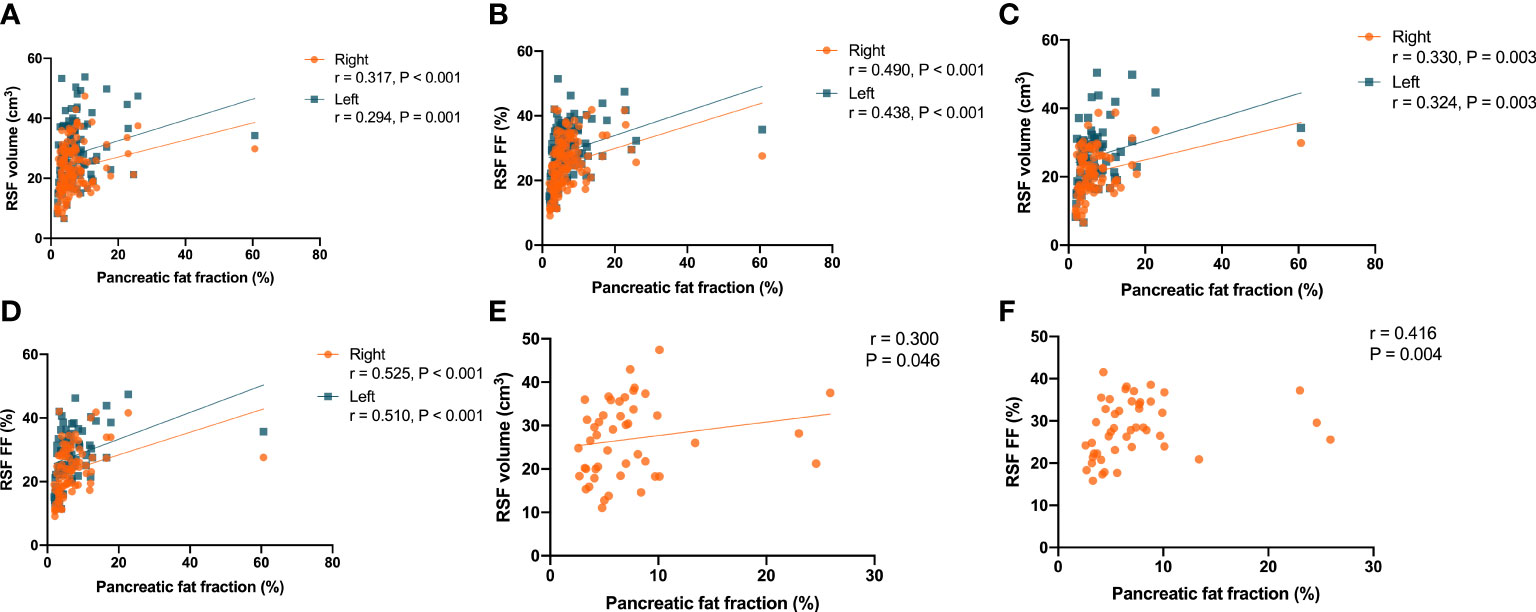
Figure 8 Correlations between the RSF volumes in both kidneys and the pancreatic fat fraction in the overall subjects (A). Correlations between the RSF FFs in both kidneys and the pancreatic fat fraction in the overall subjects (B). Correlations between the RSF volumes in both kidneys and the pancreatic fat fraction in women (C). Correlations between the RSF FFs in both kidneys and the pancreatic fat fraction in women (D). Correlation between the RSF volume in right kidney and the pancreatic fat fraction in men (E). Correlation between the RSF FF in right kidney and the pancreatic fat fraction in men (F).
The correlations between RSF volumes and FFs in both kidneys and the VAT area in women were similar to that observed in the overall subjects. it was found that there were correlations (P = 0.003, r = 0.330 for right kidney, and P = 0.003, r = 0.324 for left kidney) between the RSF volumes in both kidneys and the pancreatic fat fraction (Figure 8C). In addition, it was also found that there were correlations (P < 0.001, r = 0.525 for right kidney, and P < 0.001, r = 0.510 for left kidney) between the RSF FFs in both kidneys and the pancreatic fat fraction (Figure 8D).
However, in men, it was found that there was only a correlation (P = 0.046, r = 0.300) between the RSF volume in right kidney and the pancreatic fat fraction, but not for the RSF volume in left kidney (P = 0.141, r = 0.221) (Figure 8E). In addition, it was found that there was a correlation (P = 0.004, r = 0.416) between the RSF FF in right kidney and the pancreatic fat fraction, but not for the RSF FF in left kidney (P = 0.141, r = 0.221) (Figure 8F).
It was found that the RSF volumes (cm3) were 23.38 ± 8.06 for right and 28.07 ± 9.58 for left kidneys, and RSF FFs (%) were 25.41 ± 7.68 for right and 29.09 ± 7.68 for left kidneys in overall subjects. In addition, we found that the RSF volumes (cm3) were 21.47 ± 6.90 for right and 26.03 ± 8.55 for left kidneys, and RSF FFs (%) were 23.82 ± 7.74 for right and 27.92 ± 8.15 for left kidneys in women; and the RSF volumes (cm3) were 26.86 ± 8.81 for right and 31.62 ± 10.32 for left kidneys, and RSF FFs (%) were 28.23 ± 6.73 for right and 31.21 ± 6.29 for left kidneys in men. The RSF volume and FF of left kidney were significantly larger than those of the right kidney in overall subjects or in different gender groups separately (all P < 0.05, Figure 9).
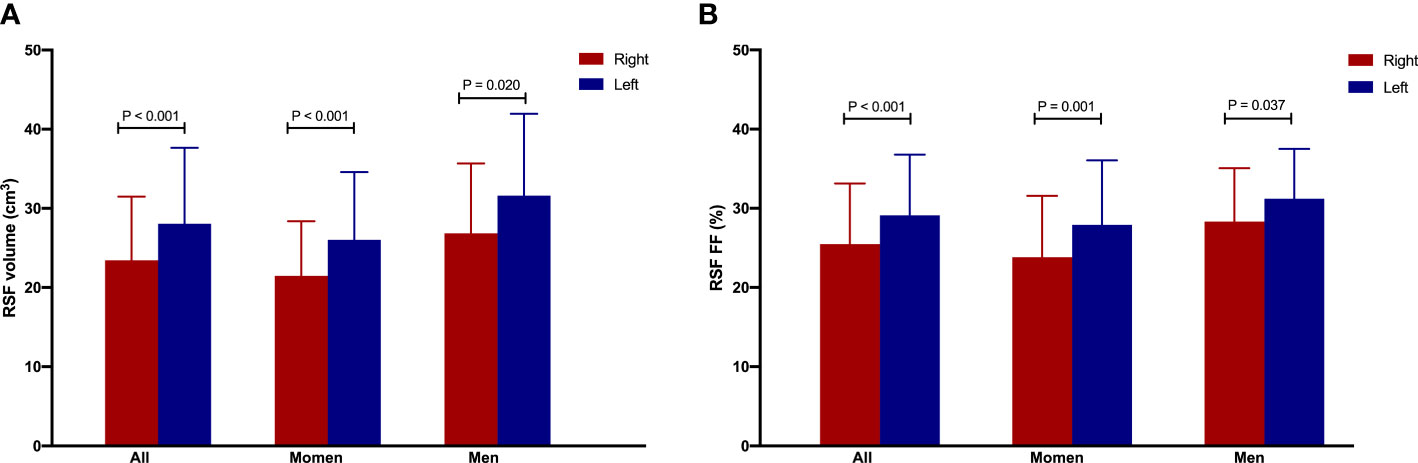
Figure 9 The RSF volume (A) and FF (B) of left kidney were significantly larger than those of the right kidney in overall subjects or in women or men group separately.
This study yielded several outcomes. First, the RSF volume and FF values of both kidneys in men were significantly higher than those in women, but the differences were not independent of VAT area (except for right RSF volume). Second, there were significant correlations of the RSF volume and FF values in both kidneys with the age, BMI, VAT area, hepatic fat fraction and pancreatic fat fraction in the overall subjects, but not with SAT area. Yet, patterns of these correlations were varied by genders. Finally, we also found that the RSF volume and FF values of left kidney were significantly higher than those of the right kidney in the overall, regardless of gender.
Adipose tissue located in different body compartments may play distinct roles and contribute to comorbidities through unique pathophysiological mechanisms (22). The renal calyces, renal pelvis, and blood vessels were surrounded by varied amounts of adipose tissue in the renal sinus. In the metabolically benign condition, RSF was beneficial to glomerular cells, and it may promote regeneration and anti-fibrosis effects, and reduce the release of pro-inflammatory factors by endothelial cells and podocytes. However, in a metabolically malignant condition, first, excessive fat accumulation in the RS would result in increased intra-abdominal pressure and compression of structures within the RS, which increases renal hydrostatic pressure and activates the renin–angiotensin–aldosterone system (RAAS). Activation of the RAAS promotes hypertension, insulin resistance, atherosclerosis, and other adverse physiological effects related to obesity (23, 24). In addition, as an ectopic perivascular fat, RSF has the paracrine effect of secreting inflammatory cytokines and vasoconstrictive factors, which could lead to local inflammation, oxidative stress, lipotoxicity and fibrosis (3). Findings from the Framingham Heart Study has revealed that RSF was related to multiple cardiometabolic risk factors (20). It was found that RSF, as a perivascular fat depot in close contact with the adventitia of large, medium, and small arteries, has unique features that differ from other fat depots, and undergoes changes early in the development of metabolic diseases (10). Krievina et al. (4) found that the RSF was directly related to the early renal injury markers Skim-1 and FGF-21. Lee et al. (5) revealed that both metabolic syndrome and obesity were associated with lower RSF fat attenuation index. A randomized controlled trial demonstrated that increased RSF was directly associated with hypertension (25). Recently, it was also found that the accumulation of RSF seems to be involved in the pathogenesis of hypertension in obesity, and following bariatric surgery, loss of RSF was associated with remission from hypertension (1). Therefore, it is important to quantitatively assess RSF in normal participants and explore its relationship with ectopic fat deposition for early intervention in metabolism-related diseases and renal dysfunction.
Our finding confirmed the conclusions from previous cross-sectional studies (7, 19, 26), which all showed that RSF volume was positively correlated with age in normal subjects. Similarly, in present study, the RSF volume of right kidney and the RSF FFs of both kidneys in the overall subjects, as well as the RSF volume and FF values of both kidneys in women were positively correlated with age. Yet, we did not find any correlation between the RSF volume or FF value of either kidney in men and the age. It could be due to the relatively small sample size, and the race and gender heterogeneity (27–30). These observations may allow clinicians to estimate the age-related RSF volume and FF changes better and help decision making.
Nevertheless, we addressed the associations of and RSF volume and FF values with VAT area, SAT area, hepatic fat fraction, and pancreatic fat fraction. Previous studies have shown that RSF deposition was related to other deleterious fat depots, such as VAT and hepatic fat (8, 10, 20, 31). In our study, we further extended these findings and found that there were correlations of the RSF volumes and FFs in both kidneys with VAT area, hepatic fat fraction and pancreatic fat fraction in the overall subjects. VAT has the strong lipolytic activity (32), leading to hepatic and pancreatic steatosis (33, 34), and RSF is also considerably affected by VAT (35). These findings suggested that RSF may cluster with high amounts of VAT, hepatic and pancreatic fat, thus possibly contributing to their increased risk for related metabolic diseases as they grow up. However, we did not detect any association between RSF and SAT area. Similar findings can also be showed in studies on pancreatic fat infiltration and hepatic fat infiltration (15, 36). We thought that this may be attributed to the differences in metabolism between SAT and VAT, and that excess VAT is unhealthier than excess SAT (37). Contrary to our results, Yalçın et al. (9) found an association between the RSF and SAT. The different ranges of age, VAT and SAT may be the reasons for inconsistent results, and further studies are needed to more accurately explain the relationship between RSF and VAT, SAT.
We subsequently elucidated the effect of gender on RSF volume and FF. It was found that RSF volume and FF were higher in men than that in women, but the differences were not independent of VAT area (except for right RSF volume). Additionally, it is worth noting that the patterns of correlations between RSF and age, BMI as well as ectopic adipose tissue varied by gender.
At present, the underlying mechanism of the discrepancies in RSF between men and women is unclear, but may be associated with the following reasons: (1) Kidney volume: Previous results showed that renal parenchymal volume was related with body size (38, 39). The increase in renal parenchymal volume in proportion to body size during development results from nephron hypertrophy is presumably to response to the greater metabolic demand of a larger body size (40, 41). It had been found that RSF volume was associated with renal parenchyma volume (7), and previous studies have also found that both kidney volumes in men were significantly larger than those in women (6, 19, 42). In the current study, there was larger height and weight in men than those in women, which may result in larger RSF in men. (2) Different types of obesity: previous studies have indicated that body fat distribution varies by gender (43), and males exhibit a greater propensity to more VAT, whereas premenopausal females have a predilection for accumulating SAT; however, postmenopausal females are inclined to accrue greater amounts of VAT (44–48). Our findings indicated that, with BMI being equal, males have a higher VAT, whereas females exhibit a higher SAT. It is noteworthy that our multivariate analysis showed that the gender-based difference of RSF is not moderated by the variation in SAT; while, as a component of VAT, RSF differences are largely mediated by the amount of VAT. Interestingly, the difference in the right RSF volume between males and females is not influenced by VAT, and it may be an independent indicator for evaluating gender differences in obesity. (3) Sex hormones: sex hormones play a key role in the distribution pattern of adipose tissue (49). Estrogens regulate energy balance in adipose tissue, acting on both lipogenesis and lipolysis processes to affect the expansion and remodeling of adipose tissue (50). Estrogens have also been shown to enhance the storage of SAT but not VAT, and the elevated accumulation of VAT observed in postmenopausal women may be attributed to the decline of estrogen levels (46, 50, 51).
Additionally, our study showed that the RSF volume of the left kidney was significantly larger than that of the right kidney, and the result was consistent with previous studies. Cross-sectional studies revealed that there was more RSF accumulated in the left RS than right RS (4, 26). Especially, we further found that the RSF FF of left kidney was significantly higher than that of the right kidney in overall subjects. The reason may be that the asymmetric accumulation of RSF could be result of anatomical differences between the left and right renal veins (4). The right renal vein receives blood from the right kidney only, but the left renal vein receives blood from the left renal vein as well as the left gonadal and adrenal veins (52). The average left renal blood flow demonstrated a significant reduction relative to the average right renal blood flow. Additionally, there existed a substantial variation in the orientation of the calyces, given that the angles of the calyces in the right and left renal organs exhibit notable dissimilarities (53). A potential hypothesis for the notable increase in RSF accumulation in the left kidney is the presence of an innate structural phenomenon that may result in asymmetrical blood flow to the renal organs (4).
The strength of our study is that we incorporated the highly reproducible qualitative and quantitative measures of RSF by MRI fat fraction mapping and investigated the associations of RSF with age, gender, BMI and ectopic fat deposition. MRI fat fraction mapping by IDEAL-IQ is rapid, fairly accurate, non-invasive and relatively easy to perform, and it has been widely used in clinical applications. In our study, we showed that the quality as well as quantity of adipose tissue in RSF measured on MRI scans are associated with age, gender, BMI and ectopic fat deposition and to establish the RSF volume and FF population data of normal subjects in China. Especially, because the quality of adipose tissue can be reflected as FF on MRI fat fraction maps, it can be assumed that significantly higher FF values may suggest dysfunctional adipose tissue (11).
However, there were several limitations to our study. First, this retrospective study could not infer cause and effect, and a longitudinal study would be necessary to investigate the progression of RSF with age and obesity in healthy volunteers. Second, the RSF was manually segmented, which was time-consuming and subjectively dependent. In future studies, the automatic segmentation method should be explored. Third, our study sample was composed of normal Chinese subjects, so it may limit the generalization of our results to other racial population. Finally, the enrolled subjects were relatively small, and we still need to increase the sample size to provide more reliable data support for our findings. Fourth, subsequent research should explore deeper the association between RSF volume, FF and kidney diseases and metabolic disorders.
In this study, we demonstrated that the RSF volume and FF values of both kidneys in men were significantly higher than those of women. And the RSF volume and FF values of left kidney were significantly higher than those of the right kidney. In addition, there were significant correlations observed for the RSF volume and FF values in both kidneys with BMI, VAT area, hepatic fat fraction and pancreatic fat fraction in the overall subjects, but not with the SAT area. However, the patterns of these correlations varied by gender. These findings may help establish a consensus on the normal values of RSF volume and FF for the Chinese population. This will facilitate the identification of clinicopathological changes and aid in the investigation of whether RSF volume and FF can serve as early biomarkers for metabolic diseases and renal dysfunction in future studies.
The raw data supporting the conclusions of this article will be made available by the authors, without undue reservation.
The studies involving human participants were reviewed and approved by First Affiliated Hospital of Dalian Medical University. Written informed consent for participation was not required for this study in accordance with the national legislation and the institutional requirements. Written informed consent was not obtained from the individual(s) for the publication of any potentially identifiable images or data included in this article.
In this work, XF participated in the data collection and analysis, and participated in the writing and revision of the article, actively cooperated with all aspects of the work and agreed to finally approved the version to be published. All authors had substantial contributions (1) to conception and design, acquisition of data, or analysis and interpretation of data (2), drafting the article or revising it critically for important intellectual content, and (3) final approval of the version to be published.
The authors declare that the research was conducted in the absence of any commercial or financial relationships that could be construed as a potential conflict of interest.
All claims expressed in this article are solely those of the authors and do not necessarily represent those of their affiliated organizations, or those of the publisher, the editors and the reviewers. Any product that may be evaluated in this article, or claim that may be made by its manufacturer, is not guaranteed or endorsed by the publisher.
RS, renal sinus; RSF, renal sinus fat; T2DM, type 2 diabetes mellitus; GFR, glomerular filtration rate; CT, computed tomography; MRI, magnetic resonance imaging; IDEAL-IQ, iterative decomposition of water and fat with echo asymmetry at least-square estimation-iron quantification; FF, fat fraction; BMI, body mass index; VAT, visceral adipose tissue; SAT, subcutaneous adipose tissue; ICC, intraclass correlation coefficient; RAAS, renin–angiotensin–aldosterone system.
1. Moritz E, Dadson P, Saukko E, Honka MJ, Koskensalo K, Seppälä K, et al. Renal sinus fat is expanded in patients with obesity and/or hypertension and reduced by bariatric surgery associated with hypertension remission. Metabolites (2022) 12:617. doi: 10.3390/metabo12070617
2. Abdeldayem EH, Mansour MG, Raief Mosaad BM. Measurement of the surface area of the renal sinus fat using MDCT: correlation with presence and severity of essential hypertension and body mass index. J Belg Soc Radiol (2022) 106:91. doi: 10.5334/jbsr.2776
3. Foster MC, Hwang SJ, Porter SA, Massaro JM, Hoffmann U, Fox CS. Fatty kidney, hypertension, and chronic kidney disease: the framingham heart study. Hypertension (2011) 58:784–90. doi: 10.1161/HYPERTENSIONAHA.111.175315
4. Krievina G, Tretjakovs P, Skuja I, Silina V, Keisa L, Krievina D, et al. Ectopic adipose tissue storage in the left and the right renal sinus is asymmetric and associated with serum kidney injury molecule-1 and fibroblast growth factor-21 levels increase. EBioMedicine (2016) 13:274–83. doi: 10.1016/j.ebiom.2016.10.020
5. Lee EJ, Cho NJ, Kim H, Nam B, Jeon JS, Noh H, et al. Abdominal periaortic and renal sinus fat attenuation indices measured on computed tomography are associated with metabolic syndrome. Eur Radiol (2022) 32:395–404. doi: 10.1007/s00330-021-08090-7
6. Spit KA, Muskiet MHA, Tonneijck L, Smits MM, Kramer MHH, Joles JA, et al. Renal sinus fat and renal hemodynamics: a cross-sectional analysis. MAGMA (2020) 33:73–80. doi: 10.1007/s10334-019-00773-z
7. Lin L, Dekkers IA, Huang L, Tao Q, Paiman EHM, Bizino MB, et al. Renal sinus fat volume in type 2 diabetes mellitus is associated with glycated hemoglobin and metabolic risk factors. J Diabetes Complications (2021) 35:107973. doi: 10.1016/j.jdiacomp.2021.107973
8. Doğan E, Bacaksızlar Sarı F. Is fat deposition of renal sinus a concomitant finding to fatty liver disease? the first study regarding the relationship between kidney and liver fat content with non-contrast computed tomography. Spartan Med Res J (2022) 7:32411. doi: 10.51894/001c.32411
9. Yalçın K, Elibol Ö. The relationship between renal sinus lipomatosis detected at abdominal computed tomography and abdominal visceral and subcutaneous fat accumulation and metabolic risk factors. Pol J Radiol (2020) 85:e62–6. doi: 10.5114/pjr.2020.93429
10. Notohamiprodjo M, Goepfert M, Will S, Lorbeer R, Schick F, Rathmann W, et al. Renal and renal sinus fat volumes as quantified by magnetic resonance imaging in subjects with prediabetes, diabetes, and normal glucose tolerance. PloS One (2020) 15:e0216635. doi: 10.1371/journal.pone.0216635
11. Zhang QH, Xie LH, Zhang HN, Liu JH, Zhao Y, Chen LH, et al. Magnetic resonance imaging assessment of abdominal ectopic fat deposition in correlation with cardiometabolic risk factors. Front Endocrinol (Lausanne) (2022) 13:820023. doi: 10.3389/fendo.2022.820023
12. Kipp JP, Olesen SS, Mark EB, Frederiksen LC, Drewes AM, Frøkjær JB. Normal pancreatic volume in adults is influenced by visceral fat, vertebral body width and age. Abdom Radiol (NY) (2019) 44:958–66. doi: 10.1007/s00261-018-1793-8
13. Sato T, Ito K, Tamada T, Sone T, Noda Y, Higaki A, et al. Age-related changes in normal adult pancreas: MR imaging evaluation. Eur J Radiol (2012) 81:2093–8. doi: 10.1016/j.ejrad.2011.07.014
14. Guo Z, Blake GM, Graffy PM, Sandfort V, Summers RM, Li K, et al. Hepatic steatosis: CT-based prevalence in adults in China and the united states and associations with age, sex, and body mass index. AJR Am J Roentgenol (2022) 218:846–57. doi: 10.2214/AJR.21.26728
15. Gursoy Coruh A, Uzun C, Akkaya Z, Halil Elhan A. The relation of CT quantified pancreatic fat index with visceral adiposity and hepatic steatosis. Turk J Surg (2020) 36:241–8. doi: 10.47717/turkjsurg.2020.4877
16. Yang W, Xie Y, Song B, Xia C, Tang C, Li J. Effects of aging and menopause on pancreatic fat fraction in healthy women population: a strobe-compliant article. Med (Baltimore) (2019) 98:e14451. doi: 10.1097/MD.0000000000014451
17. Li J, Xie Y, Yuan F, Song B, Tang C. Noninvasive quantification of pancreatic fat in healthy male population using chemical shift magnetic resonance imaging: effect of aging on pancreatic fat content. Pancreas (2011) 40:295–9. doi: 10.1097/MPA.0b013e318201669f
18. Gilsanz V, Chung SA, Kaplowitz N. Differential effect of gender on hepatic fat. Pediatr Radiol (2011) 41:1146–53. doi: 10.1007/s00247-011-2021-7
19. Caglar V, Songur A, Acar M, Uygur R, Alkoc OA, Acar T. Volumetric evaluation of fat in the renal sinus in normal subjects using stereological method on computed tomography images and its relationship with body composition. Folia Morphol (Warsz) (2014) 73:302–8. doi: 10.5603/FM.2014.0016
20. Lee JJ, Pedley A, Hoffmann U, Massaro JM, Levy D, Long MT. Visceral and intrahepatic fat are associated with cardiometabolic risk factors above other ectopic fat depots: the framingham heart study. Am J Med (2018) 131:684–692.e12. doi: 10.1016/j.amjmed.2018.02.002
21. McMahon RS, Penfold D, Bashir K. Anatomy, abdomen and pelvis: kidney collecting ducts. Treasure Island (FL: StatPearls Publishing (2022).
22. Ferrara D, Montecucco F, Dallegri F, Carbone F. Impact of different ectopic fat depots on cardiovascular and metabolic diseases. J Cell Physiol (2019) 234:21630–41. doi: 10.1002/jcp.28821
23. Ott CE, Navar LG, Guyton AC. Pressures in static and dynamic states from capsules implanted in the kidney. Am J Physiol (1971) 221:394–400. doi: 10.1152/ajplegacy.1971.221.2.394
24. Dwyer TM, Mizelle HL, Cockrell K, Buhner P. Renal sinus lipomatosis and body composition in hypertensive, obese rabbits. Int J Obes Relat Metab Disord (1995) 19:869–74.
25. Zelicha H, Schwarzfuchs D, Shelef I, Gepner Y, Tsaban G, Tene L, et al. Changes of renal sinus fat and renal parenchymal fat during an 18-month randomized weight loss trial. Clin Nutr (2018) 37:1145–53. doi: 10.1016/j.clnu.2017.04.007
26. Lin P, Min Z, Wei G, Lei H, Feifei Z, Yunfei Z. Volumetric evaluation of renal sinus adipose tissue on computed tomography images in bilateral nephrolithiasis patients. Int Urol Nephrol (2020) 52:1027–34. doi: 10.1007/s11255-020-02395-0
27. Lê KA, Ventura EE, Fisher JQ, Davis JN, Weigensberg MJ, Punyanitya M, et al. Ethnic differences in pancreatic fat accumulation and its relationship with other fat depots and inflammatory markers. Diabetes Care (2011) 34:485–90. doi: 10.2337/dc10-0760
28. Bidulescu A, Liu J, Hickson DA, Hairston KG, Fox ER, Arnett DK, et al. Gender differences in the association of visceral and subcutaneous adiposity with adiponectin in African americans: the Jackson heart study. BMC Cardiovasc Disord (2013) 13:9. doi: 10.1186/1471-2261-13-9
29. Tanaka S, Horimai C, Katsukawa F. Ethnic differences in abdominal visceral fat accumulation between Japanese, African-americans, and caucasians: a meta-analysis. Acta Diabetol (2003) 40 Suppl 1:S302–4. doi: 10.1007/s00592-003-0093-z
30. Sumner AE, Farmer NM, Tulloch-Reid MK, Sebring NG, Yanovski JA, Reynolds JC, et al. Sex differences in visceral adipose tissue volume among African americans. Am J Clin Nutr (2002) 76:975–9. doi: 10.1093/ajcn/76.5.975
31. Couch CA, Fowler LA, Goss AM, Gower BA. Associations of renal sinus fat with blood pressure and ectopic fat in a diverse cohort of adults. Int J Cardiol Cardiovasc Risk Prev (2022) 16:200165. doi: 10.1016/j.ijcrp.2022.200165
32. Arderiu G, Mendieta G, Gallinat A, Lambert C, Díez-Caballero A, Ballesta C, et al. Type 2 diabetes in obesity: a systems biology study on serum and adipose tissue proteomic profiles. Int J Mol Sci (2023) 24:827. doi: 10.3390/ijms24010827
33. Sarma MK, Saucedo A, Darwin CH, Felker ER, Umachandran K, Kohanghadosh D, et al. Noninvasive assessment of abdominal adipose tissues and quantification of hepatic and pancreatic fat fractions in type 2 diabetes mellitus. Magn Reson Imaging (2020) 72:95–102. doi: 10.1016/j.mri.2020.07.001
34. Ahmed B, Sultana R, Greene MW. Adipose tissue and insulin resistance in obese. BioMed Pharmacother (2021) 137:111315. doi: 10.1016/j.biopha.2021.111315
35. Stefan N, Häring HU, Hu FB, Schulze MB. Metabolically healthy obesity: epidemiology, mechanisms, and clinical implications. Lancet Diabetes Endocrinol (2013) 1:152–62. doi: 10.1016/S2213-8587(13)70062-7
36. Choi MH, Choi JI, Park MY, Rha SE, Oh SN, Jung SE, et al. Validation of intimate correlation between visceral fat and hepatic steatosis: quantitative measurement techniques using CT for area of fat and MR for hepatic steatosis. Clin Nutr (2018) 37:214–22. doi: 10.1016/j.clnu.2016.12.006
37. Neeland IJ, Ayers CR, Rohatgi AK, Turer AT, Berry JD, Das SR, et al. Associations of visceral and abdominal subcutaneous adipose tissue with markers of cardiac and metabolic risk in obese adults. Obes (Silver Spring) (2013) 21:E439–47. doi: 10.1002/oby.20135
38. Johnson S, Rishi R, Andone A, Khawandi W, Al-Said J, Gletsu-Miller N, et al. Determinants and functional significance of renal parenchymal volume in adults. Clin J Am Soc Nephrol (2011) 6:70–6. doi: 10.2215/CJN.00030110
39. Zewdu M, Kadir E, Berhane M, Alemayehu T. Variation of ultrasonic renal volume between hypertensive and non-hypertensive individuals in relation to body size parameters. Ethiop J Health Sci (2021) 31:857–66. doi: 10.4314/ejhs.v31i4.21
40. Nyengaard JR, Bendtsen TF. Glomerular number and size in relation to age, kidney weight, and body surface in normal man. Anat Rec (1992) 232:194–201. doi: 10.1002/ar.1092320205
41. Kasiske BL, Umen AJ. The influence of age, sex, race, and body habitus on kidney weight in humans. Arch Pathol Lab Med (1986) 110:55–60. doi: 10.1016/s0022-5347(17)44803-8
42. Roseman DA, Hwang SJ, Oyama-Manabe N, Chuang ML, O'Donnell CJ, Manning WJ, et al. Clinical associations of total kidney volume: the framingham heart study. Nephrol Dial Transplant (2017) 32:1344–50. doi: 10.1093/ndt/gfw237
43. Boulet N, Briot A, Galitzky J, Bouloumié A. The sexual dimorphism of human adipose depots. Biomedicines (2022) 10:2615. doi: 10.3390/biomedicines10102615
44. Palmer BF, Clegg DJ. The sexual dimorphism of obesity. Mol Cell Endocrinol (2015) 402:113–9. doi: 10.1016/j.mce.2014.11.029
45. Schorr M, Dichtel LE, Gerweck AV, Valera RD, Torriani M, Miller KK, et al. Sex differences in body composition and association with cardiometabolic risk. Biol Sex Differ (2018) 9:28. doi: 10.1186/s13293-018-0189-3
46. Frank AP, de Souza Santos R, Palmer BF, Clegg DJ. Determinants of body fat distribution in humans may provide insight about obesity-related health risks. J Lipid Res (2019) 60:1710–9. doi: 10.1194/jlr.R086975
47. Li H, Konja D, Wang L, Wang Y. Sex differences in adiposity and cardiovascular diseases. Int J Mol Sci (2022) 23:9338. doi: 10.3390/ijms23169338
48. Zeng Q, Wang L, Dong S, Zha X, Ran L, Li Y, et al. CT-derived abdominal adiposity: distributions and better predictive ability than BMI in a nationwide study of 59,429 adults in China. Metabolism (2021) 115:154456. doi: 10.1016/j.metabol.2020.154456
49. Singh P, Covassin N, Marlatt K, Gadde KM, Heymsfield SB. Obesity, body composition, and sex hormones: implications for cardiovascular risk. Compr Physiol (2021) 12:2949–93. doi: 10.1002/cphy.c210014
50. Tao Z, Zheng LD, Smith C, Luo J, Robinson A, Almeida FA, et al. Estradiol signaling mediates gender difference in visceral adiposity via autophagy. Cell Death Dis (2018) 9:309. doi: 10.1038/s41419-018-0372-9
51. Papadakis GE, Hans D, Gonzalez Rodriguez E, Vollenweider P, Waeber G, Marques-Vidal P, et al. Menopausal hormone therapy is associated with reduced total and visceral adiposity: the OsteoLaus cohort. J Clin Endocrinol Metab (2018) 103:1948–57. doi: 10.1210/jc.2017-02449
52. Anjamrooz SH, Azari H, Abedinzadeh M. Abnormal patterns of the renal veins. Anat Cell Biol (2012) 45:57–61. doi: 10.5115/acb.2012.45.1.57
Keywords: renal sinus fat, magnetic resonance imaging, ectopic fat deposition, obesity, fat quantification
Citation: Zhang Q-H, Chen L-H, An Q, Pi P, Dong Y-F, Zhao Y, Wang N, Fang X, Pu R-W, Song Q-W, Lin L-J, Liu J-H and Liu A-L (2023) Quantification of the renal sinus fat and exploration of its relationship with ectopic fat deposition in normal subjects using MRI fat fraction mapping. Front. Endocrinol. 14:1187781. doi: 10.3389/fendo.2023.1187781
Received: 16 March 2023; Accepted: 29 May 2023;
Published: 09 August 2023.
Edited by:
Andrea P. Rossi, Ca’ Foncello Hospital, ItalyCopyright © 2023 Zhang, Chen, An, Pi, Dong, Zhao, Wang, Fang, Pu, Song, Lin, Liu and Liu. This is an open-access article distributed under the terms of the Creative Commons Attribution License (CC BY). The use, distribution or reproduction in other forums is permitted, provided the original author(s) and the copyright owner(s) are credited and that the original publication in this journal is cited, in accordance with accepted academic practice. No use, distribution or reproduction is permitted which does not comply with these terms.
*Correspondence: Ai-Lian Liu, liuailian@dmu.edu.cn
†These authors have contributed equally to this work and share first authorship
Disclaimer: All claims expressed in this article are solely those of the authors and do not necessarily represent those of their affiliated organizations, or those of the publisher, the editors and the reviewers. Any product that may be evaluated in this article or claim that may be made by its manufacturer is not guaranteed or endorsed by the publisher.
Research integrity at Frontiers
Learn more about the work of our research integrity team to safeguard the quality of each article we publish.