 Shawn M. Magrum
 Jaynie Bird3
94% of researchers rate our articles as excellent or good
Learn more about the work of our research integrity team to safeguard the quality of each article we publish.
Find out more
ORIGINAL RESEARCH article
Front. Educ., 25 March 2025
Sec. Digital Learning Innovations
Volume 10 - 2025 | https://doi.org/10.3389/feduc.2025.1528443
This article is part of the Research TopicInteractions and Intersections in Education: Challenges and Trends to foster Learning and WellbeingView all 12 articles
Introduction: Despite the increase of three-dimensional (3D) technological integration into academia, little consideration has been given to the emotional responses of students to such pedagogy. Both pleasant (high valence/sentiment) and unpleasant (low valence/sentiment) emotions influence the cognitive processes involved in learning, and emotional sentiment can be exemplified by particular emoji.
Methods: A survey with 10 facial emoji stratified into three categories (positive, neutral, and negative sentiment) was administered to students completing a human anatomy course with 3D visualization technology (3DVT) and augmented reality (AR) integration. The survey was administered before and after each class session (technology-based learning sessions, non-technology-based learning sessions, and examination sessions) to measure student emotional sentiment. Pre- and post-course questionnaires were also administered to clarify reactions to the technology.
Results: Results indicated that students reported positive and neutral emotions nearly exclusively, although students reported a reduction in emotional sentiment after technology-based learning sessions as compared to after non-technology-based learning sessions (Z = −2.557, p = 0.011). Lower emotional sentiment was associated with the examination sessions as compared to either of the learning session types, and students reported an increase in emotional sentiment after the examination sessions as compared to before the examination sessions (Z = −2.066, p = 0.039).
Discussion: The present study revealed that the 3D technologies elicited primarily neutral or positive emotions, and that the integration of an emoji survey can aid instructors in monitoring student emotional responses to pedagogical interventions.
Emotions are fundamentally intertwined with human behavior and psychological states. It is well accepted that emotions exhibit various components spanning from psychological feelings to physiological states (Pekrun and Linnenbrink-Garcia, 2014). However, decades of scientific research have failed to produce a standardized definition of an emotion since emotions have multiple interrelated components that involve “sets of coordinated psychological processes, including affective, cognitive, physiological, motivational, and expressive components” (Kleinginna and Kleinginna, 1981; Shuman and Scherer, 2014). Additionally, how or whether an emotion is felt or expressed between individuals is influenced by genetic predispositions, emotional development during the lifespan, and particular life circumstances. There is an evolutionary and social basis to emotions as well, and emotions “can be expressed in a variety of ways” (Ekman, 1992; Ellsworth and Scherer, 2003; Izard, 2007; Russell, 2003; Scherer et al., 2001). Thus, it is difficult to isolate or predict the inputs that may result in a specific emotion for a particular individual, and it is oftentimes difficult to predict the expression of a specific emotion. The ability of an emotion to seamlessly transition to another emotion from moment-to-moment further complicates this, as emotions can last from only a few seconds to as long as a few minutes (Guthrie Yarwood, 2022).
In order to measure some of the finer details of emotions, researchers have developed dimensional models which hone in on the “subjective feeling” component of an emotion (Guthrie Yarwood, 2022). The circumplex model of affect was originally developed as a two-dimensional model (Russell, 1980). Although different terms have been used to conceptualize the two dimensions inherent in this understanding of emotion, the two-dimensional model of affect has been validated by multiple studies (Larsen and Diener, 1992; Feldman Barrett and Russell, 1998; Feldman Barrett and Fossum, 2001; Russell, 1980; Watson et al., 1988; Posner et al., 2005). The circumplex model of affect posits that each individual emotion is comprised of two independent, orthogonally-placed dimensions: valence and arousal. Valence represents a “neurophysiological system” indicating the pleasantness of an emotion, whereas arousal, also considered a “neurophysiological system,” indicates the degree of physiological activation (Posner et al., 2005). From this, emotions can be conceived as “patterns of activation” on two independent scales – valence and arousal – coupled with inputs from cognitive appraisals (i.e., thoughts) and associated physiological effects (Posner et al., 2005). Each of these dimensional constructs can be placed on a continuum spanning from one extreme to its opposite extreme; therefore, the construct of valence ranges from pleasantness to unpleasantness, and the construct of arousal ranges from physiological activation to physiological inactivation. A person experiencing an emotion high in valence would be feeling something they consider pleasurable; a person experiencing an emotion high in arousal would be experiencing strong physical sensations in their body (e.g., increased heart rate). Fear, then, could be conceptualized through this lens as a “neurophysiological state typically involving the combination of negative valence and heightened arousal in the [central nervous system]” (Posner et al., 2005). In other words, experiencing the emotion of fear results in unpleasant subjective feelings, coupled with a strong activation of the sympathetic nervous system (e.g., “fight, flight, or freeze” system activation).
Emotion and cognition affect each other (Fiedler and Beier, 2014), as cognition “modulates, activates and inhibits emotion” and emotion “guides and motivates cognition” (Tyng et al., 2017). Piaget and Garcia (1989) similarly reported that “emotions could arise from or interfere with learning” (Chen and Wang, 2011). Specifically, as reported in Tyng et al. (2017) and Um et al. (2012), emotions can affect a variety of learning constructs—namely, attention (Vuilleumier, 2005), learning/memory (Phelps, 2004; Um et al., 2012), reasoning (Jung et al., 2014), problem-solving (Isen et al., 1987; Chen and Wang, 2011; Um et al., 2007), negotiation processing (Isen and Baron, 1991), and decision-making efficiency (Isen and Means, 1983). Studies have concluded that positive emotions enhance student motivation to learn (Erez and Isen, 2002), improve recall of positively-oriented learning material (Isen et al., 1978), boost creativity (Isen et al., 1987; Chen and Wang, 2011; Um et al., 2007), and develop problem-solving abilities (Chen and Wang, 2011; Um et al., 2007). Positive emotions also enhance the willingness to initiate cognitive effort (Efklides et al., 2006) and contribute to effective learning. Fiedler and Beier (2014) state that “task-specific performance can be expected to profit from negative states on accommodative (conservative stimulus-driven bottom-up) tasks and from positive states on assimilative (creative knowledge-driven top-down) tasks.” However, other studies have argued that the presence of negative emotions can detract from learning (Pekrun, 2006; Tyng et al., 2017). An experiment by Oaksford et al. (1996) demonstrated that induced mood states (either positive or negative emotions) resulted in a “reasoning deficit” in a deductive reasoning task. Other studies have argued that induced mood states may not affect working memory capacity directly but may trigger long-term memory retrieval of events that are congruent with the mood state, thereby leaving fewer resources available for the cognitive processing needed for learning (Oaksford et al., 1996; Ellis and Ashbrook, 1988; Ellis et al., 1985; Seibert and Ellis, 1991). A follow-up experiment by Oaksford et al. (1996) demonstrated that participants in an induced positive mood took longer to complete a planning task used to gauge executive functioning of an individual (Tower of London task), indicating that positive mood directly affects the central executive components of working memory. In summary, emotions that are both high in valence (e.g., pleasant feeling emotions) and high in arousal (e.g., physiologically activating emotions) are thought to “facilitate the use of flexible, creative learning strategies”; emotions that are both low in valence (e.g., unpleasant feeling emotions) and high in arousal (e.g., physiologically activating emotions) favor more simplistic learning strategies (Pekrun, 2006). Emotions that are low in arousal (not physiologically activating) lead to “superficial, shallow ways of processing information” (Pekrun, 2006).
Emoji are symbolic representations of faces, people, pets, ideas, or objects used in digital communications which add clarity about emotion to a message (Jones et al., 2020). As of late 2024, nearly 4,000 emoji have been created (Unicode, 2024). Emoji originated in the late 1990s in Japan as an evolution from emoticons, which are symbolically-represented faces using standard keyboard punctuation marks (e.g.,: -) (Bai et al., 2019). Compared to emoticons, emoji are superior in representing facial expressions, as they contain a greater number of cues as to emotional state (e.g., varying presentations of eyes and mouth) (Rodrigues et al., 2018). Swiftkey (2015) studied international emoji users over a four-month-long period and found that nearly 60% of emoji used in digital communications involve the facial emoji, making it the most popular category of emoji. A study by Gantiva et al. (2020) found that communication via facial emoji is comparable to face-to-face communication on a neural level, activating similar neural pathways. Thus, the use of facial emoji can approximate human emotional state, making them powerful communication tools. As an example, an in-classroom activity designed by Brody and Caldwell (2019) rewarded students for being able to communicate a message using only emoji, and students experienced success performing this activity. Emoji are increasingly being applied in many fields, such as in marketing, communication, linguistics, behavioral science, computer science, food consumer research, law, psychology, medicine, health care, and education, in order to elicit emotional responses and garner consumer data (Bai et al., 2019; Jaeger et al., 2019). For example, cartoon-like representations of human faces, very similar in concept to emoji, have been utilized as proxies for different levels of pain on the Wong-Baker FACES pain rating scale for the last several decades (Wong and Baker, 1988), and the Wong-Baker FACES pain rating scale is considered a “well-validated” and reliable scale (Li et al., 2023). In the field of education specifically, emoji are being used in distance learning courses to improve communication (Bai et al., 2019). Several recent studies have worked to identify the specific dimensional qualities (i.e., valence and arousal values) that can be attributed to a particular emoji (Jaeger et al., 2019; Ferré et al., 2023; Kutsuzawa et al., 2022; Schouteten et al., 2023). In particular, a thorough study completed by Jaeger et al. (2019) aimed to quantify the arousal and valence values (on a scale of 1–9) for 33 of the most commonly-used facial emoji. Facial emoji were selected because they are considered the best proxy for emotional expression among the thousands of available emoji (Swiftkey, 2015; Jaeger et al., 2019).
The long-time “gold standard” instructional approach in the field of anatomy has utilized whole-body donors (i.e., cadavers) in tandem with some form of didactic instruction wherein students are subjected to “slideshows with verbal presentations” and “books with two-dimensional images” (Romand et al., 2020; Thomas et al., 2010; Küçük et al., 2016). Put simply, this approach to anatomy education generally involves “lecture, dissection, and demonstration of cadavers” (Shojaei et al., 2022). This methodology has proven effective for learning anatomy, as according to a review conducted by Bergman et al. (2014), “a combination of teaching tools appeared to yield the best [academic] performances” for anatomy students. As in-person instructional time devoted to anatomical education has decreased markedly over the last several decades (Drake et al., 2009; McBride and Drake, 2018), much of students’ learning to identify anatomical structures and comprehend their spatial relationships occurs outside of class time. Unlike whole-body donors (cadavers), 3D digital models are easily portable and accessible with most screened devices. In addition, 3D digital models are capable of accurately displaying spatial relationships without the need to mentally convert views from two-dimensions (2D) to three dimensions—an inherently taxing cognitive process (Triepels et al., 2020). According to Yammine and Violato (2015), “the most obvious advantage of [three-dimensional visualization technology] is the ability to view the spatial relationships between the different anatomical structures from numerous viewpoints and angles.” A study by Tavanti and Lind (2001) indicated that spatial memory may be enhanced when learning in 3D, as compared to learning in 2D. Yammine and Violato (2015) supported this conclusion, as they found that students using three-dimensional visualization technology (3DVT) acquired higher factual and spatial knowledge and perceived the software to be effective for learning. Other qualitative analyses have examined medical students’ perceptions of using 3DVT, who have reported that “3D methods were easier and more enjoyable to use,” and medical students learning via 3DVT generally fared better or equivalent to student learning via traditional instructional methods such as via cadavers and textbooks only (Triepels et al., 2020).
While software developments in 3D digital modeling have been promising as instructional methodology, extended reality (XR) offers a pedagogy for blending the digital world with actual reality. Technologies such as virtual reality (VR) and augmented reality (AR) are included in XR and have been effective in generating learning outcomes equivalent to those achieved when learning anatomy via the traditional means (Zhao et al., 2020; Moro et al., 2021). Researchers have begun turning toward studying immersive VR in education, particularly in visuospatial-oriented fields such as anatomy, as the immersive method allows for the learning of detailed clinical procedures and allows users to perform virtual dissections of anatomical structures with reduced risks and costs. VR is defined as “a technology that allows exploring and manipulating computer-generated real or artificial 3D multimedia environments in real-time” (Zhao et al., 2020) in an isolated, or partially isolated, environment. VR is “typically multi-modal in nature by providing a sense of immersion in the environment through 360° visuals by aid of a [head-mounted device], auditory stimulation through the use of earphones, and increasingly the proprioception of limbs by way of controllers and tracking” (Hamilton et al., 2021). VR use has been associated with more positive feelings (e.g., enjoyment, engagement, motivation) amongst learners as compared to a slideshow of screenshots from a VR application (Parong and Mayer, 2018). Additionally, a meta-analysis by Zhao et al. (2020) found that learning using immersive VR led to significantly better anatomy knowledge assessment scores compared to other methods in the majority of studies. Other meta-analyses have echoed the same sentiment (Moro et al., 2021; Hamilton et al., 2021), illustrating that learning via VR is generally equal to, or better than, other learning methods such as learning via AR, 3D digital models, 2D videos, textbooks, lectures, non-immersive (desktop) VR, and physical models. The major disadvantage for using VR in education are frequent student reports of cybersickness symptoms, such as nausea, headaches, and discomfort (Bölek et al., 2021), limiting utility of using VR for certain students or for long periods of time.
AR technology involves superimposing a digital element onto actual reality through a camera lens, allowing the user to interact with both real world and digital elements simultaneously through their device screen. AR is less immersive than VR, but users of AR do not frequently report cybersickness symptoms. A review by Bölek et al. (2021) found that learning anatomy via AR results in similar academic performance as learning anatomy via non-cadaveric means (including resources such as VR applications, 3D physical models, virtual dissection tables, and 2D anatomical atlases) but confers “no significant learning benefits” in comparison. A study by Moro et al. (2017) found that students learning anatomy using AR and VR technological resources reported advantages such as increased “student engagement, interactivity and enjoyment” and that academic performances were similar whether students learned via tablets, AR, or VR. In addition to increasing engagement, AR has also been demonstrated to help students maintain attention to a learning task (Ferrer-Torregrosa et al., 2016; von Jan et al., 2012). Interestingly, learning via 3D digital models in AR resulted in higher academic performance compared to non-cadaveric means of learning anatomy for students with lower baseline spatial ability, as measured by Mental Rotation Test (MRT) scores (Bölek et al., 2021). This indicates that learning via AR may help with fundamental spatial understanding. Henssen et al. (2020) echoed this sentiment, concluding that students experienced less cognitive load (a measure of the degree of effort placed upon the limited working memory capacity of an individual) when using AR software to learn neuroanatomical structures, as compared to learning via cross sections, although numerous other studies have concluded with the contrary: that learning via XR methods can result in more cognitive load being placed on students (Bork et al., 2021; Chen, 2008; Dunleavy et al., 2009; Phon et al., 2014). AR technology has become increasingly accessible to end users. Technology such as mobile AR brings AR capabilities through software stored on a mobile device and is now integrated into publicly available software, such as Visible Body. The ability to more readily use AR technology bears obvious study advantages, as students do not need additional resources to use advanced spatial technology on the go – provided they possess a compatible base device and access to a learning platform. Indeed, a study by Küçük et al. (2016) found that when students were given access to a mobile AR application to supplement material covered in a lecture presentation using 2D resources, they experienced less cognitive load and better academic achievement.
Contrarily, Bölek et al. (2021) found that learning anatomy via AR resulted in lower academic performance when compared with learning anatomy in 2D specifically (e.g., via atlases and cross sections). In addition, some of the students participating in a study by Bork et al. (2019) reported that a cross-sectional anatomy AR program called Magic Mirror was “tiring to use for long learning sessions.” The lack of kinesthetic feedback when using AR technology can also leave students feeling unmoored (Radu and Schneider, 2023), and some students have reported difficulty working with AR (Thomas et al., 2010). Stereopsis, or experiencing the true depth of field that binocular vision (i.e., using both eyes simultaneously) normally affords in the physical environment, is also a limitation for projecting 3D digital models in AR on a 2D screen. In a study by Wainman et al. (2019), study participants who covered one eye to mimic loss of stereoscopic vision while learning pelvic anatomy performed worse on a pelvic anatomy assessment whether using physical models, VR, or mixed reality (MR) -- a close approximation of AR but with more interactivity (Wainman et al., 2019).
With the increasing accessibility of three-dimensional (3D) visualization technologies, instructors have begun to utilize these technologies to modernize their course curricula. While a plethora of studies are serving to examine the impact of exposure to 3D technologies on learning outcomes and student experience, the role of emotion on learning efficacy while learning via new technology has had very little investigation—and is furthermore an often-neglected component of pedagogical interventions. Since emotions affect the cognitive processes necessary for academic learning, it’s imperative to consider students’ emotional responses to pedagogical adjustments in order to maximize learning efficacy (Piaget and Garcia, 1989; Chen and Wang, 2011; Um et al., 2012; Fiedler and Beier, 2014).
The objective of the present exploratory study was to examine the emotional responses of students to an anatomy course utilizing 3DVT and AR integration as key instructional and assessment methods. The anatomy course was partitioned into three class session types: technology-based learning sessions, non-technology-based learning sessions, and examination sessions (which also utilized the technology). To measure the change in student emotional valence/sentiment to each session type, students completed a survey which directed them to select the emoji that best represented their primary emotion regarding that particular class session. This survey was completed before and after each class session to measure the change in emotional sentiment over each class session. The 10 emoji comprising the survey were stratified into three major categories for analysis: positive sentiment (high valence), neutral sentiment (neutral valence), and low sentiment (low valence). Finally, pre-course and post-course questionnaires were administered to validate study conclusions, to gain a deeper understanding of student emotional responses to the course, and to evaluate students’ general reactions to the 3D technology as a learning modality.
The authors’ hypotheses were that students would select emoji representing more positive emotions surrounding technology-based learning sessions and that students would select emoji representing more positive emotions after examinations sessions relative to before examination sessions. Additionally, the authors hypothesized that the students would report that they found the technology to be an effective learning tool.
The study population was composed of junior and senior high school students in a High School Alliance (HSA) program administered through the University of Nebraska Medical Center (UNMC) on its Omaha, Nebraska campus. The program admits students from public high schools in 13 school districts surrounding the metropolitan area. The curriculum meets Nebraska Science Standards, is intended to be completed in a single academic year, and is led and taught by collaborative efforts involving both HSA teachers and UNMC faculty.
The present study was executed in an HSA course titled “Exploration of Human Anatomy.” Students enrolled in this course self-identified with interest in course enrollment. Students in the program were issued Apple iPads for use during the program, so all students were ensured to have AR-compatible devices with 3DVT software (Visible Body). Students were made aware when selecting the anatomy course that human whole-body donors (cadavers) would be utilized as learning modalities, and students were allowed to preview the lab setting, with whole-body donors present, before enrolling in the course. The cohort enrolled in this course was composed of 39 high school students. One student withdrew from the course without completing it. The students ranged in age from 16 to 18. Of those who began the course, 15 (38.5%) of these students were high school juniors, and 24 (61.5%) of these students were high school seniors. The cohort was composed of predominantly female students, as 32 (82%) students identified as female, while only 7 (18%) identified as male.
The course was composed of four non-cumulative units, each followed by a unit examination. The same type of learning sessions were facilitated for each unit, exposing students to each unit’s content with different modalities. Each class meeting fell into one of six discrete learning session types, which were further partitioned into three overarching categories: technology-based learning sessions, non-technology-based learning sessions, and examination sessions. Descriptions of each of the learning and examination session types are herein:
• Technology-based learning sessions: Technology-based lecture sessions consisted of an audio-visual presentation utilizing real-time manipulation of customized 3D digital models in lieu of a PowerPoint presentation, accompanied by a written notes document defining terms, explaining concepts, and displaying cadaveric images. Technology-based laboratory sessions consisted of learning via 3D digital models in 3DVT and AR. Models were digitally overlaid on the real classroom environment through the camera of the students’ iPads and students were able to manipulate them in order to visualize structures; students also overlaid the models on their own bodies through their iPad cameras in order to visualize where structures could be located on themselves.
• Non-technology-based learning sessions: Non-technology-based laboratory sessions consisted of learning via human cadaveric specimens set up in various “stations” around the lab, ranging from previously dissected whole-body donors (pro-sections) to smaller human tissue specimens (e.g., isolated joints and organs). Non-technology based active-learning sessions consisted of hands-on laboratory activities appropriate for a high school biology/anatomy course and relevant to current unit content (e.g., creative diagramming of body regions, labelling of 3D-printed specimens, measuring respiratory volumes, etc.). Finally, non-technology-based content review sessions consisted of 1 h in the gross anatomy laboratory and 1 h of a large-group review session using exam-like practice questions.
• Examination sessions: consisted of an approximately one-hour laboratory identification-based examination using both cadaveric-based specimens and screenshots from the 3DVT software, followed by an approximately one-hour multiple choice written examination (which also made use of screenshots from the 3DVT software).
The order of learning sessions was maintained in each unit with the exception of Unit II, when scheduling constraints changed the order of the non-technology-based laboratory session and the non-technology-based content review session. Incidentally, Unit II also did not include a content application/active learning day, also due to scheduling considerations.
The 3DVT software utilized in the high school anatomy course was Human Anatomy Atlas by Visible Body (version 4.02.011). Course faculty created 2–3 customized, course-specific 3D digital models per unit in order to isolate the structures the students were required to learn. The 3DVT software incorporates seamless AR integration, so students could digitally project any of the course-specific or standardized 3D digital models onto the table in front of them, onto the ground of the classroom, or even over their own bodies. The students were then able to manipulate the structure in a 3D space via interactions with their device. The AR component of the 3DVT software was used specifically during the technology-based laboratory sessions, but the students had access to this feature outside of the classroom as well.
Students completed summative learning assessments after completing all of the learning sessions for each unit. During the summative learning assessments, students were assessed using both laboratory identification-based (constructed-response) formats and written (multiple-choice) formats, each of which were equally weighted. The number of questions on each assessment were proportionally balanced to reflect the classroom time spent learning from technological and cadaveric resources (Figure 1). There were 84 questions total per unit examination; one-third (28) of the questions were in written multiple-choice format, one-third (28) were in constructed response (fill-in-the-blank) format and involved a “tag” (i.e., placing an indicator on a structure) on a cadaveric specimen, and one-third (28) involved a tag on a screenshot from a 3D digital model where the answer was either in multiple-choice format (14 questions total) or constructed response format (14 questions total).
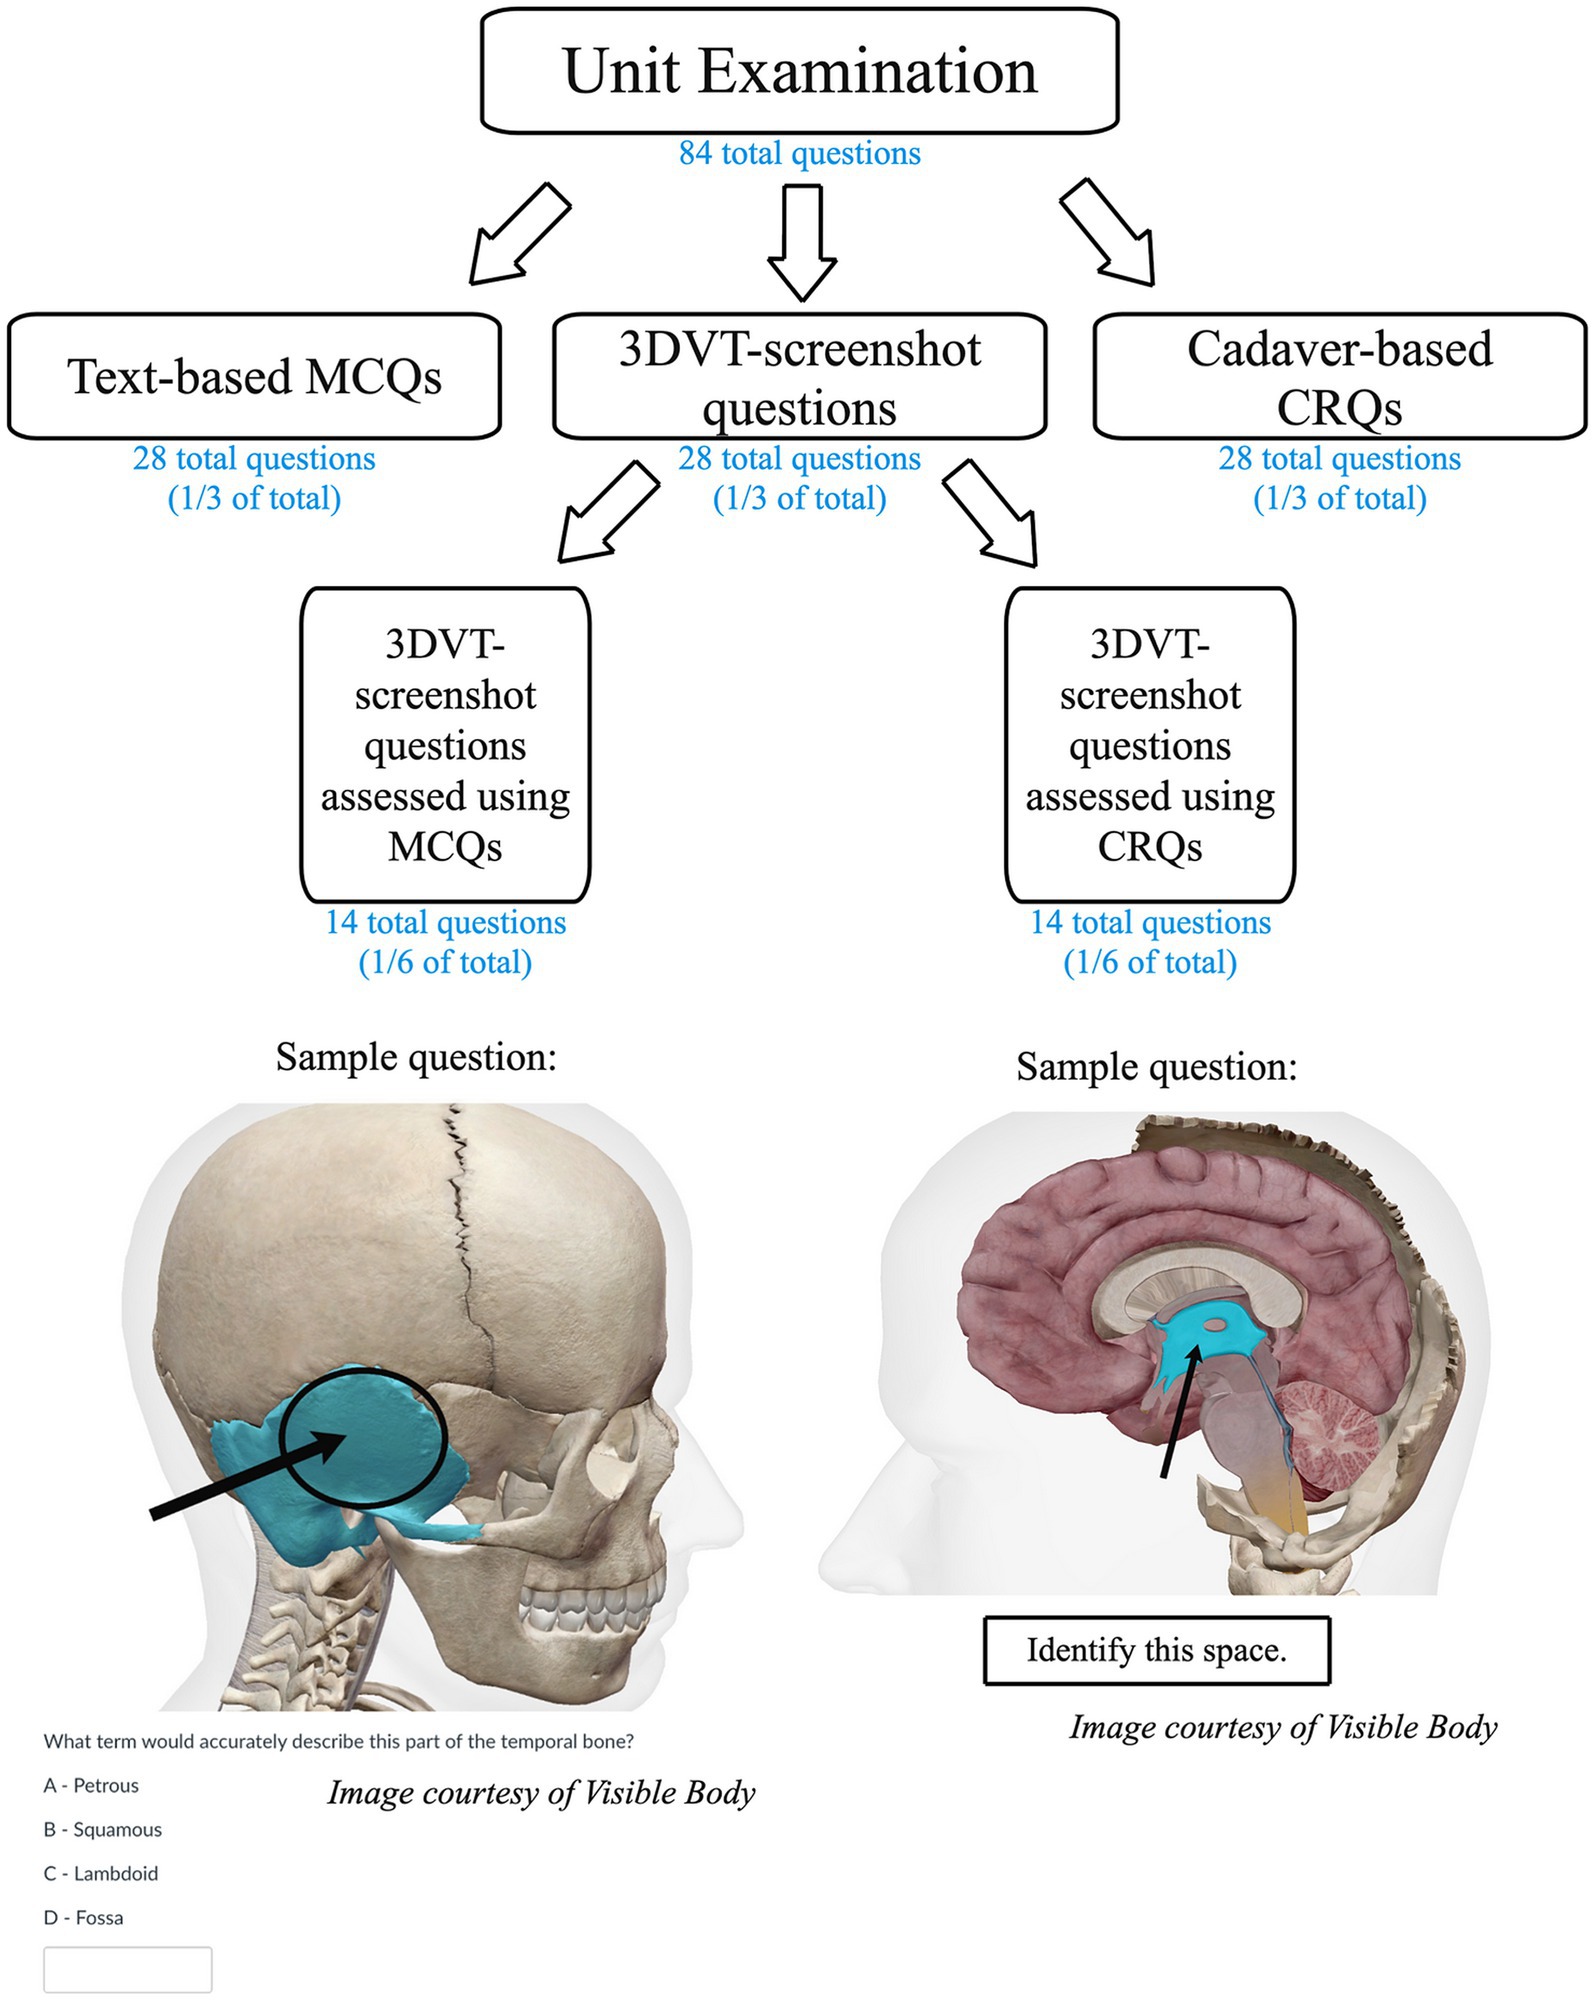
Figure 1. Unit examination breakdown by question type, with examples. The flow chart represents the composition of question types comprising the unit examinations. Questions were evenly split between text-based MCQs (multiple-choice questions), cadaver-based CRQs (constructed-response questions), and 3DVT-screenshot questions (assessed using an even balance between MCQs and CRQs). There are also two sample 3DVT-screenshot questions to illustrate how the technology was used to create examination questions. The images are both courtesy of Visible Body: Visible Body Suite (Version 4.02.011) [Computer software]. (2023). Retrieved January 15, 2023 from www.visiblebody.com.
Ten emoji were selected to represent a range of emotional valence (i.e., pleasantness) values in order to create an emoji-based emotional state survey. Facial emoji were selected as they are considered the best proxy for emotional expression due to the alterable appearances of the emoji eyes and mouth (Swiftkey, 2015; Jaeger et al., 2019). The emoji were clustered by sentiment when presented to students (i.e., positive-sentiment emoji appeared toward the top of the survey). The emoji were presented to students in the same order before and after each learning session and examination session throughout the semester and were clustered such that positive-sentiment emoji were presented at the top of list, neutral-sentiment emoji were presented next, and negative-sentiment emoji were presented at the end of the list. Students were not informed as to any organizational strategy of the emoji in the survey.
Prior research has isolated several prompt words that denote the intention of the emotion displayed by each emoji (Table 1); these words (n = 2–6) were visible to the students on the emoji survey in order to provide clarity regarding the specific emotion(s) indicated by each emoji (Jaeger et al., 2019). Before and after each learning session, students were instructed to self-report their primary emotion, with regard to learning in that particular day’s session, by selecting one of the 10 emoji that best represented their current primary emotional state. The students had 30-min windows surrounding class start and end times (i.e., the first window was open from 15 min before class start time until 15 min into class time, then the second window was open from 15 min before class end time until 15 min after class ended) in which to complete their emoji selection. These windows were created as time-limited boundaries for the collection of emoji data while also accounting for students arriving slightly late or leaving slightly early due to extracurricular commitments.
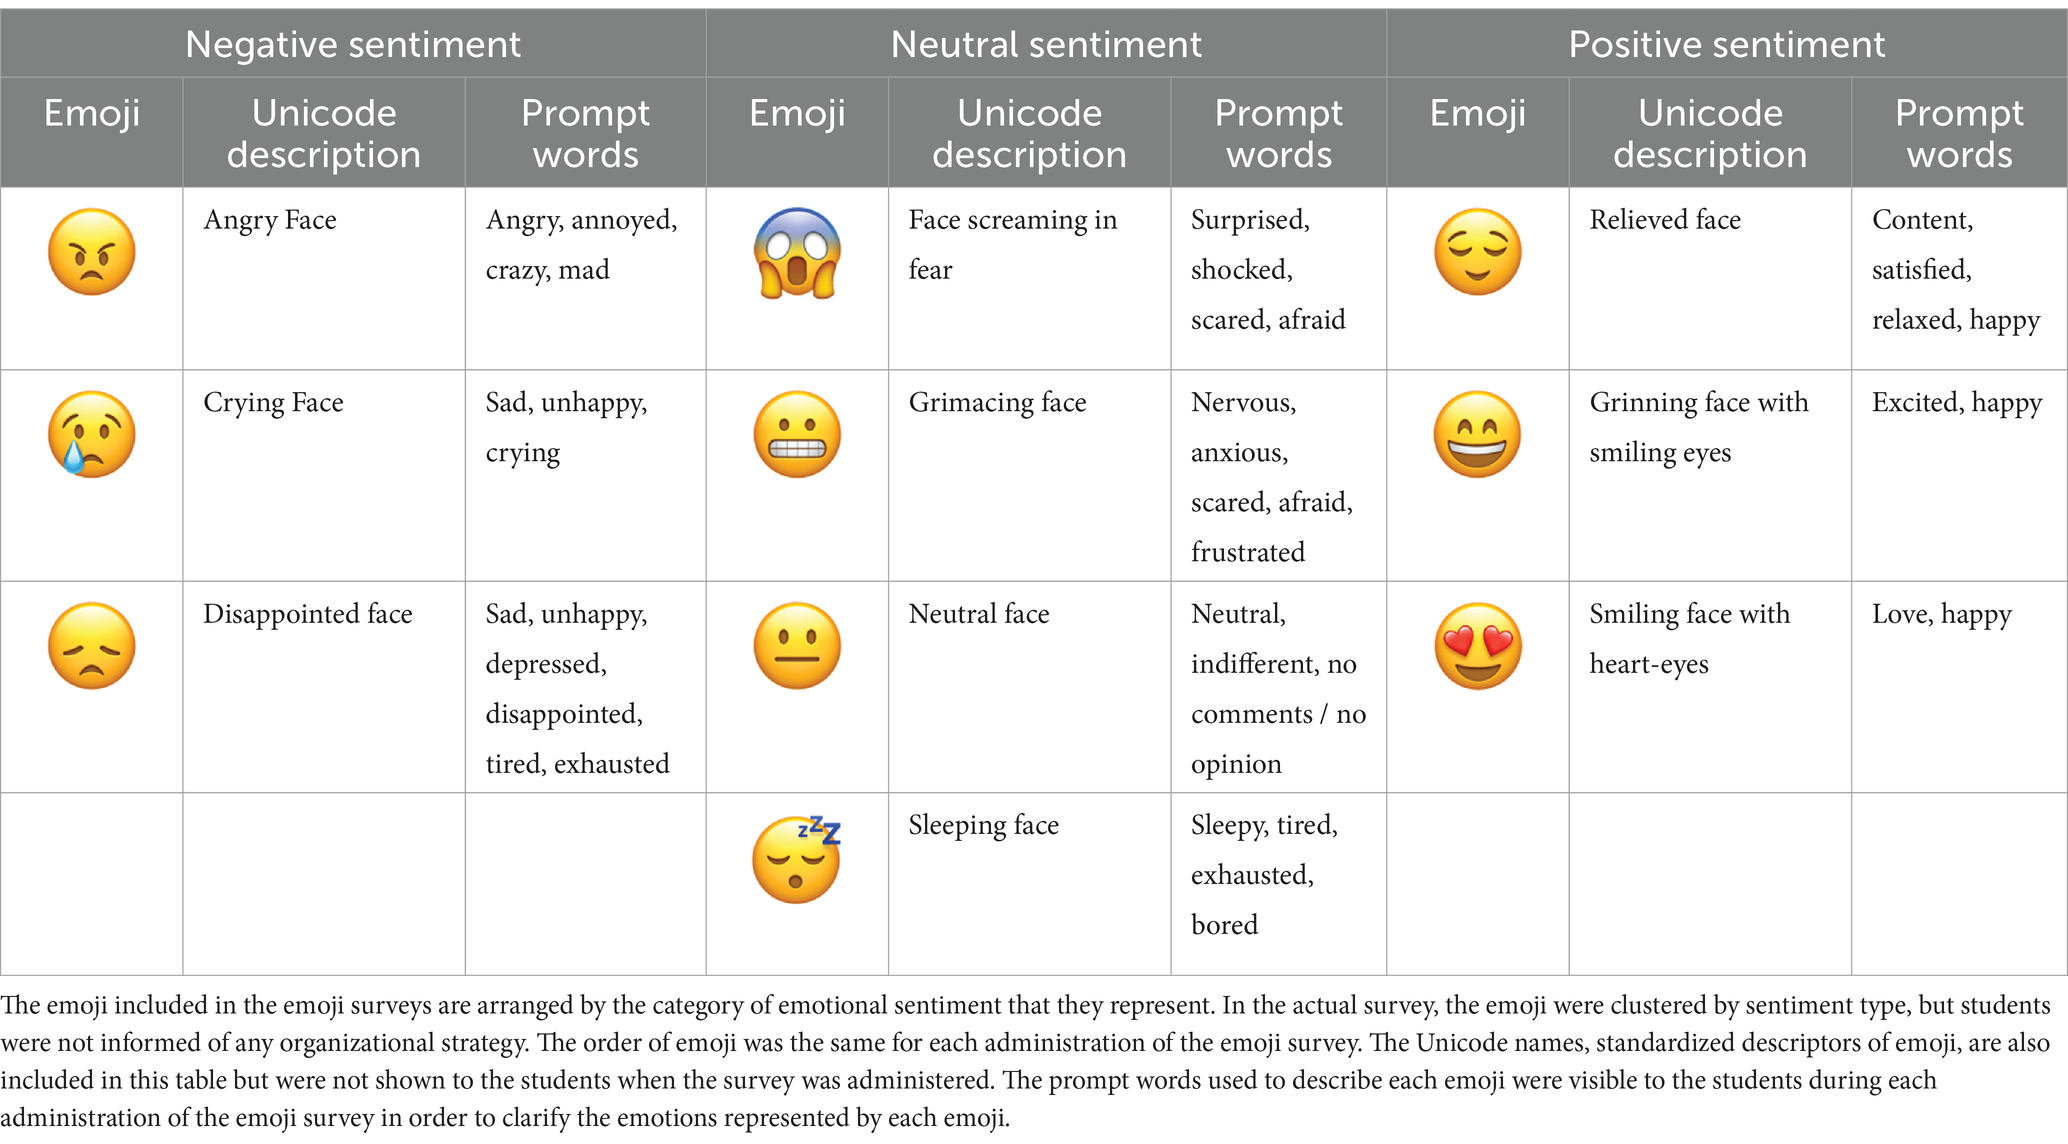
Table 1. Emoji included in the pre- and post-course session surveys.
The 10 emoji selected for the present study had each previously been extensively analyzed in a study which sought to define numeric valence and arousal values for nearly three dozen facial emoji (Jaeger et al., 2019). A cluster analysis indicated that there were three non-overlapping valence value ranges, such that an emoji with an average valence level of 6.7–8.5 (their highest measured valence value in this study) is considered an emoji with a “positive sentiment,” an emoji with an average valence level of 4.2–6.1 is considered an emoji with a “neutral/dispersed sentiment,” and finally, an emoji with an average valence level of 2.3 (their lowest measured valence value in this study) – 3.8 is considered an emoji with a “negative sentiment” (Jaeger et al., 2019). The study authors mention that there was a greater magnitude of between-subject agreement amongst the ratings of valence than for ratings of arousal in their study, so the determined arousal values from the work by Jaeger et al. (2019) were not used in the present study. Thus, for the present study, three emoji were selected from the positive sentiment category (Unicode’s standardized names for them are “relieved face,” “grinning face with smiling eyes,” and “smiling face with heart-eyes”) to represent positive-valence emotions, four emoji were selected from the neutral sentiment category (Unicode’s standardized names for them are “grimacing face,” “neutral face,” and “sleeping face”) to represent neutral-valence emotions, and three emoji were selected from the negative sentiment category (Unicode’s standardized names for them are “angry face,” “crying face,” and “disappointed face”) to represent negative-valence emotions (Table 1).
Questionnaires were also administered to students at the beginning and end of the course. Some of the included prompts were administered only once, and some of the included prompts were administered both pre-course and post-course to examine whether the students’ experiences within the course had any effect on their selection choices to these prompts.
Statistical analyses were conducted using Microsoft Excel, version 16.77 and IBM SPSS Statistics, version 29.0.0.0. For all analyses, a p-value of 0.05 was used to indicate significance.
To evaluate whether the emotional sentiment response distribution varied by session type and timing of response (i.e., before or after the class session), students’ emoji selections were first assigned a numerical code to reflect their ordinal arrangement. The number 0 was assigned for a negative sentiment emoji selection, 1 was assigned for a neutral sentiment emoji selection, and 2 was assigned for a positive sentiment emoji selection. This allowed the repeated measures from each student to be averaged for each unique session type. The six session type categories were therefore as follows: before technology-based learning sessions, after technology-based learning sessions, before non-technology-based learning sessions, after non-technology-based learning sessions, before examination sessions, and after examination sessions. These data were analyzed using Wilcoxon signed-rank tests on paired data within subjects to compare the distributions of emotional sentiment selections between the different session types listed above.
Regarding prompts that were administered via pre- and post-course questionnaires, a Wilcoxon signed-rank test was used to evaluate whether there was a difference in the distribution of item responses. Only paired data were analyzed, so any student who did not complete both of the questionnaires (pre-course and post-course) was omitted from this analysis. Each questionnaire also included 2–3 open-ended questions so students could clarify any of their responses on the Likert-style items.
The University of Nebraska Medical Center Office of Regulatory Affairs and Institutional Review Board has reviewed this research and deemed it exempt, IRB Approval #0407-23-EX.
Over the course of the semester, there were 1,843 emoji selections. The total number of selections for each emoji over the semester, including those derived from pre-session and post-session, were aggregated for visualization (Figure 2). The total number of selections for each emoji over the semester, divided into categories based on session type (i.e., technology-based learning session, non-technology-based learning session, or examination session) and session timing (before or after a particular session), were aggregated for visualization (Figure 3).
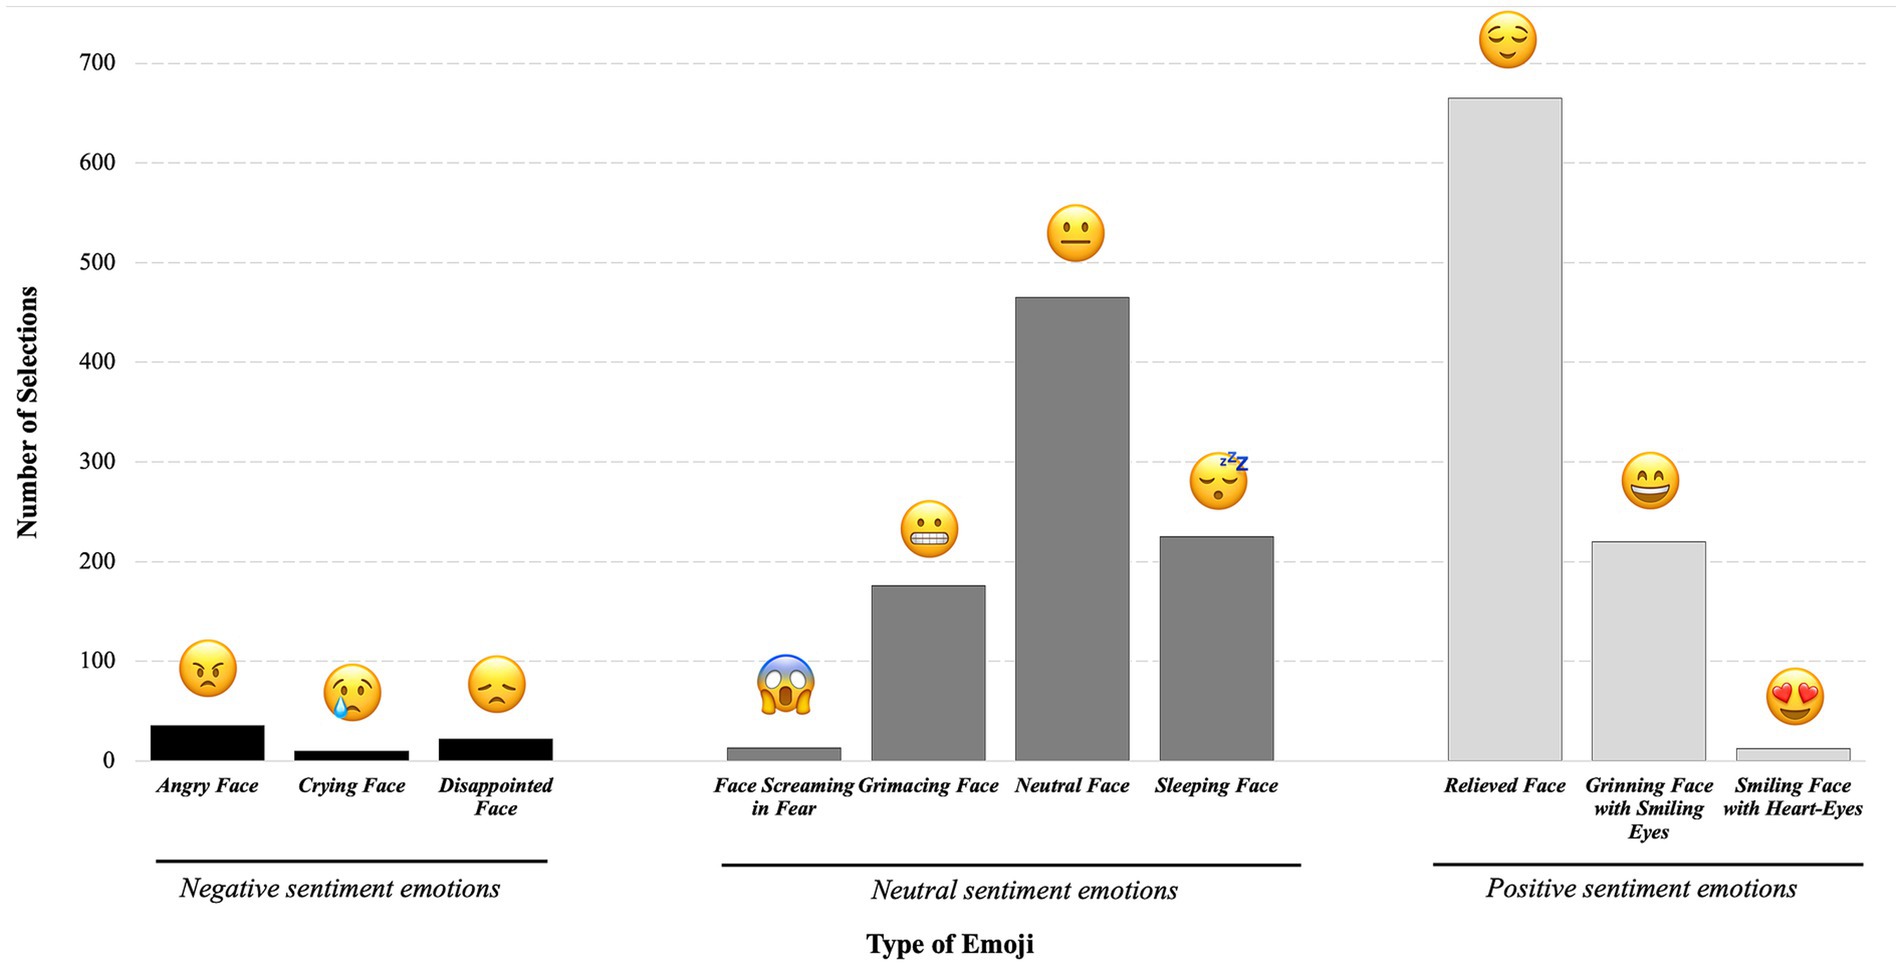
Figure 2. Total number of selections of each emoji for all class session types. The bar graph displays the total number of selections of each emoji throughout the semester without regard to the class session type in which the selection occurred.
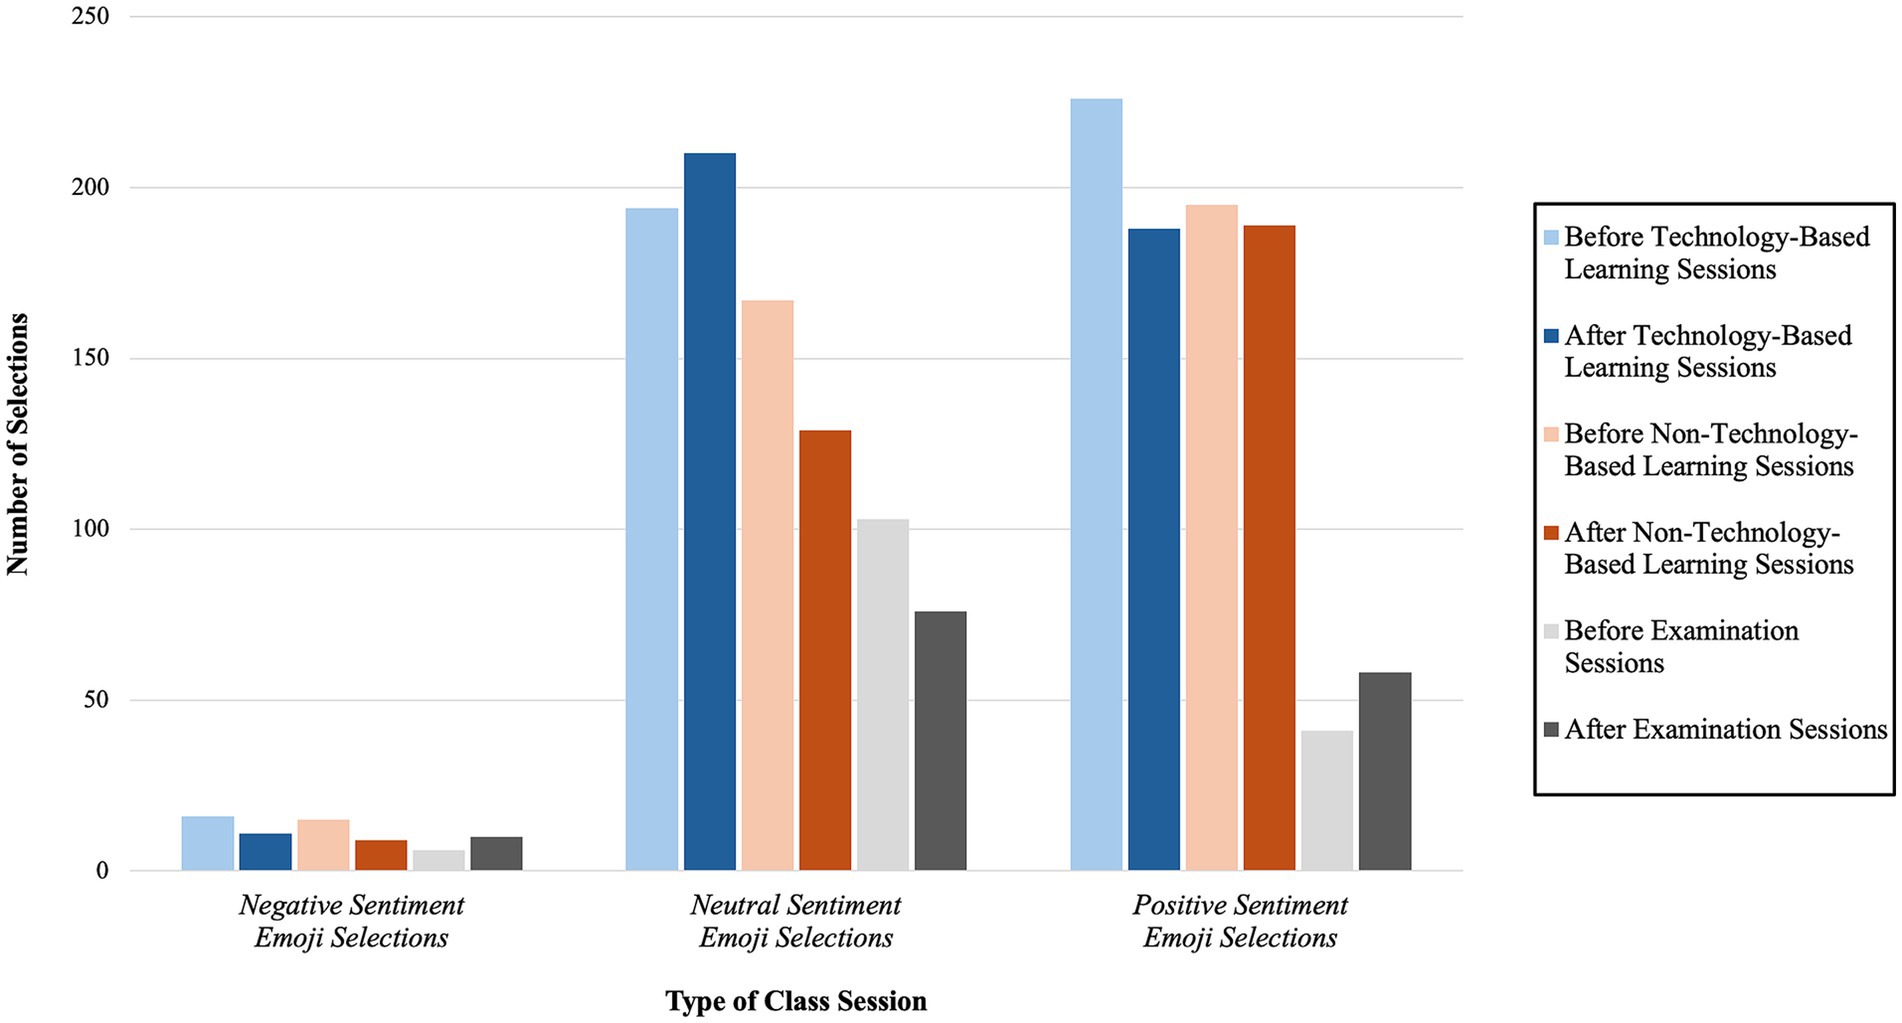
Figure 3. Emoji selections organized by sentiment for each class session type. The bar graph displays the number of emoji selections in each emotional sentiment category organized by class session type.
The total number of emoji selections in the negative sentiment category represented only 3.64% of the total emoji selections throughout the semester. For the “angry face” emoji, there were 35 total selections over the course of the semester (corresponding to 1.90% of total emoji selections). For the “crying face” emoji, there were 10 total selections over the course of the semester (corresponding to 0.54% of total emoji selections). For the “disappointed” emoji, there were 22 total selections over the course of the semester (corresponding to 1.19% of total emoji selections).
There was a slight decline in negative-sentiment emoji selections over each of the learning session types (both technology-based and non-technology-based); in contrast, there was a slight increase in negative-sentiment emoji selections over the examination sessions (Figure 3).
The emoji selections in the neutral sentiment category represented 47.69% of the total emoji selections throughout the semester. Most of the neutral sentiment emoji selections were clustered over the “neutral face” and “sleeping face” emoji, accounting for 78.50% of the total amount of emoji selections in the neutral-sentiment category. For the “face screaming in fear” emoji, there were 13 total selections over the course of the semester (corresponding to 0.71% of total emoji selections). For the “grimacing face” emoji, there were 176 total selections over the course of the semester (corresponding to 9.55% of total emoji selections). Notably, over the course of the semester, there were 50 fewer selections of this emoji after examination sessions relative to before examination sessions. For the “neutral face” emoji, there were 465 total selections over the course of the semester, corresponding to 25.23% of total emoji selections, making this the second most popular emoji selection. This emoji was a particularly popular selection over the technology-based lecture session type with 148 selections (with an even distribution before and after technology-based lecture sessions), making up 31.83% of the total number of times this emoji was selected across all of the different class session types. For the “sleeping face” emoji, there were 225 total selections over the course of the semester, corresponding to 12.21% of total emoji selections.
There was an increase of 16 neutral-sentiment emoji selections over the technology-based learning sessions and a decrease of 38 neutral-sentiment emoji selections over the non-technology-based learning sessions. Additionally, there was a decrease of 27 neutral-sentiment emoji selections over the examination sessions (Figure 3).
The total number of emoji selections in the positive sentiment category accounted for 48.67% of the total emoji selections throughout the semester. Most of the emoji selections (74.14%) in the positive sentiment category were clustered over the “relieved face” emoji. There were 665 total selections of the “relieved face” emoji over the course of the semester, corresponding to 36.08% of total emoji selections, making this the most popular selection over the course of the semester. For the “grinning face with smiling eyes” emoji, there were 220 total selections over the course of the semester, corresponding to 11.94% of total emoji selections. There was at least one selection of this emoji before and after each learning session type over the course of the semester. For the “smiling face with heart-eyes” emoji, there were 12 total selections over the course of the semester, corresponding to 0.65% of total emoji selections. This emoji was selected at least once before technology-based lecture sessions, before technology-based laboratory sessions, before cadaveric-based laboratory sessions, and before unit content review sessions. In addition, this emoji was selected at least once after technology-based lecture sessions and after active learning sessions (one of the class meeting types that fell into the non-technology-based learning session category).
There was a decrease of 38 positive-sentiment emoji selections over the technology-based learning sessions and a decrease of six positive-sentiment emoji selections over the non-technology-based learning sessions. Additionally, there was an increase of 17 positive-sentiment emoji over the examination sessions (Figure 3).
The average emotional sentiment of emoji selections for each session type across the student population in the course is displayed in Figure 4. The average emotional sentiment of the emoji selected before technology-based learning sessions and non-technology-based learning sessions was identical (1.48/2). The average emotional sentiment of the emoji selected after technology-based sessions slightly decreased (1.43/2) as compared to before technology-based sessions, yet the average emotional sentiment of the emoji selected after non-technology-based sessions increased as compared to before non-technology-based sessions (1.55/2). Finally, the average emotional sentiment of the emoji increased over the examination sessions (from 1.23/2 to 1.34/2).
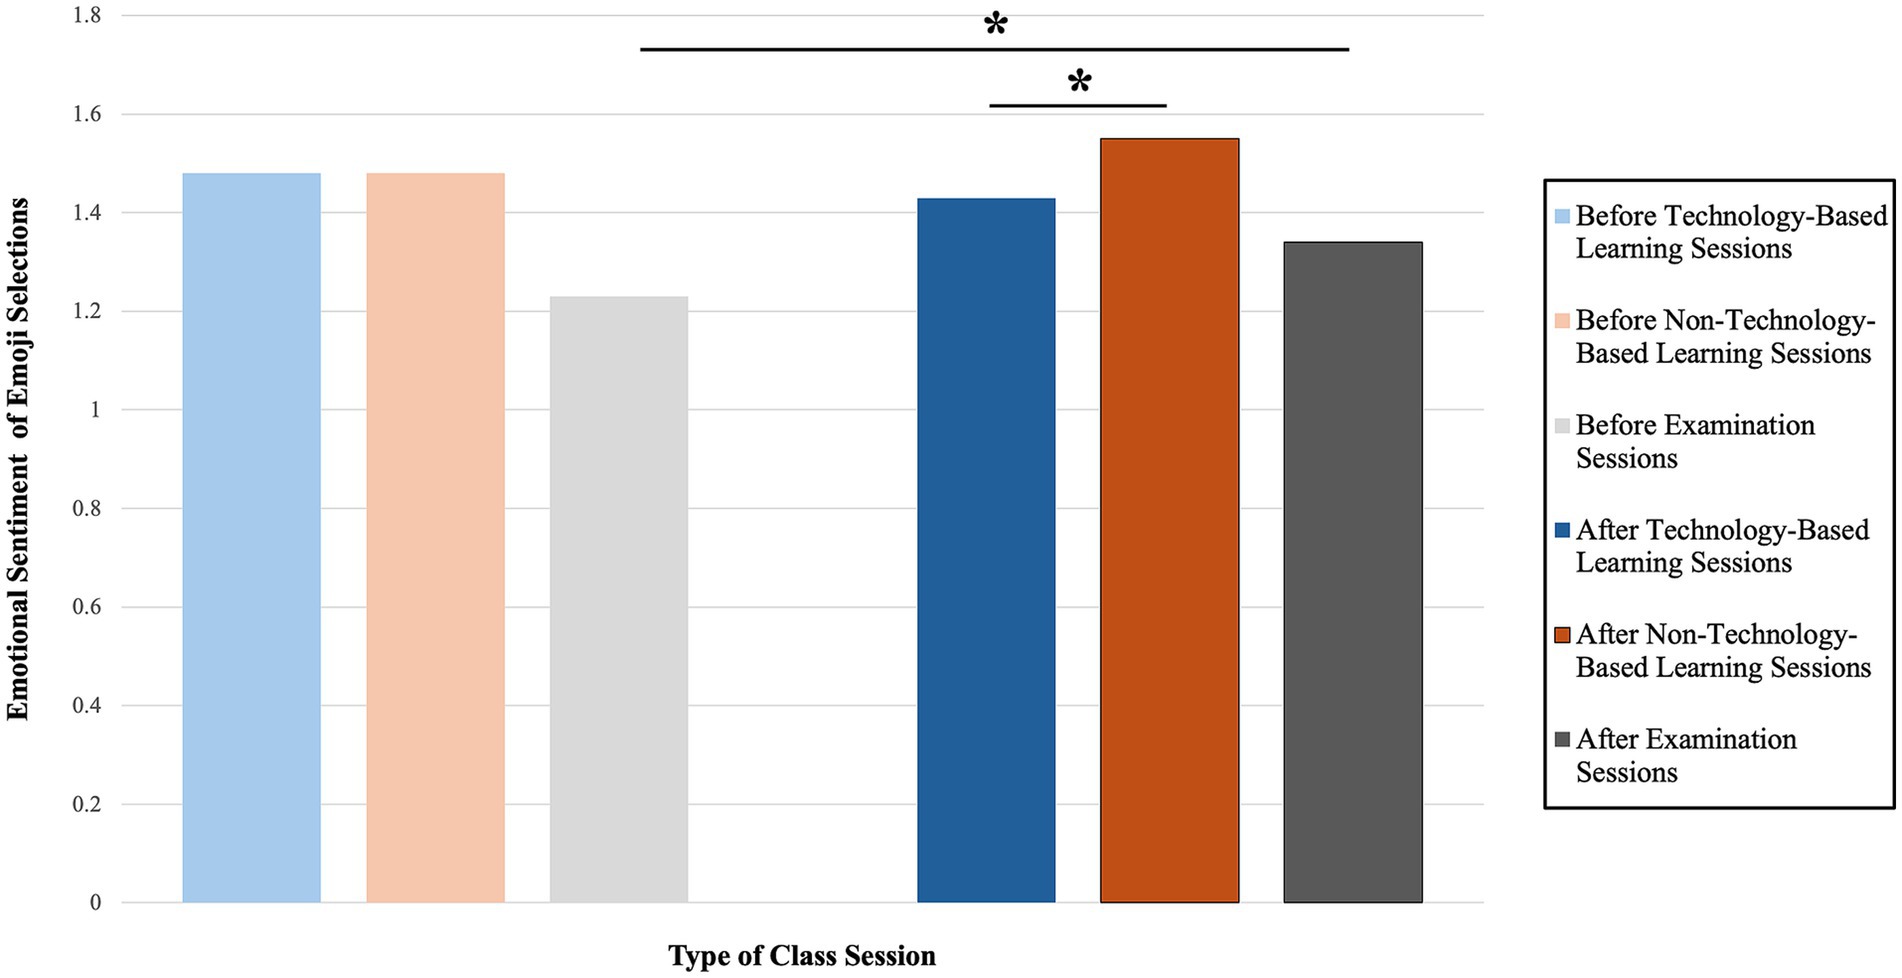
Figure 4. Comparisons of average emotional sentiment reported for each class session type. The bar graph displays the average emotional sentiment associated with each class session type over the course of the semester, on a scale spanning from 0 to 2. An asterisk (*) indicates a statistically significant difference in the average emotional sentiment between the class session types. The statistical results of these comparisons can be found in Table 2.
According to a Wilcoxon signed-rank test (Table 2), the distribution of emotional sentiment selections differed before examination sessions as compared to after examination sessions (Z = −2.066, p = 0.039), and the distribution of emotional sentiment selections differed after technology-based learning sessions as compared to after non-technology-based learning sessions (Z = −2.557, p = 0.011). There were no other statistically significant findings amongst the other comparisons included in this analysis.
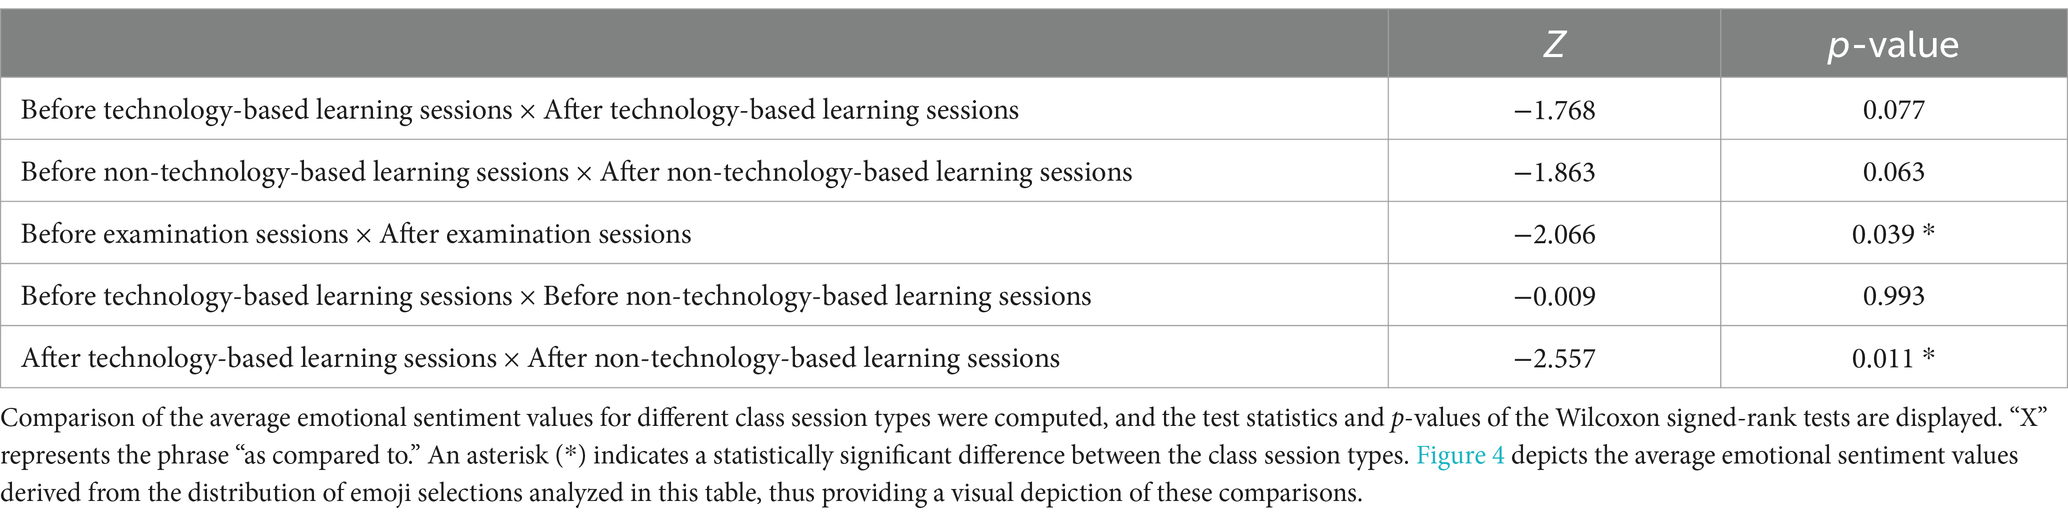
Table 2. Results of statistical analyses comparing the average emotional sentiment of different class session types.
The prompts on these questionnaires were answered using a five-point Likert scale, with the following options: strongly disagree, disagree, neither agree nor disagree, agree, and strongly agree. The following question prompts were administered both pre- and post-course (Figure 5):
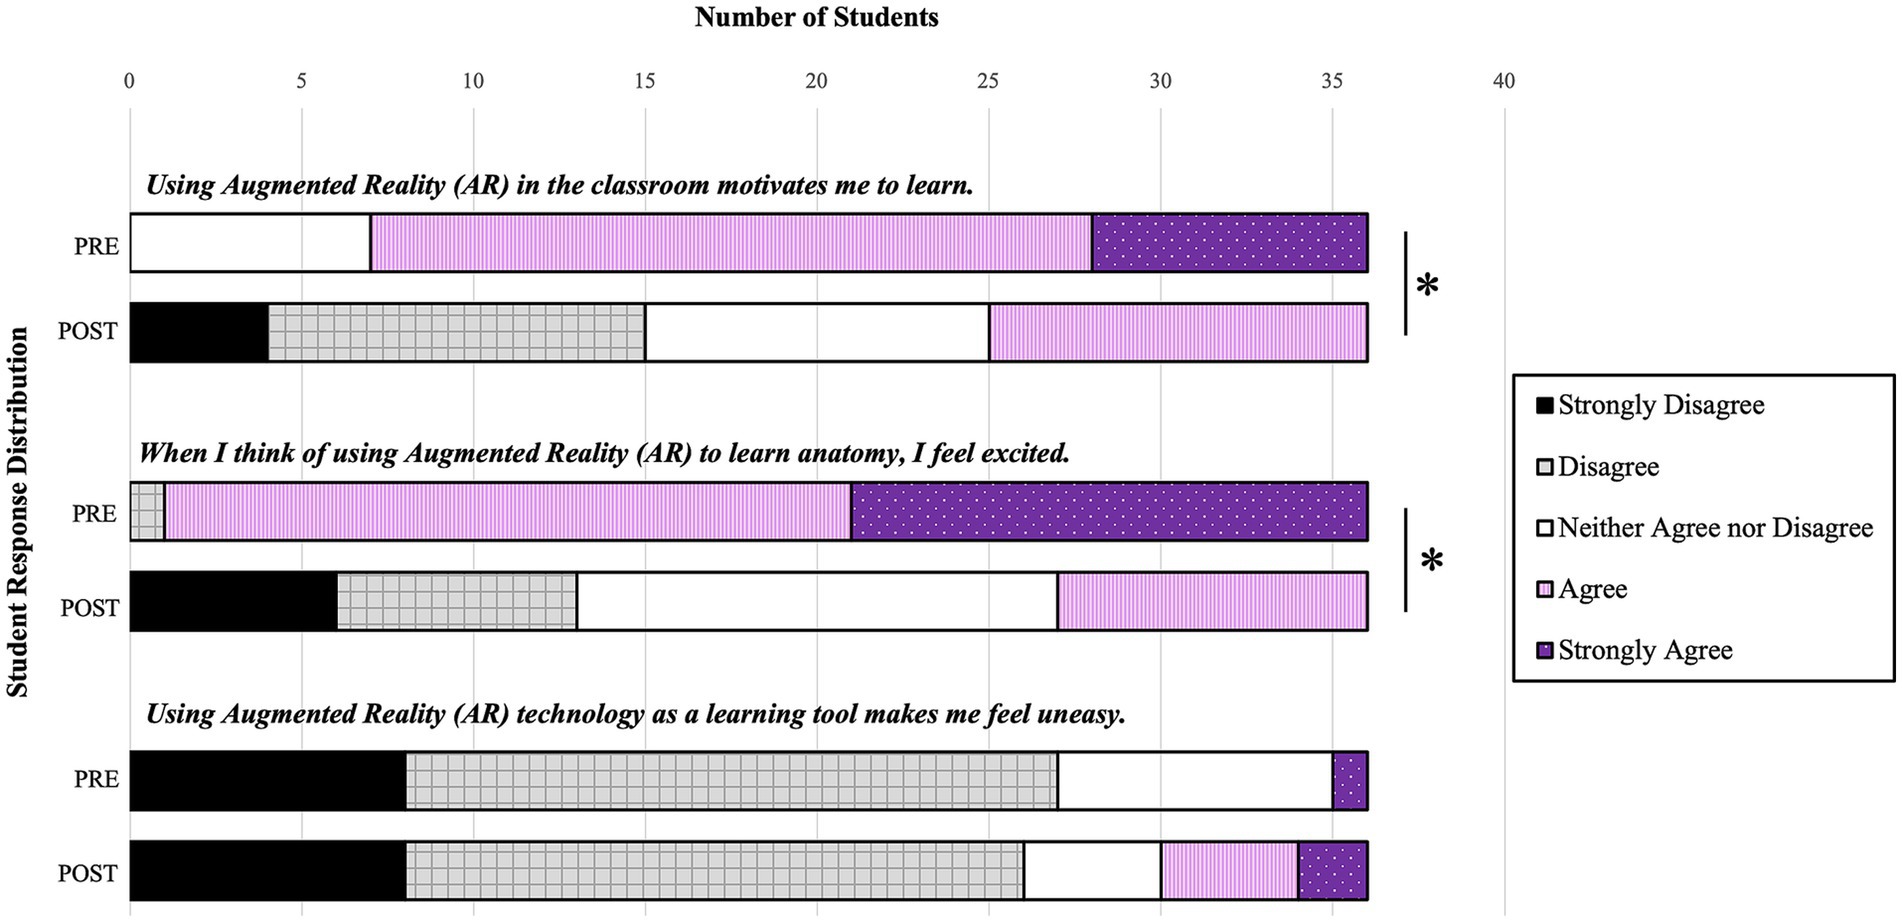
Figure 5. Questionnaire results comparing pre-course responses to post-course responses. The bar graph displays the response distributions to the Likert-style items on the pre- and post-course questionnaires. An asterisk (*) indicates a statistically significant difference between the pre-course and post-course response distributions.
The median and mode values of student selections to this prompt in the pre-course administration were both 4, corresponding to the “agree” selection. In the pre-course administration of this prompt, the responses ranged from 3 (“neither agree nor disagree”) to 5 (“strongly agree”). In the pre-course administration of this prompt, 29 students (80.5%) selected either “agree” or “strongly agree.” The median value to this prompt in the post-course administration was 3, corresponding to the “neither agree nor disagree” selection. The mode value to this prompt in the post-course administration was 2, corresponding to the “disagree” selection. In the post-course administration of this prompt, the responses ranged from 1 (“strongly disagree”) to 4 (“agree”). In the post-course administration of this prompt, 10 students (27.8%) selected “neither agree nor disagree,” 15 students (41.7%) selected either “disagree” or “strongly disagree,” and 11 students (30.6%) selected “agree.” A Wilcoxon signed-rank test found a statistically significant difference in student responses to this prompt (Z = −4.463, p < 0.001).
The median and mode values of student selections to this prompt in the pre-course administration were both 4, corresponding to the “agree” selection. In the pre-course administration of this prompt, the responses ranged from 2 (“disagree”) to 5 (“strongly agree”), and 35 students (97.2%) selected either “agree” or “strongly agree.” The median and mode values to this prompt in the post-course administration were both 3, corresponding to the “neither agree nor disagree” selection. In the post-course administration, 14 students (38.9%) selected “neither agree nor disagree,” 9 students (25.0%) selected “agree,” and 13 students (36.1%) selected either “disagree” or “strongly disagree.” In the post-course administration, the responses ranged from 1 (“strongly disagree”) to 4 (“agree”). A Wilcoxon signed-rank test found a statistically significant difference in student responses to this prompt (Z = −4.652, p < 0.001).
The median and mode values of student selections to this prompt in both the pre- and post-course administration were all 2, corresponding to the “disagree” selection. In the pre-course administration of this prompt, 27 students (75.0%) selected either “disagree” or “strongly disagree” and 1 student (2.8%) selected “strongly agree.” In the post-course administration of this prompt, 26 students (72.2%) selected either “disagree” or strongly disagree,” and 6 students (16.7%) selected either “agree” or “strongly agree.” In both the pre- and post-course administrations of this prompt, the responses ranged from 1 (“strongly disagree”) to 5 (“strongly agree”). A Wilcoxon signed-rank test did not find a statistically significant difference in student responses to this prompt from pre- to post-course.
The following question prompts were only administered before the course began or after the course was completed (Figure 6). The socio-demographic prompts indicated that 21 students (55.3%) had not taken an anatomy course before, whereas 17 (44.7%) students had taken an anatomy course before. A total of 33 students (86.8%) identified English as their first language, and 5 students (13.2%) identified an alternate language as their first language.
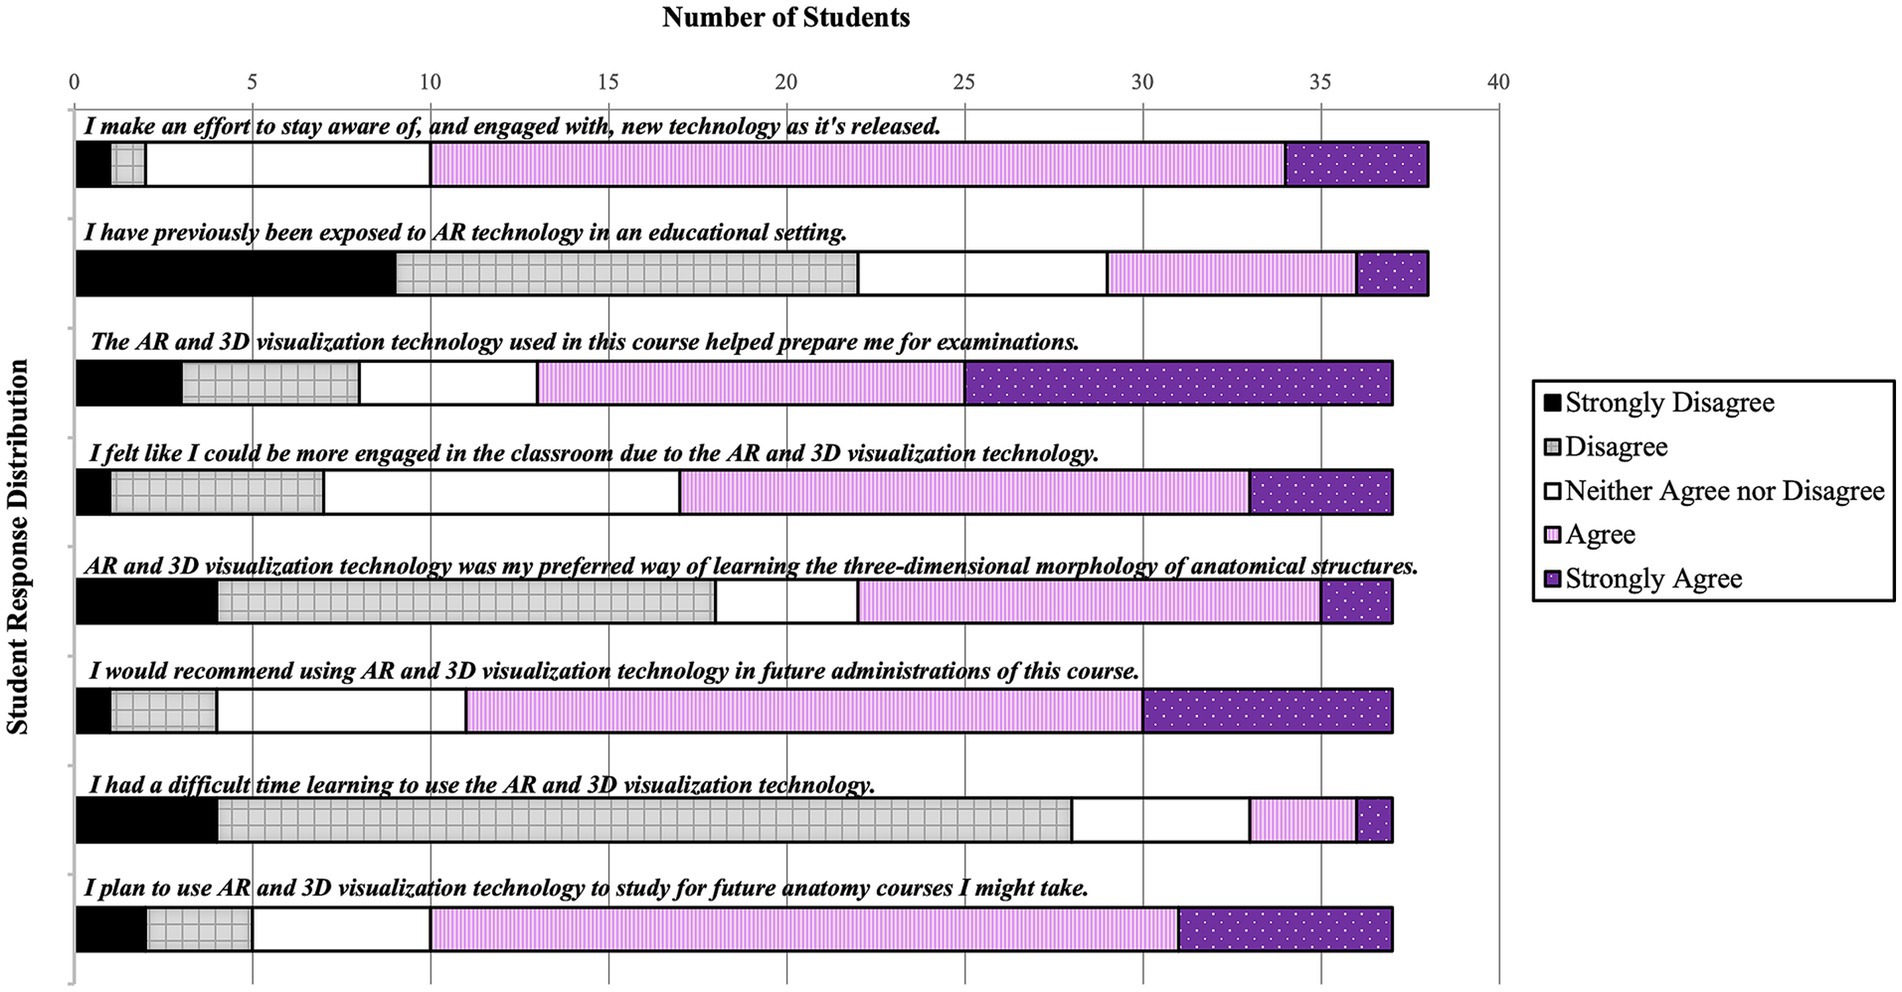
Figure 6. Questionnaire results from prompts administered only pre-course or only post-course. The bar graph displays the response distributions to the Likert-style items on the pre- and post-course questionnaires. These prompts were only administered once, in either the pre-course questionnaire or the post-course questionnaire.
This question was administered before the course began. A total of 28 students (73.7%) selected either “agree” or “strongly agree.” A total of 8 students (21.1%) selected “neither agree nor disagree,” and 2 students (5.2%) selected either “disagree” or “strongly disagree.” The median of this distribution was 4 (“agree”), and the mode of this distribution was also 4 (“agree”).
This question was administered before the course began. A total of 22 students (57.9%) selected either “disagree” or “strongly disagree.” A total of 7 students (18.4%) selected “neither agree nor disagree,” and 9 students (23.7%) selected either “agree” or “strongly agree.” The median for this distribution was 2 (“disagree”), and the mode of this distribution was also 2 (“disagree”).
This question was administered after the course was completed. A total of 24 students (64.8%) selected either “agree” or “strongly agree.” A total of 5 students (13.5%) selected “neither agree nor disagree,” and 8 students (21.6%) selected either “disagree” or “strongly disagree.” The median of this distribution was 4 (“agree”), and the mode of this distribution was shared between 4 (“agree”) and 5 (“strongly agree”) with 12 selections apiece.
This question was administered after the course was completed. A total of 20 students (54.0%) selected either “agree” or “strongly agree.” A total of 10 students (27.0%) selected “neither agree nor disagree,” and 7 students (18.9%) selected either “disagree” or “strongly disagree.” The median of this distribution was 4 (“agree”), and the mode of this distribution was also 4 (“agree”).
This question was administered after the course was completed. A total of 18 students (48.6%) selected either “disagree” or “strongly disagree.” A total of 4 students (10.8%) selected “neither agree nor disagree,” and 15 students (40.5%) selected “agree” or “strongly agree.” The median of this distribution was 3 (corresponding to “neither agree nor disagree),” and the mode of this distribution was 2 (“disagree”).
This question was administered after the course was completed. A total of 26 students (70.3%) selected either “agree” or “strongly agree.” A total of 7 students (18.9%) selected “neither agree nor disagree,” and 4 students (10.8%) selected “disagree” or “strongly disagree.” The median of this distribution was 4 (“agree”), and the mode of this distribution was also 4 (“agree”).
This question was administered after the course was completed. A total of 28 students (75.7%) selected either “disagree” or “strongly disagree.” A total of 5 students (13.5%) selected “neither agree nor disagree,” while 4 students selected “agree” or “strongly agree.” The median of this distribution was 2 (“disagree”), and the mode of this distribution was also 2 (“disagree”).
This question was administered after the course was completed. A total of 27 students (73.0%) selected “agree” or “strongly agree,” while 5 students (13.5%) selected “neither agree nor disagree.” A total of 5 students (13.5%) selected either “disagree” or “strongly disagree.” The median of this distribution was 4 (“agree”), and the mode of this distribution was also 4 (“agree”).
Qualitative responses on the open-ended portion of the questionnaires indicated that some students found using the AR technology helpful in learning spatial relationships, particularly for its ability to help visualize muscle movements while overlaying the model over their bodies; one student described the technology as “really cool.” Some students also noted that it helped with peer engagement and collaboration. Additionally, most students reported at least one benefit to learning via the 3DVT software. Most of the reported advantages of using the technology were with regard to the standard 3DVT software (including the screen-based 3D digital models), not AR technology specifically. Students reported the following benefits of using 3DVT: it helped them feel more “motivated, interested, and excited,” it allowed them consistent access to the technology for on-demand studying, it allowed them to learn spatial information more easily, and some features of the 3DVT software (e.g., color coding of bony landmarks on bones) helped the students learn detailed structural information without a physical model. The major complaints were that that there was a marked difference in appearance of the 3D digital models as compared to the whole-body donors (cadavers) and that it took a couple weeks of use to become comfortable with the 3D-based technology.
Other students, however, found the AR technology “confusing,” “difficult to use,” or “like a chore.” In particular, 16 students noted difficulty using, or dislike of class time spent using, the AR technology. Of the students who reported an aversion to using AR technology in the classroom, commonly reported concerns were: they did not like using limited class time to explore and learn via AR technology because they had access to the AR mode outside of class time for use during their personal study time; AR technology in the classroom made for a more distracting learning environment (as compared to learning using the 3D digital models with their stock white or black background using the standard 3DVT software); and finally, some students experienced frustration getting the 3D digital models to line up with their classmates’ bodies. One student also noted that the lack of haptic feedback made the AR technology less useful as a learning modality.
In many studies of XR integration into educational courses, researchers have identified a novelty effect, which occurs when individuals have an initial response to technology that is more positive than their ultimate long-term orientation to the technology after the “newness” has worn off (Sung et al., 2009; Hopp and Gangadharbatla, 2016; Radu and Schneider, 2023; Jiang et al., 2024; Miguel-Alonso et al., 2024). The authors hypothesized that students’ initial and/or continued enjoyment of the technologies would boost student’s average emotional sentiment values associated with the technology-based learning sessions; however, the emotional sentiment values actually declined over the technology-based learning sessions. Additionally, there was not a statistically significant difference in the average emotional sentiment from before non-technology-based learning sessions to after non-technology-based learning sessions, despite an increase in average emotional sentiment across these learning sessions. However, there was a statistically significant difference when comparing the average emotional sentiment after technology-based learning sessions to the average emotional sentiment after non-technology-based learning sessions. While the changes in average emotional sentiment may have been too minimal to capture statistically within a particular learning session category, the average emotional sentiment of students after technology-based learning sessions was significantly lower than the average emotional sentiment of students after non-technology-based learning sessions, indicating that there was indeed a difference in emotional response to the technology-based learning sessions. This decline over the technology-based learning sessions could be attributed to the students’ changing perceptions of the technologies as their familiarity with the technologies increased.
In the present study, a novelty effect was observed, as almost every student reported feeling excited and motivated to learn with AR before the course began; however, the majority of students reported that they either did not feel motivated by or felt neutrally about learning with AR after the course ended. Interestingly, a study by Henssen et al. (2020) found that there was no difference in motivation when comparing the use of an AR application for learning anatomy as compared to using cross sections to learn anatomy, but students still found the technology novel and interesting. In the present study, a statistically significant decline in motivation over the course of the semester with regard to learning with AR technology was observed. An explanation for the differing results could be the discrepancy between the amount of time spent with the AR technology in the present study relative to the study completed by Henssen et al. (2020). The students in the present study had regular interaction with the AR technology throughout the semester because of the integration of dedicated laboratory sessions using the AR technology and also because of the students’ continuous access to the software for personal study use outside of class meetings. In contrast, the study participants in the aforementioned study only used the AR technology over a single visit. As such, it is possible that their students would also have shown a decrease in motivation with continued, regular long-term usage of the AR software. Further, a study by Jiang et al. (2024) found that students’ motivations for an architecture course (which included XR technology integration) were primarily driven by faculty-student interactions, peer interactions, and course structure, not necessarily the XR software itself, although students did appreciate the “deeper understanding” they were able to attain with XR. Thus, it seems that the social aspect of teaching, as well as course design, contribute more heavily to overall motivation in a course; it’s possible, then, that students would experience a decline in motivation of other innovative teaching modalities if integrated longitudinally throughout a semester-long course.
In the present study, the technology-based learning sessions were comprised of PowerPoint-free lecture sessions and laboratory sessions (where students performed identification-based and active learning activities using 3DVT and AR in small groups). It is possible that this format resulted in cognitive overload for our students as they adjusted to these new learning methodologies, as other studies have indicated can occur with the integration of XR technologies (Bork et al., 2021; Chen, 2008; Dunleavy et al., 2009; Phon et al., 2014). Thus, the students’ overall decline in average emotional sentiment over the technology-based learning sessions could partially be due to depleted working memory resources. In addition, some students reported frustrations with the AR-based laboratory portion of the technology-based learning sessions—since they were projecting 3D digital models onto actual reality through their device screens, the background of their screen view tended to include classmates circulating throughout the classroom to complete their own AR-based learning activities. This distraction certainly could have contributed to attentional difficulties and extraneous (task-unrelated) cognitive load, resulting in the subsequent selections of fewer positive-sentiment emoji.
Still, most students reported that the technologies supported their engagement in the classroom setting. Some students also noted that using the technologies helped with peer engagement and collaboration, echoing the results of a review by Moro et al. (2017) and of a study conducted by Radu and Schneider (2023), which found that groups using AR technology were able to finish a physics educational task quicker, were able to locate relevant information, and were able to communicate effectively regarding the AR-based visual inputs. Interestingly, approximately 40% of students in the present study identified these technologies as their preferred way of learning the 3D-based aspects of anatomy, even more so than using whole-body donors (i.e., cadavers), bones, or medical specimens. These students were only exposed to 12 h of time spent learning in the anatomy laboratory over the course of the semester, so it is possible they were not as comfortable nor as engaged in the anatomy laboratory due to limited exposure. Meanwhile, the students had continuous access to the technologies throughout the semester, so it is possible this preference was simply due to familiarity with the learning methodology. However, the literature supports 3DVT and AR technology as effective learning modalities in anatomy courses (Tavanti and Lind, 2001; Küçük et al., 2016; Moro et al., 2017; Triepels et al., 2020; Bölek et al., 2021; Moro et al., 2021). Thus, it is entirely possible that students preferred using these technologies because they genuinely presented an effective way to learn anatomy.
Students selected emoji corresponding to more negative emotional sentiments over the examination sessions. Since academic anxiety (a mix of tension and worry) is often related to fear of failure or underperformance, students’ subjective experiences of examination-based anxiety is typically a negative experience, described by Zeidner (1998) as “pain, suffering, and misery.” In the case of this course, high school students were required to complete a potentially novel type of assessment (i.e., timed group examinations consisting of identification of anatomical structures and their complex spatial relationships) in addition to being assessed in multiple manners over the course of an examination session. Thus, the authors anticipated that students would feel some degree of anxiety, fear, nervousness, and perhaps uncertainty when approaching the examination sessions. The data support this conclusion, as many more students selected the “grimacing face” emoji (corresponding to the prompt words of “nervous, anxious, scared, afraid, frustrated”) before examination sessions relative to after examination sessions. Concerning the hypothesis regarding the average emotional sentiment change over the examination sessions, a statistically significant difference in the average emotional sentiment across the examination sessions was observed, with more positive-sentiment selections found after the examinations as compared to before the examinations, though the average emotional sentiment at both time points was lower than the average emotional sentiment data associated with both learning session types. This likely indicates relief due to the completion of the examination or happiness due to their perceived performance on the examination.
Since this is an exploratory study of a newly developed methodology of measuring self-reported emotional sentiment via emoji, there are no directly comparable studies. This is especially so considering its integration into an anatomy course featuring high school students coupled with the integration of 3DVT and AR technology. However, there has been plenty of research examining the efficacy of 3DVT and XR technologies in anatomy courses (Tavanti and Lind, 2001; Yammine and Violato, 2015; Moro et al., 2017; Parong and Mayer, 2018; Triepels et al., 2020; Zhao et al., 2020; Bölek et al., 2021; Hamilton et al., 2021; Moro et al., 2021). Since emoji are a relatively new development as a communication tool, and they are just beginning to be used as affective symbols, copious research into emoji is currently ongoing in many fields (Bai et al., 2019; Jaeger et al., 2019). To the authors’ knowledge, emoji have never been implemented into an education setting in the manner as in the present study.
The major limitation of this study is that there is currently limited data regarding the valence and arousal levels associated with particular emoji. While there are some well-researched studies (Jaeger et al., 2019; Phan et al., 2019; Kutsuzawa et al., 2022), it is reasonable to suspect that the actual valence and arousal values of emoji may be variable depending upon the population demographics. It has been shown that females interpret emoji representing neutral and negative sentiments with a negative bias (Jones et al., 2020), so the ratio of males to females in the present study could affect what types of emoji are more or less likely to be selected, skewing results on a course population level. The authors did not perform statistical analyses comparing emoji selections between females and males in the present study as the ratio between females and males was very unbalanced in the course population. Also, it is unlikely that groups with individuals who are familiar with using emoji in communication would quantify emoji with the same valence and arousal values as compared to groups with individuals who are unfamiliar with using emoji in communication. Therefore, it is possible that the clustering of the selected emoji into sentiment groups based on valence, although supported by literature, may not have accurately reflected the true valence value of the emotion that the student was experiencing. For example, a student selecting the “face screaming in fear” emoji may associate that emoji with a markedly more negative valence than its sentiment category (neutral) suggests.
The authors also acknowledge the inherent bias in self-reporting, especially for something as complex as an emotional state. It is possible that students could have been dishonest in their representation of their emotional state or lacked the self-awareness to be able to accurately select the emoji that most closely matched their actual primary emotional state. The responses to these surveys were only graded for completion, and students were explicitly made aware that their responses should reflect their honest emotional orientation to the learning or examination session, so there was no incentive for students to be intentionally dishonest.
Finally, the authors acknowledge that increasing the sample size of the student population or instituting the emoji survey within other courses (or amongst different student populations) would result in greater statistical power and would increase the likelihood of more robust conclusions.
Future directions for implementing an emoji survey in an educational context could involve a pre-course process to determine where a particular group would place an emoji on the valence or arousal continuum. Since the process to quantify the valence and arousal levels of an emoji is a complex, multifaceted process, it was unreasonable to burden the high school students with these additional tasks throughout the course in the present study; the educational growth of the students always remained the priority. However, as methodology in this field advances, it may become reasonable to have students submit a short pre-course survey that would aid investigators in efficiently quantifying the valence and arousal values to assign to an emoji for a particular course offering. Additionally, it may be prudent for future studies to develop questionnaire prompts that align into specific overarching themes (e.g., student motivation, student development of self-directed learning skills, perceived learning efficacy, etc.) when analyzing students’ emotional responses to instructional interventions. This would allow for more succinct result reporting, along with the advantage of being able to efficiently assess student attitudes within multiple constructs.
Moreover, regarding valence values specifically, developing a more nuanced scale utilizing validated perceived valence values for particular emoji would certainly result in a greater ability to discern the effects of shifting emotional responses during a learning session, a course, or an educational program. Based on the present study, it may not be necessary to implement 10 different emoji in the survey, as just over 95% of the emoji selections throughout the semester were clustered on only five emoji. However, eliminating those underutilized emoji entirely would also eliminate the entire negative-sentiment category, which could skew results. Future studies may determine what emoji are best used in educational settings, what the valence values of those emoji are for specific populations, and how many emoji are necessary within educational settings in order to more precisely examine emotional responses to course material.
The impact of emotion on cognitive load also presents an opportunity for additional investigation. A study by Oaksford et al. (1996) demonstrated that mood can interfere with working memory capacity. Thus, collecting data which measures the degree by which students identify with, or feel, their emotions on a physiological level may be beneficial. Since there is not a consistent and clear correlation regarding the role of positive or negative emotions and their impact on learning outcomes in a general sense, it may be prudent to examine whether the strength of an emotion, measured by its arousal value (i.e., its physiological-activating capacity), is correlated with academic performance.
The present exploratory study, which investigated students’ emotional responses and overall reactions to the integration of 3D technologies into a human anatomy course, offers a means by which instructors can use emoji to easily measure the emotional valence (i.e., sentiment) of the emotions students experience regarding class sessions. This is particularly applicable to instructors wishing to implement significant pedagogical interventions, such as the integration of innovative technology into higher education courses, as particular emotions can either improve or impair learning efficacy, depending on the circumstances of the learning task and learning environment. In the case of the present study, students began both learning session types (technology-based and non-technology-based) with identical average emotional sentiment, which subsequently increased by the end of non-technology-based learning sessions and decreased by the end of technology-based learning sessions. The direct comparison of the average emotional sentiment after each of the learning sessions resulted in a statistically significant difference, indicating that students reported more pleasant emotions following the non-technology-based learning sessions. The lower average emotional sentiment observed after the technology-based learning sessions was likely due to the novelty effect, as the results from the questionnaire indicated that students experienced a decrease in their motivation and a decrease in their excitement to learn using AR technology over the course of the semester. Students reported less pleasant emotions before and after the examination sessions as compared to before or after either of the learning sessions, yet there was a statistically significant increase in average emotional sentiment from before to after examination sessions. The reporting of more pleasant emotions after the examination sessions is likely due to relief, happiness, and/or pride upon examination completion. According to the questionnaire results, the majority of students agreed that the technologies helped to prepare them for examinations, supported classroom engagement, and were not difficult to use. Also, since 95% of emoji selections fell into the positive- and neutral-sentiment categories and the majority of students recommended the 3D technologies, students appear to have generally enjoyed the technological integration into the course and additionally have deemed the technology helpful in facilitating effective learning.
The raw data supporting the conclusions of this article will be made available by the authors, without undue reservation.
The studies involving humans were approved by University of Nebraska Medical Center Office of Regulatory Affairs and Institutional Review Board. The studies were conducted in accordance with the local legislation and institutional requirements. Written informed consent for participation in this study was provided by the participants’ legal guardians/next of kin.
SM: Conceptualization, Data curation, Formal analysis, Investigation, Methodology, Project administration, Software, Validation, Visualization, Writing – original draft, Writing – review & editing. JB: Conceptualization, Data curation, Investigation, Methodology, Resources, Writing – original draft, Writing – review & editing. ES: Conceptualization, Data curation, Investigation, Methodology, Project administration, Resources, Supervision, Writing – original draft, Writing – review & editing.
The author(s) declare that no financial support was received for the research and/or publication of this article.
The authors wish to thank UNMC’s High School Alliance program for generously supporting their efforts to innovate the HSA anatomy curriculum, study its impacts, and disseminate their findings. The authors would also like to offer heartfelt appreciation and gratitude to the whole-body donors who so graciously donated their bodies in order to educate future health care professionals.
The authors declare that the research was conducted in the absence of any commercial or financial relationships that could be construed as a potential conflict of interest.
The authors declare that no Generative AI was used in the creation of this manuscript.
All claims expressed in this article are solely those of the authors and do not necessarily represent those of their affiliated organizations, or those of the publisher, the editors and the reviewers. Any product that may be evaluated in this article, or claim that may be made by its manufacturer, is not guaranteed or endorsed by the publisher.
Bai, Q., Dan, Q., Mu, Z., and Yang, M. (2019). A systematic review of emoji: current research and future perspectives. Front. Psychol. 10:2221. doi: 10.3389/fpsyg.2019.02221
Bergman, E. M., Verheijen, I. W., Scherpbier, A. J., Van der Vleuten, C. P., and De Bruin, A. B. (2014). Influences on anatomical knowledge: the complete arguments. Clin. Anat. 27, 296–303. doi: 10.1002/ca.22341
Bölek, K. A., De Jong, G., and Henssen, D. (2021). The effectiveness of the use of augmented reality in anatomy education: a systematic review and meta-analysis. Sci. Rep. 11:15292. doi: 10.1038/s41598-021-94721-4
Bork, F., Lehner, A., Eck, U., Navab, N., Waschke, J., and Kugelmann, D. (2021). The effectiveness of collaborative augmented reality in gross anatomy teaching: a quantitative and qualitative pilot study. Anat. Sci. Educ. 14, 590–604. doi: 10.1002/ase.2016
Bork, F., Stratmann, L., Enssle, S., Eck, U., Navab, N., Waschke, J., et al. (2019). The benefits of an augmented reality magic mirror system for integrated radiology teaching in gross anatomy. Anat. Sci. Educ. 12, 585–598. doi: 10.1002/ase.1864
Brody, N., and Caldwell, L. (2019). Cues filtered in, cues filtered out, cues cute, and cues grotesque: teaching mediated communication with emoji pictionary. Commun. Teach. 33, 127–131. doi: 10.1080/17404622.2017.1401730
Chen, Y. C. (2008). “Peer learning in an AR-based learning environment”, in Proceedings - ICCE 2008: 16th 16th International conference on computers in education, national central university, Taipei, Taiwan, 8 October. Taoyuan City, Taiwan: Asia-Pacific Society for Computers in Education, 291–295.
Chen, C. M., and Wang, H.-P. (2011). Using emotion recognition technology to assess the effects of different multimedia materials on learning emotion and performance. Libr. Inf. Sci. Res. 33, 244–255. doi: 10.1016/j.lisr.2010.09.010
Drake, R. L., McBride, J. M., Lachman, N., and Pawlina, W. (2009). Medical education in the anatomical sciences: the winds of change continue to blow. Anat. Sci. Educ. 2, 253–259. doi: 10.1002/ase.117
Dunleavy, M., Dede, C., and Mitchell, R. (2009). Affordances and limitations of immersive participatory augmented reality simulations for teaching and learning. J. Sci. Educ. Technol. 18, 7–22. doi: 10.1007/s10956-008-9119-1
Dyer, G. S., and Thorndike, M. E. (2000). Quidne mortui vivos docent? The evolving purpose of human dissection in medical education. Acad. Med. 75, 969–979. doi: 10.1097/00001888-200010000-00008
Efklides, A., Kourkoulou, A., Mitsiou, F., and Ziliaskopoulou, D. (2006). Metacognitive knowledge of effort, personality factors, and mood state: their relationships with effort-related metacognitive experiences. Metacogn. Learn. 1, 33–49. doi: 10.1007/s11409-006-6581-0
Ekman, P. (1992). An argument for basic emotions. Cognit. Emot. 6, 169–200. doi: 10.1080/02699939208411068
Ellis, H. C., and Ashbrook, P. W. (1988). “Resource allocation model of the effects of depressed mood states on memory” in Affect, cognition and social behaviour. eds. K. Fiedler and J. Forgas (Toronto, ON, Canada: Hogrefe), 25–43.
Ellis, H. C., Thomas, R. L., McFarland, A. D., and Lane, J. W. (1985). Emotional mood states and retrieval in episodic memory. J. Exp. Psychol. Learn. Mem. Cogn. 10, 470–482. doi: 10.1037/0278-7393.11.2.363
Ellsworth, P. C., and Scherer, K. R. (2003). “Appraisal processes in emotion” in Handbook of affective sciences. eds. R. J. Davidson, H. H. Goldsmith, and K. R. Scherer (New York, NY: Oxford University Press), 572–595.
Erez, A., and Isen, A. M. (2002). The influence of positive affect on the components of expectancy motivation. J. Appl. Psychol. 87, 1055–1067. doi: 10.1037/0021-9010.87.6.1055
Feldman Barrett, L., and Fossum, T. (2001). Mental representations of affect knowledge. Cognit. Emot. 15, 333–363. doi: 10.1080/02699930125711
Feldman Barrett, L., and Russell, J. A. (1998). Independence and bipolarity in the structure of current affect. J. Pers. Soc. Psychol. 74, 967–984. doi: 10.1037/0022-3514.74.4.967
Ferré, P., Haro, J., Pérez-Sánchez, M. Á., Moreno, I., and Hinojosa, J. A. (2023). Emoji-SP, the Spanish emoji database: visual complexity, familiarity, frequency of use, clarity, and emotional valence and arousal norms for 1031 emojis. Behav. Res. Methods 55, 1715–1733. doi: 10.3758/s13428-022-01893-6
Ferrer-Torregrosa, J., Jiménez-Rodríguez, M. Á., Torralba-Estelles, J., Garzón-Farinós, F., Pérez-Bermejo, M., and Fernández-Ehrling, N. (2016). Distance learning ects and flipped classroom in the anatomy learning: comparative study of the use of augmented reality, video and notes. BMC Med. Educ. 16:230. doi: 10.1186/s12909-016-0757-3
Fiedler, K., and Beier, S. (2014). “Affect and cognitive processes in educational contexts” in International handbook of emotions in education. eds. R. Pekrun and L. Linnenbrink-Garcia (New York, NY: Routledge/Taylor & Francis Group), 36–55.
Gantiva, C., Sotaquirá, M., Araujo, A., and Cuervo, P. (2020). Cortical processing of human and emoji faces: an ERP analysis. Behav. Inform. Technol. 39, 935–943. doi: 10.1080/0144929X.2019.1632933
Guthrie Yarwood, M. (2022). Psychology of human emotion: an open access textbook. Montreal, Quebec: Pressbooks. Available at: https://psu.pb.unizin.org/psych425/ (Accessed September 1, 2023).
Hamilton, D., Mckechnie, J., Edgerton, E., and Wilson, C. (2021). Immersive virtual reality as a pedagogical tool in education: a systematic literature review of quantitative learning outcomes and experimental design. J. Comput. Educ. 8, 1–32. doi: 10.1007/s40692-020-00169-2
Henssen, D. J. H. A., van den Heuvel, L., De Jong, G., Vorstenbosch, M. A. T. M., van Cappellen van Walsum, A. M., Van den Hurk, M. M., et al. (2020). Neuroanatomy learning: augmented reality vs. cross-sections. Anat. Sci. Educ. 13, 353–365. doi: 10.1002/ase.1912
Hopp, T., and Gangadharbatla, H. (2016). Novelty effects in augmented reality advertising environments: the influence of exposure time and self-efficacy. J. Curr. Issues Res. Advertising 37, 113–130. doi: 10.1080/10641734.2016.1171179
Isen, A. M., and Baron, R. A. (1991). Positive affect as a factor in organizational behavior. Res. Organ. Behav. 13, 1–53.
Isen, A. M., Daubman, K. A., and Nowicki, G. P. (1987). Positive affect facilitates creative problem solving. J. Pers. Soc. Psychol. 52, 1122–1131. doi: 10.1037/0022-3514.52.6.1122
Isen, A. M., and Means, B. (1983). The influence of positive affect on decision-making strategy. Soc. Cogn. 2, 18–31. doi: 10.1521/soco.1983.2.1.18
Isen, A. M., Shalker, T. E., Clark, M., and Karp, L. (1978). Affect, accessibility of material in memory, and behavior: a cognitive loop? J. Pers. Soc. Psychol. 36, 1–12. doi: 10.1037//0022-3514.36.1.1
Izard, C. E. (2007). Basic emotions, natural kinds, emotion schemas, and a new paradigm. Perspect. Psychol. Sci. 2, 260–280. doi: 10.1111/j.1745-6916.2007.00044.x
Jaeger, S. R., Roigard, C. M., Jin, D., Vidal, L., and Ares, G. (2019). Valence, arousal and sentiment meanings of 33 facial emoji: insights for the use of emoji in consumer research. Food Res. Int. 119, 895–907. doi: 10.1016/j.foodres.2018.10.074
Jiang, J., Goepel, G., Crolla, K., and Fryer, L. (2024). Impact of extended reality on students' interest, self-efficacy and performance in architecture education: a mixed-methods research. Adv. Eng. Inform. 62:102744. doi: 10.1016/j.aei.2024.102744
Jones, L. L., Wurm, L. H., Norville, G. A., and Mullins, K. L. (2020). Sex differences in emoji use, familiarity, and valence. Comput. Hum. Behav. 108:106305. doi: 10.1016/j.chb.2020.106305
Jung, N., Wranke, C., Hamburger, K., and Knauff, M. (2014). How emotions affect logical reasoning: evidence from experiments with mood-manipulated participants, spider phobics, and people with exam anxiety. Front. Psychol. 5:570. doi: 10.3389/fpsyg.2014.00570
Kleinginna, P. R., and Kleinginna, A. M. (1981). A categorized list of emotion definitions, with suggestions for a consensual definition. Motiv. Emot. 5, 345–379. doi: 10.1007/BF00992553
Küçük, S., Kapakin, S., and Göktaş, Y. (2016). Learning anatomy via mobile augmented reality: effects on achievement and cognitive load. Anat. Sci. Educ. 9, 411–421. doi: 10.1002/ase.1603
Kutsuzawa, G., Umemura, H., Eto, K., and Kobayashi, Y. (2022). Classification of 74 facial emoji's emotional states on the valence-arousal axes. Sci. Rep. 12:398. doi: 10.1038/s41598-021-04357-7
Larsen, R. J., and Diener, E. (1992). “Promises and problems with the circumplex model of emotion” in Review of personality and social psychology. ed. M. S. Cark (Newbury Park, CA: Sage), 25–59.
Li, L., Wu, S., Wang, J., Wang, C., Zuo, W., Yu, L., et al. (2023). Development of the emoji faces pain scale and its validation on mobile devices in adult surgery patients: longitudinal observational study. J. Med. Internet Res. 25:e41189. doi: 10.2196/41189
McBride, J. M., and Drake, R. L. (2018). National survey on anatomical sciences in medical education. Anat. Sci. Educ. 11, 7–14. doi: 10.1002/ase.1760
Miguel-Alonso, I., Checa, D., Guillen-Sanz, H., and Bustillo, A. (2024). Evaluation of the novelty effect in immersive virtual reality learning experiences. Virtual Reality 28:27. doi: 10.1007/s10055-023-00926-5
Moro, C., Birt, J., Stromberga, Z., Phelps, C., Clark, J., Glasziou, P., et al. (2021). Virtual and augmented reality enhancements to medical and science student physiology and anatomy test performance: a systematic review and meta-analysis. Anat. Sci. Educ. 14, 368–376. doi: 10.1002/ase.2049
Moro, C., Štromberga, Z., Raikos, A., and Stirling, A. (2017). The effectiveness of virtual and augmented reality in health sciences and medical anatomy. Anat. Sci. Educ. 10, 549–559. doi: 10.1002/ase.1696
Oaksford, M., Morris, F., Grainger, B., and Williams, J. M. G. (1996). Mood, reasoning, and central executive processes. J. Exp. Psychol. Learn. Mem. Cogn. 22, 476–492. doi: 10.1037/0278-7393.22.2.476
Parong, J., and Mayer, R. E. (2018). Learning science in immersive virtual reality. J. Educ. Psychol. 110, 785–797. doi: 10.1037/edu0000241
Pekrun, R. (2006). The control-value theory of achievement emotions: assumptions, corollaries, and implications for educational research and practice. Educ. Psychol. Rev. 18, 315–341. doi: 10.1007/s10648-006-9029-9
Pekrun, R., and Linnenbrink-Garcia, L. (2014). “Introduction to emotions in education” in International handbook of emotions in education. eds. R. Pekrun and L. Linnenbrink-Garcia (New York, NY: Routledge/Taylor & Francis Group), 1–10.
Phan, W. M. J., Amrhein, R., Rounds, J., and Lewis, P. (2019). Contextualizing interest scales with emojis: implications for measurement and validity. J. Career Assess. 27, 114–133. doi: 10.1177/1069072717748647
Phelps, E. A. (2004). Human emotion and memory: interactions of the amygdala and hippocampal complex. Curr. Opin. Neurobiol. 14, 198–202. doi: 10.1016/j.conb.2004.03.015
Phon, D. N., Ali, M. B., and Halim, N. D. (2014). “Collaborative augmented reality in education: a review” in LATICE ‘14: Proceedings of the 2014 International conference on teaching and learning in computing and engineering, Kuching, Malaysia (Piscataway, NJ: Institute of Electrical and Electronics Engineers (IEEE), 11 -13 April.) Washington, DC: IEEE Computer Society, 78–83.
Piaget, J., and Garcia, R. (1989). Psychogenesis and the history of science. New York, NY: Columbia University Press.
Posner, J., Russell, J. A., and Peterson, B. S. (2005). The circumplex model of affect: an integrative approach to affective neuroscience, cognitive development, and psychopathology. Dev. Psychopathol. 17, 715–734. doi: 10.1017/S0954579405050340
Radu, I., and Schneider, B. (2023). How augmented reality (AR) can help and hinder collaborative learning: a study of AR in electromagnetism education. IEEE Trans. Vis. Comput. Graph. 29, 3734–3745. doi: 10.1109/TVCG.2022.3169980
Rodrigues, D., Prada, M., Gaspar, R., Garrido, M. V., and Lopes, D. (2018). Lisbon emoji and emoticon database (LEED): norms for emoji and emoticons in seven evaluative dimensions. Behav. Res. Methods 50, 392–405. doi: 10.3758/s13428-017-0878-6
Romand, M., Dugas, D., Gaudet-Blavignac, C., Rochat, J., and Lovis, C. (2020). Mixed and augmented reality tools in the medical anatomy curriculum. Stud. Health Technol. Inform. 270, 322–326. doi: 10.3233/SHTI200175
Russell, J. A. (1980). A circumplex model of affect. J. Pers. Soc. Psychol. 39, 1161–1178. doi: 10.1037/h0077714
Russell, J. A. (2003). Core affect and the psychological construction of emotion. Psychol. Rev. 110, 145–172. doi: 10.1037/0033-295X.110.1.145
Scherer, K. R., Schorr, A., and Johnstone, T. (2001). Appraisal processes in emotion: Theory, methods, research. Oxford, NY: Oxford University Press.
Schouteten, J. J., Llobell, F., Chheang, S. L., Jin, D., and Jaeger, S. R. (2023). Emoji meanings (pleasure-arousal-dominance dimensions) in consumer research: between-country and interpersonal differences. J. Food Sci. 88, 106–121. doi: 10.1111/1750-3841.16374
Seibert, P. S., and Ellis, H. C. (1991). Irrelevant thoughts, emotional mood states, and cognitive task performance. Mem. Cogn. 19, 507–513. doi: 10.3758/BF03199574
Shojaei, A., Feili, A., Kojuri, J., Norafshan, A., and Bazrafkan, L. (2022). The blacksmith approach: a strategy for teaching and learning in the medical anatomy course (a qualitative study). BMC Med. Educ. 22:728. doi: 10.1186/s12909-022-03800-1
Shuman, V., and Scherer, K. R. (2014). “Concepts and structures of emotions” in International handbook of emotions in education. eds. R. Pekrun and L. Linnenbrink-Garcia (New York, NY: Routledge/Taylor & Francis Group), 13–35.
Sung, J., Christensen, H. I., and Grinter, R. E. (2009). “Robots in the wild: understanding long-term use” in HRI ‘09: Proceedings of the 4th ACM/IEEE international conference on human robot interaction, La Jolla, CA, 9 -13 March. New York, NY: Association for Computing Machinery, 45–52.
Tavanti, M., and Lind, M. (2001). “2D vs 3D, implications on spatial memory” in Proceedings of the IEEE symposium on information visualization 2001 (INFOVIS'01) (IEEE Computer: Society).
Thomas, R. G., John, N. W., and Delieu, J. M. (2010). Augmented reality for anatomical education. J. Visual Commun. 33, 6–15. doi: 10.3109/17453050903557359
Triepels, C. P. R., Smeets, C. F. A., Notten, K. J. B., Kruitwagen, R. F. P. M., Futterer, J. J., Vergeldt, T. F. M., et al. (2020). Does three-dimensional anatomy improve student understanding? Clin. Anat. 33, 25–33. doi: 10.1002/ca.23405
Tyng, C. M., Amin, H. U., Saad, M. N. M., and Malik, A. S. (2017). The influences of emotion on learning and memory. Front. Psychol. 8:1454. doi: 10.3389/fpsyg.2017.01454
Um, E. R., Plass, J. L., Hayward, E. O., and Homer, B. D. (2012). Emotional design in multimedia learning. J. Educ. Psychol. 104, 485–498. doi: 10.1037/a0026609
Um, E. R., Song, H., and Plass, J. (2007). ‘The effect of positive emotions on multimedia learning’ in Proceedings of ED-MEDIA 2007 --world conference on educational multimedia, hypermedia and telecommunications, (Vancouver, Canada, 25 June. Waynesville, NC: Association for the Advancement of Computing in Education), 4176–4185.
Unicode. (2024). Emoji Counts, v15.1. Available online at: https://unicode.org/emoji/charts/emoji-counts.html (Accessed October 15, 2024).
Visible Body (2023). Visible Body suite (version 4.02.011) [Mobile app]. Available online at: https://www.https://www.visiblebody.com/ (Accessed January 15, 2023).
von Jan, U., Noll, C., Behrends, M., and Albrecht, U.-V. (2012). mARble—augmented reality in medical education. Biomed. Eng. 57, S67–S70. doi: 10.1515/bmt-2012-4252
Vuilleumier, P. (2005). How brains beware: neural mechanisms of emotional attention. Trends Cogn. Sci. 9, 585–594. doi: 10.1016/j.tics.2005.10.011
Wainman, B., Pukas, G., Wolak, L., Mohanraj, S., and Norman, G. R. (2019). The critical role of stereopsis in virtual and mixed reality learning environments. Anat. Sci. Educ. 13, 401–412. doi: 10.1002/ase.1928
Watson, D., Clark, L. A., and Tellegen, A. (1988). Development and validation of brief measures of positive and negative affect: the PANAS scale. J. Pers. Soc. Psychol. 54, 1063–1070. doi: 10.1037/0022-3514.54.6.1063
Wong, D. L., and Baker, C. M. (1988). Pain in children: comparison of assessment scales. Pediatr. Nurs. 14, 9–17
Yammine, K., and Violato, C. (2015). A meta-analysis of the educational effectiveness of three-dimensional visualization technologies in teaching anatomy. Anat. Sci. Educ. 8, 525–538. doi: 10.1002/ase.1510
Keywords: emotion, emotional valence, emoji, anatomy education, technology, augmented reality, 3D learning
Citation: Magrum SM, Bird J and Snow EL (2025) Using emoji to ascertain student emotional responses to technology-based human anatomy instruction. Front. Educ. 10:1528443. doi: 10.3389/feduc.2025.1528443
Edited by:
Emilio Jesús Lizarte, University of Granada, SpainReviewed by:
Mª Teresa Castilla Mesa, Universidad de Málaga, SpainCopyright © 2025 Magrum, Bird and Snow. This is an open-access article distributed under the terms of the Creative Commons Attribution License (CC BY). The use, distribution or reproduction in other forums is permitted, provided the original author(s) and the copyright owner(s) are credited and that the original publication in this journal is cited, in accordance with accepted academic practice. No use, distribution or reproduction is permitted which does not comply with these terms.
*Correspondence: Shawn M. Magrum, c2hhd25tYWdydW1AY3JlaWdodG9uLmVkdQ==
Disclaimer: All claims expressed in this article are solely those of the authors and do not necessarily represent those of their affiliated organizations, or those of the publisher, the editors and the reviewers. Any product that may be evaluated in this article or claim that may be made by its manufacturer is not guaranteed or endorsed by the publisher.
Research integrity at Frontiers
Learn more about the work of our research integrity team to safeguard the quality of each article we publish.