 Jorine Adinda Vermeulen
94% of researchers rate our articles as excellent or good
Learn more about the work of our research integrity team to safeguard the quality of each article we publish.
Find out more
ORIGINAL RESEARCH article
Front. Educ., 02 October 2020
Sec. Assessment, Testing and Applied Measurement
Volume 5 - 2020 | https://doi.org/10.3389/feduc.2020.537531
Subtraction errors can inform teachers about students’ mathematical reasoning. Not every subtraction error is informative, it’s implications for students’ mathematical reasoning depends on the item characteristics. Diagnostic items are specifically designed to elicit specific subtraction errors. This study evaluated how the diagnostic capacity of subtraction items is related to their characteristics. The item characteristics being studied are open-ended and multiple-choice (MC) items, bare number, and word problems. As well as various number features, such as the number of digits in the subtrahend and minuend. Diagnostic capacity is defined as the extent to which multi-digit subtraction items that require borrowing (e.g., 1000−680) elicit bridging errors, such as the smaller-from-larger-error. Item response theory (IRT) was used to estimate item properties. Subsequently, the item properties were used in two separate ANOVA analyses to compare the diagnostic capacity of MC versus open-ended items, bare number versus word problems, and number features. As expected, MC items have a higher diagnostic capacity than open-ended items. More interestingly, it was found that the number of digits in the subtrahend and minuend influenced the diagnostic capacity of the items. Items characterized as 3/4n−3n, like 1000−680 had the highest diagnostic capacity, whereas items characterized as 3/4n−2n, such as 1000−20 had the lowest diagnostic capacity. The discussion focuses on the implications of this study for further research into the design of diagnostic items.
Diagnostic items can be designed to collect specific and fine-grained information about students’ cognitive strengths and weaknesses (Leighton and Gierl, 2007; Keeley and Tobey, 2011; van der Kleij et al., 2015). Because of the specificity of diagnostic data, diagnostic assessment can complement other classroom assessment data obtained with textbook tests, classroom observations, and diagnostic interviews (Huff and Goodman, 2007; Vermeulen et al., unpublished). Subtraction is considered a more difficult computation than addition, especially when items require borrowing (Riccomini, 2005; Narciss and Huth, 2006). Systematic subtraction errors associated with misconceptions about subtraction, multi-digit numbers, and borrowing have been found in several countries, such as France (Lemaire and Callies, 2009), the United States (Fuson, 1990; Selter et al., 2012), and Spain (Fernández and García, 2008). It is widely acknowledged that subtraction errors are indicative of students’ conceptual and procedural understanding of mathematics (Resnick, 1984; Smith et al., 1994; Fuson et al., 1997; Ashlock, 2006; Rittle-Johnson, 2017). However, not every subtraction error is indicative of students’ conceptual and procedural (mis)understanding; some errors are caused due to slips in attention or insufficient number fact knowledge (Hennessy, 1993). In this study, the focus is on errors derived from the smaller-from-larger error that has been observed frequently across educational contexts (Brown and VanLehn, 1980; Young and O’Shea, 1981; Resnick, 1982; VanLehn, 1990; Hennessy, 1993). Students who make smaller-from-larger errors solve the problem 76−48 = as follows: 70−40 = 30, 6−8 is reversed to “smaller-from-larger”: 8−6 = 2, 30 + 2 = 32. In this paper, such errors are called bridging errors (BE). Bridging errors can only be made when subtraction items require borrowing.
In the theoretical framework, we explain the conceptual and procedural misunderstanding that underpin BE and discuss how this misunderstanding is related to students’ procedural development in subtraction and to their conceptual development of multi-digit subtraction, place value, and borrowing. Although the analysis of systematic subtraction errors is not a novel research area, research into the design of diagnostic items to elicit specific errors in subtraction is relatively new. Understanding the item characteristics leading to bridging errors will inform the design of diagnostic subtraction items. In this study, we designed diagnostic items that could elicit three types of BE:
e.g., 43−17 =
1. Smaller from larger. 40−10 = 30, 7−3 (instead of 3−7) = 4, 30 + 4 = 34.
2. Smaller from larger and decrementing the tens (or hundreds): 40−10 = 30, notices 3−7 requires decrementing the tens: 30−10 = 20, applying 7−3 (instead of 3−7) = 4, 20 + 4 = 24.
3. Forgetting to decrement the tens (or hundreds) after borrowing. 40−10 = 30,(1)3−7 = 6, 30 + 6 = 36.
Internationally, there are differences concerning in which grade multi-digit subtraction procedures, such as column-wise and ciphering, are being taught (Beishuizen, 1993; Fuson et al., 1997; Kraemer, 2011). While most educational contexts focus on teaching written strategies such as column-wise subtraction and ciphering, Dutch primary school mathematics focuses on mental strategies such as jumping and decomposition (see Table 1). The first two strategies, counting and jumping, are based on a linear understanding of whole numbers (Gravemeijer et al., 2003; Teppo and Van den Heuvel-Panhuizen, 2013). Jumping is a strategy that originates from abbreviating counting strategies and can be visually supported by the number line (Beishuizen, 1993). In this context, addition and subtraction are understood as jumping further or back on the number line, which also teaches students the inverse relationship between subtraction and addition (Selter et al., 2012; Teppo and Van den Heuvel-Panhuizen, 2013). Students do not require full understanding of the base-ten place-value system to apply jumping strategies (Fuson et al., 1997; Kraemer, 2011). They do need to understand that numbers, i.e., the subtrahend and addend, can be partitioned in smaller numbers to be subtracted from the minuend or added to the augend.
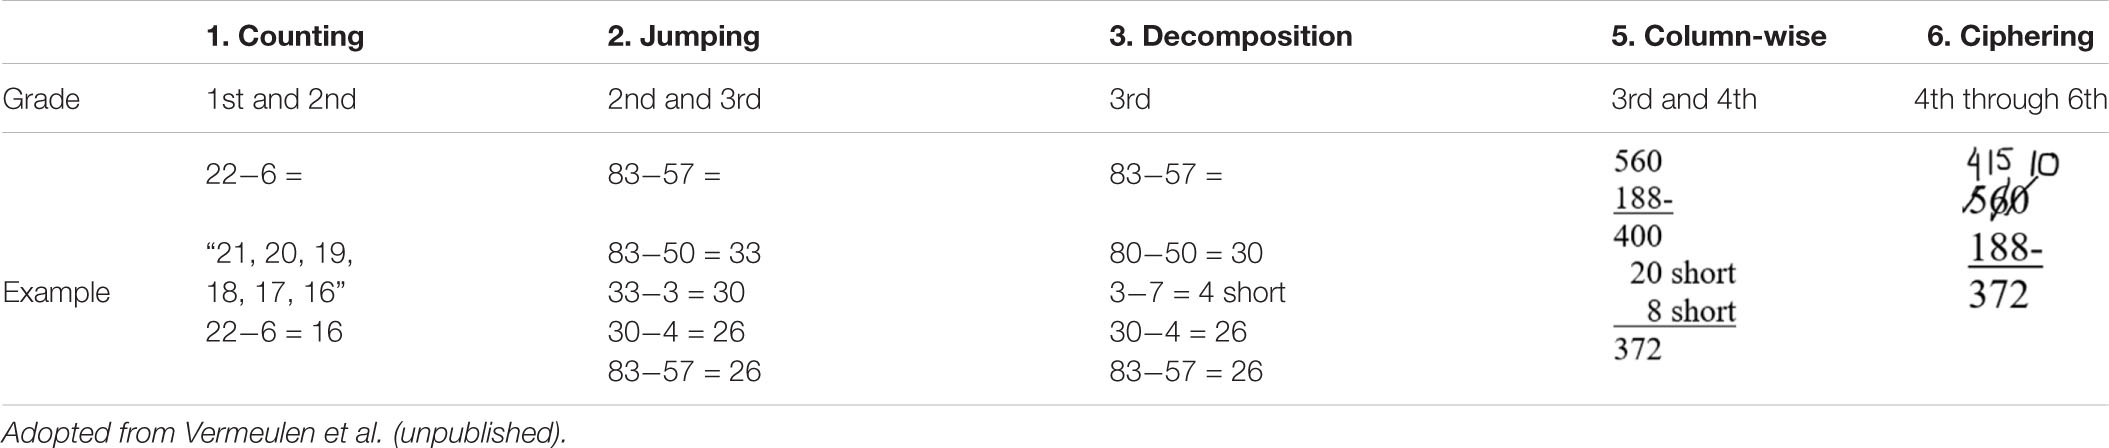
Table 1. Strategies being taught in Dutch subtraction.
Furthermore, parallel to teaching jumping strategies third-grade students’ conceptual understanding of the base-ten place-value system is being promoted through the use of materials that can be grouped into tens and ones, such as money and Multibase Arithmetic Blocks (MAB) (Beishuizen, 1993; Fuson et al., 1997; Blöte et al., 2000; Kraemer, 2011; Howe, 2012, 2019). As a result of the iterative development of conceptual and procedural understanding (Rittle-Johnson, 2017), the use of money and MAB might result in students’ self-discovery of strategies that are underpinned by place-value-based understanding of multi-digit numbers, such as decomposition strategies. However, as was found in earlier research by Resnick (1984) the understanding of place value does not automatically lead to correct use of place-value-based procedures, like decomposition. Moreover, the concept of place-value-based understanding of multi-digit numbers involves multiplication: 200 is 2 × 100 (Howe, 2019). In line with this idea, Bicknell et al. (2017) suggest introducing multiplication and division context problems at a young age to promote students’ part-whole understanding of numbers. For example: “There are 36 pens. Each box holds ten pens. How many full boxes are there?”
During third grade, most Dutch students make the transition from sequential jumping strategies to place-value-based decomposition strategies (Blöte et al., 2000; Kraemer, 2011). As shown in Table 1, decomposition entails subtracting the tens and units of the minuend and subtrahend separately and subsequently combining the results of both subtractions. It is important to note that this transition often starts with teaching decomposition for addition (Blöte et al., 2000; Opgenoort, 2014), which is much less prone for errors compared to decomposition for subtraction. Hence, adding the tens and units separately and combining both sums is more straightforward than dealing with a shortage in the units in subtraction. As long as the units in the subtrahend are smaller than the units in the minuend (e.g., in 87−53 = , 3 is smaller than 7), this procedure can be done by treating both the tens and units as single digits rather than as tens and ones: 8−5 = 3; 7−3 = 4; combining this results in 87−53 = 34. However, when the item requires borrowing, 83−57 = , there are not enough units in the minuend to subtract the units of the subtrahend. Thus, to apply decomposition correctly, students need to understand that the 8 stands for 8 times ten or 80 and that each ten consists of ten units (Fuson et al., 1997; Kraemer, 2011). This separate-tens-and-units concept (Fuson et al., 1997) makes it possible that one ten can be exchanged (i.e., borrowed) for units to subtract the remaining units of the minuend (Resnick, 1984). As shown in Table 1, students do not actively borrow one ten to subtract 13−7; rather, they are trained to write down how many units they fall short: 80−50 = 30, 3−7 = 4 short, 30−4 = 26. Hence, Dutch third-grade students are not yet taught the word borrowing; instead, the word “short” is used to teach them that the units they could not subtract from the units in the minuend have to be subtracted from the remaining tens. The word borrowing is taught in fourth through sixth grades in combination with the strategies: column-wise subtraction and ciphering (Opgenoort, 2014).
The procedural transition to decomposition requires the simultaneous transition to an integrated concept of multi-digit numbers. According to Fuson et al. (1997) and Ashlock (2006), the development of an integrated conceptual understanding of both the sequential and base-ten place-value properties of multi-digit numbers is a gradual process. Systematic bridging errors indicate that students have made the procedural transition to decomposition strategies but do not yet fully grasp the base-ten place-value concept that is necessary to solve subtraction items that require borrowing (Resnick, 1984). So, students who tend to make BE show cognitive strength in their procedural understanding and the place-value-based concept of multi-digit numbers because they are transitioning from sequential to decomposition strategies. However, at the same time a lack of conceptual understanding of borrowing can be viewed as a cognitive weakness.
Furthermore, previous research has shown that items that require borrowing elicit many different systematic errors that might all somehow be related to students’ conceptual and procedural understanding of multi-digit subtraction, borrowing, and place value (e.g., VanLehn, 1990; Narciss and Huth, 2006). Given the focus on bridging errors, we want to minimize the number of other errors being elicited by the diagnostic items. Thus, we are interested what item characteristics make subtraction items best suitable for diagnosing BE. To evaluate the diagnostic capacity of subtraction items for diagnosing BE, we focus on three specific item characteristics: item format, answering format, and number features. These item characteristics and their importance in the design of diagnostic items for diagnosing BE are explained below.
In this paragraph, we elaborate on the number features, item formats, and answering formats that were compared in the present study. The methodological details of the design process of the items are described in the section “Materials and Methods.”
As explained above, decomposition strategies are based on students’ understanding of place-value principles. Students may make an incorrect transition from conceptual understanding of single digits to multiple digits in which they view multi-digit numbers as concatenated single digits: 83 is “eight” “three” instead of “eighty-three” (Fuson et al., 1997). Because these students lack the understanding of the compensation principle that allows hundreds, tens, and units to be exchanged (Resnick, 1984), they might treat multi-digit subtraction as concatenated single-digit subtraction in which each digit is subtracted individually. This approach becomes especially problematic when the numbers of the digits in the subtrahend and minuend are unequal. Therefore, it is plausible that the diagnostic capacity of subtraction items is influenced by the number of digits in the subtrahend and minuend. For example, it is to be expected that 357−62 = is more difficult than 634−251 = because in the latter item the number of digits in the subtrahend and minuend are equal.
Although it could be expected that the more difficult unequal digit problems have a higher diagnostic capacity, it is not yet known how the difficulty of the items relates to their diagnostic capacity. Moreover, due to students’ gradual transition from a linear understanding of multi-digit numbers to a place-value-based understanding (Fuson et al., 1997), it is likely they do not immediately understand the conceptual and procedural analogies between two-digit numbers and three-digit numbers. By comparing the diagnostic capacity of items with 2, 3, and 4 digits, we aim to explore the relationship between students’ tendency to make BE and the place-value properties of the items. Teachers could use subsets of diagnostic items to assess students’ ability to transfer conceptual and procedural knowledge of two-digit to three- and four-digit problems that require borrowing.
Moreover, subtraction items can differ in their borrow type, for example 83−26 = requires borrowing from the tens, while 634−251 = requires borrowing from the hundreds, and 400−27 = requires borrowing from both tens and hundreds. Borrowing from both tens and hundreds requires multiple steps, which makes these items more complex. On the one hand, this complexity could make it more likely that bridging errors are elicited; on the other hand, more complex items could also increase the amount of other errors being elicited. This makes it interesting to compare the diagnostic capacity of items that differ in the type and number of borrows.
Item format refers to the way an item is presented: In context as a word problem or as a bare number problem without words or images. Both word and bare number problems are part of the frequently used textbooks in Dutch education. Word problems can convey different meanings of subtraction (taking away and determining the difference), resulting in different solution processes (Kraemer, 2011; Hop, 2012; Selter et al., 2012). In bare number problems, however, subtraction is depicted with the minus sign and is therefore interpreted as taking away, making it likely that the strategies elicited by different bare number items vary less. BE are specifically found when students use a decomposition strategy, also referred to as the 1010-strategy (Beishuizen, 1993); therefore, it is likely that the item format affects the diagnostic capacity of the items.
Regarding the answer format of the items, we were interested in comparing open-ended (OE) and multiple-choice (MC) items. OE items can provide easy-to-code numeric answers and rich data in which different types of subtraction errors can be observed. Also, OE items might help to discover new systematic errors and thereby contribute to research about misconceptions. Moreover, the biggest advantage of MC items is the possibility to efficiently distinguish between a subset of misconceptions through the use of specific errors as distractors, as is done with ordered MC items and second tier items (e.g., Treagust, 1986; Briggs et al., 2006; Briggs and Alonzo, 2009). However, since the number of errors is limited to, for example, three distractors, it may force students into choosing an incorrect answer that does not accurately represent the student’s mathematical reasoning. So, OE and MC items have (dis)advantages as feature of diagnostic items; one could argue they serve different purposes when used in diagnostic assessment. Therefore, we believe it to be relevant to compare the diagnostic capacity of OE and MC items. It is to be expected that MC items have a higher diagnostic capacity than OE items, because the distractors are directly linked to the three types of bridging errors.
The design of the items is elaborated in the section “Materials and Methods.” By answering the following research questions, we intent to inform the design of diagnostic subtraction items and generate new ideas for further research into this relatively new field of assessment research. Additionally, the results of this study can also inform the use of diagnostic subtraction items in classroom assessment.
1. To what extent is the diagnostic capacity related to the item difficulty and how does this relation differ for the item characteristics?
2. To what extent can the differences in the diagnostic capacity of the subtraction items be explained by their characteristics (i.e., item format, answering format, and number features)?
Response data was gathered from 264 third-grade students (132 boys, 130 girls, Missing = 2) from 12 Dutch primary schools participated who received parental permission to participate. The average age of the students was 8.8 years (SD = 0.45, N = 259, Missing = 5). Students’ mathematical ability was measured with the LOVS mid third-grade (M3) test. The LOVS M3 test is a biannual standardized norm-referenced test that most Dutch primary schools use to assess students’ mathematical ability (Janssen et al., 2006, 2010). Students’ answers to the test as well as their ability scores were obtained through their teachers. The average mathematical ability of the students in this sample was M = 69.8 (SD = 15.8; N = 262, Missing = 2), which is slightly lower in comparison to the norm-group mean (μ = 72.2). Keep in mind that this indicates that our sample might not fully represent the average population of third-grade students in Netherlands.
Historical data from the LOVS M3 test was used to identify potential appropriate number features for the diagnostic items. We selected the subtraction items for which bridging errors were among the four most frequent errors. We identified four LOVS M3 subtraction items that often elicit bridging errors: Two bare number items 76−48 = (item 1) and 700−32 = (item 2) and two context problems 300−2 = (item 3) and 1000−680 = (item 4, see Figure 1). The proportions correct were 0.752 (item 3), 0.628 (item 1), 0.561 (item 2), and 0.544 (item 4). The number features of Item 3 (300−2 = ) were not used since these features were expected to be too easy for diagnostic purposes mid third grade.

Figure 1. Contexts of the LOVS M5 subtraction items that require bridging translated from Dutch to English: (A) when we get two more children at the school, there will be exactly 300 children. How many children are at the school now? What is the answer to mister Kees’ question? (B) Remco is saving for a new computer. He has saved 680 euro. How many euros does he need to save?
Bridging errors are associated with the use of decomposition strategies; therefore, we aimed to minimize the elicitation of strategies associated with jumping, like compensation and subtraction by addition. We used three number constraints to create the number features we are interested in. The first constraint was that the units may not be 8 or 9, because these digits elicit compensation strategies such as 76−48 = via 76−50 = 26, 26 + 2 = 28 (Torbeyns et al., 2008). By avoiding digits 8 and 9 as units, it becomes less likely that compensation errors are being elicited. For the same reason, 80 and 90 should be avoided when constructing item types 8 and 9.
Secondly, subtraction by addition could make the elicitation of bridging errors less likely. To avoid elicitation of the strategy subtraction by addition (e.g., solving 73−67 = , via 67 + ? = 73; Torbeyns et al., 2008), the distance between the minuend (e.g., 73) and the subtrahend (e.g., 67) should always be larger than 10.
The last design constraint concerning the number features of the items focused on accidently getting the right answer while applying an erroneous strategy. Hence, items that are not able to distinguish between the correct answer and a bridging error will not result in a valid diagnosis. For example, when solving the item 82−27, borrowing a ten would result in (1) 2−7 = 5, whereas reversing the units 7−2 would also give 5 as the result. Students who make BE type 2 would accidently come to the right answer. Therefore, correct answers to items like 82−27 = do not always provide valid diagnostic information about bridging errors. Similarly, items like 81−26 = with (1)1−6 = 5 and 6−1 = 5 should be avoided. Table 2 illustrates the 9 item types that were constructed using the type of borrow and number of digits as the two main number features. Item types 1, 7, and 9 were based on three of the LOVS items mentioned above. The other items were designed by varying the type of borrow and the number of digits based on what is commonly found in Dutch third-grade textbooks. For each item type, 6 items were constructed using three constraints regarding the number characteristics of the subtrahend and minuend. A total of 54 subtraction items that require bridging the tens and/or hundreds were constructed (see Supplementary Appendix A).
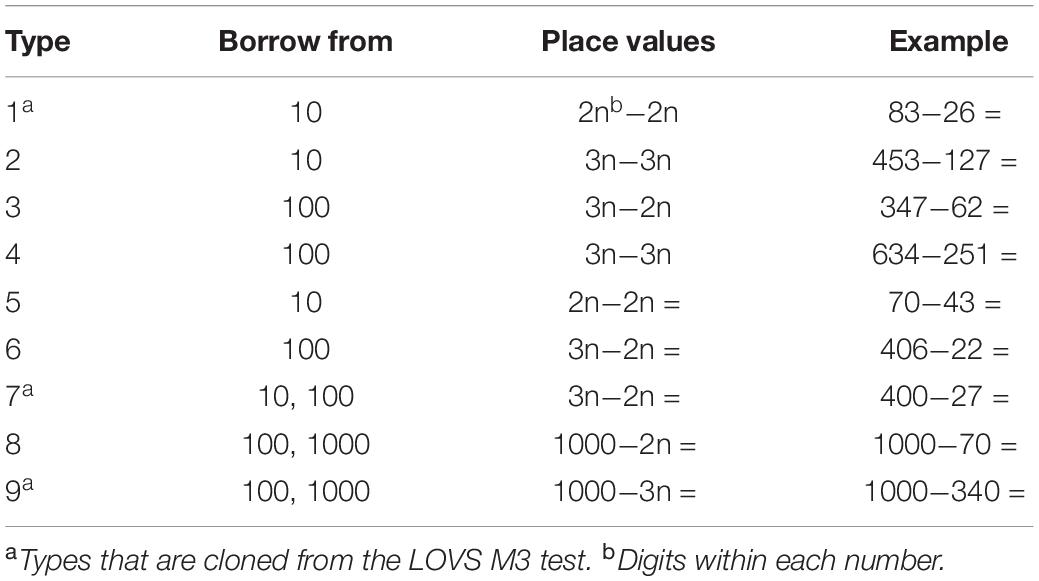
Table 2. Item types for bridging errors in third grade subtraction.
Moreover, for the comparison between word and bare number problems, three word-problems were created (of which one was MC) for each item type. The translation of these originally Dutch items is included in English in Supplementary Appendix B. MC items force students to choose one of the given (bridging) errors. Therefore, the data collected with MC items are not as rich, as data collected with open-ended items. For that reason, it was decided to construct only 2 MC items for each item type, resulting in a total of 18 MC items. All MC items, except for items 0801 and 0804 included solely BE as distractors. Based on error frequencies observed in the historical data, two of the distractors of items 0801 and 0804 were other common errors. More specifically, for item 0801: 1000−70 = 970 (BE), 300, and 30 were used as distractors. For item 0804: 1000−30 = , 1070 (BE), 700, and 70 were used as distractors. The possible consequences of this choice are addressed in the section “Discussion.”
As is shown in Table 2, items vary in the type of bridge that is required; students must bridge the tens, hundreds, or multiple. Determining the bridging errors for items where students must bridge the hundred goes in the same way as bridging the tens. For example, for item 347−62 = (i.e., item type 3), possible bridging errors are 325 (BE1), 225 (BE2), and 385 (BE3). BE1 (325) is calculated as follows: 300−0 = 300; 60−40 = 20 (i.e., reversing 40−60); 7−2 = 5; 300 + 20 + 5 = 325. In BE2, the student does the same but also increments one hundred resulting in the answer 225. Finally, students who make BE3 do not reverse 40−60, but they do forget to increment one hundred; they calculate (1) 40−60 = 80; 300 + 80 + 5 = 385. For items that require bridging both bridging the tens and the hundreds, there are 15 possible bridging errors: 3 unique errors for either the tens or the hundreds and 9 unique errors that are combinations of errors in the tens and hundreds (i.e., 3 + 3 + 9 = 15). Based on the above-described rules for calculating bridging errors, we determined every possible bridging error for the 54 items in DI (see Supplementary Appendix A). The responses to the open items were automatically scored identifying correct responses and bridging errors by using the BE in Supplementary Appendix A.
Because a test with 54 subtraction items is too long for third-grade students, an incomplete research design with linked items was used. Item types 1, 7, and 9 were used as anchor items because these items were cloned from LOVS M3 items, which means that those items match third-grade students’ subtraction skills. Two additional item types were selected based on students’ responses to the four subtraction items from the LOVS M3 test mentioned above. This selection process is shown in the flowchart included in Supplementary Appendix C. The four items from the LOVS M3 test were ordered from low to high p-value. Depending on whether the student answered the LOVS item correct or incorrect, it was decided what item type was included in the students’ test. In this way, a form of adaptive assessment was implemented in which students were administered items with an appropriate difficulty level in line with the student’s subtraction skill. This process resulted in 11 booklets with 30 items each, of which 18 items were common across all version (see Figure 2).
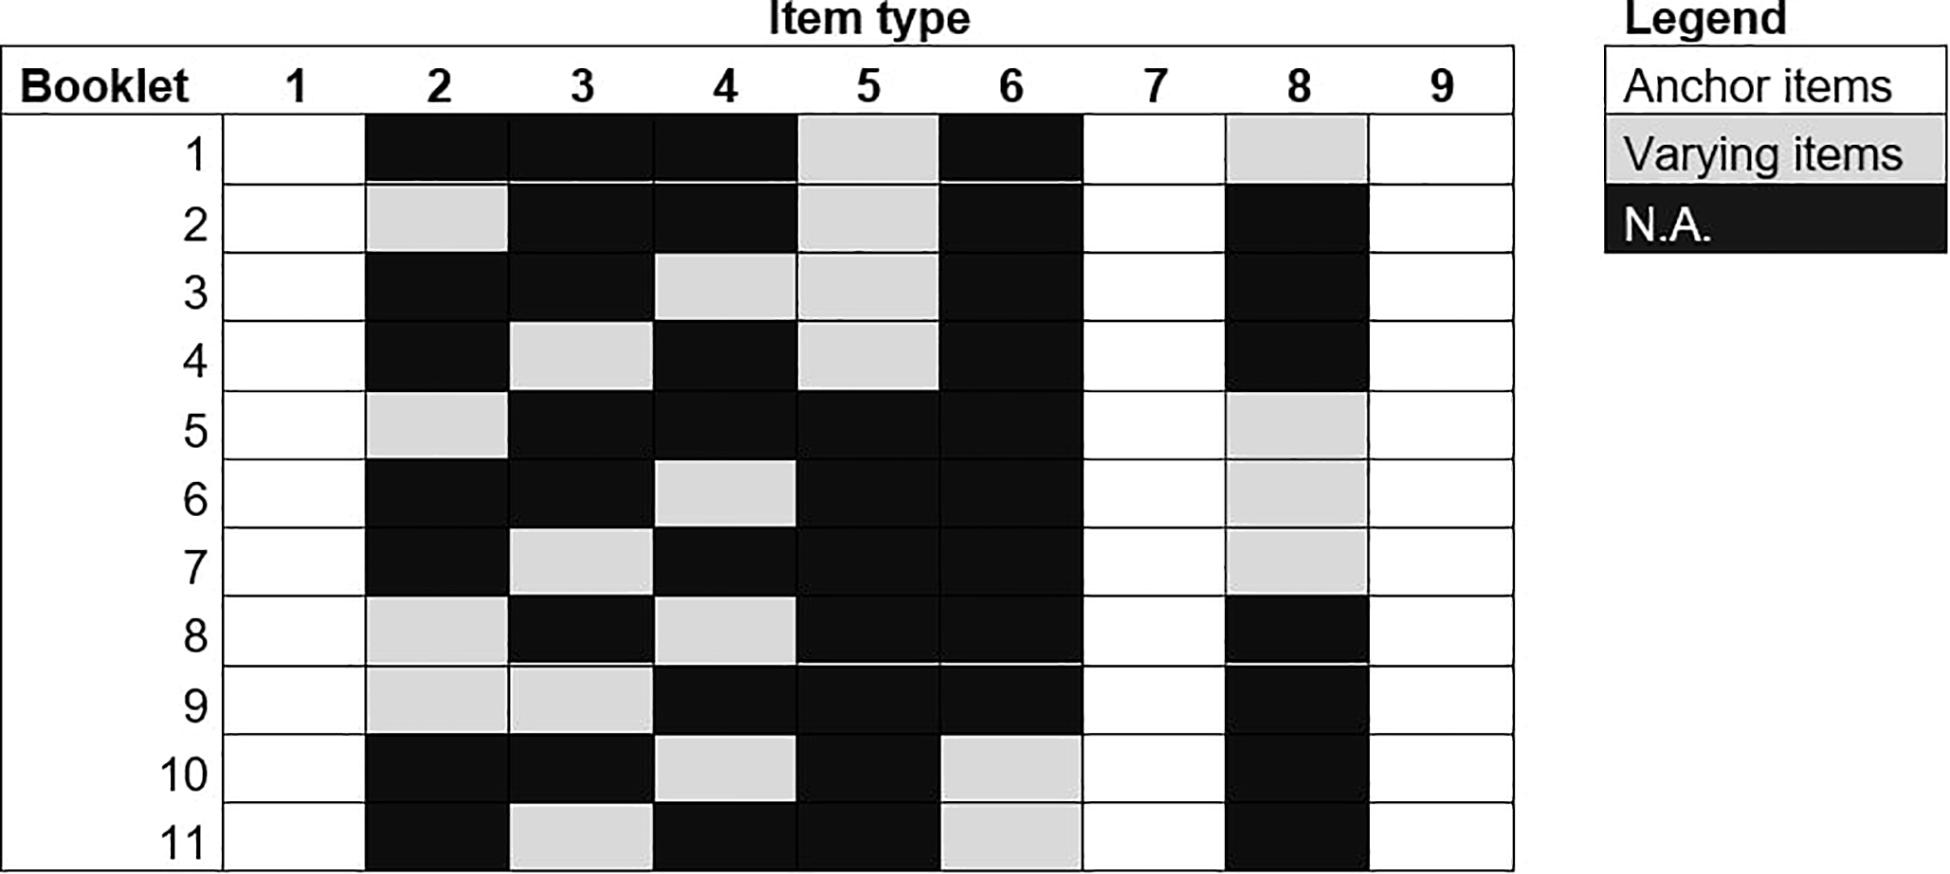
Figure 2. Booklet design that resulted from the adaptive selection of items shown in Supplementary Appendix C.
A research assistant or researcher administrated the DI in each classroom. A standardized instruction was read aloud by the test administrator: “This test consists of 30 subtraction problems. You may write down your calculations in the box next to the problem. We are now going to practice two problems together.” Next, the test administrator practiced two example subtraction problems with the students. The correct answers to the practice problems were given, but no strategies were discussed. Although there was no official time limit, after 60 min the test administrator would collect all the booklets. Most students finished within 60 min. The incidental students who could not finish the test within 60 min were offered to finish it later. Their tests were returned to the researchers by the teacher via mail. When the test administrator and teacher observed a student struggled too much, they gave the student the choice to stop the test at any given moment.
Item response theory (IRT) was used to obtain parameter estimates for the 54 diagnostic items. In IRT, the difficulty of items is estimated conditional on students’ proficiency (van der Linden and Hambleton, 1997). Due to the relatively small number of students per item, it was decided to apply a Rasch model. Overall response behavior was in line with the Rasch model, and it was not necessary to use more general models like the 3PL, which need substantially larger sample sizes to estimate all the parameters. The item curves within a Rasch model are based on the logistic function of the difference between the latent variable θ and the βi parameter of an item (Verhelst, 1993). The curves are representations of the probability of answering an item correctly.
Two IRT analyses were done. In the first analysis, the prevalence of a bridging error is modeled instead of the prevalence of a correct response. The purpose of this analysis was to obtain estimates of the relative diagnostic capacity of the items, defined as the item’s capacity to elicit bridging errors. In this analysis, items were coded as 1 = bridging error, and 0 = correct or other error. Modeling using an IRT procedure allowed to compare the capacity to elicit bridging errors across items administered in an incomplete design with groups of test-takers that differ in tendency to make bridging errors. As described above, the DI was administrated through an incomplete design with 11 booklets, which were linked through 18 common items. The purpose of the second analysis was to obtain estimates of the relative item difficulty. So, this is a more standard application or IRT. In this analysis, items were coded as 1 = correct, and 0 = incorrect response. The item parameters resulting from the IRT analyses could be transformed into the estimated proportion bridging errors or the proportion correct for the total population. OPLM software (Verhelst et al., 1994) was used to calibrate the items using marginal maximum likelihood estimation (MML) and equal discrimination indices for all items (Eggen and Verhelst, 2011). The OPLM software is very suitable for analyzing data in incomplete designs. The above specification of the model results in an estimate of the Rasch model.
To enhance the interpretation of results, the item-parameters are transformed into the expected proportion BE and the expected proportion correct in the population. Using this transformation, a weighting is given to the item parameters based on practical impact that it translates into observable properties of the items. For example, the difference between item parameters 4 and 5 will not lead to a substantial increase in the probability correct for a student with proficiency 0. While a difference between an item parameter of 0 or 1 does have a substantial impact. These proportions were used in the descriptive and correlational analyses that were done to answer the first research question. This was not done for research question 2 since the item parameters are better in line with the assumption of equal variance of the ANOVA. For these analyses, the item parameters for prevalence of bridging errors were used as the dependent variable. Note that higher item parameter values lead to less bridging errors and consequently a lower diagnostic capacity. In the first ANOVA, item format and answering format were used as independent factors, resulting in a 2 × 2 design. In the second ANOVA, the number of digits and the borrow type were used as independent factors, resulting in a 3 × 3 design. Taking item types together based on common features results in more power of the analysis due to more observations per cell of the design. The 3-category factors digits and borrow type were created by recoding the nine item types. Item types 1 and 5 were recoded as category 1 (2n−2n), item types 3, 6, 7, and 8 were recoded as category 2 (3n/4n−2n), and item types 2, 4, and 9 were recoded into category 3 (3n/4n−3n). Furthermore, for the variable borrow type item types 1, 2, and 5 were recoded into category 1 (borrow from 10). Item types, 3, 4, and 6 were recoded as category 2 (borrow from 100), and item types 7, 8, and 9 were recoded into category 3 (borrow from multiple). The above-described analyses were done with SPSS 23 (IBM Corp, 2015).
The first research question concerned the relationship between the proportion bridging errors and the difficulty of the subtraction errors. For this research question, the expected proportion correct was used as an indicator of item difficulty. Hence, the higher the proportion, the easier the item. The proportion BE (pBE) and proportion correct (pC) were calculated as the expected proportion in the population under the IRT model. The Rasch model showed a reasonable fit. In the model with proportion correct, 6 out of 44 items had significant S-statistics (p < 0.05). With proportion of bridging errors, 4 items out of 44 had significant S statistics. Overall, this was evaluated as sufficient, and item parameters were used in the follow-up analyses. For item 0804 (MC item), no bridging errors were observed; therefore, we used a pBE of zero in the analyses. Pearson’s bivariate correlation was calculated, r = −0.191, p = 0.167, k = 54. This result shows that the proportion BE is not significantly related to the item difficulty. However, we did find a significant negative correlation between pBE and pC for the MC items, r = −0.908, p < 0.001, k = 18. Note that this high correlation is largely the result of all distractors, except for item 0801 and 0804 being designed to include BEs, which resulted in a negative relationship between the proportion BE and the proportion correct. Moreover, for the item format (word and bare number problems) we did not find any significant correlations between pBE and pC. However, for the number features a negative relationship between pBE and pC was found for item type 9 (1000−340 = ), r = −0.870, p = 0.024, k = 6. Thus, items within item type 9 with a high proportion BE had a low proportion correct and vice versa. This result implies that for item type nine very few other errors than BE were observed. Such a relationship was not found for any of the other number features.
Furthermore, Table 3 shows the average pBE and pC for the item characteristics being evaluated in the present study. For the answer format, it was found that the pBE as well as the pC for MC items is higher than for OE items. The differences in the pBE and pC for the two item formats were relatively small, with the pBE of bare number problems being slightly higher than the pBE of word problems. With regard to the number features, it was found that items with more digits in the subtrahend and minuend (i.e., 3n/4n−3n types 2, 4, and 9) had the highest pBE and a relative low pC compared to items with fewer digits (i.e., 3n/4n−2n and 2n−2n, types 1, 3, 5, 6, 7, and 8). Whether these differences are significant was explored in the ANOVA analyses.
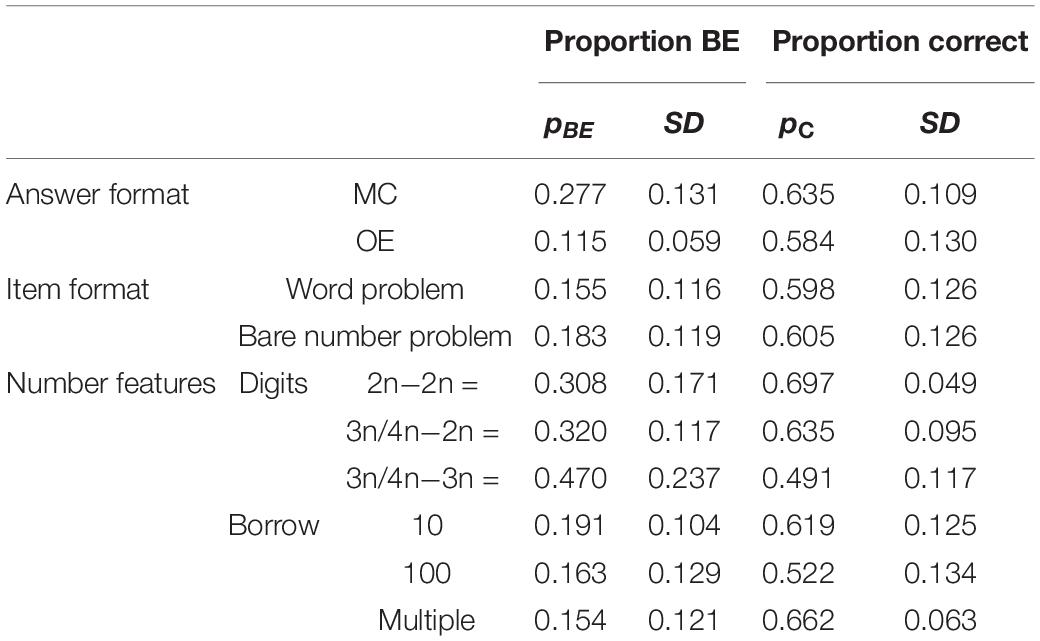
Table 3. Proportion bridging errors and proportion correct for answer format and item format.
To evaluate the diagnostic capacity of the item and answering format (research question 2), a 2 × 2 between-subject (BS) factor ANOVA with answer format and item format as BS factors and the diagnostic capacity of the items was done. As explained in the section “Materials and Methods,” the parameter estimate of the diagnostic capacity was used for this analysis because of the assumptions underlying ANOVA. As shown in Table 4 (Model 1), a significant difference between MC items and OE items (answer format) was found, F(1,50) = 36.871, p < 0.001, Partialη2 = 0.424, R2 = 0.441. Hence, the diagnostic capacity of MC items is found to be significantly higher than that of OE-items, MMC = −0.997, SDMC = 0.818, MOE = 0.498, SDOE = 0.877. Evidently, this result was to be expected given that the MC items were constructed to have distractors that indicate BE.
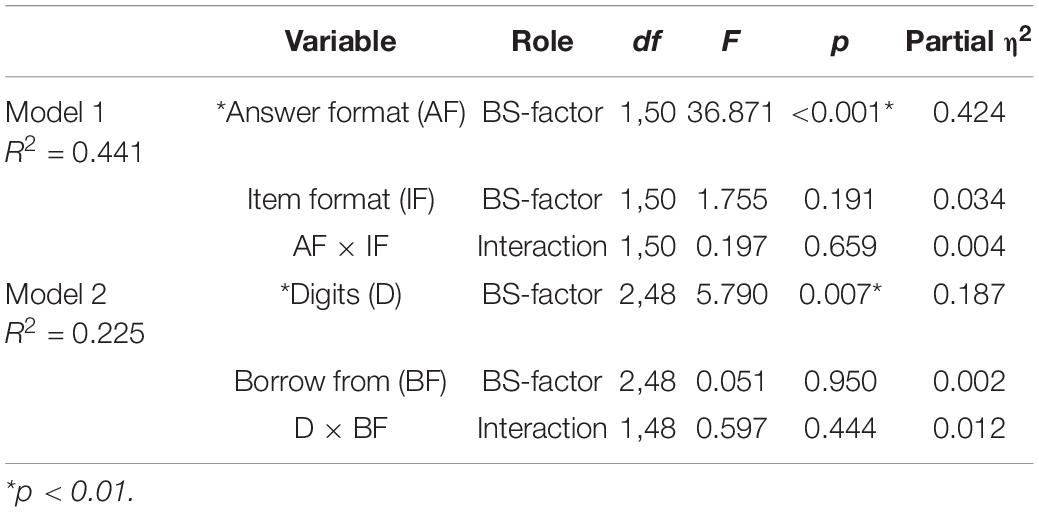
Table 4. ANOVA results with diagnostic capacity as dependent variable.
To explore whether the distractors that were chosen in the MC items represent the most frequent BE found in the open-ended items, the frequencies of the three BE and their possible combinations were analyzed. More specifically, Table 5 shows the average frequency of the different bridging errors for OE and for MC items. Note that, for item types 7, 8, and 9 combinations of the three types of BE could be observed because these items had multiple borrows (see Supplementary Appendix Table A1). For item type 8, no combined errors were observed. The combined errors for item types 7 and 9 were put together in one variable. The results in Table 5 show all BE types were, on average, more frequently observed in MC items than in OE items. The observed frequencies bridging errors and other errors for each item are included in Supplementary Appendix Table A2. Note that Supplementary Appendix Table A2 shows there is a lot of within-item type variation in the proportion BE observed in the data.
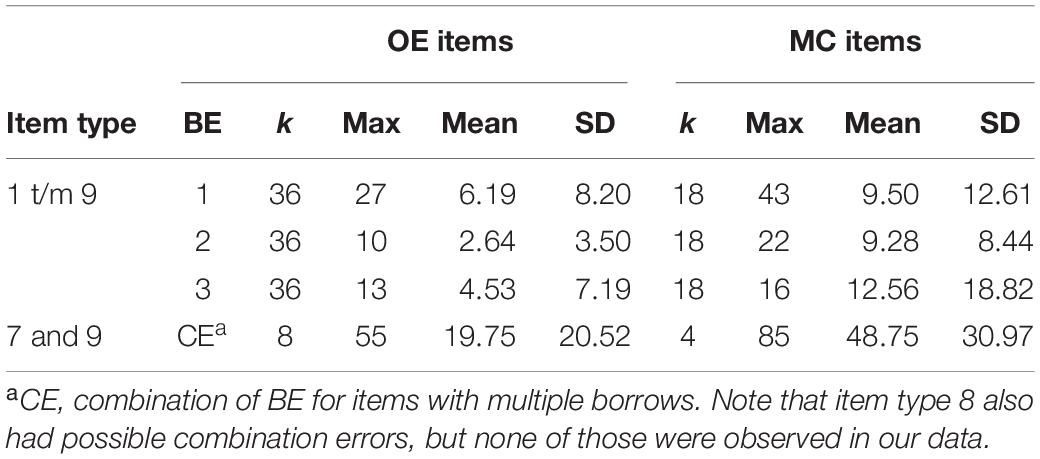
Table 5. Average frequency of BE types for OE and MC items.
Subsequently, the differences between MC and OE items for the three error types were tested using a t-test. Levene’s test for equality of variances showed that for all three error types equal variances could not be assumed (see Table 6). As is shown in Table 6, the differences between OE and MC items were significant for all three error types. The difference between combination errors for OE and MC items was not tested because of the small group sizes, respectively 8 and 4 items. It appears that the MC items lead to an overestimation of all three BE types. This may have occurred more often for BE3 since the average difference between MC and OE items for this BE type is the highest. Although this explanation is very plausible, we have not collected any verbal reports from students’ actual thinking process to support this explanation. Moreover, we found that the relative number of missing values on OE (M = 0.0347, SD = 0.02810) and MC items (M = 0.0439, SD = 0.02305) was on average equal, t(52) = −1.199, p = 0.236 (equal variances assumed), MDifference = −0.00919, SD = 0.00767. So, although MC items might result in overestimating BE, it does not force more students to skip an item in comparison to OE items.
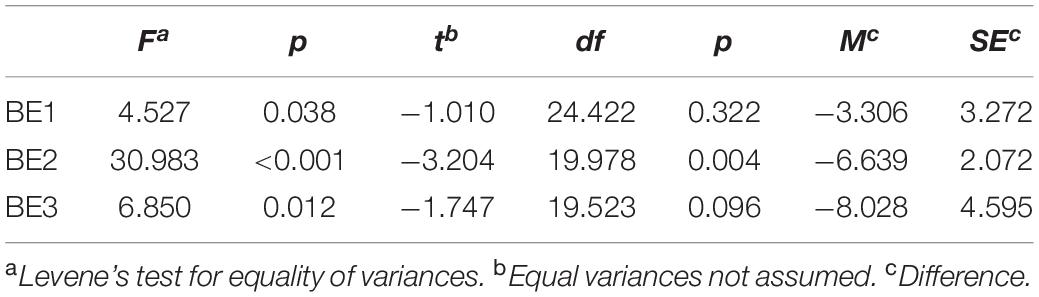
Table 6. T-tests for the mean difference between the BE types observed in OE and MC items.
The second ANOVA was a 3 × 3 BS-factor design with digits and borrow type as the BS factors. It was found that the average diagnostic capacity differed for the BS-factor digits (see Table 4 Model 2). A Bonferroni post hoc analysis showed that category 2 (M = 0.543, SD = 1.145) has a significantly lower diagnostic capacity than category 3 (M = −0.602, SD = 0.999), Mdifference = 1.145, SE = 0.320, p = 0.002. More specifically, 3n/4n−2n = (category 2) items have a significantly lower diagnostic capacity than 3n/4n−3n (category 3) items.
Furthermore, item type 8 was found to be the least suitable for diagnosing students’ BE. Looking at the error frequencies for item type 8, the most frequently observed error type were errors, such as 1000−20 = 800, this error was observed 8, 5, 11, 8, 5, and 7 times in respectively, item 0801 through item 0806. Similarly, the error 1000−20 = 80 was observed 7, 1, 2, 9, 1, and 1 times in respectively, item 0801 through item 0806. Note that the frequencies 7 and 9 were observed with an MC item, which might be the reason they were observed more frequently. It is noteworthy that the subsample of students who responded to item type 8 had a mathematical ability of 59.133 (SD = 13.91, N = 98), which is significantly lower than the average mathematical ability of the whole sample, M = 69.79, SD = 15.784, N = 98, t(358) = 5.885, p < 0.0001. The implications of these results are explained in the section “Discussion.”
The past decades, there has been plenty of research into systematic errors in subtraction. However, none of those studies systematically evaluated what item characteristics make an item suitable for a specific error diagnosis. Based on previous research, we focused on diagnostic items that elicit bridging errors in multi-digit subtraction, which are errors derived from the frequently observed smaller-from-larger error (Brown and VanLehn, 1980; Young and O’Shea, 1981; Resnick, 1982; VanLehn, 1990; Hennessy, 1993). The purpose of the present study was to explore the relationship between the diagnostic capacity and item difficulty of items and to evaluate the diagnostic capacity of three specific item characteristics: Item format, answering format, and number features in relation to their capacity to elicit bridging errors. This discussion emphasizes how this evaluation contributes to the design of diagnostic subtraction items, to research ideas, and to use of diagnostic items in mathematics teaching.
We found no significant correlation between the estimated proportion bridging errors and proportion correct of the items (research question 1). This implies that the difficulty of an item is not indicative of the diagnostic capacity of an item. Therefore, the diagnostic capacity of items should be considered a different construct from item difficulty, which might be influenced differently by item characteristics than item difficulty. However, we did find that item type 9 had a negative relationship between the proportion bridging errors and proportion correct was found for item type nine (e.g., 1000−340 = ). So, a higher proportion bridging errors was associated with a lower proportion correct. This result indicates that, for this item type, most of the errors made were bridging errors, and almost no other errors were made on this item (see Supplementary Appendix Table A2). Not surprisingly, the average proportion bridging errors for item type 9 was found to be the highest compared to the other item types. It was not, however, the easiest nor was it the most difficult item type. Based on these results, teachers can use the subset of item types with a high diagnostic capacity to diagnose students with various mathematical ability levels. This is particularly useful given the results of a related study in which we found a correlation between students’ mathematical ability and their tendency to make bridging errors (Vermeulen et al., unpublished). More specifically, a higher proportion bridging errors was associated with a higher mathematical ability. These findings fit with the argumentation proposed in the theoretical framework: bridging errors indicate a cognitive advancement for students’ procedural understanding and place-value based understanding of multi-digit numbers, but it also indicates a cognitive weakness in the conceptual understanding of place-value principles related to borrowing.
Looking at the number features of the items, it was found in the ANOVA that the diagnostic capacity of 3n/4n−3n items is significantly higher than the diagnostic capacity of 3n/4n−2n items (i.e., item types 3, 6, 7, and 8). This result does not, however, indicate that the diagnostic capacity of the items is related to the number of digits in the subtrahend and minuend being unequal. One of the most important findings of this study is that item type 8 (e.g., 1000−70 = ) was not only the easiest item; it also had the lowest diagnostic capacity. A subsequent error analysis showed that students made relatively few bridging errors; instead, these items seem to elicit errors such as 1000−20 = 800 and 1000−20 = 80. Because item type 8 elicits other systematic errors more frequently, it is questionable whether item type 8 is a valid item type for diagnosing bridging errors. Unfortunately, we do not have data about students’ mathematical conceptual and procedural reasoning to explain this error. A plausible explanation is that item type 8 elicits jumping instead of decomposition, because there is no reason for a place-value-based partitioning of the subtrahend when the subtrahend is a multiple of ten.
Moreover, the students who responded to item type 8 had a significantly lower mathematical ability, which makes it more likely that they use a jumping strategy instead of a decomposition strategy (Kraemer, 2011). Students’ with a lower mathematical ability might not make one specific systematic error, such as BE, but might struggle with multiple procedures and concepts, resulting in different errors (Scheltens and Béguin, 2017). Based on the idea that third-grade students transition from a linear understanding of multi-digit numbers (Fuson et al., 1997; Teppo and Van den Heuvel-Panhuizen, 2013), it is plausible that students who make errors like 1000−20 = 800 or 80 struggle with the linear concept of multi-digit numbers between 100 and 1000. This suggests that it is worthwhile to investigate what systematic errors are relevant during a specific developmental phase, in relation to students’ mathematical ability. In conclusion, the above implies that diagnosing errors such as BE might be more relevant for average to high-achieving students rather than low achieving students.
The lower mathematical ability of students who responded to item type 8 was the result of our adaptive design of item types (see Supplementary Appendix C). Although we used anchor items to link all item types and subgroups, this can be considered a limitation of the research design when analyzing the frequency of other systematic subtraction errors. Hence, the design does allow to link the item types and subgroups with regard to their diagnostic capacity for bridging errors, but for the exploration of other systematic subtraction errors it might be better to be able to compare error patterns of students with high, average, and low mathematical ability. Nevertheless, the purpose of this study was not to discover other systematic subtraction errors but to evaluate the diagnostic capacity of items for diagnosing bridging errors. Also, the interpretation of these results based on our theoretical framework does provide testable hypotheses about the procedural and conceptual nature of these novel systematic errors. This requires, however, an approach that focuses on students’ error profiles rather than the design of diagnostic items. A recent study into students’ multi-digit subtraction strategy profiles showed that students are rarely classified as flexible users of various strategies (Torbeyns et al., 2017). In combination with research on students’ strategy profiles, it would be interesting to explore how students’ strategy profile is related to their error profile. It would be specifically interesting to study changes in students’ strategy and error profiles and the extent to which these changes are related to each other and to students’ conceptual understanding of multi-digit numbers.
Finally, the present study focused on identifying students’ procedural and conceptual strengths and weaknesses in multi-digit subtraction and borrowing. The value of diagnosing bridging errors should be further evaluated by studying teachers’ instructional decisions based on students’ error profiles. Such research can result in empirical information about effective interventions to remediate bridging errors and facilitate students’ transition from jumping to decomposition strategies and to column-wise and ciphering in higher grades. Our theoretical framework suggests that the use of models like money and MAB material can support the transition from linear to place-value-based understanding of multi-digit numbers (Beishuizen, 1993; Fuson et al., 1997; Blöte et al., 2000; Kraemer, 2011; Howe, 2012, 2019). As students make the transition to decomposition, column-wise and ciphering, and subtraction with three- and four-digit numbers, the number line is used less by both teachers and students (Vermeulen et al., 2015). Howe (2019) emphasizes that students’ need to understand the relative magnitude of numbers to reflect on their answers by using estimation. This perspective is also in line with a constructive view on misconceptions (Smith et al., 1994): Rather than replacing their linear understanding of multi-digit numbers, they complement their understanding with the place-value-based concept of multi-digit numbers. Positioning large numbers on the number line can contribute to students’ understanding of the magnitude of three- and four-digit numbers. Furthermore, the present study focused on word problems constructed to elicit direct subtraction and decomposition strategies, which explains why their diagnostic capacity did not differ from bare number problems. Although we did not find a group difference between the diagnostic capacity of bare number and word problems, it is possible that students show different error profiles for bare number and context problems, which could be relevant diagnostic data for teachers’ instructional decisions. Hence, including only one type of word problem could be considered a limitation of the research design. In the design of the items, we assumed that word problems constructed to elicit direct subtraction would be more valid for diagnosing bridging errors than word problems that elicit subtraction by addition. However, we did not collect data to validate this assumption. Nevertheless, for comparing students’ bridging error profiles on bare number and word problems, we would still recommend using word problems that elicit direct subtraction because this makes it easier exclude the meaning of subtraction as an explanation for differences in error profiles.
In conclusion, the present study showed that items like 453−127 = (Type 2), 634−251 = (Type 4) and 1000−340 = (Type 9) were the most suitable for diagnosing bridging errors mid third grade. As was expected, we found the MC items have a higher diagnostic capacity than open ended items. Nevertheless, we would argue that the use of MC or open-ended items serve different purposes. MC items could be a more accessible approach for teachers when using a diagnostic instrument for bridging errors as part of a formative teaching process. Also, they might be useful for diagnosing the three specific types of BE. Open-ended questions on the other hand are more useful when exploring error profiles that are not solely focused on diagnosing bridging errors; this could be applied in both classroom and research settings. Because item types 2 and 4 only have three possible bridging errors, they can easily be administrated using MC-items with the three BE listed in Supplementary Appendix A as distractors. However, item type 9 is a more complex item type that requires borrowing multiple times, resulting in more than three possible bridging errors. For that reason, it is better to administer item type 9 as an open-ended item and use the errors listed in Supplementary Appendix A to identify the bridging errors. The different combinations of bridging errors might help teachers to identify whether the student is making errors with borrowing from the tens or hundreds, or both. The three bridging errors used in the present study can be considered procedural variations of each other. It is plausible, however, that the three bridging errors indicate different phases in students’ transition from a linear to a place-value-based conceptual understanding of multi-digit numbers. Lastly, facilitating this transition by diagnosing and remediating bridging errors is not only important for multi-digit subtraction but can also promote students’ proficiency in addition, multiplication, and division, because these computations also rely on students’ understanding of the base-ten place-value system.
The datasets generated for this study are available on request to the corresponding author.
Ethical review and approval was not required for the study on human participants in accordance with the local legislation and institutional requirements. Written informed consent to participate in this study was provided by the participants’ legal guardian/next of kin.
JV contributed to the design of the experiment, construction of the materials and instruments, data-collection, data preparation, data-analyses, and writing the manuscript. AB contributed to the design of the experiment, data-analyses, and writing the manuscript. FS contributed to the design of the experiment, construction of the materials and instruments, data-collection, and data preparation. TE advised on the data-analyses and contributed to the writing of the manuscript. All authors contributed to the article and approved the submitted version.
This work was supported by the Netherlands Organisation for Scientific Research (NWO) under Grant MaGW/PROO: Project 411-10-750.
The authors declare that the research was conducted in the absence of any commercial or financial relationships that could be construed as a potential conflict of interest.
The Supplementary Material for this article can be found online at: https://www.frontiersin.org/articles/10.3389/feduc.2020.537531/full#supplementary-material
Ashlock, R. B. (2006). Error Patterns in Computation: Using Error Patterns to Improve Instruction. London: Pearson.
Beishuizen, M. (1993). Mental strategies and materials or models for addition and subtraction up to 100 in dutch second grades. J. Res. Math. Educ. 24:294. doi: 10.2307/749464
Bicknell, B., Young-Loveridge, J., and Simpson, J. (2017). Using quotitive division problems to promote place-value understanding. Austr. Prim. Math. Classroom 22, 28–32.
Blöte, A. W., Klein, A. S., and Beishuizen, M. (2000). Mental computation and conceptual understanding. Learn. Instruct. 10, 221–247. doi: 10.1016/S0959-4752(99)00028-6
Briggs, D., Alonzo, A. C., Schwab, C., and Wilson, M. (2006). Diagnostic assessment with ordered multiple-choice items. Educ. Assess. 11, 33–63. doi: 10.1207/s15326977ea1101_2
Briggs, D. C., and Alonzo, A. C. (2009). The psychometric modeling of ordered multiplechoice item responses for diagnostic assessment with a learning progression. Paper Presented at the Learning Progressions in Science (LeaPS) Conference, Iowa City, IA.
Brown, J., and VanLehn, K. (1980). Repair theory: a generative theory of bugs in procedural skills. Cogn. Sci. 4, 379–426. doi: 10.1016/S0364-0213(80)80010-3
Eggen, T. J. H. M., and Verhelst, N. D. (2011). Item calibration in incomplete testing designs. Psicologica 32, 107–132.
Fernández, R. L., and García, A. B. S. (2008). Evolutionary processes in the development of errors in subtraction algorithms. Educ. Res. Rev. 3, 229–235.
Fuson, K. C. (1990). Conceptual structures for multiunit numbers: implications for learning and teaching multidigit addition, subtraction, and place value. Cogn. Instruct. 7, 343–403. doi: 10.1207/s1532690xci0704_4
Fuson, K. C., Wearne, D., Hiebert, J. C., Murray, H. G., Human, P. G., Olivier, A. I., et al. (1997). Children’s conceptual structures for multidigit numbers and methods of multidigit addition and subtraction. J. Res. Math. Educ. 28, 130–162. doi: 10.5951/jresematheduc.28.2.0130
Gravemeijer, K., Bowers, J., and Stephan, M. (2003). Chapter 4: a hypothetical learning trajectory on measurment and flexible arithmetic. J. Res. Math. Educ. 12, 51–66.
Hennessy, S. (1993). The stability of children’s mathematical behavior: when is a bug really a bug?”. Learn. Instruct. 3, 315–338. doi: 10.1016/0959-4752(93)90022-R
Hop, M. (2012). Balans van Het Rekenwiskundeonderwijs Halverwege de Basisschool 5 PPON Balan. Arnhem: CITO.
Howe, R. (2012). A Robust Understanding of the Operations of Addition and Subtraction. Available online at: http://commoncoretools.me/wp-content/uploads/2012/02/3pillars.pdf (accessed May 28, 2020).
Howe, R. (2019). Learning and using our base ten place value number system: theoretical perspectives and twenty-first century uses. ZDM Math. Educ. 51, 57–68. doi: 10.1007/s11858-018-0996-3
Huff, K, and Goodman, D. P. (2007). “The demand for cognitive diagnostic assessment,” in Cognitive Diagnostic Assessment for Education: Theory and Applications, eds J. P. Leighton and M. J. Gierl (New York, NY: Cambridge University Press), 19–60.
Janssen, J., Scheltens, F., and Kraemer, J.-M. (2006). Primair Onderwijs. Leerling- En Onderwijsvolgsysteem. Rekenen-Wiskunde Groep 5 [Primary Education. Pupil and Educational Monitoring System. Mathematics Grade 3]. Arnhem: CITO.
Janssen, J., Verhelst, N., Engelen, R., and Scheltens, F. (2010). Wetenschappelijke Verantwoording van de Toetsen LOVS Rekenen-Wiskunde Voor Groep 3 Tot En Met 8. Arnhem: CITO.
Keeley, P., and Tobey, C. R. (2011). Mathematics Formative Assessment- 75 Practical Strategies for Linking Assessment, Instruction, and Learning. Thousand Oaks, CA: Corwin press.
Leighton, J. P., and Gierl, M. J. (2007). “Why cognitive diagnostic assessment,” in Cognitive Diagnostic Assessment for Education: Theory and Applications, eds P. Jacqueline, Leighton and J. G. Mark (New York, NY: Cambridge University Press), 3–18. doi: 10.1017/cbo9780511611186.001
Lemaire, P., and Callies, S. (2009). Children’s strategies in complex arithmetic. J. Exper. Child Psychol. 103, 49–65. doi: 10.1016/j.jecp.2008.09.007
Narciss, S., and Huth, K. (2006). Fostering achievement and motivation with bug-related tutoring feedback in a computer-based training for written subtraction. Learn. Instruct. 16, 310–322. doi: 10.1016/j.learninstruc.2006.07.003
Opgenoort, L. (2014). Ondersteunend Leertraject. Splitsvaardigheid Groep 5 [Supportive Learning Trajectory. Decomposition Skills in Third Grade]. Available online at: https://diagnostischetoetsvooraftrekken.files.wordpress.com/2017/01/ondersteunend-leertraject1.pdf (accessed November 28, 2019).
Resnick, L. B. (1982). Syntax and Semantics in Learning to Subtract. Pittsburg, PA: Learning Research and Development Center.
Resnick, L. B. (1984). Beyond Error Analysis: The Role of Understanding in Elementary School Arithmetic. Pittsburg, PA: Learning Research and Development Center.
Riccomini, P. J. (2005). Identification and remediation of systematic error patterns in subtraction. Learn. Disabil. Q. 28, 233–242. doi: 10.2307/1593661
Rittle-Johnson, B. (2017). Developing mathematics knowledge. Child Dev. Perspect. 11, 184–190. doi: 10.1111/cdep.12229
Scheltens, F., and Béguin, A. (2017). Meer dan goed/fout. Diagnostisch toetsen van aftrekken in groep 5 [More than right and wrong. Diagnostic testing of third grade subtraction]. Volgens Bartjens Ontwikkeling En Onderzoek 36, 41–49.
Selter, C., Prediger, S., Nührenbörger, M., and Hußmann, S. (2012). Taking away and determining the difference-a longitudinal perspective on two models of subtraction and the inverse relation to addition. Educ. Stud. Math. 79, 389–408. doi: 10.1007/s10649-011-9305-6
Smith, J. P., DiSessa, A. A., and Roschelle, J. (1994). Misconceptions reconceived: a constructivist analysis of knowledge in transition. J. Learn. Sci. 3, 115–163. doi: 10.1207/s15327809jls0302_1
Teppo, A., and Van den Heuvel-Panhuizen, M. (2013). Visual representations as objects of analysis: the number line as an example. ZDM 46, 45–58. doi: 10.1007/s11858-013-0518-2
Torbeyns, J., De Smedt, B., Ghesquière, P., and Verschaffel, L. (2008). Acquisition and use of shortcut strategies by traditionally schooled children. Educ. Stud. Math. 71, 1–17. doi: 10.1007/s10649-008-9155-z
Torbeyns, J., Hickendorff, M., and Verschaffel, L. (2017). The use of number-based versus digit-based strategies on multi-digit subtraction: 9-12-Year-Olds’ strategy use profiles and task performance. Learn. Individ. Differ. 58, 64–74. doi: 10.1016/j.lindif.2017.07.004
Treagust, D. (1986). Evaluation students’ misconceptions by means of diagnostic multiple choice items. Res. Sci. Educ. 16, 199–207. doi: 10.1007/bf02356835
van der Kleij, F. M., Vermeulen, J. A., Schildkamp, K., and Eggen, T. J. H. M. (2015). Integrating data-based decision making, assessment for learning, and diagnostic testing in formative assessment. Assess. Educ. Principl. Policy Pract. 22, 37–41. doi: 10.1080/0969594X.2014.999024
van der Linden, W. J., and Hambleton, R. K. (1997). Handbook of Modern Item Response Theory. New York, NY: Springer.
Verhelst, N. D. (1993). “Itemresponsetheorie [Item response theory],” in Psychometrie in de Praktijk [Psychometrics in Pracice], eds J. H. M. E. Theo and P. Sanders (Arnhem: Cito), 83–178.
Verhelst, N. D., Glas, C. A. W., and Verstralen, H. H. F. M. (1994). OPLM Computer Program and Manual. Arnhem: Cito.
Vermeulen, J. A., Scheltens, F., and Eggen, T. J. H. M. (2015). Strategy identification using the empty number line: a comparison between paper-and-pencil and tablets. Pedagog. Stud. 92.
Keywords: diagnostic assessment, multi-digit subtraction, multiple-choice items, item characteristics, decomposition, subtraction errors, bridging errors
Citation: Vermeulen JA, Béguin A, Scheltens F and Eggen TJHM (2020) Evaluating the Characteristics of Diagnostic Items for Bridging Errors in Multi-Digit Subtraction. Front. Educ. 5:537531. doi: 10.3389/feduc.2020.537531
Received: 24 February 2020; Accepted: 31 August 2020;
Published: 02 October 2020.
Edited by:
Robbert Smit, University of Teacher Education St. Gallen, SwitzerlandReviewed by:
Alexander Naumann, Leibniz Institute for Research and Information in Education (DIPF), GermanyCopyright © 2020 Vermeulen, Béguin, Scheltens and Eggen. This is an open-access article distributed under the terms of the Creative Commons Attribution License (CC BY). The use, distribution or reproduction in other forums is permitted, provided the original author(s) and the copyright owner(s) are credited and that the original publication in this journal is cited, in accordance with accepted academic practice. No use, distribution or reproduction is permitted which does not comply with these terms.
*Correspondence: Jorine Adinda Vermeulen, jorinevermeulen@gmail.com
Disclaimer: All claims expressed in this article are solely those of the authors and do not necessarily represent those of their affiliated organizations, or those of the publisher, the editors and the reviewers. Any product that may be evaluated in this article or claim that may be made by its manufacturer is not guaranteed or endorsed by the publisher.
Research integrity at Frontiers
Learn more about the work of our research integrity team to safeguard the quality of each article we publish.