- Research Institute of Petroleum Exploration and Development, Beijing, China
Interest in the phase behavior of hydrocarbons in shale reservoirs has grown in recent years. Petroleum fluid phase behavior has been observed to differ significantly between conventional reservoirs and shale reservoirs. Within shale reservoirs, notable surface-fluid interactions can lead to non-uniform molecule distribution and an alteration in fluid phase behavior, primarily caused by the existence of nano-scale porous materials. In this work, we study the phase behavior of methane in single cylindrical pore models. We apply the gauge Gibbs ensemble Monte Carlo (gauge-GEMC) simulation technique to investigate the phase behavior of methane in 4–10 nm single nanopores and calculate the saturation pressures at various temperatures using the grand canonical Monte Carlo (GCMC) simulation technique. A shift in the phase diagram has been found for methane in nanopores. As pore size decreases, the shift becomes more significant.
1 Introduction
The phase behavior study of reservoir fluids in shale reservoirs faces many challenges. A main challenge is to quantify the effects of surface-fluid interactions on the phase behavior of reservoir fluids. Shale formations encompass pores ranging in size from less than 10 nm to great than 100 nm (Clarkson et al., 2013; Zhu et al., 2021), in which a large portion of pore volume are occupied by pores smaller than 50 nm. In macropores, which have diameters exceeding 50 nm, reservoir fluids exist in a bulk state. In this regime, the influence of interactions between the pore surface and reservoir fluids (surface–fluid interactions) is minimal compared to the interactions between the reservoir fluids themselves (fluid–fluid interactions). Several equations of state, for example, Peng–Robinson equation of state (Peng and Robinson, 1976; Bi et al., 2020a; Bi et al., 2020b) and Soave–Redlich–Kwong equation of state (Soave, 1972), have been proposed in past decades. Traditional equations of state do not consider surface–fluid interactions, but they are suitable for accurately describing the phase behavior of reservoir fluids in bulk conditions. Nonetheless, within the mesopores (with diameters between 2 and 50 nm) and micropores (with diameters less than 2 nm) (Rouquerolt et al., 1994), where the pore dimensions closely match those of the reservoir fluid molecules, the interactions between the surface and fluid take on great importance and prominence. This phenomenon can result in uneven dispersion of molecules and a shift in the phase diagram (Jin et al., 2017; Jin and Nasrabadi, 2018; Luo et al., 2018; Yang et al., 2019; Jin and Firoozabadi, 2016a; Li et al., 2019). The influences on reservoir fluids within mesopores and micropores are commonly referred to as confinement effects. These effects become increasingly pronounced as the size of the pores decreases.
Monte Carlo simulation, a statistical approach that relies on the modeling of interactions between atoms or molecules, has become a commonly employed technique for studying phase behavior in shale reservoirs in recent years (Jin and Firoozabadi, 2016a; Li et al., 2014; Singh et al., 2009; Jin and Firoozabadi, 2016b). The breadth of the Monte Carlo simulation has substantially expanded thanks to increased computer capacity. The Monte Carlo simulations offer a range of statistical ensembles, such as the canonical ensemble (
In this work, the gauge-GEMC simulations are applied to investigate the phase behavior of methane in single-pore models. Temperature-density diagrams for methane in 4–10 nm nanopores are constructed. Additionally, for the first time, we use GCMC simulation to calculate the saturation pressures of methane at various temperatures in the nanopores. Combining with the critical temperatures determined using the gauge-GEMC simulations, for the first time, completed temperature-pressure phase diagrams for methane in the 4–10 nm nanopores are constructed. Significant alterations of saturation pressures and critical properties of methane in the nanopores are observed.
2 Methodology
2.1 Monte Carlo moves
Monte Carlo simulation is a statistical thermodynamics technique that derives properties of a system by taking into account the individual position and conformation of every molecule. To attain the equilibrium state of a system, millions of Monte Carlo steps are executed in the simulation to reach the global minimum of the free energy. During each Monte Carlo step, one of several Monte Carlo moves is attempted.
The most commonly used Monte Carlo moves are the translation move (center of mass), rotation move, and partial regrowth move. For the center of mass translation move, a molecule in the system is chosen randomly. The entire chosen molecule is then displaced a random distance in a random vector direction. The rotation move is to rotate a randomly chosen molecule by a random angle. In this move, the internal bond distances, bending angles, and torsion angles of the selected molecule are kept the same. In terms of the partial regrowth move, a random atom is chosen in a random molecule. Then, one end of the chosen atom is cut off and allowed to regrow at a randomly selected position. The new configuration (state) after a Monte Carlo move is accepted with a probability. The acceptance criterion for a move is:
where
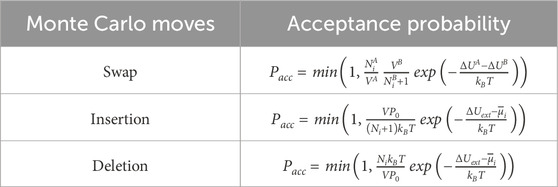
Some Monte Carlo moves are applied to specific ensembles. For the ensembles that contain more than one simulation boxes (the GEMC and the gauge-GEMC), a swap move is implemented. The swap move is used to move a randomly chosen molecule in an arbitrary simulation box to the other simulation box. This move enables different phases within the system to attain an equal chemical potential for every molecule type (species of components). In terms of the GCMC ensemble, insertion and deletion moves are implemented. The insertion moves insert one type of molecule at a randomly selected position in the simulation box, while the deletion moves randomly delete one molecule of the selected type. It should be noted that, in a GCMC simulation, the attempts of insertion moves and the attempts of deletion moves should be equal. The acceptance probabilities of the specific moves are summarized in Table 1, where
2.2 Gauge-GEMC simulation
Gauge-GEMC is developed by Neimark and Vishnyakov (Neimark and Vishnyakov, 2000; Vishnyakov and Neimark, 2001; Vishnyakov and Neimark, 2009) based on the NVT-GEMC technique developed by Panagiotopoulos (Panagiotopoulos, 1987) previously. It is a prevalent technique for computing fluid properties at equilibrium (Jin et al., 2017; Vishnyakov and Neimark, 2001; Bi and Nasrabadi, 2019). The simulation involves two boxes: one represents the fluid system, while the other serves as a gauge meter (see Figure 1). The gauge-GEMC method preserves the benefits of the original NVT-GEMC technique, enabling the investigation of fluid phase equilibria without explicit surface modeling. Additionally, it effectively manages density fluctuations, enabling the fluid to exist in potentially unstable states (Ungerer et al., 2005; Jin and Nasrabadi, 2016).
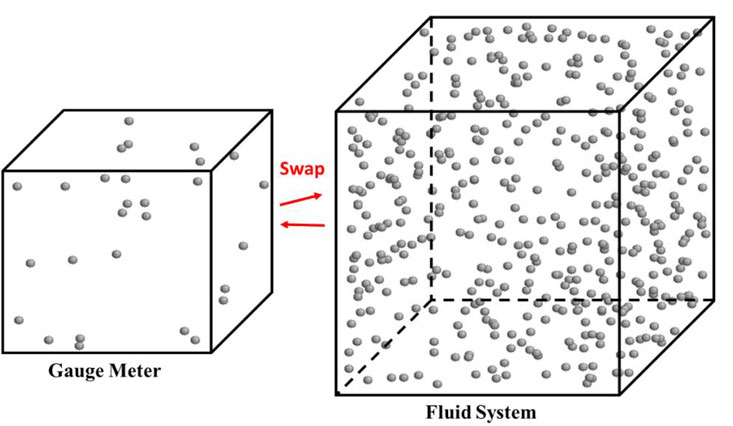
Figure 1. Schematic of the gauge-GEMC ensemble. Red arrows represent the swap move (particles are transferable between boxes). Grey balls are molecules which are methane in this example.
We use the gauge-GEMC simulation to study the phase behavior of methane in confined systems. The confined boundary, specifically nanopores, will be applied solely to the fluid system box, while the gauge meter box remains in the bulk condition. The gauge-GEMC simulation includes a series of cases that are with the same volume and temperature but cover a range of numbers of molecules (see Figure 4 in Section 4). In each case, simulations are conducted under constant number of molecules, total volume, and temperature conditions. The volume of each box is fixed so that the total volume remains constant. In this study, random center-of-mass translation and rotation moves are implemented along with the swap move. These moves are designed to happen with the same probability at each Monte Carlo step.
This method has the capability to produce a comprehensive phase diagram, such as the chemical potential-density (μ-ρ) diagram, represented as a van der Waals loop, encompassing both meta-stable and stable states. Phase equilibrium points can be calculated from the μ-ρ relationship through thermodynamic integration, using Maxwell’s equal area rule (Firoozabadi, 1999) (refer to Figure 4 in Section 4). A temperature–density (
2.3 GCMC simulation
GCMC simulation is an efficient technique for studying adsorption isotherms and hysteresis in mesopores and micropores. Simulations are performed in a single simulation box at constant chemical potential, volume, and temperature conditions. During the GCMC simulation, the number of molecules is fluctuating to reach the imposed chemical potential at the specified volume and temperature. The increase and decrease of the number of molecules are achieved by insertion and deletion moves, respectively (Figure 2). Like the gauge-GEMC simulation, random center-of-mass translation and rotation moves are also implemented, and all the moves would happen with the same probability.
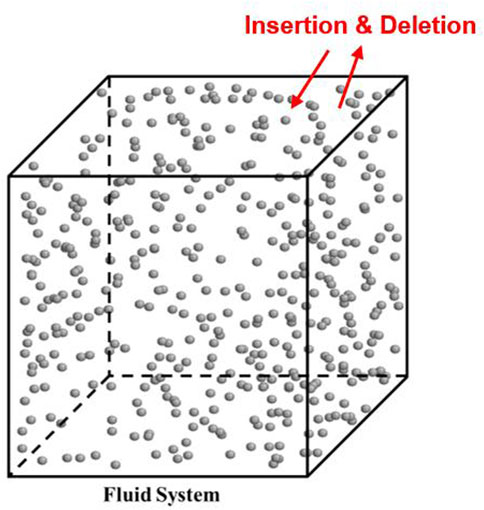
Figure 2. Schematic of the GCMC ensemble. Red arrows represent the insertion and deletion moves. Grey balls are molecules which are methane in this example.
In this work, the GCMC simulation has been used to determine the saturation pressure when confined systems exist. As mentioned above in Section 2.2, the vapor-liquid phase equilibrium study (the gauge-GEMC simulation) can calculate the chemical potential at the phase equilibrium of a confined system. Once the chemical potential at the phase equilibrium has been determined, a GCMC simulation in the bulk condition with the calculated chemical potential and specified temperature will be performed to compute the pressure. The pressure calculated in the bulk condition is referred to as the external pressure of the confined systems at the phase equilibrium (Yang et al., 2019; Jin and Firoozabadi, 2016b).
It’s important to be noticed that the pressure computed directly from the confined systems cannot be compared to the normal pressure physically measured in experiments. The pressure derived from molecular simulations is referred to as Virial pressure and is acquired through the use of the Virial equation (Ungerer et al., 2005):
where
3 Models
3.1 Multi-layer graphite cylindrical pore model
Periodic boundary conditions are applied to the simulation boxes to avoid a boundary effect. Simulation boxes which are in the bulk condition (the gauge meter box in the gauge-GEMC simulation) are repeating identical replicas in all space directions, while simulation boxes which contain confined fluid systems (the fluid system box in the gauge-GEMC) are only replicating in the directions that have no pore boundaries. To compute molecular interactions with periodic boundary conditions using the minimum image convention method, it is essential to guarantee that the dimensions of the simulation boxes in all states are at least twice the value of
Since a majority of mesopores and micropores are formed in kerogen and one of the most significant elements in kerogen is carbon (Loucks et al., 2009; Loucks et al., 2012; Curtis et al., 2010), graphite has been widely used in molecular simulations for modeling nano-scale pore boundaries (Jin et al., 2017; Jin and Nasrabadi, 2016; Bi and Nasrabadi, 2019). Compared to directly using kerogen as the pore wall material, using graphite helps avoid the impact of pore wall roughness on the results, leading to faster computations. In this work, for investigating the phase behavior of methane in cylindrical pores, we model the pore boundaries explicitly using the multi-layer graphite.
In Figure 3, a schematic of the multi-layer graphite cylindrical pore model is presented. Graphite possesses a honeycomb structure with a bond length of 0.142 nm (Jin et al., 2017), as illustrated in Figure 3A. The multi-layer graphite model is derived from a multi-layer graphite cube with layer separation of 0.335 nm in the z-direction (Jin et al., 2017), as depicted in Figure 3B. To create the cylindrical features, we cut out redundant atoms and left a cylindrical pipe with a specific inner diameter and boundary thickness. The inner diameter of the pipe is the diameter of the cylindrical pore. In this work, we specify the thickness of the multi-layer graphite cylindrical pore is 4 Å (Figure 3C). This pore model has been applied in the fluid system box in the gauge-GEMC simulation with a 1D periodic boundary condition in the z-direction (the gauge meter box in the gauge-GEMC simulation is kept in the bulk situation with 3D periodic boundary condition).
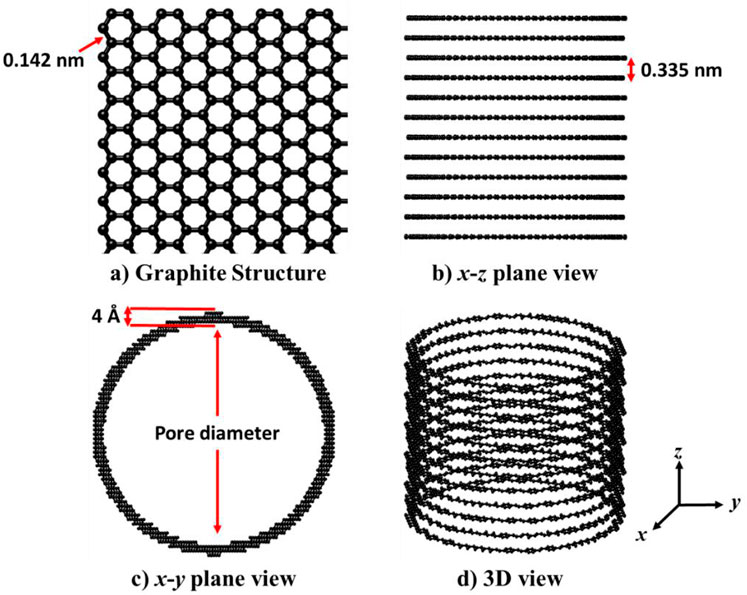
Figure 3. Schematic of the multi-layer graphite cylindrical pore model. (A). Graphite structure. (B). x-z plane view of the model. (C). x-y plane view of the model. (D) 3D view of the model.
3.2 Potential energy calculation model
The Lennard Jones (LJ) 12–6 potential is utilized for calculating the intermolecular energy, specifically non-bonded interactions, as follows:
where
In this study, we utilize the TraPPE-UA force field model (Martin and Siepmann, 1998) for all particles. The LJ parameters for these models can be found in Table 2.
The distance at which the LJ potential is no longer calculated is referred to as the truncated distance (
4 Phase behavior of methane in 4–10 nm cylindrical pores
The gauge-GEMC simulation is applied for investigating the phase behavior of methane in cylindrical pores of different sizes. The phase behavior of fluids in nanopores is influenced by the size of the nanopores. The smaller the pore diameter, the greater the impact of confinement effects on the fluid phase behavior, leading to greater deviation from the results observed in the bulk phase. Since a significant portion of the pore volume in shale consists of nanopores with diameters less than 10 nm (Clarkson et al., 2013), we selected pore diameters in the range of 4–10 nm, where the pores are as small as possible and represent a significant portion of the pore volume. For each pore size, simulations are performed at multiple temperatures from 130 K to 190 K. At each temperature, the gauge-GEMC simulation includes a series of cases that cover a range of numbers of molecules (Figure 4). It’s important to emphasize that, in each case, the system is characterized by a fixed number of molecules, total volume, and temperature. Further, two million Monte Carlo steps (Ungerer et al., 2005) are performed for the system to reach equilibrium.
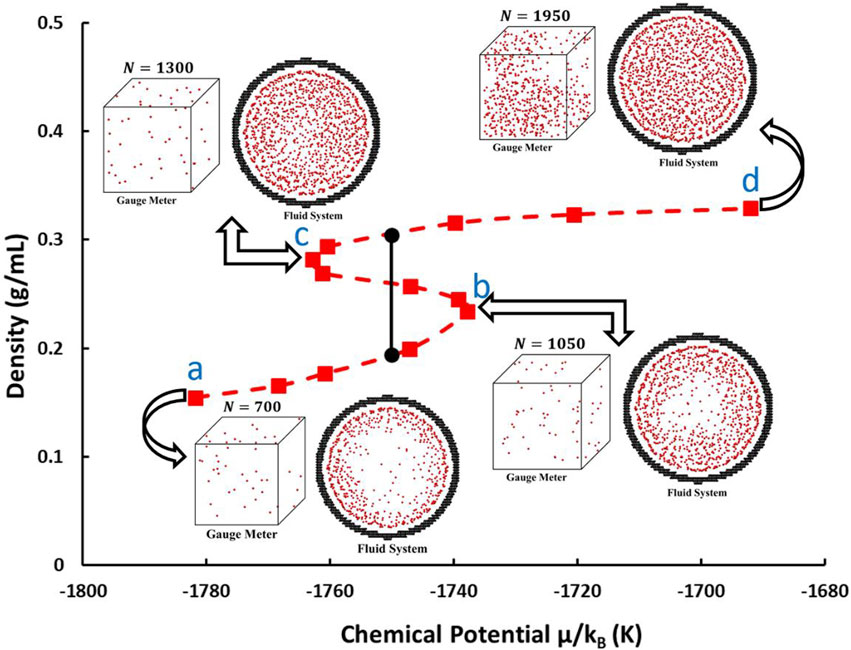
Figure 4. An example of the chemical potential–density relation for methane in a 6 nm cylindrical pore at
At each temperature, a chemical potential–density (
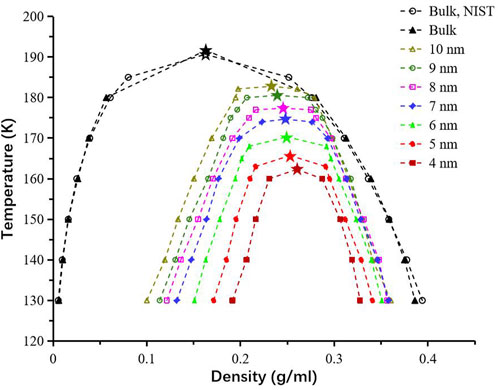
Figure 5. Temperature–density (
First, the accuracy of the set-up in the gauge-GEMC method is tested in the bulk condition. In the bulk condition, there is no pore boundary involved in the fluid system box and further, the fluid system box is in the 3D periodic boundary condition. Our simulation can generate results as accurate as the laboratory results from the National Institute of Standards and Technology (NIST). Our results (represented as black triangles) from the simulation match the results (represented as black empty circles) from NIST in Figure 5. Additionally, we extend the work to confined systems that contain the multi-layer graphite cylindrical pore models (Figure 3) with varying diameters in the range of 4–10 nm in the fluid system box. By repeating the mentioned tests for each pore size, phase diagrams are computed, as shown in Figure 5. It is clear that the smaller the pores are, the more the temperature–density diagrams shrink. When compared to the bulk condition, the critical temperature decreases, and critical density rises within nanopores. The critical temperature in the 4 nm pore that deviates the most from the values in the bulk condition is reduced by around 15%. The increase in the critical density is the consequence of the dramatic increase in the vapor density and slight decrease in the liquid density at equilibrium. As the pore diameter expands, the phase diagram approaches values typical of the bulk material. The observed confinement effects align with trends seen in previous studies (Jin and Firoozabadi, 2016a; Li et al., 2014; Jin and Nasrabadi, 2016).
An example of the density profiles of methane at 130 K in the mentioned nanopores is shown in Figure 6. We measure the mass densities as a function of the distance from the pore surface (
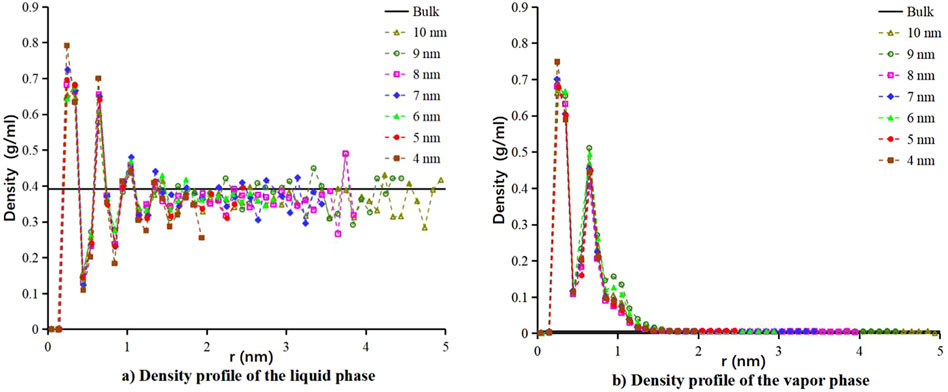
Figure 6. Density profile of methane in cylindrical models with different diameters at 130 K. The (A) liquid and (B) vapor phase densities as a function of the distance
Pressure–temperature diagrams (Figure 7) are generated from additional GCMC simulations (two million Monte Carlo steps) with the obtained chemical potentials at equilibrium states as imposed chemical potentials. As explained in Section 2.3, the additional GCMC simulations are performed in the bulk condition. In comparison with the bulk condition, the critical pressure is reduced in the nanopores. The smaller the pores are, the lower the pressure–temperature diagrams go. As a result, the saturation pressures at different temperatures are suppressed, compared with the value in the bulk condition. Overall, the saturation and critical pressure in the 4 nm pore, as the most confined condition, deviates the most from the values in the bulk condition. Compared with the bulk condition, saturation pressures in the 4 nm pore reduce 48%–60% at various temperatures and the critical pressure reduces by around 80%.
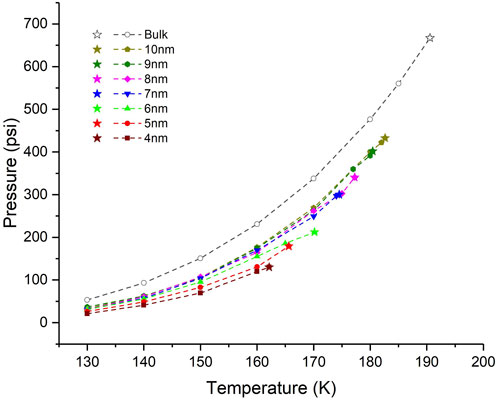
Figure 7. Pressure–temperature (
5 Conclusion
In the present work, the gauge-GEMC simulations are used to investigate the phase behavior of methane in single cylindrical pore models formed by multi-layer graphite. The phase behavior of methane is studied in nanopores with diameters of 4–10 nm. Results show that in comparison with the bulk condition, at vapor–liquid equilibrium in nanopores, the vapor phase has a dramatically increased density, but the density of the liquid phase is slightly decreased. The confinement effect would cause a shrunk temperature–density diagram with reduced critical temperature and increased critical density. Smaller pores exhibit a more pronounced confinement effect, leading to a greater reduction in the size of temperature–density diagrams. Conversely, as pore diameter increases, the phase diagram approaches values typical of the bulk material. The pressure–temperature diagrams have demonstrated that the saturation pressure and critical pressure of methane in nanopores are also suppressed from the bulk values.
Shifts in phase diagrams can impact phase state calculations, thereby directly affecting the physical properties of fluids, such as density, viscosity, and expansion coefficient. Inaccurate parameters can lead to deviations in fluid flow and reservoir behavior simulations, resulting in incorrect assessments of reserves and production forecasts. Inaccurate phase state measurements may cause either overestimation or underestimation of reservoir productivity, affecting the economic feasibility analysis of development plans and potentially leading to unreasonable development decisions. Errors in phase state measurements can also lead to incorrect predictions of the phase distribution (e.g., gas phase, liquid phase) of oil-gas mixtures under different temperature and pressure conditions, thereby affecting oil-gas phase separation, gas production predictions, and the efficiency of oil-gas mixture handling during production. Results from this work provide data support for modifying and validating equations of state.
Data availability statement
The raw data supporting the conclusions of this article will be made available by the authors, without undue reservation.
Author contributions
RB: Writing–original draft, Writing–review and editing. MH: Writing–review and editing. YW: Writing–review and editing. YP: Writing–review and editing. FC: Writing–review and editing.
Funding
The author(s) declare that no financial support was received for the research, authorship, and/or publication of this article.
Conflict of interest
The authors declare that the research was conducted in the absence of any commercial or financial relationships that could be construed as a potential conflict of interest.
Publisher’s note
All claims expressed in this article are solely those of the authors and do not necessarily represent those of their affiliated organizations, or those of the publisher, the editors and the reviewers. Any product that may be evaluated in this article, or claim that may be made by its manufacturer, is not guaranteed or endorsed by the publisher.
References
Bi, R., Firoozabadi, A., and Myint, P. (2020b). Efficient and robust phase-split computations in the internal energy, volume, and moles (UVN) space. Fluid Phase Equilib. 526, 112729. doi:10.1016/j.fluid.2020.112729
Bi, R., and Nasrabadi, H. (2019). Molecular simulation of the constant composition expansion experiment in shale multi-scale systems. Fluid Phase Equilib. 495, 59–68. doi:10.1016/J.FLUID.2019.04.026
Bi, R., Zidane, A., and Firoozabadi, A. (2020a). Efficient and robust stability analysis in the internal energy, volume, and moles (UVN) space. Fluid Phase Equilib. 512, 112468. doi:10.1016/j.fluid.2020.112468
Clarkson, C. R., Solano, N., Bustin, R. M., Bustin, A. M. M., Chalmers, G. R. L., He, L., et al. (2013). Pore structure characterization of North American shale gas reservoirs using USANS/SANS, gas adsorption, and mercury intrusion. Fuel 103, 606–616. doi:10.1016/j.fuel.2012.06.119
Coasne, B., Gubbins, K. E., and Pellenq, R. J. M. (2005). Temperature effect on adsorption/desorption isotherms for a simple fluid confined within various nanopores. Adsorption 11, 289–294. doi:10.1007/s10450-005-5939-y
Curtis, M. E., Ambrose, R. J., Sondergeld, C. H., and Rai, C. S. (2010). Structural characterization of gas shales on the micro- and nano-scales. Soc. Pet. Eng. - can. Unconv. Resour. Int. Pet. doi:10.2118/137693-ms
Gubbins, K. E., Long, Y., and Śliwinska-Bartkowiak, M. (2014). Thermodynamics of confined nano-phases. J. Chem. Thermodyn. 74, 169–183. doi:10.1016/j.jct.2014.01.024
Jin, B., Bi, R., and Nasrabadi, H. (2017). Molecular simulation of the pore size distribution effect on phase behavior of methane confined in nanopores. Fluid Phase Equilib. 452, 94–102. doi:10.1016/j.fluid.2017.08.017
Jin, B., and Nasrabadi, H. (2016). Phase behavior of multi-component hydrocarbon systems in nano-pores using gauge-GCMC molecular simulation. Fluid Phase Equilib. 425, 324–334. doi:10.1016/j.fluid.2016.06.018
Jin, B., and Nasrabadi, H. (2018). Phase behavior in shale organic/inorganic nanopores from molecular simulation. SPE Reserv. Eval. Eng. 21, 626–637. doi:10.2118/187307-PA
Jin, Z., and Firoozabadi, A. (2016a). Thermodynamic modeling of phase behavior in shale media. Soc. Pet. Eng. J. 21, 190–207. doi:10.2118/176015-PA
Jin, Z., and Firoozabadi, A. (2016b). Phase behavior and flow in shale nanopores from molecular simulations. Fluid Phase Equilib. 430, 156–168. doi:10.1016/j.fluid.2016.09.011
Li, J., Wu, K., Chen, Z., Wang, K., Luo, J., Xu, J., et al. (2019). On the negative excess isotherms for methane adsorption at high pressure: modeling and experiment. SPE J. 24, 2504–2525. doi:10.2118/197045-PA
Li, Z., Jin, Z., and Firoozabadi, A. (2014). Phase behavior and adsorption of pure substances and mixtures and characterization in nanopore structures by density functional theory. SPE J. 19, 1096–1109. doi:10.2118/169819-PA
Libby, B., and Monson, P. A. (2004). Adsorption/desorption hysteresis in inkbottle pores: a density functional theory and Monte Carlo simulation study. Langmuir 20, 4289–4294. doi:10.1021/la036100a
Loucks, R. G., Reed, R. M., Ruppel, S. C., and Hammes, U. (2012). Spectrum of pore types and networks in mudrocks and a descriptive classification for matrix-related mudrock pores. Am. Assoc. Pet. Geol. Bull. 96, 1071–1098. doi:10.1306/08171111061
Loucks, R. G., Reed, R. M., Ruppel, S. C., and Jarvie, D. M. (2009). Morphology, genesis, and distribution of nanometer-scale pores in siliceous mudstones of the mississippian barnett shale. J. Sediment. Res. 79, 848–861. doi:10.2110/jsr.2009.092
Luo, S., Lutkenhaus, J. L., and Nasrabadi, H. (2018). Multiscale fluid-phase-behavior simulation in shale reservoirs using a pore-size-dependent equation of state. SPE Reserv. Eval. Eng. 21, 0806–0820. doi:10.2118/187422-pa
Martin, M. G. (2013). MCCCS Towhee: a tool for Monte Carlo molecular simulation. Mol. Simul. 39, 1212–1222. doi:10.1080/08927022.2013.828208
Martin, M. G., and Siepmann, J. I. (1998). Transferable potentials for phase equilibria. 1. United-atom description of n-alkanes. J. Phys. Chem. B 102, 2569–2577. doi:10.1021/jp972543+
Neimark, A., and Vishnyakov, a (2000). Gauge cell method for simulation studies of phase transitions in confined systems. Phys. Rev. E. Stat. Phys. Plasmas. Fluids. Relat. Interdiscip. Top. 62, 4611–4622. doi:10.1103/PhysRevE.62.4611
Neubauer, B., Boutin, A., Tavitian, B., and Fuchs, A. H. (1999). Gibbs ensemble simulations of vapour—liquid phase equilibria of cyclic alkanes. Mol. Phys. 97, 769–776. doi:10.1080/00268979909482877
Panagiotopoulos, A. Z. (1987). Direct determination of phase coexistence properties of fluids by Monte Carlo simulation in a new ensemble. Mol. Phys. 61, 813–826. doi:10.1080/00268978700101491
Pathak, M., Cho, H., and Deo, M. (2017). Experimental and molecular modeling study of bubble points of hydrocarbon mixtures in nanoporous media. Energy Fuels 31, 3427–3435. doi:10.1021/acs.energyfuels.6b02422
Peng, D. Y., and Robinson, D. B. (1976). A new two-constant equation of state. Ind. Eng. Chem. Fundam. 15, 59–64. doi:10.1021/i160057a011
Potoff, J. J., and Siepmann, J. I. (2001). Vapor–liquid equilibria of mixtures containing alkanes, carbon dioxide, and nitrogen. AIChE J. 47, 1676–1682. doi:10.1002/aic.690470719
Reif-Acherman, S. (2010). The history of the rectilinear diameter law. Quim. Nova 33, 2003–2010. doi:10.1590/S0100-40422010000900033
Rouquerolt, J., Avnir, D., Fairbridge, C. W., Everett, D. H., Haynes, J. H., Pernicone, N., et al. (1994). Recommendations for the characterization of porous solids. Pure Appl. Chem. 66, 1739–1758. doi:10.1351/pac199466081739
Rowley, L. A., Nicholson, D., and Parsonage, N. G. (1975). Monte Carlo grand canonical ensemble calculation in a gas-liquid transition region for 12-6 Argon. J. Comput. Phys. 17, 401–414. doi:10.1016/0021-9991(75)90042-X
Scott, R., Allen, M. P., and Tildesley, D. J. (1991). Computer simulation of liquids. Math. Comput. 57, 442. doi:10.2307/2938686
Singh, S. K., Sinha, A., Deo, G., and Singh, J. K. (2009). Vapor− liquid phase coexistence, critical properties, and surface tension of confined alkanes. J. Phys. Chem. C 113, 7170–7180. doi:10.1021/jp8073915
Smit, B., De Smedt, P., and Frenkel, D. (1989). Computer simulations in the gibbs ensemble. Mol. Phys. 68, 931–950. doi:10.1080/00268978900102641
Soave, G. (1972). Equilibrium constants from a modified Redlich-Kwong equation of state. Chem. Eng. Sci. 27, 1197–1203. doi:10.1016/0009-2509(72)80096-4
Ungerer, P., Tavitian, B., and Boutin, A., Applications of molecular simulation in the oil and gas: Monte Carlo methods, 2005.
Vishnyakov, A., and Neimark, A. V. (2001). Studies of liquid-vapor equilibria, criticality, and spinodal transitions in nanopores by the gauge cell Monte Carlo simulation method. J. Phys. Chem. B 105, 7009–7020. doi:10.1021/jp003994o
Vishnyakov, A., and Neimark, A. V. (2009). Multicomponent gauge cell method. J. Chem. Phys. 130, 224103. doi:10.1063/1.3124186
Yang, Q., Jin, B., Banerjee, D., and Nasrabadi, H. (2019). Direct visualization and molecular simulation of dewpoint pressure of a confined fluid in sub-10 nm slit pores. Fuel 235, 1216–1223. doi:10.1016/j.fuel.2018.08.050
Zhu, H., Huang, C., Ju, Y., Bu, H., Li, X., Yang, M., et al. (2021). Multi-scale multi-dimensional characterization of clay-hosted pore networks of shale using FIBSEM, TEM, and X-ray micro-tomography: implications for methane storage and migration. Appl. Clay Sci. 213, 106239. doi:10.1016/j.clay.2021.106239
Zoll Weg, J. A., and Mulholland, G. W. (1972). On the law of the rectilinear diameter. J. Chem. Phys. 57, 1021–1025. doi:10.1063/1.1678352
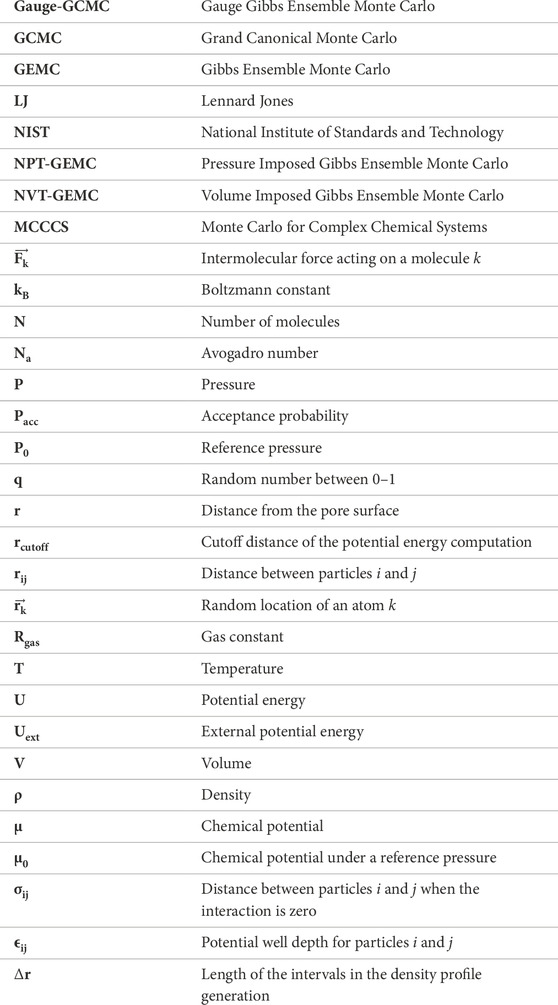
Nomenclature
Keywords: methane, phase behavior, molecular simulation, saturation pressure, confinement effect
Citation: Bi R, Hao M, Wan Y, Pan Y and Chen F (2024) Phase behavior analysis of methane confined in nanopores using molecular simulation. Front. Earth Sci. 12:1455127. doi: 10.3389/feart.2024.1455127
Received: 26 June 2024; Accepted: 30 September 2024;
Published: 16 October 2024.
Edited by:
Pao-Tai Lin, Texas A and M University, United StatesCopyright © 2024 Bi, Hao, Wan, Pan and Chen. This is an open-access article distributed under the terms of the Creative Commons Attribution License (CC BY). The use, distribution or reproduction in other forums is permitted, provided the original author(s) and the copyright owner(s) are credited and that the original publication in this journal is cited, in accordance with accepted academic practice. No use, distribution or reproduction is permitted which does not comply with these terms.
*Correspondence: Ran Bi, YmlyYW4yMDRAMTI2LmNvbQ==
†Present address: Yuewei Pan, PetroChina Oil, Gas & New Energies Company, Beijing, China
 Ran Bi
 Mingqiang Hao
 Yang Wan