- 1Sinopec North China Petroleum Bureau, Zhengzhou, China
- 2School of Petroleum and Natural Gas Engineering, Chongqing University of Science and Technology, Chongqing, China
- 3School of Petroleum Engineering, China University of Petroleum (East China), Qingdao, China)
Tight sandstone water-bearing gas reservoirs typically exhibit low porosity and low permeability, with reservoir rocks characterized by complex pore structures, often featuring micron-scale or smaller pore throats. This intricate reservoir structure significantly restricts fluid flow within the reservoir, necessitating a certain threshold pressure gradient (TPG) to be overcome before flow can commence. This study focuses on the Ordos Basin and explores the influence of high water content tight sandstone gas reservoirs on TPG under different water saturation and formation pressure conditions through experiments. A mathematical model of TPG is established using multiple linear regression method. The results show that TPG is primarily affected by water saturation, followed by formation pressure. As the water saturation increases, the TPG of the core decreases, and the change becomes more pronounced when the water saturation exceeds 50%. As formation pressure increases, the weakening of the slippage effect in gas molecules leads to TPG stabilization, especially when local pressure exceeds 25.0 MPa. The research also shows that low-permeability cores exhibit greater TPG variation with pressure changes, while high-permeability cores remain more stable. A mathematical model was developed and validated to predict TPG based on permeability, water saturation, and formation pressure. These findings highlight the need to monitor formation water content during tight sandstone gas reservoir development to optimize production strategies, providing valuable insights for improving reservoir management and guiding future research.
1 Introduction
Tight sandstone gas reservoirs possess vast reserves and significant development potential, with their proportion in oil and gas exploration and development steadily increasing, making them a crucial unconventional oil and gas resource (Civan, 2017; Sun et al., 2017; Zhang et al., 2019; Wang S et al., 2022; Farouk et al., 2024a; Farouk et al., 2024b). It is expected that the annual production of low-permeability tight gas reservoirs in China will reach about 600 × 10 m3 by 2030 (Zhang et al., 2020; Ren et al., 2022). For example, the Ordos Basin in China contains large gas reserves and hosts some of the most developed gas fields. The reservoirs in this basin are characterized by low porosity, low permeability, and strong heterogeneity, which present significant challenges for gas reservoir development (Zhang et al., 2021; Wang R. et al., 2022). Additionally, the gas reservoirs contain a significant amount of water, which negatively impacts the production capacity of gas wells. This is due to poor natural productivity, complex seepage mechanisms, and the scattered distribution of remaining gas (Lan et al., 2014; Zheng et al., 2020; Fu et al., 2020; Fu et al., 2021). This accelerates reservoir damage and further reduces the development efficiency of gas reservoirs, making it challenging to achieve long-term stable production in the tight and complex water-bearing gas reservoirs of the Ordos Basin.
The geological conditions of tight gas reservoirs are complex, characterized by poor reservoir properties, strong heterogeneity, low porosity, low permeability, and high water saturation. Additionally, under water-bearing conditions, complex interactions between water and gas occur within the reservoir, contributing to the complexity of fluid flow mechanisms. Research has shown that in low-permeability gas reservoirs, the flow paths of gas and water are extremely narrow, which facilitates the formation of water films at the pore throats (Tian et al., 2020; Chen et al., 2023; Tian et al., 2023). These water films significantly hinder gas flow, requiring the gas to overcome the resistance of the film before it can start moving (Zeng et al., 2011; Li et al., 2016; Tian et al., 2018). The minimum pressure difference required to overcome this resistance is commonly referred to as the threshold pressure gradient (TPG). Under ideal conditions, gas flow follows Darcy’s law, where the flow rate and pressure gradient curve exhibit a linear relationship, intersecting at the origin (Tian et al., 2014; Dong et al., 2019). However, in low-permeability porous media, gas flow deviates from Darcy’s law, and the flow rate and pressure gradient curve display a partially nonlinear relationship (Zeng et al., 2011; Wang and Sheng, 2017; Liu, 2019; Liu et al., 2019). The intersection point of the nonlinear curve with the x-axis represents the TPG. At higher pressures, the flow rate and pressure gradient become approximately linear, and the extension of this linear curve intersects the x-axis to form the pseudo TPG. Extensive research has confirmed the presence of TPG in tight gas reservoirs, which leads to nonlinear fluid flow characteristics (Feng et al., 2024). The existence of a TPG implies that gas will only start to flow when the pressure difference within the reservoir reaches or exceeds this critical value. Moreover, a continuous pressure gradient must be maintained during gas flow to prevent the reformation of the water film; otherwise, the flow may be interrupted (Amann-Hildenbrand et al., 2012; Hu et al., 2018). Therefore, the TPG is a critical factor influencing the development efficiency of low-permeability gas reservoirs (Civan, 2017). In the development process, it is essential to fully consider the impact of TPG on gas flow and optimize the development strategy accordingly to enhance the recovery rate (Shanley et al., 2004; Hu et al., 2018).
Research indicates that the productivity of gas wells diminishes as the TPG increases. A higher TPG requires a greater production pressure differential for fluid to start flowing, directly resulting in reduced production. To enhance production capacity, it is necessary to adopt measures that lower the TPG, such as enhancing reservoir permeability via techniques like hydraulic fracturing. Simultaneously, it is crucial to carefully manage the production pressure differential to prevent a decline in gas production efficiency due to excessive pressure differences. Hence, exploring the TPG of tight sandstone is of utmost importance (Cao et al., 2017; Song et al., 2015).Laboratory testing methods for determining the TPG can be broadly categorized into steady-state and unsteady-state approaches. The steady-state method is particularly effective for directly measuring the TPG, as it involves observing the minimum pressure required to maintain a constant flow rate through the sample. This approach provides a direct assessment of the TPG. In contrast, unsteady-state methods are often quicker to implement and are valuable for capturing dynamic flow behaviors and transient effects associated with the TPG. Although unsteady-state methods may not offer as direct a measurement of the TPG as the steady-state approach, they can provide insights into time-dependent flow phenomena (Bai et al., 1993).
Laboratory experiments have not only confirmed the existence of a TPG in tight reservoirs but have also revealed a significant correlation between this gradient and key physical properties of the reservoirs. Specifically, the experimental data demonstrate a clear inverse relationship between the TPG and reservoir permeability: the lower the permeability, the higher the required TPG. Additionally, there is a positive correlation between the TPG and water saturation in the reservoir, indicating that an increase in water saturation directly leads to a corresponding increase in the TPG (Miller and Low, 1963; Boukadi et al., 1998). For example, Zhu et al. observed that in low-permeability gas reservoirs, the TPG increases as permeability decreases or water saturation increases (Zhu et al., 2011). However, they did not establish a definitive correlation between these parameters. Dong et al., through core experiments, found that the TPG increases with the rise in effective stress and developed dynamic TPG models for cores with different permeability. However, their study did not take into account the influence of water content on the TPG (Dong et al., 2019). Ding et al. conducted a TPG test under reservoir conditions and concluded that the start-up pressure gradient increases with the decrease of pore pressure (Ding et al., 2017). Under reservoir conditions, as core permeability decreases and water saturation increases, the TPG becomes greater. However, no starting pressure model has been constructed to account for these factors. Atif Zafar et al. considered the effects of water saturation, permeability, and pore pressure on the TPG. However, they only constructed separate models for the influence of water saturation, pore pressure, and permeability on the TPG, without comprehensively considering the relationship among the three factors. This limitation reduces the practical applicability of their findings for production guidance (Zafar et al., 2020).
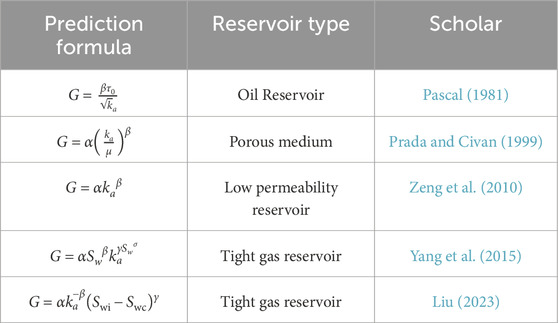
Many scholars have conducted studies on the mathematical description models of the initiating pressure gradient across different reservoir types, as summarized in Table 1. Pascal H. et al. Utilized the finite difference method to investigate the threshold pressure in linear reservoirs, taking into account low-speed flow, and proposed a mathematical model for the TPG that incorporates rock shear stress and permeability. However, their model only considers the properties of the rock itself and lacks consideration of the fluid’s influence on the TPG (Pascal, 1981). Prada A. et al. applied the TPG to correct Darcy’s law for low-speed flow. They determined that fluid can only pass through the porous medium when the flow force is sufficient to overcome the TPG. A mathematical model for the TPG was developed, taking into account the fluid properties. (Prada and Civan, 1999). Zeng et al. (2010) studied the influence of different fluid components on the TPG of rocks and proposed a mathematical model for the TPG. However, their model only considers fluid properties and lacks consideration of rock properties. Liu, (2023) suggested that as production time increases, the gas flow space expands, and flow resistance decreases. They improved the formula for the TPG and developed a calculation formula that considers the effects of permeability, initial water saturation, and bound water saturation. However, in actual production, it is challenging to accurately determine bound water saturation, which limits the practical significance of their model. Yang et al. (2015) conducted research on the threshold pressure effect in low-permeability tight gas reservoirs and quantitatively characterized the TPG of Sulige low-permeability tight gas reservoirs using a formula that incorporates the absolute permeability and water saturation of the reservoir. All the above theoretical models were developed under normal pressure conditions, neglecting the influence of formation pressure on the TPG.
To address this, this article first establishes a dynamic TPG testing device for tight gas reservoirs under water-bearing conditions by constructing a high-precision back pressure control system. We conducted tests on the dynamic TPG of tight gas reservoirs with varying water saturation levels across different reservoirs and analyzed the effects of permeability, water saturation, and formation pressure on the TPG. Finally, mathematical models for the TPG in various reservoirs were developed. This research provides a reference and foundation for accurately understanding the TPG characteristics of tight gas reservoirs and for formulating reasonable development plans.
2 Experimental material and procedures
2.1 Experimental materials
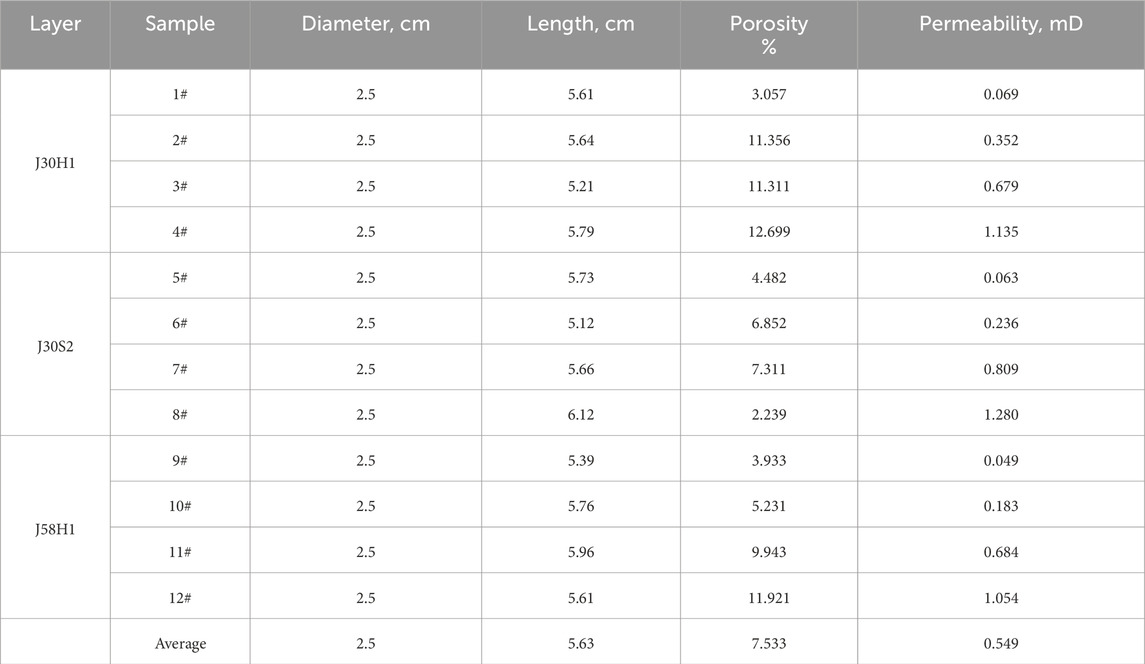
The experimental cores were taken from four samples, each with different permeability, from the J30S1, J30S2, and J58H1 layers of tight gas reservoirs in the Ordos Basin. The porosity and permeability of these cores were measured using the single chamber method based on Boyle’s Law and the pulse decay method, respectively. The parameters of the natural core samples are listed in Table 2. The injection fluids used were synthesized formation water and nitrogen. The properties of the synthesized formation water are listed in Table 3, and the water was prepared based on the actual properties of the formation water from the study block. The temperature was set to 85°C, reflecting the actual gas reservoir temperature of the study block.
2.2 Experimental procedures
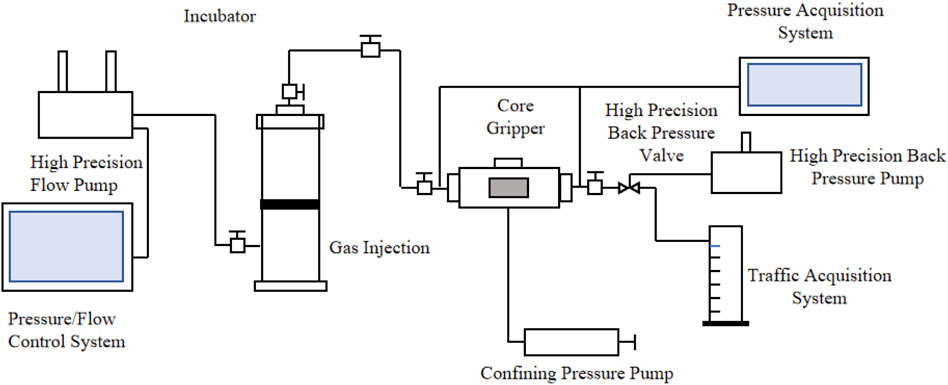
The experiment utilized a combination of the improved bubble method and the flow velocity pressure difference method, with the flowchart shown in Figure 1. First, the rock core is cleaned and dried for 48 h to determine its dry weight. Then, the rock core is placed in an intermediate container and vacuumed for 12 h. Water is pumped into the container and pressurized to 5 MPa for 24 h to fully saturate the core’s pores. The saturated water mass of the rock core is then measured. The saturated core is placed into a core holder, and a confining pressure of 5 MPa is applied using a confining pressure pump. After the pressure stabilizes, nitrogen gas is used to displace the core at a constant pressure while continuously weighing it. Displacement is stopped when the core’s water saturation reaches 70%. The confining pressure is then set to 40 MPa, and the back pressure is adjusted to the specified level. After the fluid pressure within the core stabilizes, the inlet pressure is gradually increased. At each pressure point, once the flow stabilizes, the gas flow rate, corresponding time, and pressure are measured until a complete flow curve is obtained. After completing the initial experiment, the core is re-saturated and displaced to water saturation levels of 60%, 50%, 40%, and 30%, with the experiment repeated for TPG testing.
To ensure the stability of the water saturation in the core during the experiment, a low-speed pressurization method was employed to prevent the water phase from flowing due to excessive pressurization speed. The weighing method was used to accurately determine the water saturation before and after the experiment. If the error in water saturation before and after the experiment remains within 2%, it can be concluded that only single-phase gas flow occurred during the experiment. Conversely, if the error exceeds this range, it is considered that gas-liquid two-phase flow occurred in the core, requiring the core to be cleaned and the experiment to be repeated.
3 Results
3.1 Effect of water saturation on TPG
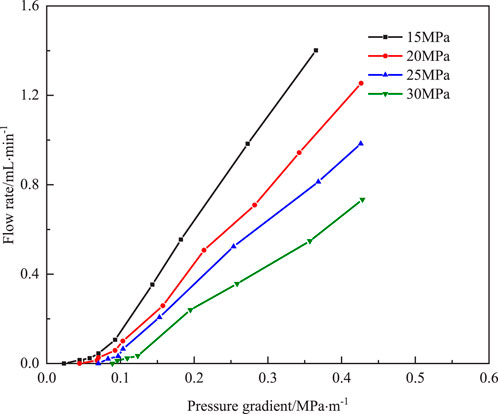
Figure 2 shows the pressure gradient and flow rate curves for core 6# when the water saturation is 60% and the formation pressure are 15, 20, 25, and 30 MPa, respectively. It can be seen from the Figure 2 that when the pressure gradient are less than 0.092, 0.106, 0.114, and 0.123 MPa/m, the curve is nonlinear. This is because the pressure gradient in this area is low, and due to the Jamin effect, gas cannot pass through the core pores. As the pressure gradient gradually increases, the slope of the curve changes significantly, and the rate of increasing gas flow relative to the square of the pressure gradient is approximately linear. Extending the linear part of the curve to the X-axis, it will intersect with the X-axis at a point where the pressure gradient corresponding to that point is the TPG of the core.
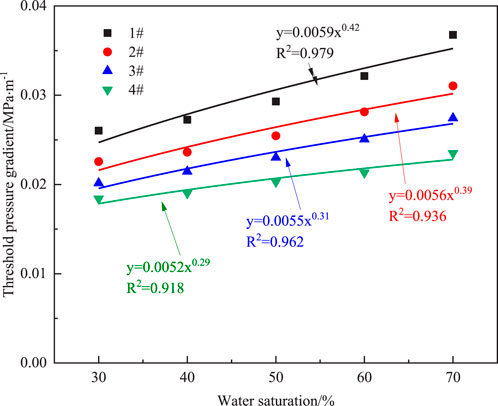
The variation of TPG with water saturation was measured in three reservoirs at a formation pressure of 15MPa, as shown in Figure 3. The variation law of the TPG of three reservoirs was measured through experiments, as shown in Figure 3. The experimental results show that the TPG of the reservoir exhibits a clear regularity, generally increasing rapidly with the increase of the original water saturation. Under the same water saturation conditions, reservoirs with lower permeability correspond to more significant TPG. All three reservoir curves show that when the water saturation is greater than 50%, there is a significant turning point in the amplitude of the TPG change, and the TPG increases rapidly. Among them, J30S2 and J58H1 show more pronounced performance. This is because when the water saturation is high, the gas in the core is difficult to form a continuous phase flow, but is divided into many small bubbles. These tiny bubbles are subjected to capillary forces during their flow process, resulting in the so-called Jamin effect when passing through the core throat, which refers to the additional resistance caused by the shape change of the bubbles when passing through narrow channels. As the water saturation increases, the flow resistance caused by bubble segmentation and Jamin effect also increases accordingly, resulting in an increase in reservoir TPG at the macro level.
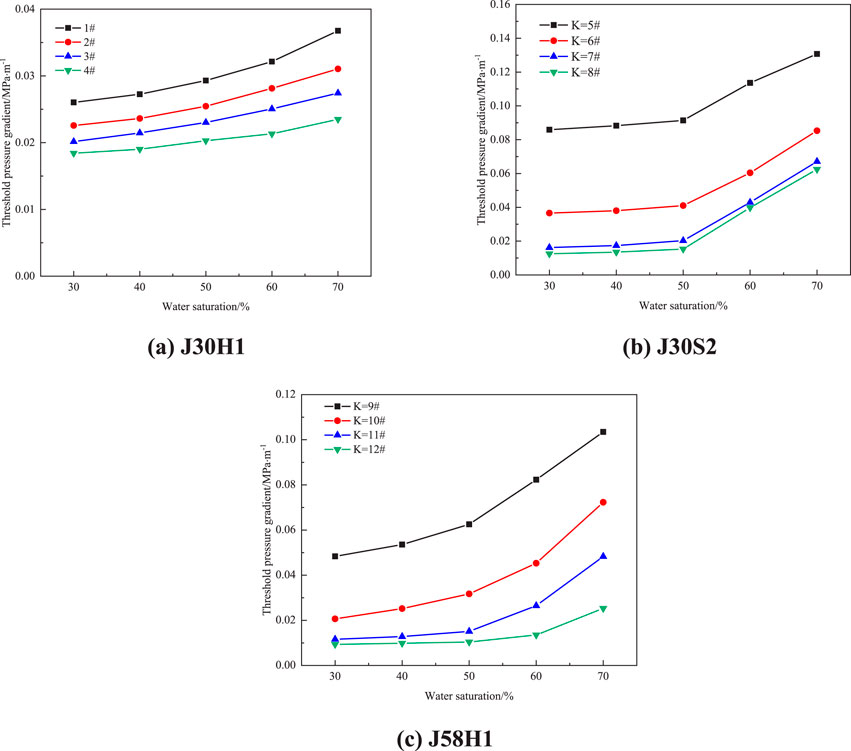
Figure 3. TPG of rock cores with different water saturation in three layers. (A) J30H1, (B) J30S2, (C) J58H1.
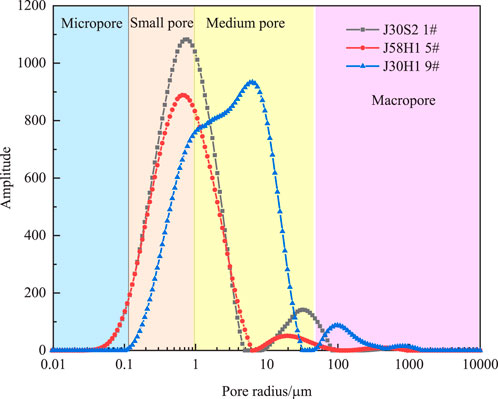
When the water saturation is 30%, the TPG of rock cores with permeability less than 0.1mD is 0.026 MPa/m, 0.086 MPa/m, and 0.048 MPa/m, respectively. J30S1 has the least impact on water saturation. When the water saturation increases from 30% to 70%, the TPG increases by 114.27%. J30S2 and J58H1 increase by 314.19% and 316.37%, respectively. The threshold pressure range for J30S1 is 0.026–0.036 MPa/m, J30S2 is 0.086–0.131 MPa/m, and J58H1 is 0.048–0.103 MPa/m. At the same water saturation, as the core permeability increases, the TPG decreases. When the water saturation is 30% and the permeability of the three layers increases from less than 0.1mD to greater than 1mD, the TPG decrease by 29.5%, 86.03%, and 75.83%, respectively. Similarly, when the water saturation reaches 70%, the TPG decrease by 36.14%, 52.18%, and 75.54%, respectively. By conducting nuclear magnetic resonance analysis on three core layers with permeability less than 0.1mD, as shown in Figure 4, The pore distribution of J30S2 and J58H1 is mainly concentrated in micropores and small pores smaller than 1 µm. The proportion of mesopores and macropores in J30H1 accounts for 53.44% of the total pores, the smaller pore throats of J30S2 and J58H1 will result in greater capillary force, while J30S2 and J58H1 account for 23.57% and 20.13% of the total pores. The smaller pore throats in J30S2 and J58H1 need to overcome stronger capillary force to push gas through the pore throats, thus requiring higher pressure to initiate gas flow. On the contrary, the larger pore throat structure of J30H1 results in a smaller TPG.
3.2 Effect of formation pressure on TPG
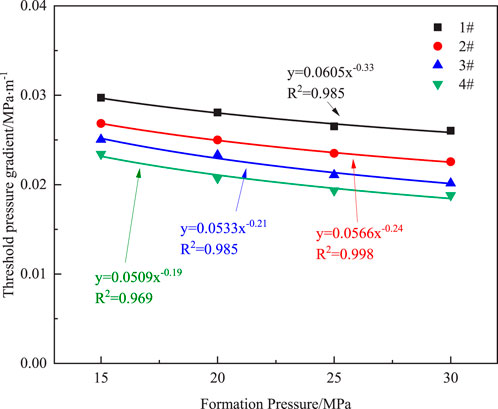
To study the variation of the threshold pressure in dense experimental rock cores under different formation pressures, pore pressures were set at 15, 20, 25, and 30 MPa, respectively, with corresponding confining pressures set at 25, 30, 35, and 40 MPa. The difference between confining pressure and pore pressure was kept constant during the experiment to ensure the permeability of the rock core remained stable. When the water saturation is 30%, the relationship between formation pressure and TPG is shown in Figure 5.
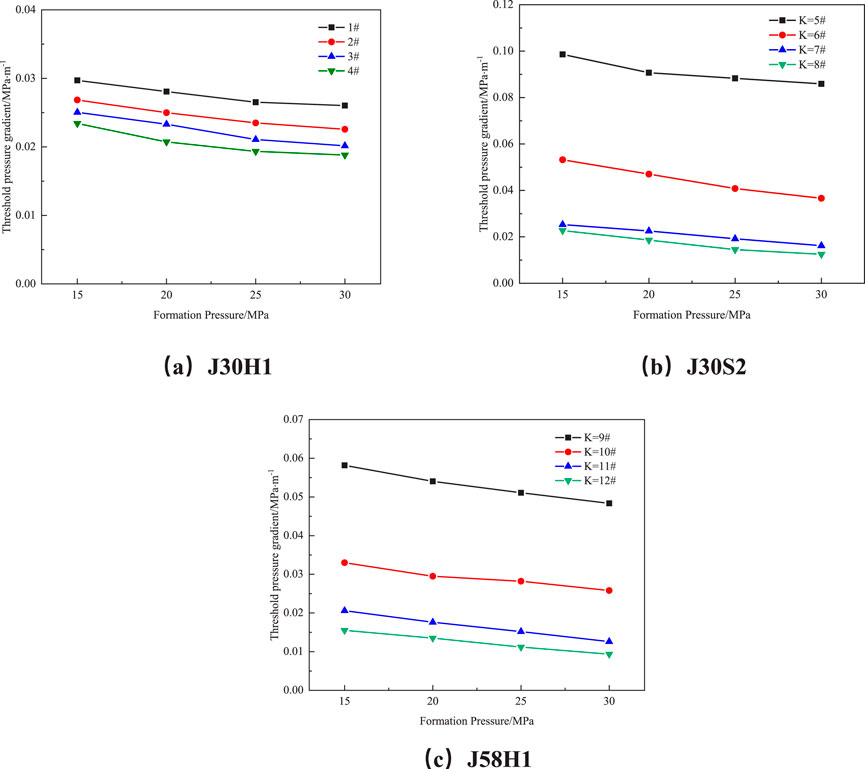
Figure 5. TPG of rock cores under different formation pressures in three layers. (A) J30H1, (B) J30S2, (C) J58H1.
Under low formation pressures, the TPG of tight gas reservoir cores decreases as pressure increases. However, once the local pressure exceeds 25.0 MPa, the rate of change in the TPG significantly diminishes and eventually stabilizes. The primary reason for this phenomenon is the significant impact of the slippage effect on gas permeation behavior in the cores of tight gas reservoirs. The slippage effect, also known as the Klinkenberg effect, refers to the phenomenon where gas flow in a porous medium at low pressure exhibits higher permeability compared to liquid permeability under the same conditions. This occurs because, at lower pressures, gas molecules have longer mean free paths and undergo slip at the pore walls, thereby increasing the apparent permeability and resulting in a lower measured TPG.
As formation pressure gradually increases, gas density rises, the mean free path between molecules shortens, and the frequency of collisions with pore walls decreases. Consequently, the slippage effect weakens, the increase in gas permeability becomes less pronounced, and the rate of change in the TPG decreases until it stabilizes. Once the local pressure exceeds 25 MPa, the gas density is sufficiently high, the influence of the slippage effect essentially disappears, and gas flow behavior begins to resemble conventional Darcy flow as described by Darcy’s law. Thus, the TPG stabilizes.
When formation pressure changes, cores with lower permeability exhibit more significant variations in the TPG, while cores with higher permeability show a relatively smaller range of TPG changes. Specifically, for cores with permeability exceeding 1.0 mD, the TPG remains almost stable with changes in formation pressure, decreasing by 12.41%, 12.88%, and 16.91%, respectively. In contrast, for cores with permeability less than 0.1 mD, the TPG decreases by 19.68%, 44.93%, and 39.68%. This difference can be attributed to the varying influence of the slippage effect in cores with different permeabilities. At the same formation pressure, as the core permeability increases, TPG decreases. When the formation pressure is 15MPa, the permeability of the three layers increases from less than 0.1mD to greater than 1mD, and the TPG decreases by 21.21%, 85.45%, and 73.28%, respectively. Similarly, when the formation pressure is 30MPa, the TPG decreased by 27.69%, 76.98%, and 81.25%, respectively. In low-permeability cores, the pore channels are narrow, making the slippage effect more pronounced, which significantly increases gas permeability at low pressures and thus causes a substantial decrease in TPG. Conversely, in high-permeability cores, the pore channels are relatively wide, and the slippage effect is weaker, resulting in a more gradual and stable change in TPG.
4 Discussion
4.1 Establish of mathematical model for dynamic TPG
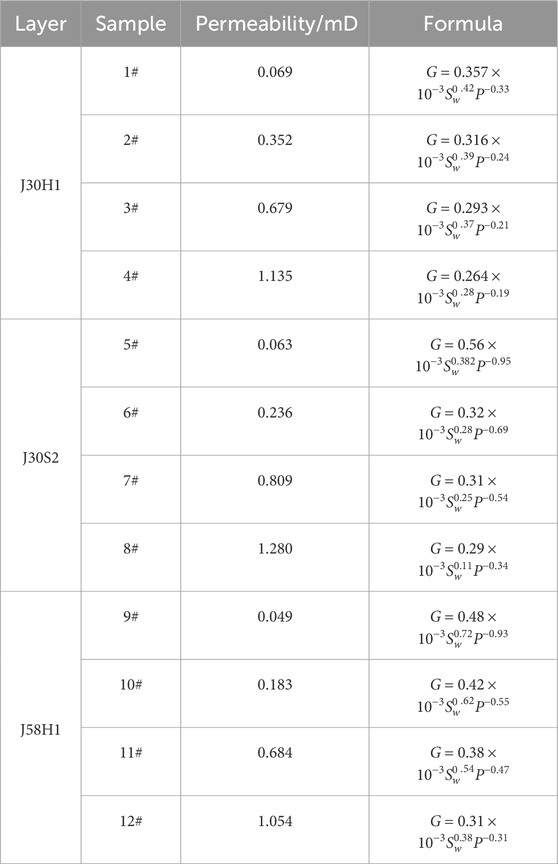
Through the study of the variation of TPG with water saturation and formation pressure, the relationship between TPG, water saturation, and formation pressure was statistically fitted, as shown in Figures 6, 7. The corresponding expression for a single factor was obtained as shown in Equation 1.
Where G is the TPG (MPa/m), P is the formation pressure (MPa), and Sw is the water saturation (%).The parameters a,b,and c are fitting coefficients. A total of 12 sets of coefficients a,b,and c were obtained through fitting,and the expressions for the TPG in cores with different permeabilities across the three layers were derived, as shown in Table 4. To explore the relationship between the TPG and core permeability, the coefficient a, b, and c was fitted to the core permeability. The detailed steps are outlined in the Appendix. Finally, the mathematical models for the TPG of the three layers are obtained as shown in Equations 1–3.
4.2 Model validation
In order to verify the reliability of the model proposed in this article, different models were used to calculate the TPG using J30H1 as an example. The predicted results are shown in Figure 8. From the Figure 8, it is evident that there is a significant discrepancy between the theoretical calculation results of previous researchers and the measured values. However, the theoretical value of the TPG calculated using the new model bears little difference from the measured value, thus validating the rationality and accuracy of the new model. It can effectively describe and evaluate the TPG of tight sandstone gas reservoirs containing water.
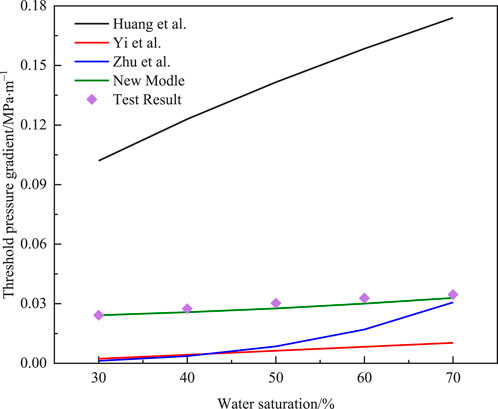
Figure 8. The comparison between the newly developed model and other models (Yi et al., 2006; Huang et al., 2016; Zhu et al., 2022).
The general formula for TPG can be effectively utilized to rapidly determine the TPG for reservoirs with varying permeability. For instance, by selecting three reservoirs with permeabilities ranging from 0.1 mD to 1 mD, calculations can be performed to generate a graph depicting the relationship between TPG, formation pressures, and water saturation levels in the study area, as illustrated in Figure 9. The results presented in Figure 9 indicate that water saturation exerts a more significant influence on TPG compared to formation pressure. This finding underscores the critical importance of closely monitoring changes in formation water content during the development of tight sandstone gas reservoirs to ensure optimal reservoir management and production efficiency.
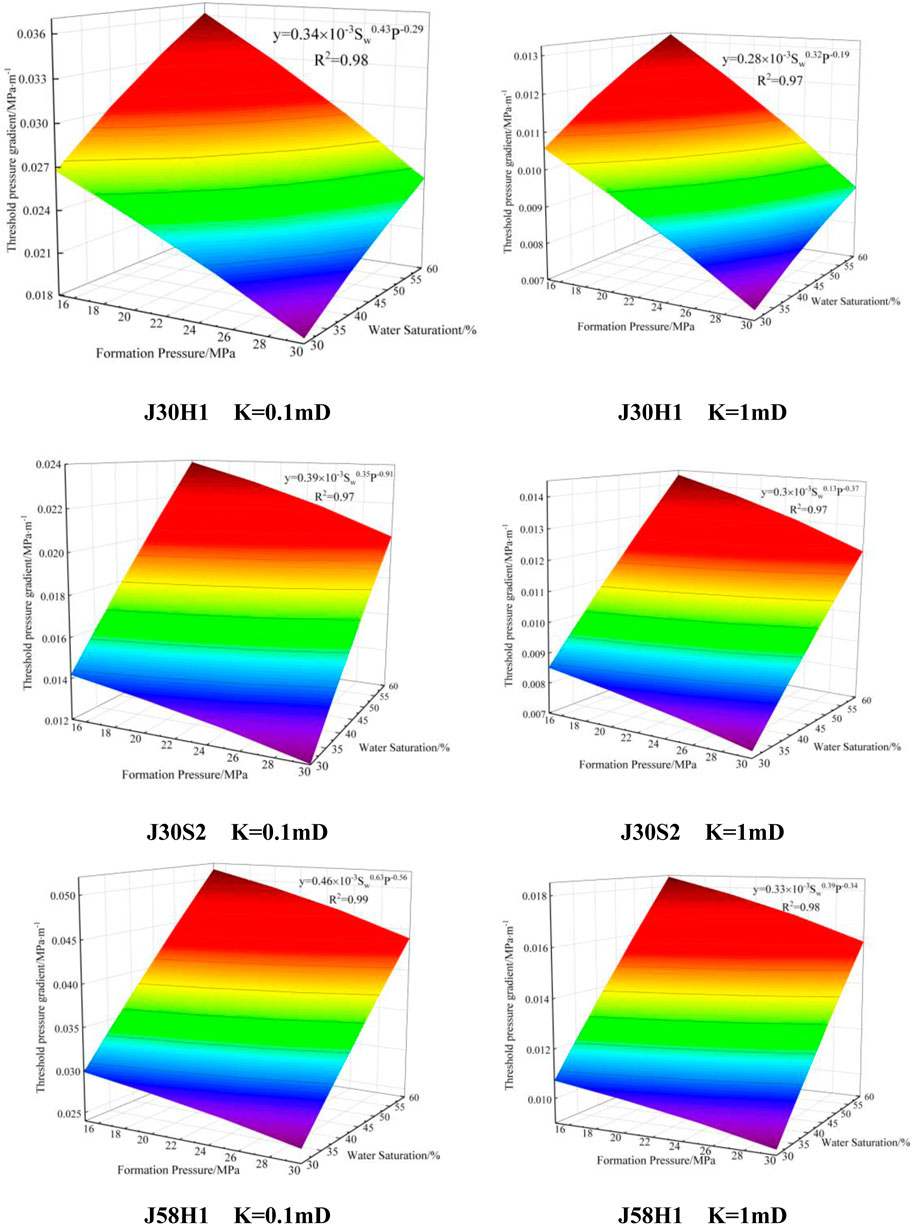
Figure 9. The TPG relationship diagram of three reservoirs under different formation pressures and water content conditions.
5 Conclusion
This study conducted a comprehensive analysis of the variation in threshold pressure gradient (TPG) under different water saturation and formation pressure conditions for tight sandstone gas reservoirs in the Ordos Basin, China, through experimental research and mathematical modeling. The key conclusions are as follows:
(1) The study revealed that TPG is closely related to both water saturation and formation pressure, with water saturation having a significantly greater impact on TPG compared to formation pressure.
(2) As formation pressure increases, the slippage effect of gas molecules gradually diminishes, resulting in a decrease in the rate of change of TPG, which eventually stabilizes. When the local pressure exceeds 25.0 MPa, the slippage effect almost disappears, and gas flow behavior approaches the conventional flow described by Darcy’s law, leading to a stabilized TPG.
(3) The study also found that TPG in low-permeability cores exhibits greater variation with changes in formation pressure, whereas TPG in high-permeability cores remains relatively stable. In low-permeability cores, the slippage effect significantly enhances gas permeability, resulting in larger fluctuations in TPG.
(4) Based on the experimental data, a mathematical model was established to describe the relationship between TPG, permeability, water saturation, and formation pressure. The model’s applicability was validated through case studies, providing a theoretical basis for predicting TPG in gas reservoirs with varying permeability.
In the development of tight sandstone gas reservoirs, special attention should be paid to changes in formation water content, as it has a more pronounced impact on TPG. This insight is crucial for formulating effective development strategies. Future research should integrate actual production data to further optimize and refine the model, enhancing its applicability and predictive accuracy under complex geological conditions.
Data availability statement
The original contributions presented in the study are included in the article; further inquiries can be directed to the corresponding author. The NMR data can be accessed via the following link: https://figshare.com/s/a82b60f719dc6b08eae6.
Author contributions
YL: Conceptualization, Supervision, Writing–original draft, Writing–review and editing. JF: Conceptualization, Formal Analysis, Funding acquisition, Methodology, Supervision, Writing–original draft, Writing–review and editing. WY: Conceptualization, Data curation, Formal Analysis, Methodology, Writing–original draft, Writing–review and editing. KC: Investigation, Methodology, Writing–original draft, Writing–review and editing. JD: Formal Analysis, Funding acquisition, Writing–original draft, Writing–review and editing. JW: Data curation, Investigation, Methodology, Resources, Writing–original draft, Writing–review and editing.
Funding
The author(s) declare that financial support was received for the research, authorship, and/or publication of this article. The authors gratefully acknowledge the support from the National Science Foundation Projects of China (52104022), Project Supported by the Science and Technology Research Program of Chongqing Municipal Education Commission (Grant No. KJQN202401509), Project supported by the Key Laboratory of the Ministry of Education on Safe Mining of Deep Metal Mines (DM 2023B06).
Conflict of interest
Authors YL, KC, JD, JW were employed by Sinopec North China Petroleum Bureau.
The remaining authors declare that the research was conducted in the absence of any commercial or financial relationships that could be construed as a potential conflict of interest.
Publisher’s note
All claims expressed in this article are solely those of the authors and do not necessarily represent those of their affiliated organizations, or those of the publisher, the editors and the reviewers. Any product that may be evaluated in this article, or claim that may be made by its manufacturer, is not guaranteed or endorsed by the publisher.
Abbreviations
β, Dimensionless constant; τ0, Yield stress of oil, MPa; Ka, Absolute permeability, mD; µ, Viscosity, mPa·s; Sw, Water saturation; Swi, Initial water saturation; Swc, Bound water saturation; P, Formation Pressure, MPa.
References
Amann-Hildenbrand, A., Ghanizadeh, A., and Krooss, B. M. (2012). Transport properties of unconventional gas systems. Mar. and Petroleum Geol. 31, 90–99. doi:10.1016/j.marpetgeo.2011.11.009
Bai, M., Elsworth, D., and Roegiers, J. C. (1993). Multiporosity/multipermeability approach to the simulation of naturally fractured reservoirs. Water Resoures. Res. 29 (6), 1621–1633. doi:10.1029/92wr02746
Boukadi, F., Bemani, A., Rumhy, M., and Kalbani, M. (1998). Threshold pressure as a measure of degree of rock wettability and diagenesis in consolidated Omani limestone cores. Mar. and Petroleum Geol. 15 (1), 33–39. doi:10.1016/s0264-8172(97)00059-7
Cao, Y., Ye, L., Lei, Q., Chen, X., Ma, Y. Z. Z., and Huang, X. (2017). Gas-water flow behavior in water-bearing tight gas reservoirs. Geofluids 2017, 1–16. doi:10.1155/2017/9745795
Chen, F., Wang, Z., Fu, S., Li, A., and Zhong, J. (2023). Research on transformation of connate water to movable water in water-bearing tight gas reservoirs. Energies 16 (19), 6961. doi:10.3390/en16196961
Civan, F. (2017). Effect of poroelasticity, pore confinement, molecular-to-inertial transport, and threshold pressure on flow of gas through hydraulically-fractured shale-gas reservoirs. SPE Annu. Tech. Conf. Exhib. doi:10.2118/187056-MS
Ding, J., Yang, S., Shi, Q., Yan, J., and Zheng, C. (2017). Experimental study on dynamic threshold pressure gradient of tight gas reservoir. Pet. Geol. Recovery Effic. 24 (5), 64–69. doi:10.13673/j.cnki.cn37-1359/te.2017.05.010
Dong, M., Shi, X., Ling, S., Zhang, B., and Li, X. (2019). Effect of dynamic pseudo threshold pressure gradient on well production performance in low-permeability and tight oil reservoirs. J. Pet. Sci. Eng. 173, 69–76. doi:10.1016/j.petrol.2018.09.096
Farouk, S., Qteishat, A., Sen, S., Ahmad, F., El-Kahtany, K., Collier, R., et al. (2024b). Characterization of the gas-bearing tight paleozoic sandstone reservoirs of the risha field, Jordan: inferences on reservoir quality and productivity. Arabian J. Sci. Eng., 1–21. doi:10.1007/s13369-024-09000-x
Farouk, S., Sarhan, M. A., Sen, S., Ahmad, F., El-Kahtany, K., and Reda, M. M. (2024a). Evaluation of the lower cretaceous alam el bueib sandstone reservoirs in shushan basin, Egypt-implications for tight hydrocarbon reservoir potential. J. Afr. Earth Sci. 218, 105386. doi:10.1016/j.jafrearsci.2024.105386
Feng, Q., Xing, X., Wang, S., Liu, G., Qin, Y., and Zhang, J. (2024). CO2 diffusion in shale oil based on molecular simulation and pore network model. Fuel 359, 130332. doi:10.1016/j.fuel.2023.130332
Fu, J., Su, Y., Li, L., Hao, Y., and Wang, W. (2020). Predicted model of relative permeability considering water distribution characteristics in tight sandstone gas reservoirs. Fractals 28 (01), 2050012. doi:10.1142/S0218348X20500127
Fu, J., Su, Y., Li, L., Wang, W., and Wang, C. (2021). Productivity model with mechanisms of multiple seepage in tight gas reservoir. J. Petroleum Sci. Eng. 209 (01), 109825. doi:10.1016/j.petrol.2021.109825
Hu, W., Wei, Y., and Bao, J. (2018). Development of the theory and technology for low permeability reservoirs in China. Pet. Explor. Dev. 45, 685–697. doi:10.1016/S1876-3804(18)30072-7
Huang, L., Shi, J., Yang, L., Zang, J., Zhang, L., and Yu, P. (2016). Experimental research and analysis on threshold pressure gradient in low-permeability gas reservoir. Fault-Block Oil Gas. Field 23, 610–614. doi:10.6056/dkyqt201605015
Lan, Y., Deng, X., Cheng, D., and Huang, J. (2014). Diagenetic facies and reservoir quality evaluation of Chang 6 sandstone reservoir in the upper Triassic Yanchang Formation of Huaqing area, Ordos Basin. Acta Petrol. Min. 33 (1), 51–63. doi:10.1016/j.marpetgeo.2020.104360
Li, Y., Dong, P., He, Z., Lei, G., Cao, N., and Wu, Z. (2016). Stress sensitivity analysis of permeability and threshold pressure gradient in low-permeability reservoir. Pet. Geol. Recovery Effic. 23 (6), 57–63. doi:10.13673/j.cnki.cn37-1359/te.2016.06.010
Liu, W. (2019). Analytical study on a moving boundary problem of semispherical centripetal seepage flow of Bingham fluid with threshold pressure gradient. Int. J. Non-Linear Mech. 113, 17–30. doi:10.1016/j.ijnonlinmec.2019.03.011
Liu, W., Zhang, Q., and Zhu, W. (2019). Numerical simulation of multi-stage fractured horizontal well in low-permeable oil reservoir with threshold pressure gradient with moving boundary. J. Pet. Sci. Eng. 178, 1112–1127. doi:10.1016/j.petrol.2019.04.033
Liu, Y. (2023). Research on the two phase flow mechanism and mathematical model of seepage in dense gas reservoirs with water content. Beijing Univ. Sci. Technol. doi:10.26945/d.cnki.gbjku.2023.000452
Miller, R. J., and Low, P. F. (1963). Threshold gradient for water flow in clay systems. Soil Sci. Soc. Am. J. 27 (6), 605–609. doi:10.2136/sssaj1963.03615995002700060013x
Pascal, H. (1981). Nonsteady flow through porous media in the presence of a threshold gradient. Acta Mech. 39 (3), 207–224. doi:10.1007/BF01170343
Prada, Á., and Civan, F. (1999). Modification of Darcy's law for the threshold pressure gradient. J. Pet. Sci. Eng. 22, 237–240. doi:10.1016/S0920-4105(98)00083-7
Ren, X., Li, A., and Memon, A. (2022). Experimental study on gas–water relative permeability characteristics of tight sandstone reservoir in Ordos Basin. Geofluids 2022, 1–8. doi:10.1155/2022/1521837
Shanley, K. W., Cluff, R. M., and Robinson, J. W. (2004). Factors controlling prolific gas production from low-permeability sandstone reservoirs: implications for resource assessment, prospect development, and risk analysis. AAPG Bull. 88 (8), 1083–1121. doi:10.1306/03250403051
Song, H., Cao, Y., Yu, M., Wang, Y., John, K., and Juliana, L. (2015). Impact of permeability heterogeneity on production characteristics in water-bearing tight gas reservoirs with threshold pressure gradient. J. Nat. Gas Sci. and Eng. 22, 172–181. doi:10.1016/j.jngse.2014.11.028
Sun, F., Yao, Y., Li, X., Yu, P., Zhao, L., and Zhang, Y. (2017). A numerical approach for obtaining type curves of superheated multi-component thermal fluid flow in concentric dual-tubing wells. Int. J. Heat. Mass Transf. 111, 41–53. doi:10.1016/j.ijheatmasstransfer.2017.03.103
Tian, J., Kang, Y., Jia, N., Luo, P., and You, L. (2020). Investigation of the controlling rock petrophysical factors on water phase trapping damage in tight gas reservoirs. Energy Sci. Eng. 8 (3), 647–660. doi:10.1002/ese3.539
Tian, J., Qin, C., Kang, Y., You, L., Jia, N., and Song, J. (2023). Reasons for low flowback behaviors of water-based fluids in tight sandstone gas reservoirs. J. Pet. Sci. Eng. 220 Part A 220, 111152. doi:10.1016/j.petrol.2022.111152
Tian, W., Li, A., Ren, X., and Josephine, Y. (2018). The threshold pressure gradient effect in the tight sandstone gas reservoirs with high water saturation. Fuel 226, 221–229. doi:10.1016/j.fuel.2018.03.192
Tian, W., Zhu, W., and Zhu, H. (2014). Influencing factors of threshold pressure gradient value for tight sandstone. Fault-Block Oil Gas. Field 21 (05), 611–614. doi:10.6056/dkyqt201405016
Wang, R., Liu, K., Shi, W., Qin, S., Zhang, W., Qi, R., et al. (2022). Reservoir densification, pressure evolution, and natural gas accumulation in the upper paleozoic tight sandstones in the north Ordos Basin, China. Energies 15, 1990. doi:10.3390/en15061990
Wang, S., Liang, Y., Feng, Q., and Javadpour, F. (2022). Sticky layers affect oil transport through the nanopores of realistic shale kerogen. Fuel 310, 122480. doi:10.1016/j.fuel.2021.122480
Wang, X., and Sheng, J. (2017). Effect of low-velocity non-Darcy flow on well production performance in shale and tight oil reservoirs. Fuel 190, 41–46. doi:10.1016/j.fuel.2016.11.040
Yang, C., Li, X., Liu, S., Gao, S., Ye, L., and Liu, J. (2015). Threshold pressure effect of Sulige low-permeability tight gas reservoir. Acta Pet. Sin. 36, 347–354. doi:10.7623/syxb201503009
Yi, G., Tang, H., and Lü, D. (2006). The study and analysis of starting pressure gradient in low permeability gas reservoirs. Offshore oil. 26, 51–54. doi:10.3969/j.issn.1008-2336.2006.03.010
Zafar, A., Su, Y., Li, L., Fu, J., Mehmood, A., Ouyang, W., et al. (2020). Tight gas production model considering TPG as a function of pore pressure, permeability and water saturation. Pet. Sci. 17, 1356–1369. doi:10.1007/s12182-020-00430-4
Zeng, B., Cheng, L., and Li, C. (2011). Low velocity non-linear flow in ultra-low permeability reservoir. J. Pet. Sci. Eng. 80 (1), 1–6. doi:10.1016/j.petrol.2011.10.006
Zeng, B., Cheng, S., and Hao, F. (2010). Experiment and mechanism analysis on threshold pressure gradient with different fluids. Niger. Annu. Int. Conf. Exhib. Nigeria, July 2010. doi:10.2118/140678-MS
Zhang, F., Jiang, Z., Sun, W., Zhang, X., Zhu, L., Li, X., et al. (2020). Effect of microscopic pore-throat heterogeneity on gas-phase percolation capacity of tight sandstone reservoirs. Energy fuels. 34 (10), 12399–12416. doi:10.1021/acs.energyfuels.0c02393
Zhang, L., Zhou, F., Zhang, S., Li, Z., Wang, J., and Wang, Y. (2019). Evaluation of permeability damage caused by drilling and fracturing fluids in tight low permeability sandstone reservoirs. J. Pet. Sci. Eng. 175, 1122–1135. doi:10.1016/j.petrol.2019.01.031
Zhang, Y., Shu, J., He, Z., Wang, Y., Guo, M., Zhu, G., et al. (2021). Characteristics of heterogeneous diagenesis and modification to physical properties of Upper Paleozoic tight gas reservoir in eastern Ordos Basin. J. Pet. Sci. Eng. 208 Part E, 109243. doi:10.1016/j.petrol.2021.109243
Zheng, D., Pang, X., Jiang, F., Liu, T., Shao, X., and Huyan, Y. (2020). Characteristics and controlling factors of tight sandstone gas reservoirs in the Upper Paleozoic strata of Linxing area in the Ordos Basin, China. J. Nat. Gas. Sci. Eng. 75, 103135. doi:10.1016/j.jngse.2019.103135
Zhu, W., Song, H., Huang, X., Liu, X., He, D., and Ran, Q. (2011). Pressure characteristics and effective deployment in a water-bearing tight gas reservoir with low-velocity non-Darcy flow. Energy fuels. 25, 1111–1117. doi:10.1021/EF1014633
Zhu, W., Zou, G., Liu, Y., Liu, W., and Pan, B. (2022). The influence of movable water on the gas-phase threshold pressure gradient in tight gas reservoirs. Energies 15, 5309. doi:10.3390/en15145309
Appendix
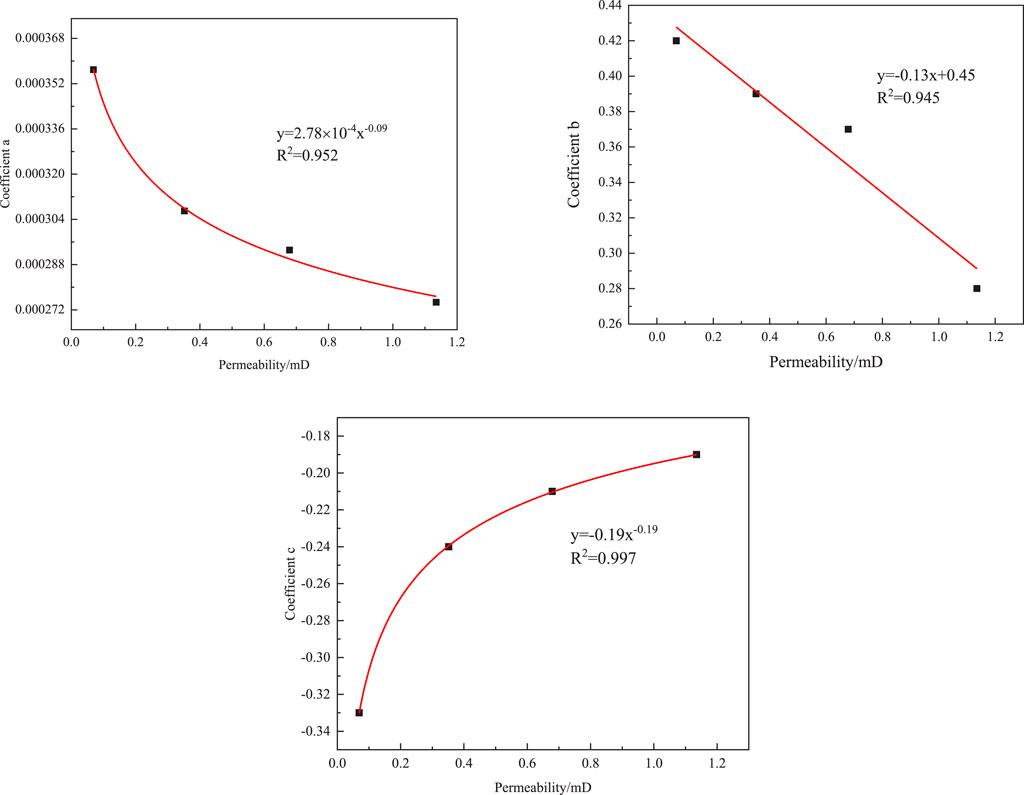
According to studies 3.1 and 3.2, it is known that the TPG is influenced by the permeability of the rock core. To investigate the influence of different reservoir permeability on the TPG, the relationship between the coefficients a, b, and c and permeability in Equation 1 was fitted, using J30H1 as an example, as shown in Figure A1. The coefficients a, b and c exhibit a linear or exponential relationship with permeability. By substituting the relationship between the coefficients and permeability into Equation 1, the mathematical model for the TPG as a function of permeability, water saturation, and formation pressure for J30H1 was obtained, as shown in Equation 2. Similarly, mathematical models for J30S2 and J58H1 were established, as shown in Equations 3, 4.
Keywords: tight sandstone gas reservoir, threshold pressure gradient, mathematical model, water saturation, formation pressure
Citation: Li Y, Fu J, Yan W, Chen K, Ding J and Wu J (2024) Experimental study on the dynamic threshold pressure gradient of high water-bearing tight sandstone gas reservoir. Front. Earth Sci. 12:1487433. doi: 10.3389/feart.2024.1487433
Received: 28 August 2024; Accepted: 30 September 2024;
Published: 30 October 2024.
Edited by:
Amer A. Shehata, Texas A&M University Corpus Christi, United StatesReviewed by:
Sen Wang, China University of Petroleum (East China), ChinaMohammad Abdelfattah Sarhan, Damietta University, Egypt
Copyright © 2024 Li, Fu, Yan, Chen, Ding and Wu. This is an open-access article distributed under the terms of the Creative Commons Attribution License (CC BY). The use, distribution or reproduction in other forums is permitted, provided the original author(s) and the copyright owner(s) are credited and that the original publication in this journal is cited, in accordance with accepted academic practice. No use, distribution or reproduction is permitted which does not comply with these terms.
*Correspondence: Jingang Fu, ZnVqZ3VwY0BnbWFpbC5jb20=; Jingchen Ding, ZGluZ2pjaC5oYnNqQHNpbm9wZWMuY29t
 Yahui Li1
 Jingang Fu
 Wenxin Yan