- 1China National Oil and Gas Exploration and Development Company Ltd., CNPC, Beijing, China
- 2Research Institute of Petroleum Exploration and Development, CNPC, Beijing, China
- 3National Key Laboratory of Petroleum Resources and Engineering, China University of Petroleum (Beijing), Beijing, China
- 4College of Geosciences, China University of Petroleum (Beijing), Beijing, China
Paleosalinity is one of the important properties of paleolake water and is crucial for paleoenvironmental and paleoclimatic reconstruction. However, the paleosalinity characteristics of the 1st Member in the Lower Cretaceous Prosopis Formation (P1 Member) from the Baobab North Sag have not been systematically reported until now. In this study, 16 representative mudstone samples were collected from three coring wells and detailed elemental geochemical investigations were presented to reconstruct the salinity and water types for the P1 Member. The results show that the Sr/Ba ratios range from 0.32 to 0.93, indicating fresh water and brackish water, while the B/Ga ratios range from 1.6 to 3.4, also exhibiting the presence of fresh water and brackish water. The equivalent boron contents range from 84.3 ppm to 185 ppm, with the cast point located in the freshwater interval. Moreover, salinity values ranging from 1.2‰ to 11.0‰ for the Adams’ paleosalimeter and from 6.1‰ to 9.3‰ for the Couch’s paleosalimeter are indicative of brackish water, precisely mesohaline water. After sufficiently eliminating the interferences of diagenesis from the results, combined evaluation of evolutionary profiles and cross-plots of paleosalinity proxies suggest that the B/Ga ratio is the most important proxies for distinguishing water salinity types within the studied interval. The results of the B/Ga ratio indicate that the presence of two main water salinity types: fresh water (mainly distributed in the P14 and P12 sub-members) and brackish water (mainly distributed in the P13 and P11 sub-members). Furthermore, high salinity records in the study area correspond to arid climates, while low salinity intervals correspond to semi-arid and humid pulses, which provides a useful reference for the reconstruction of paleosalinity in terrestrial closed lake basins during the Cretaceous global warming period.
1 Introduction
Paleosalinity characteristics are of great theoretical guidance in paleoenvironmental restoration and paleoclimatic reconstruction (Harder, 1970; Ye et al., 2016; Zhang et al., 2017; Wei et al., 2021). Meanwhile, they are also of great practical significance in the mechanism of organic matter enrichment in hydrocarbon source rocks and shale oil exploration (Hudec and Jackson, 2006; Jiang et al., 2022; Sun et al., 2022a). Therefore, the paleosalinity characteristics and water mass types of lake basins are the basis for paleogeographic analyses of hydrocarbon-bearing basins, and deserve to be studied intensively and extensively. Common methods for paleosalinity reconstruction include 1) semi-quantitative and quantitative calculations based on elemental geochemistry, 2) qualitative analyses of fossil, mineralogical and organic geochemical data, and 3) measurements and tests of pore fluids and inclusions (Walker and Price, 1963; Adams et al., 1965; Couch, 1971; Wang et al., 1979; Qian and Shi, 1982; Zhang et al., 2017). Of these, elemental geochemical methods such as Sr/Ba ratios, B/Ga ratios, equivalent boron content, Adams’ paleosalimeter and Couch’s paleosalimeter are widely utilized as the most reliable proxies (Zhang et al., 2017; Wei et al., 2018; Wei and Algeo, 2020; Sun et al., 2022b). Nonetheless, the interference of provenance and diagenesis on the elemental concentrations adsorbed by clays affects the accuracy of these proxies (Ye et al., 2016; Sun et al., 2024a). In addition, the consistency and reliability between the results of multiple paleosalinity proxies need to be evaluated in depth and comparatively. Therefore, there is an urgent need for a comprehensive application of various paleosalinity proxies for error elimination and comparative evaluation to fill this research gap.
Baobab North Sag is one of the most promising hydrocarbon-rich sags in the Bongor Basin. Previous studies have focused on depositional patterns (Tan et al., 2017), diagenetic mechanisms (Li et al., 2017), tectonic evolution (Yang et al., 2020) and paleontological features (Hu et al., 2023) and other fields. However, previous studies on the water salinity during the depositional period of the Early Cretaceous Prosopis Formation in the Bangor Basin are rare, and paleosalinity investigations of the sags within the basin are even less common. Although previous studies have involved the use of elemental geochemistry and palynology to characterize redox and paleoclimate (Tan et al., 2017; Hu et al., 2023; Sun et al., 2024b), no systematic literature has been reported on the characterization of paleosalinity, and the response mechanisms between salinity fluctuations and climate changes are poorly understood.
In this study, we present detailed elemental geochemical evidence from the 1st Member of the Lower Cretaceous Prosopis Formation (P1 Member) in the Baobab North Sag to reconstruct paleosalinity fluctuations. We analyzed 16 samples from 3 coring wells for a variety of elemental geochemical proxies for paleosalinity reconstruction, including Sr/Ba ratios, B/Ga ratios, equivalent boron content, Adams’ paleosalimeter and Couch’s paleosalimeter. After sufficiently eliminating the interferences of diagenesis from the results, we determined the type of water salinity within the study interval. These findings are combined with paleoclimate changes based on elemental geochemistry and palynology to further explore the driving factors of paleosalinity fluctuations.
2 Geological setting
The Bongor Basin, located within the convergence zone of the West and Central African Rift System (WCARS), was formed by extensional movements derived from dextral shear stress of the Central African Shear Zone (CASZ) in the southern part of the Sahara Craton (Genik, 1993; Tan et al., 2017; Wang et al., 2022). As one of the most important hydrocarbon-bearing basins in the WCARS, the Bongor Basin covers an area of 18,000 km2 (Song et al., 2016). It is composed of several NWW-trending tectonic units from north to south: Northern Uplift, Northern Slope Belt, Central Depression, Western Uplift, Southern Depression and Southern Uplift (Li et al., 2017; Chen et al., 2018) (Figure 1A). Among these secondary tectonic units, the Northern Slope Belt is considered the most favorable area for hydrocarbon exploration and development (Cheng et al., 2022). Previous studies have shown that the proven oil reserves in the basin are mainly distributed in the Baobab, Mimosa, Prosopis and Ronier tectonic zones of the North Slope Belt (Song et al., 2016; Tan et al., 2017). The Baobab tectonic zone is one of the most hydrocarbon-rich blocks in the Bongor Basin, is subdivided further by several small sags and basement ridges.
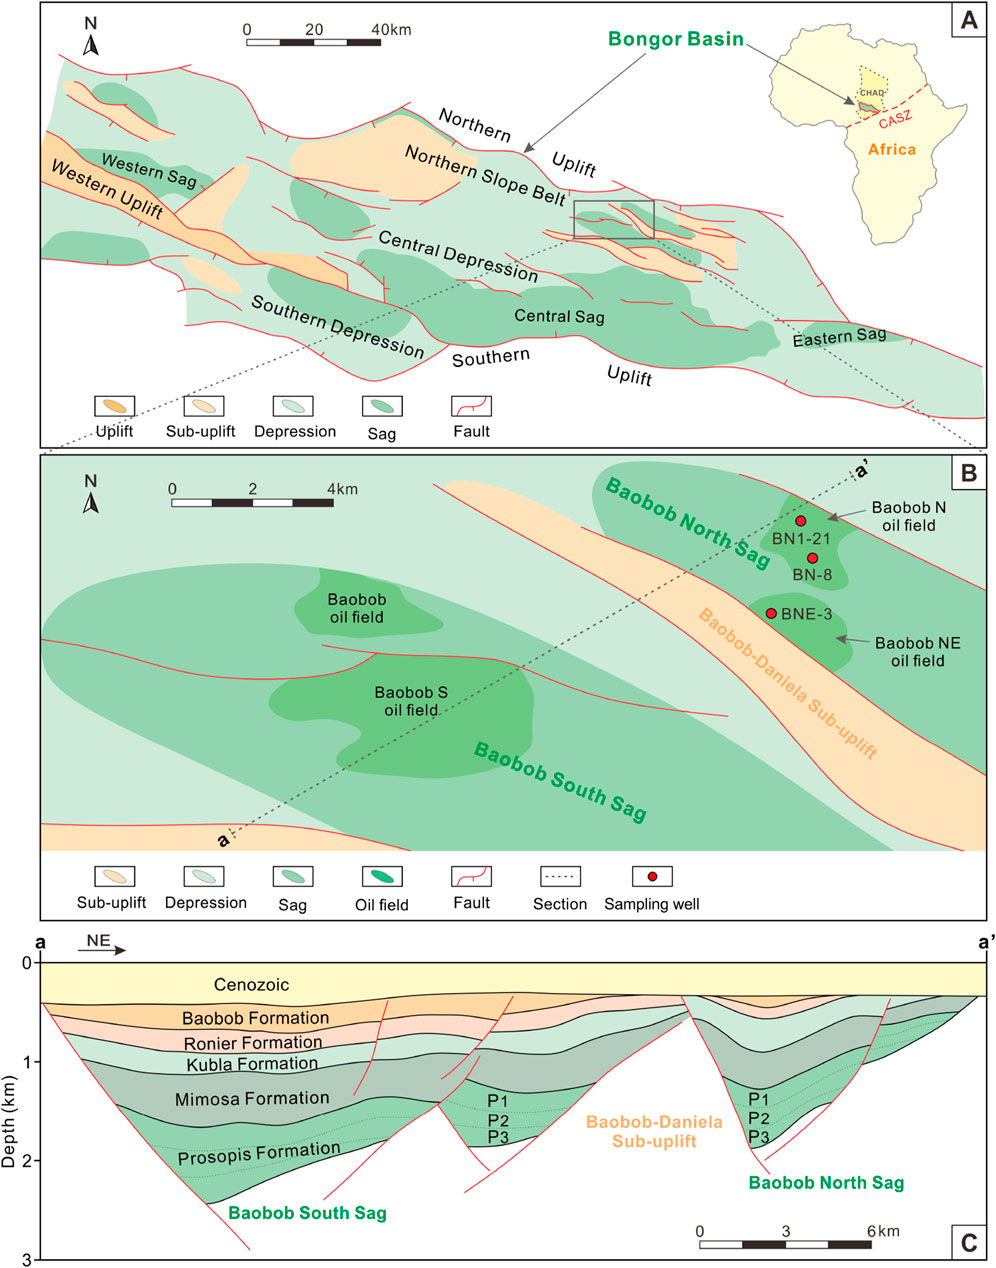
Figure 1. Regional location, geological map and tectonic framework of the study area. (A) Geological map of the Bongor Basin showing tectonic units (modified from Tan et al., 2017); (B) Generalized map of the Baobab North Sag showing tectonic units and sampling well locations; (C) Structural profile map showing the stratigraphic framework of the Baobab North Sag and Baobab South Sag, with the profile location shown in Panel B (modified from Dou et al., 2020). P1–P3: the 1st to 3rd Members of the Prosopis Formation. The present study focused on the 1st Member of the Prosopis Formation.
The Baobab North Sag is located at the northeast of the Baobab tectonic zone in the Bongor Basin and is separated by the Baobab-Daniela Sub-uplift from the South Baobab Sag (Figure 1B). It is further subdivided into two oil fields including Baobab N and Baobab NE based on different oil and water systems. In a tectonic sense, the Baobab North Sag is NW-trending and is bounded by two major boundary faults to the south and north (Figure 1C). Within the sag, multiple phases of intense extensional uplift and tectonic inversion events were occurred, resulting in higher stratigraphic dips (Dou et al., 2011) (Figure 2).
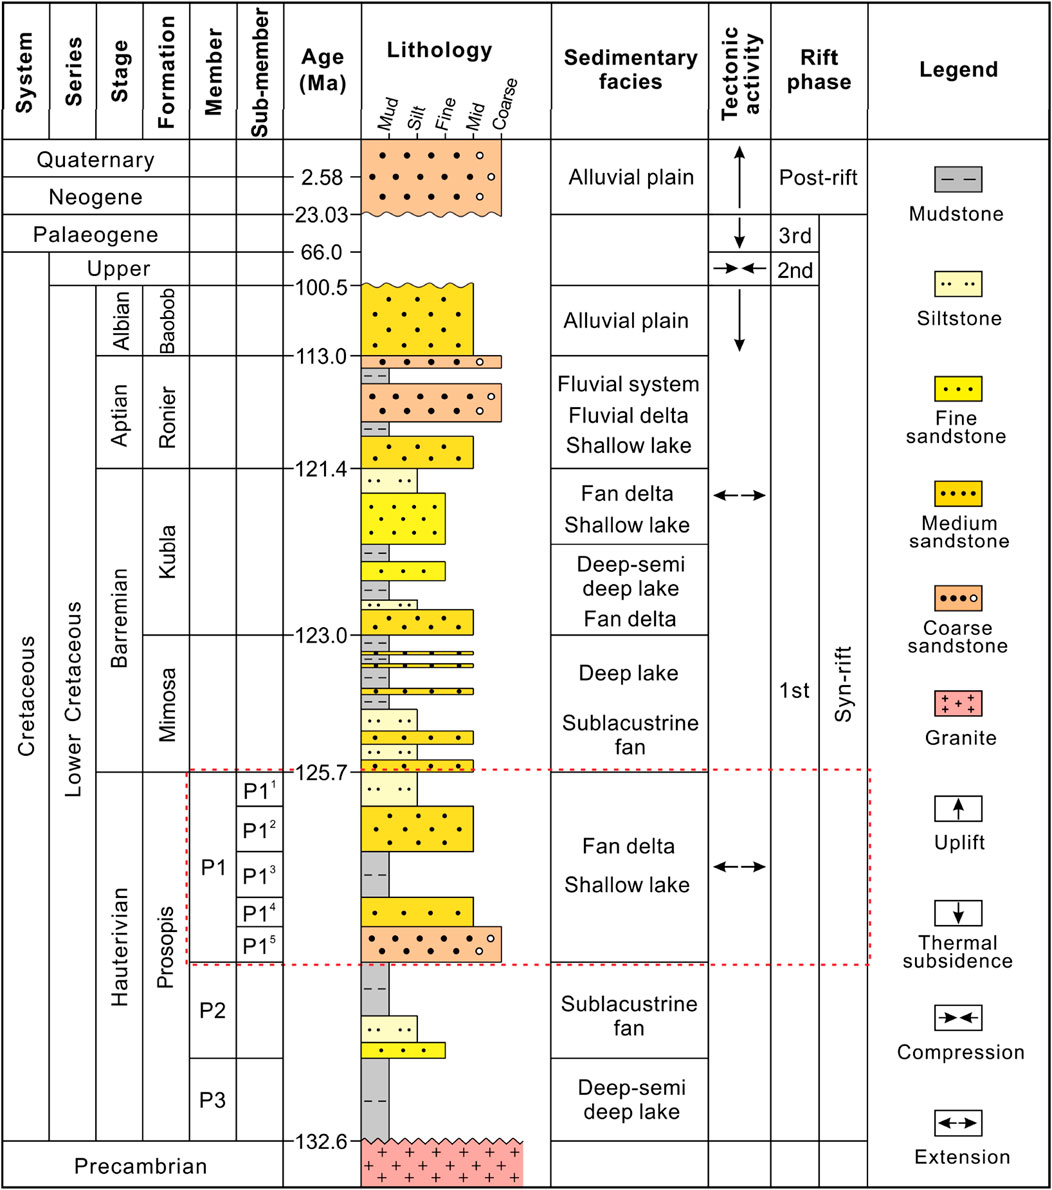
Figure 2. Stratigraphic column depicting the lithostratigraphy, depositional environment and tectonic evolution phases of the Baobab North Sag (modified from Tan et al., 2017; Chen et al., 2018). The present study interval (the 1st Member of the Prosopis Formation) is shown by the dashed red rectangle.
The thickness of terrestrial lacustrine clastic deposits in the Baobab North Sag may reach up to 2 km, including sediments from the Lower Cretaceous, Neogene and Quaternary. In general, the strata deposited during the Paleogene and the Upper Cretaceous were missing, which were almost completely denuded (Genik, 1993; Cheng et al., 2022). The stratigraphic units of the Lower Cretaceous strata in the Baobab North Sag consist of the Prosopis Formation (P), Mimosa Formation (M), Kubla Formation (K), Ronier Formation (R), and Baobab Formation (B), from oldest to youngest (Sun et al., 2024b). The Prosopis Formation was further subdivided into 3 Members from 1st to 3rd, named P1, P2 and P3, respectively. The present study focuses on the 1st Member of the Prosopis Formation (P1) in the Baobab North Sag, which is one of the most oil-productive units in the Bongor Basin (Figure 2). The P1 sediments are mainly composed of gray mudstones, siltstones, medium sandstones, and coarse sandstones that are interpreted to have been deposited in fan deltas and shallow lacustrine environments (Chen et al., 2018; Yang et al., 2020; Wang et al., 2022). In addition, the P1 Member is divided into 5 sub-members from top to bottom to characterize paleosalinity variations, namely the 1st (P11), 2nd (P12), 3rd (P13), 4th (P14), and 5th (P15) sub-members of the P1 Member.
3 Materials and methods
3.1 Samples and experiments
A total of 16 representative mudstone samples from P1 Member of the Lower Cretaceous Prosopis Formation were collected from 3 coring wells in 4 different sub-members of the study area (Figure 1B). The P15 sub-member was not analyzed in this study as no drill core was available. Within this interval, we performed a total of 16 X-ray fluorescence (XRF) analyses of major element concentrations, 16 inductively coupled plasma‒mass spectrometry (ICP‒MS) analyses of trace element concentrations, and 14 X-ray diffraction (XRD) analyses of clay mineral contents. It should be emphasized that the mudstone samples used for these analyses were obtained by cutting from fresh surfaces after removing the influence of mud stains.
Major element contents were determined by glass melting method using an Axios max XRF spectrometer at the National Key Laboratory of Petroleum Resources and Engineering, China University of Petroleum (Beijing). The mudstone samples were first ground and sieved to a 200 mesh (<75 μm) powder. Next, approximately 700 mg of the powdered sample was placed in a muffle furnace and then thoroughly mixed with 5.2 g Li2B4O7, 0.4 g LiF, and 0.3 g NH4NO3. Subsequently, the platinum-gold alloy crucible containing the samples was placed on a flame melting machine and melted in a propane-rich gas at about 1,200°C for 15 min. Eventually, the molten mixture was made into a sample for analysis of major elements.
Prior to ICP–MS analysis, the powdered sample (<75 μm) was placed at 700°C for 3 h. Subsequently, approximately 50 mg of the dried sample was dissolved and digested in a Teflon container using a 20 mL mixture of HF (40%), HClO4 (60%) and HNO3 (65%). Similarly, trace elements such as B, Ga, Sr and Ba were quantitatively determined using Agilent 7900 ICP–MS at the National Key Laboratory of Petroleum Resources and Engineering, China University of Petroleum (Beijing). The relative standard deviations for major and trace elements of the duplicate measurements were <2% and 5%, respectively.
Prior to XRD analysis, the samples were ground into powder and sieved to 500-mesh (25 μm). The samples were then dried at 50°C for 48 h. Approximately 40 mg of the sample was placed into a 10 mL test tube and 0.7 mL of 25% H2O2 was added. After thorough mixing, the suspension was poured onto slides and natural air-dried to obtain natural air-dried (N) slides. Diffractograms of the natural air-dried samples were measured on the X-ray diffractometer (Cu-Kα, 40 kV, 40 mA, 2°–60°, step 0.02°, 2°/min) at the National Key Laboratory of Petroleum Resources and Engineering, China University of Petroleum (Beijing). Subsequently, the N slides were saturated with ethylene glycol vapor for 8 h to obtain ethylene glycol saturated (EG) slides and diffractograms. Similarly, the EG slides were then heated at 500°C for 2.5 h to obtain heated (T) slides and diffractograms. Finally, clay mineral identification was performed using JADE 6.5 software based on the heights and peak areas of the basal reflections on the three XRD patterns (Figure 3).
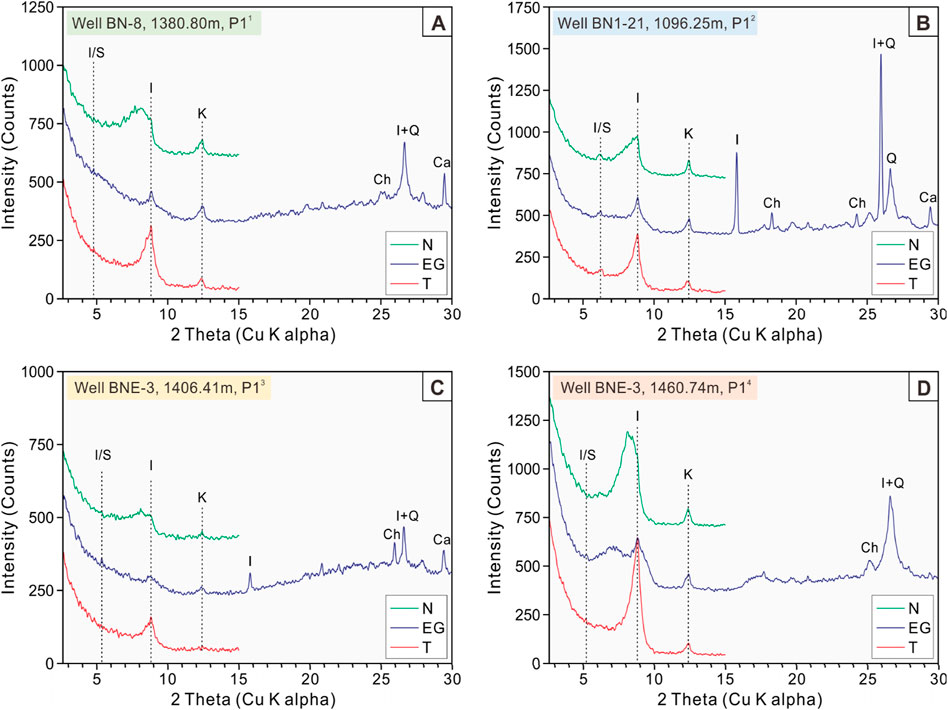
Figure 3. XRD patterns of 4 representative mudstone samples from 4 different sub-members in the study interval. (A) Sample from Well BN-8, 1380.80 m; (B) Sample from Well BN1-21, 1096.25 m; (C) Sample from Well BNE-3, 1406.41 m; (D) Sample from Well BNE-3, 1460.74 m. The vertical dashed line refers to the peaks corresponding to different minerals. I, illite; K, kaolinite; Ch, chlorite; Q, quartz; Ca, calcite; I/S, illite/smectite mixed layer; N, natural air-dried sample; EG, glycol-saturated sample; T, heated sample.
3.2 Paleosalinity reconstruction method
The present study focuses on the reconstruction of paleosalinity characteristics and water mass types based on elemental geochemical proxies including elemental ratios, equivalent boron content, the Adams’ equation and the Couch’s equation. Sr/Ba and B/Ga ratios were often utilized to predict the salinity type of fine-grained sediments based on thresholds for different elemental ratios derived from differences in elemental mobility (Wang et al., 1979; Wei et al., 2018; Wei and Algeo, 2020). The use of equivalent boron content and other boron-derived paleosalinity estimation proxies to identify water mass types was first implemented in the 1960s (Walker and Price, 1963; Walker, 1968). The tested boron content was converted into adjusted boron content using the following Walker’s equation:
Here, Bt and K2O refer to the tested boron content (ppm) and K2O content (%) in samples, respectively.
We projected the sample points of adjusted boron contents onto a deviation curve plate constructed by Walker and Price (1963) to obtain equivalent boron contents of our samples. In the paleosalinity reconstruction of this study, we used Adams’ paleosalimeter to quantitatively calculate the salinity values of paleowater masses. It was done using a regression equation of paleosalinity on equivalent boron content computed from product moments (Adams et al., 1965). The Adams’ paleosalinity (Spa) value was calculated as follows:
The accuracy of equivalent boron content and Adam’s paleosalimeter is significantly influenced by the relative abundance of illite in clay minerals (Ye et al., 2016; Sun et al., 2022a). These two methods solely consider the adsorption of illite on deposited boron while ignoring the impact of other clay minerals such as kaolinite, montmorillonite and chlorite (Qian and Shi, 1982). The results of boron adsorption by different clay minerals show that illite, smectite and kaolinite have a boron absorption capacity ratio of 4:2:1. Therefore, ‘kaolinite boron’ was used to refine the boron content (Couch, 1971). The ‘kaolinite boron’ content was calculated as follows:
Here, Bk, Xi, Xs and Xk refer to the content (%) of “kaolinite boron”, illite, smectite and kaolinite, respectively. The paleosalinity values quantified from Couch’s equation (Spc) are as follows:
4 Results
4.1 Sr/Ba ratio
The cross-plot of Sr versus Ba exhibits that Sr ranges from 219 to 885 ppm with an average value of 510 ppm for P1 Member as a whole, and Ba ranges from 620 to 1,436 ppm with an average value of 883 ppm. Sr shows a slight decreasing and then gradually increasing trend from P14 sub-member (381–610 ppm, mean 492 ppm), P13 sub-member (219–616 ppm, mean 458 ppm), P12 sub-member (255–745 ppm, mean 458 ppm) to P11 sub-member (426–885 ppm, mean 631 ppm). By contrast, Ba exhibits an irregular variation characterized by a range from P14 sub-member (767–1,096 ppm, mean 915 ppm), P13 sub-member (684–864 ppm, mean 748 ppm), P12 sub-member (620–1,436 ppm, mean 937 ppm) to P11 sub-member (830–1,095 ppm, mean 930 ppm; Figure 4A).
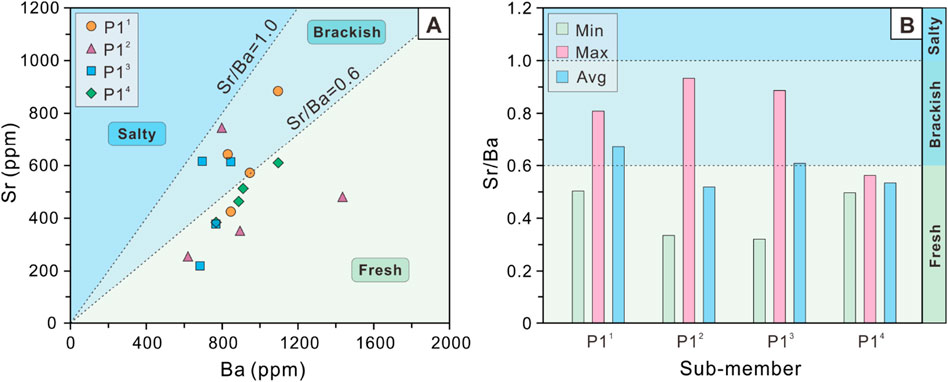
Figure 4. (A) Cross-plot of Sr versus Ba and (B) Histogram of Sr/Ba ratios of the P1 Member in the Baobab North Sag.
Notably, Sr/Ba ratios range from 0.32 to 0.93 with an average value of 0.58 for P1 Member as a whole. Among the 4 sub-members of P1 Member, the variations in the mean values of Sr/Ba ratios are not significant, but the gaps between the maximum and minimum values vary significantly from P14 sub-member (0.5–0.56, mean 0.53), P13 sub-member (0.32–0.89, mean 0.61), P12 sub-member (0.33–0.93, mean 0.52) to P11 sub-member (0.50–0.81, mean 0.67). Furthermore, the histogram of Sr/Ba ratios indicate that the highest value is observed in P12 sub-member, while the lowest value is found in P13 sub-member (Figure 4B).
4.2 B/Ga ratio
B ranges from 38.0 to 69.6 ppm with an average value of 52.3 ppm for P1 Member as a whole, and Ga ranges from 14.3 to 30.1 ppm with an average value of 21.4 ppm. Like Sr, B also exhibits a slight decreasing and then gradually increasing trend from P14 sub-member (43.9–69.6 ppm, mean 57.1 ppm), P13 sub-member (45.9–60.1 ppm, mean 51.2 ppm), P12 sub-member (41.3–55.6 ppm, mean 46.7 ppm) to P11 sub-member (38.0–69.4 ppm, mean 54.1 ppm). By contrast, Ga shows an overall decreasing trend from P14 sub-member (25.2–30.1 ppm, mean 27.5 ppm) to P13 sub-member (14.3–20.7 ppm, mean 18.4 ppm), P12 sub-member (16.0–23.3 ppm, mean 21.0 ppm), and P11 sub-member (17.1–20.6 ppm, mean 18.8 ppm; Figure 5A).
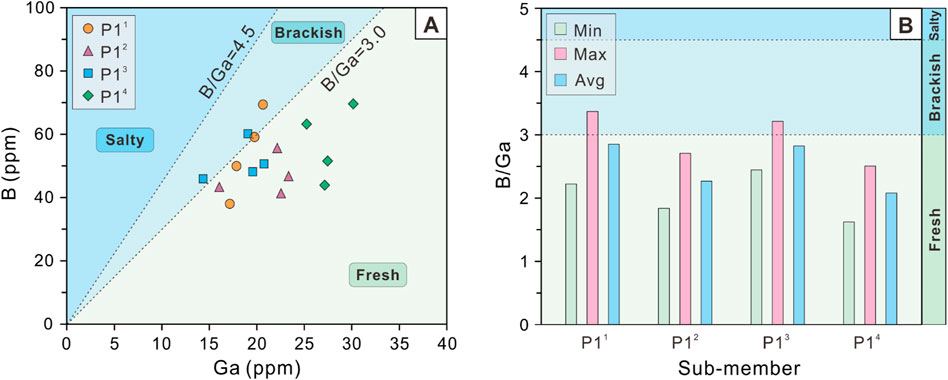
Figure 5. (A) Cross-plot of B versus Ga and (B) Histogram of B/Ga ratios of the P1 Member in the Baobab North Sag.
B/Ga ratios range from 1.6 to 3.4 with an average value of 2.5 for P1 Member as a whole. Among the 4 sub-members of P1 Member, B/Ga ratios exhibit a trend of first increasing, then decreasing and finally increasing from P14 sub-member (1.6–2.5, mean 2.1), P13 sub-member (2.4–3.2, mean 2.8), P12 sub-member (1.8–2.7, mean 2.3) to P11 sub-member (2.2–3.4, mean 2.8). It is worth noting that the magnitude of all the changes mentioned above is extremely slight. Unlike the Sr/Ba ratios, the histogram of B/Ga ratios indicate that the highest value is observed in P11 sub-member, while the lowest value is found in P14 sub-member (Figure 5B). Even so, the trends in the mean values of two ratios are highly consistent, both first increasing then decreasing and finally increasing again (Figures 4B, 5B).
4.3 Equivalent boron content
The distribution of equivalent boron contents for the study interval were determined by projecting the adjusted boron content (Equation 1) onto the equivalent boron content curve plate (Figure 6). The adjusted boron contents range from 96.2 to 252.1 ppm with an average value of 161.4 ppm for P1 Member as a whole, and the equivalent boron contents range from 84.3 to 185.0 ppm, with a mean value of 124.7 ppm (n = 16). Furthermore, the maximum equivalent boron content is observed in the P11 sub-member, while the minimum is found in the P14 sub-member. The above results on the distribution of maximum and minimum values are in high agreement with those shown by the B/Ga ratios (Figures 5B, 6).
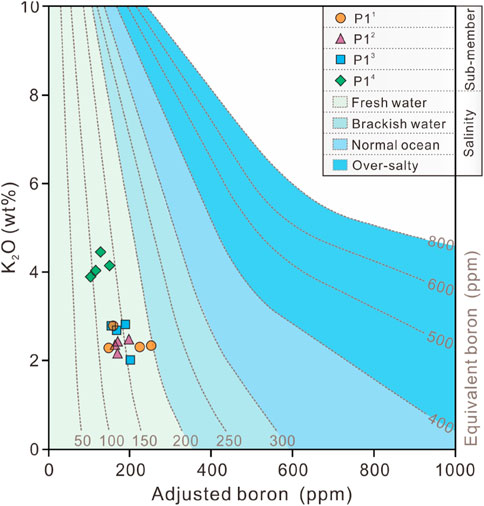
Figure 6. The equivalent boron content distribution in the P1 Member, Baobab North Sag (modified after Walker and Price, 1963).
4.4 Quantitative salinity value
4.4.1 Salinity value from Adams’ paleosalimeter
A quantitative analysis of Adam’s paleosalinity (Spa) values were conducted using equivalent boron content obtained from the curve plates shown in Figure 6 and Adams’ paleosalinity regression equation (Equation 2; Figure 7A). We statistically analysed the maximum, minimum and mean values in different sub-members (Figure 7B). The Spa values range from 1.2‰ to 11.0‰ for P1 Member as a whole, with an average value of 5.1‰. Among these 4 sub-members of P1 Member, the Spa values exhibit a gradual increasing trend from P14 sub-member (1.2‰–5.6‰, mean 3.3‰), P13 sub-member (4.0‰–6.6‰, mean 5.5‰), P12 sub-member (4.2‰–6.8‰, mean 5.0‰) to P11 sub-member (3.0‰–11.0‰, mean 6.7‰). Importantly, the maximum values and trends of Spa are consistent with the equivalent boron content, but Spa provides a more visual representation of quantitative salinity values.
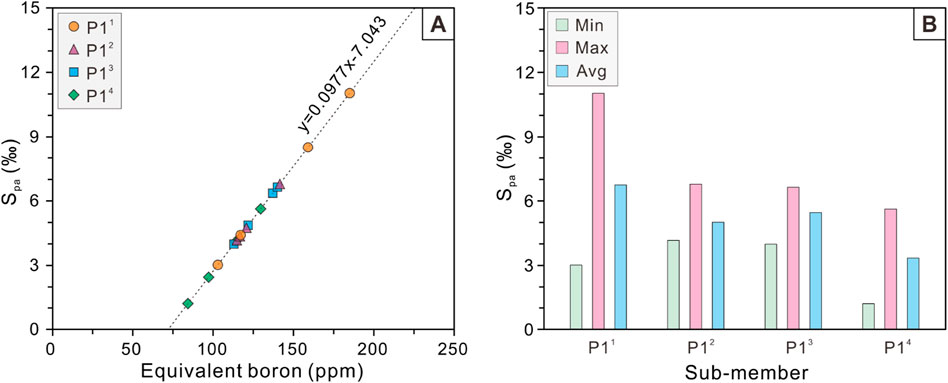
Figure 7. (A) Cross-plot of Spa (‰) versus Equivalent boron (ppm) and (B) Histogram of Spa (‰) of the P1 Member in the Baobab North Sag.
4.4.2 Salinity value from Couch’s paleosalimeter
In this study, we assumed that the boron content absorbed by clay minerals aligns with the findings of Couch, 1971. Paleosalinity values from Couch’s method were quantitatively calculated with test results of clay mineral contents and ‘kaolinite boron’ content (Equations 3, 4). The Couch’s paleosalinity value for P1 Member in the Baobab North Sag is 6.1‰–9.3‰ and the average value is 7.3‰ (Figure 8). Among the 4 sub-members of P1 Member, the Spc values show a slight decreasing and then gradually increasing trend from P14 sub-member (5.9‰–8.7‰, mean 7.8‰), P13 sub-member (6.5‰–7.8‰, mean 6.9‰), P12 sub-member (5.8‰–7.2‰, mean 6.5‰) to P11 sub-member (6.3‰–9.3‰, mean 7.9‰). The maximum values of Spc is observed in the P11 sub-member, while the minimum is found in the P12 sub-member. Furthermore, the Spc values are less variable than Spa values and extremely like boron and “kaolinite boron” (Figure 8).
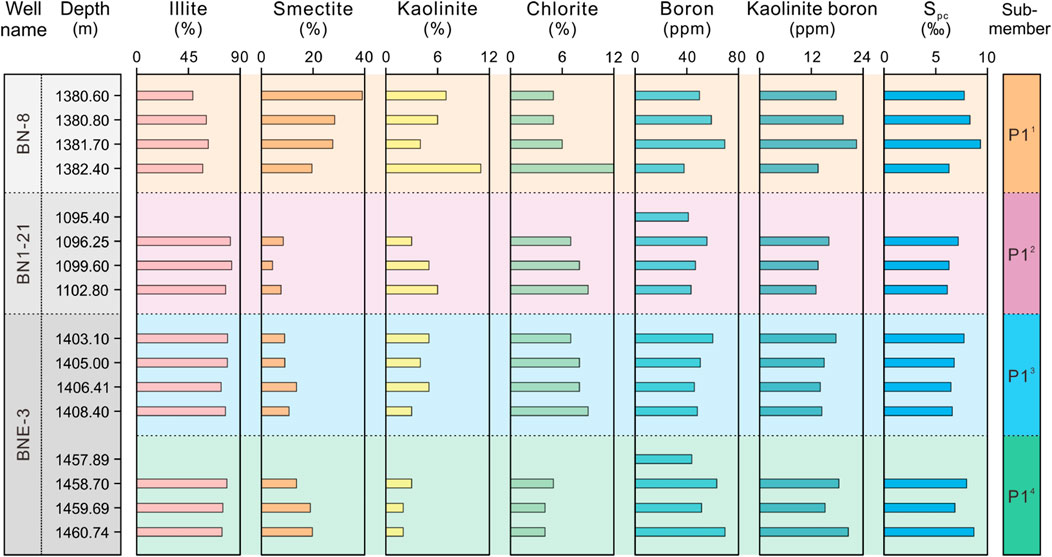
Figure 8. Depth profiles of clay minerals and paleosalinity of 3 wells in the study interval. Bk and Spc refer to Couch’s “kaolinite boron” (ppm) and paleosalinity (‰) from Couch’s method.
5 Discussion
5.1 Evaluation of interferences from provenance and diagenesis
5.1.1 Carbonate-hosted Sr
Elemental contents for paleosalinity recovery are often disturbed by the composition of provenance (Ye et al., 2016). Fine-grained clastic rocks, such as mudstones, are often utilised for paleoenvironmental reconstruction due to the presence of sensitive elements. Previous studies have indicated that pure carbonate sediments tend to contain higher concentrations of Sr compared to fine-grained clastic rocks, with concentrations ranging from approximately 1,000–3,000 ppm in calcite (Bathurst, 1972). Thus, one important issue in using Sr/Ba ratios as a salinity proxy is potential alteration of the clay-fraction signal by carbonate-hosted Sr (Wei and Algeo, 2020; Chang et al., 2024). The higher concentrations of carbonate-hosted Sr are often mistaken for clay-adsorbed Sr and are used to calculate Sr/Ba ratios, ultimately increasing the Sr/Ba ratios in the samples. For this reason, it is essential to evaluate all samples affected by carbonate-hosted Sr and to establish a carbonate threshold for the study intervals (Wei and Algeo, 2020; Sun et al., 2022b; Sun et al., 2024a).
The most direct method for evaluating carbonate-hosted Sr is the correlation between Sr and total inorganic carbon (TIC) content, with a significant positive correlation indicating the presence of carbonate-hosted Sr in the samples (Wei and Algeo, 2020; Chang et al., 2024). Previous studies have shown that in the absence of TIC data, the calcium oxide (CaO) can be used as a proxy for carbonate mineral content (Wei and Algeo, 2020; Sun et al., 2024a). In this study, CaO content was used as an alternative proxy for carbonate content. According to the test and analysis results, a positive relationship was observed between Sr and CaO in all samples (R2 = 0.64) (Figure 9A). Although there was a certain CaO threshold in previous studies to distinguish whether it is affected by carbonate-hosted Sr, the Sr content of all samples in this study seems to be widely influenced by carbonate minerals. There is a significant positive correlation between Sr/Ba and CaO, therefore Sr/Ba cannot accurately characterize salinity characteristics in this study (Figure 9B).
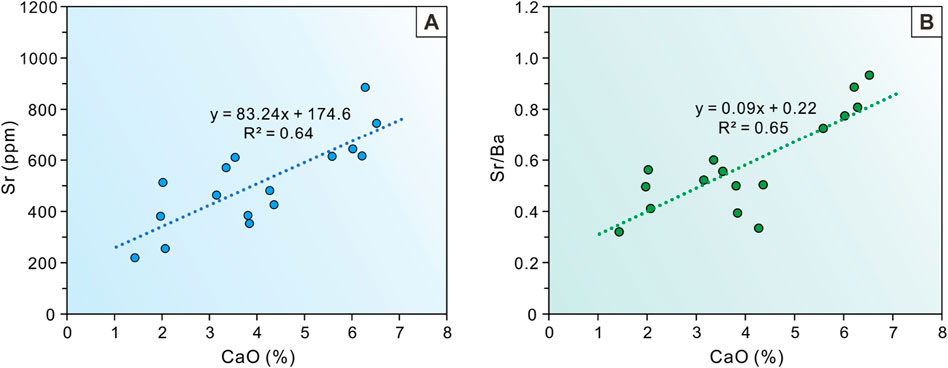
Figure 9. (A) Cross-plot of Sr (ppm) versus CaO (%) and (B) Sr/Ba (ppm) versus CaO (%) of the study interval in the Baobab North Sag. Note there is a strong correlation between Sr/Ba and CaO at any level of CaO content. It is difficult to establish a suitable CaO threshold to eliminate the interference of carbonate minerals to accurately reconstruct paleosalinity.
5.1.2 Diagenetic evolution of clay minerals
Quantitative reconstruction of boron-derived paleosalinity requires the aid of clay minerals and their adsorbed boron concentrations (Couch, 1971; Sun et al., 2022b). Previous studies have demonstrated that buried diagenesis interferes with estimates of clay-adsorbed boron content by altering the relative percentage of clay minerals (Ye et al., 2016). Classical model of diagenesis shows a gradual increase in illite content and the proportion of illite in I/S with burial depth (Weaver, 1984). The transformation of smectite to illite with progressive increase in burial depth is the most widespread diagenetic evolutionary process (Chamley, 1994). Thus, diagenetic evolution is also important for boron-derived paleosalinity reconstruction due to the varying degrees of boron adsorption capacity of illite, smectite and kaolinite (Couch, 1971).
In this study, although P11 sub-member has low illite proportions compared to the other sub-members, the pattern of low illite proportions is not to imply that the high illite contents of other sub-members are converted from smectite with buried diagenetic processes. The samples of P11 sub-member from well BN-8 are buried at a deeper depth than those from P12 sub-member, so it can be ruled out that the burial depth caused illite to occur in the smectite. Thus, the low illite proportion pattern of P11 sub-member may be related to the relatively high proportion of kaolinite and chlorite. Furthermore, the long-term pattern of relatively stable illite proportions in sub-members of P14, P13, and P12 suggests the presence of weak and uniform diagenesis in the lower part of the study interval (Figure 8). The above inference is also supported by consistent XRD patterns of clay minerals (Figure 3). Therefore, the interference of diagenetic evolution on Couch’s paleosalimeter in the study interval can be neglected.
5.2 Discrimination of water salinity types
5.2.1 Water salinity types from salinity proxies
The Sr/Ba ratio is a sensitive semi-quantitative proxy for salinity recovery in water masses and is often widely used to lacustrine basins (Wang et al., 1979; Chen et al., 1997; Wei et al., 2018). With the increasing of salinity, Ba tends to form BaSO4 precipitation first, while Sr requires higher salinity to form SrSO4 precipitation (Zhang et al., 2017). Thus, the Sr/Ba ratio can accurately characterise the types of water salinity. Although our study suggests that the interference of carbonate-hosted Sr cannot be eliminated, the Sr/Ba ratio can still qualitatively characterize the relative fluctuations in water salinity. Previous studies have indicated that the Sr/Ba ratio is less than 0.6 for sediments in terrestrial freshwater, between 0.6 and 1 for sediments in brackish water, and usually greater than 1 for sediments in salty water (Qian and Shi, 1982; Zhang et al., 2017; Sun et al., 2022a). The Sr/Ba ratios of the samples within P14 sub-member of the Baobab North Sag are all indicative of a freshwater salinity type, whereas its upper sub-members are indicative of a combination of freshwater and brackish environments, as shown by the distribution intervals of salinity proxies for all samples (Figure 4A; Figure 10A) and the mean values for each sub-member (Figure 4B). Although all three upper sub-members indicate the presence of a brackish environment, the water salinity during the depositional period of P14 sub-member is significantly lower than that of the other three sub-members. Furthermore, as sedimentation progressed in the basin, the Sr/Ba ratio exhibits a brackish characteristic in the P11 (Figure 9A), which may indicate a long arid period of the closed lake basin climate. The high value of Sr/Ba corresponds to high content samples of carbonate minerals; therefore, it is most affected by carbonate-hosted Sr (Figure 9B). Therefore, the actual salinity should be lower than the highest salinity range of Sr/Ba proxy in our study.
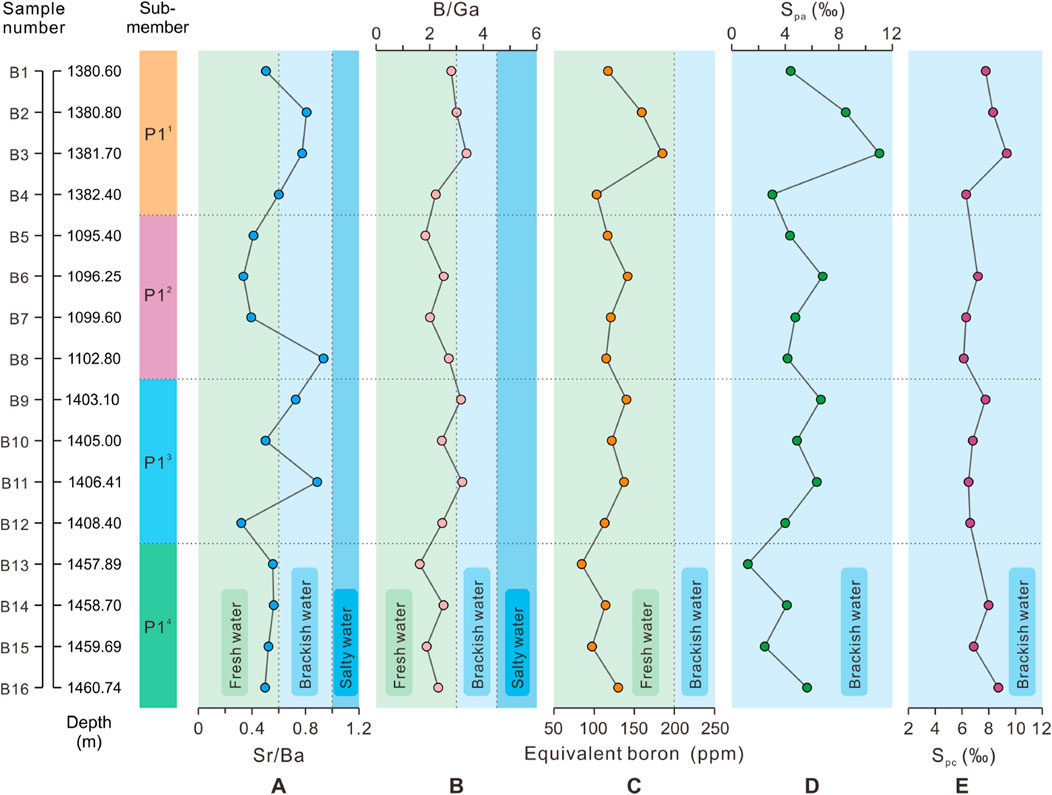
Figure 10. Evolutionary profiles of multiple paleosalinity proxies of the P1 Member in the Baobab North Sag. (A) Sr/Ba; (B) B/Ga; (C) Equivalent boron content (ppm); (D) Spa (‰), and (E) Spc (‰). Note: all samples are not from the same well but follow the up-and-down sequence of stratigraphic comparisons. The horizontal dotted lines are the boundaries of the sub-members, and the vertical dotted lines are the thresholds of the salinity types. Please refer to Figure 8 for the relationship between stratigraphic levels.
The B/Ga ratio is commonly utilised as a proxy for paleosalinity reconstruction based on the differences in the behaviour of B and Ga during sedimentary process (Ye et al., 2016; Wei and Algeo, 2020). The sediments in salty water have higher B content and lower Ga content than those in freshwater (Potter et al., 1963; Shimp et al., 1969). B/Ga ratio ranges of <3, 3–4.5 and >4.5 are associated with fine-grained sediments from fresh water, brackish water and salty water, respectively (Wang et al., 1979; Ye et al., 2016; Zhang et al., 2017; Sun et al., 2022b). In this study, most samples recorded fresh water environments from P11 and P13 (mean <2.5), transitional environments from P12 and P14 with a maximum value close to brackish water and a minimum value of fresh water (Figure 5B, 10B).
In argillaceous sediments, a strong linear covariation exists between the boron content absorbed in clay minerals and salinity. This indicates that boron content is influenced by variations in salinity or correlated water mass variables, such as Eh and pH (Degens et al., 1957; Price and Walker, 1963; Adams et al., 1965; Couch, 1971). The boron adsorbed by illite is referred to as equivalent boron and is used to determine the types of salinity with the aid of its threshold. The threshold is below 200 ppm in freshwater, 200–300 ppm in brackish water, 300–400 ppm in normal marine systems and above 400 ppm in hypersaline water (Walker and Price, 1963; Walker, 1968). The distribution of equivalent boron content in each sub-member of the P1 Member in the Baobab North Sag shows significant polarisation, bounded by the P11 and P14 sub-member in the study interval (Figure 6). However, all the samples show a concentrated distribution of equivalent boron content in freshwater environments (Figure 10C).
Both Adams’ and Couch’s paleosalimeters are methods for quantitatively determining salinity values, but their applicability varies depending on the conditions of the clay fraction (Sun et al., 2022b). Adams’ equation considers only the sorption of boron by illite and ignores the influence of sorption and diagenesis of other clay minerals, such as smectite and kaolinite (Couch, 1971). Consequently, the type of water mass obtained by the two paleosalimeters often differs significantly. Water salinity is classified as freshwater (<0.5‰), brackish water (0.5‰–30‰), euhaline water (30‰–40‰) and salty water (>40‰) based on different salinity values. Among them, brackish water can be further divided into three sub-types: oligohaline (0.5‰–5‰), mesohaline (5‰–18‰) and polyhaline (18‰–30‰) (Zhang et al., 2017). In the P1 Member of the Baobab North Sag, the paleosalinity values measured using two paleosalimeters are in the brackish water, precisely mesohaline water (Figures 10D, E).
5.2.2 Evaluation of paleosalinity proxies
The five paleosalinity proxies used in this paper show a high degree of consistency in the trend of paleosalinity changes in the study interval (Figure 10). Notably, the Sr/Ba and B/Ga ratios showed greater sensitivity, reflecting a mixture of freshwater and brackish water. However, a comparative evaluation is necessary to confirm the presence of brackish water and to verify the credibility of the salinity proxy. Of all the paleosalinity proxies discussed above, Couch’s paleosalimeter is generally considered the most accurate by sedimentologists as it accounts for the variability in boron sorption by different clay minerals (Couch, 1971; Ye et al., 2016; Zhang et al., 2017). Extensive studies have emphasised the importance of the B/Ga ratio in paleosalinity reconstruction and its reliability cannot be denied (Wei et al., 2022). While Couch’s salinometer is capable of quantifying salinity values, it is susceptible to diagenesis disturbances. However, the B/Ga ratios after eliminating inherited boron tend to be more sensitive to salinity variation. It is important to note that each proxy can be influenced by factors other than salinity, and the most accurate proxy is generally determined through correlation analysis of cross-plots (Sun et al., 2022b).
A perfect linear relationship (R2 = 1) exists between Adams’ paleosalimeter and equivalent boron content (Figure 7). Therefore, only the equivalent boron content was selected for analysis in the paleosalinity proxy cross-plots (Figure 11). There is a positive correlation between Sr/Ba ratios and B/Ga ratios with a correlation coefficient of 0.39 (Figure 11A), which is consistent with the results of the paleosalinity evolution profiles (Figures 10A, 9B). In contrast, the Sr/Ba ratio correlates poorly with Spa and Spc, with correlation coefficients of 0.14 and 0.04, respectively (Figures 11B, C). In addition, B/Ga was also significantly and positively correlated with Spa, with a correlation coefficient of 0.63, which corroborated each other and indirectly demonstrated the reliability of both proxies (Figure 11D). The correlation between B/Ga and Spc was far weaker than that between B/Ga and Spa, with a correlation coefficient of only 0.36 (Figure 11E). Moreover, for both quantitative paleosalimeters, there is a positive co-correlation between Spa and Spc with a correlation coefficient of 0.51 (Figure 11F), which is slightly lower than that between B/Ga and Spa.
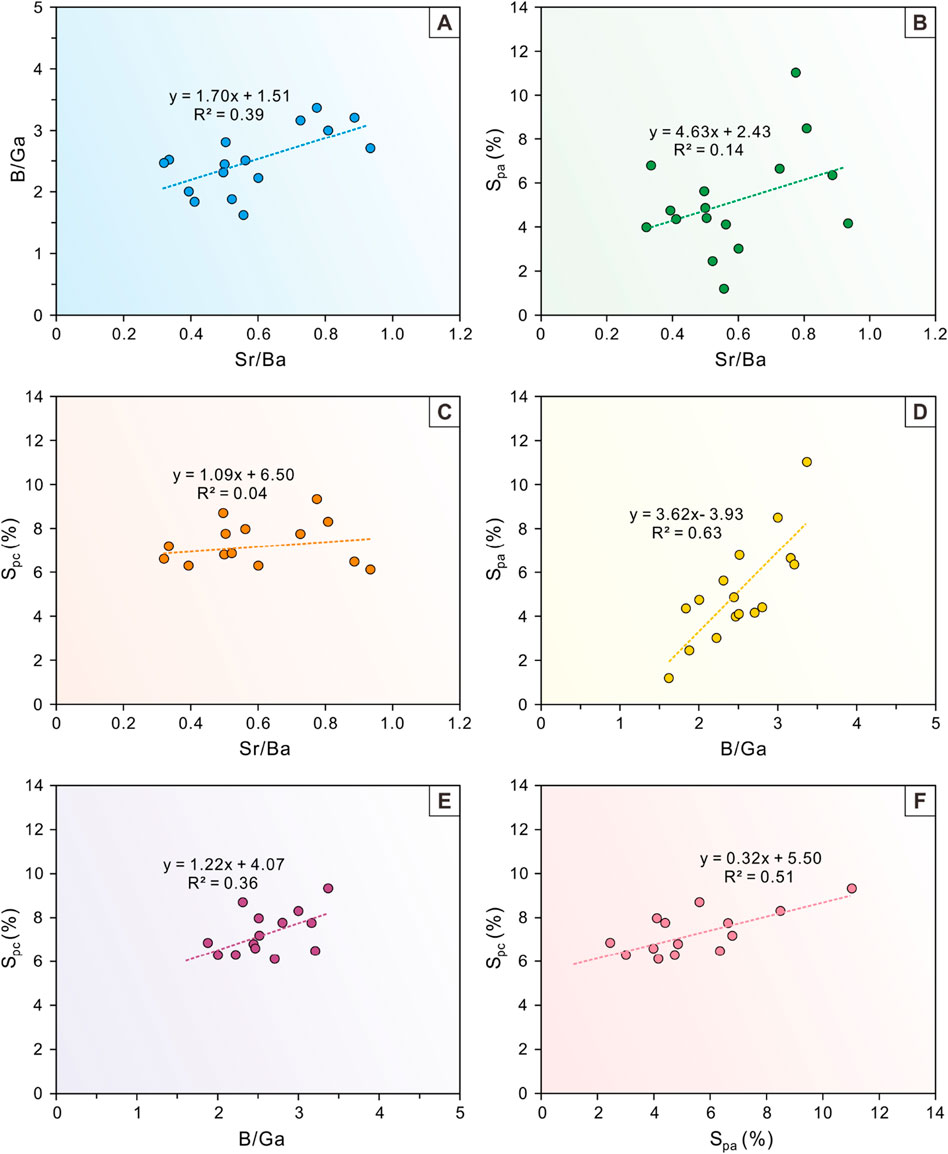
Figure 11. Cross-plots of (A) B/Ga versus Sr/Ba, (B) Spa versus Sr/Ba, (C) Spc versus Sr/Ba, (D) Spa versus B/Ga, (E) Spc versus B/Ga, and (F) Spc versus Spa of the P1 Member in the study area.
The combined evaluation of evolutionary profiles and cross-plots of paleosalinity proxies has revealed that the B/Ga ratio is the most significant proxy for distinguishing the water salinity types in the study interval. Apparently, there is a higher correlation between the B/Ga ratio and other proxies than the Sr/Ba ratio, the equivalent boron content, Adams’ paleosalimeters and Couch’s paleosalimeters (Figure 11). In addition, the Sr/Ba proxy has an overestimated salinity value due to interference from carbonate-hosted Sr. The method of equivalent boron content involves too many assumptions regarding sources of K2O, the distribution of B among clay mineral phases, and the amount of B in pure illite, so the estimation of salinity types has not been confirmed by modern sedimentation. Adams’ paleosalimeter is based on a statistical relationship fitted to the relationship between water salinity and sediment B in a single estuary. Before this relationship becomes a formula for calculating salinity in lake basins, especially for salinity type thresholds, it needs to be validated in conjunction with more modern lake basins. The salinity value calculated by Couch’s paleosalimeter is greatly affected by the content of clay minerals. Although we excluded the interference of diagenesis on clay minerals in our study, the differences in sediment sources are difficult to measure, so a large amount of modern sedimentation is also needed for verification. In contrast, the B/Ga proxy has been widely regarded as the most reliable salinity proxy in recent years after undergoing extensive modern sedimentation and salinity restoration work in underground ancient lake basins (Wei et al., 2018; Wei and Algeo, 2020; Sun et al., 2024b). The results of the B/Ga ratio show the type of water salinity in the study interval, indicating that the Baobab North Sag is generally a freshwater lake basin with short-term brackish water period.
5.3 Implications for climate changes
The water salinity in the study interval varies in different sub-members and exhibits different characteristics. From different sub-members, all five proxies show high salinity intervals in the P13 and P11 sub-members and low salinity intervals in the P14 and P12 sub-members. Specifically, all proxies indicated several consistent high salinity samples including B2, B3, B9, B11. Except for several abnormally high values of Sr/Ba due to the interference of carbonate-hosted Sr, the other four salinity proxies showed the highest salinity values in the sample B3 of P11 sub-member (Figure 10).
Water salinity in terrestrial closed lake basins is generally controlled by the balance between precipitation and evaporation and is considered a sensitive indicator of arid and semi-arid climates (Ye et al., 2016). Salinization of lake water is associated with high evaporation and low precipitation in arid-semi to arid environments (Sun et al., 2022a). Previous studies on the paleoclimate of the Prosopis Formation in the Bongor Basin indicate a predominantly hot and arid climate, accompanied by seasonal precipitation and transient warm and humid breaks (Hu et al., 2023). The use of trace element proxies such as Sr/Cu ratios to analyse climate change revealed an overall the overall hot arid climate with ephemeral humid pulses (Tan et al., 2017). Previous studies based on palynofloras showed that the predominant palynofloras are xerophytes growing in the tropical-subtropical zone, accompanied by a significant concentration of hygrophilous plants (Tan et al., 2017; Hu et al., 2023). Although previous studies have pointed out that lake basin expansion and topographic rainfall caused by tectonic movements can also cause changes in the salinity of enclosed lake basins (Ye et al., 2016), the sedimentary period in which the study interval is located is the early stage of the rift basin, and tectonic activities such as faults are very weak (Cheng et al., 2018). Therefore, the impact of tectonic movements on the water salinity of lake basins can be ignored.
The latest paleoclimate research on this study interval utilizes elemental geochemistry to record climate change characteristics (Sun et al., 2024b). The samples from the arid climate intervals studied by previous researchers correspond to samples with higher water salinity in our salinity proxy, such as samples B3, B9, and B11. Therefore, the arid-humid transition in the climate of the study interval well explains the cause and provides a driving force for salinity fluctuations in this study.
During the depositional period of the Prosopis Formation (∼132.6–125.7 Ma ago), the climate gradually evolved towards drought, accompanied by the emergence of Cretaceous greenhouses (Huber et al., 2018; Sun et al., 2024b). The overall climate is semi-arid with short and humid pulses, and the salinity is mainly brackish water (Figure 12A). With the intensification of global climate warming during the Cretaceous period, the climate gradually showed extreme arid pulses, leading to continuous salinization of the lake basin and causing the lake water salinity to reach brackish water (Figure 12B). Therefore, these arid breaks provide the driving force for the formation of brackish water and create excellent conditions for the preservation of organic matter (Sun et al., 2024b). Therefore, the salinity fluctuations in this study are mainly attributed to the warming of the global climate during the Cretaceous period. The control of water salinity changes by global climate warming during the Cretaceous period may be widespread in closed terrestrial lake basins, and should be explored in depth by sedimentologists.
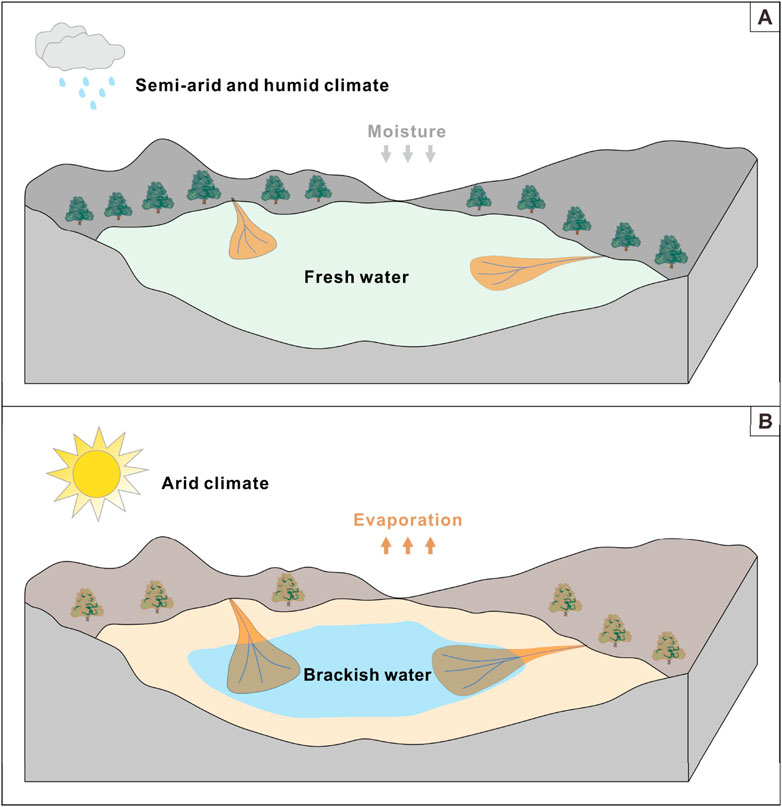
Figure 12. Simplified conceptual model in the study interval showing the impact of paleoclimate on paleosalinity fluctuations. (A) The freshwater environment corresponding to semi-arid and humid breaks; (B) Brackish water corresponding to arid climate.
6 Conclusion
The paleosalinity characteristics of the P1 Member in Baobab North Sag were investigated using multi-elemental geochemical methods. The results of our study optimised the most sensitive paleosalinity proxies and revealed the climatic transition from arid to humid that influenced paleosalinity fluctuations. The conclusions of this study are as follows.
(1) Sr/Ba ratios range from 0.32 to 0.93, with a mean value of 0.58, indicating a freshwater and brackish environment, while B/Ga ratios range from 1.6 to 3.4, with a mean value of 2.5, also represent the presence of both freshwater and brackish water types. The equivalent boron contents range from 84.3 ppm to 185 ppm, with the cast point being in the region of freshwater. In addition, salinity values based on Adams’ paleosalimeter range from 1.2‰ to 11.0‰, while those based on Couch’s paleosalimeter range from 6.1‰ to 9.3‰. Both methods of calculating quantitative paleosalinity values are indicative of a brackish water mass, precisely mesohaline water.
(2) The Sr/Ba ratio, B/Ga ratio, equivalent boron content, Adams’ paleosalimeter and Couch’s paleosalimeter can effectively differentiate between water masses with varying paleosalinities. The combined evaluation of evolutionary profiles and cross-plots of paleosalinity proxies revealed that the B/Ga ratio is the most significant proxy for distinguishing the water salinity types in the study interval. The results of the B/Ga ratio indicate that the presence of two main water salinity types: fresh water (mainly distributed in the P14 and P12 sub-members) and brackish water (mainly distributed in the P13 and P11 sub-members).
(3) Frequent fluctuations in paleosalinity from fresh to brackish water sensitively record humid and semi-arid to arid changes in the climate of terrestrial closed lake basins. The high salinity record in the study area corresponds to arid climatic conditions, while the low salinity freshwater responds to semi-arid to humid pulses, providing a useful reference for the reconstruction of paleosalinity in terrestrial closed lake basins during the Cretaceous global warming period.
Data availability statement
The original contributions presented in the study are included in the article/supplementary material, further inquiries can be directed to the corresponding author.
Author contributions
XL: Conceptualization, Writing–review and editing. KX: Conceptualization, Writing–original draft, Writing–review and editing. LS: Conceptualization, Data curation, Writing–original draft. SW: Supervision, Validation, Writing–review and editing. ZX: Validation, Writing–review and editing. SJ: Investigation, Writing–review and editing. YW: Writing–review and editing.
Funding
The author(s) declare that financial support was received for the research, authorship, and/or publication of this article. This research was supported by the National Natural Science Foundation of China (No. 42272110) and the Scientific Research and Technology Development Project of CNPC (NO. 2021DJ3203).
Acknowledgments
We are very grateful to Prof. Thomas J. Algeo from the University of Cincinnati for his guidance and assistance in the use of paleosalinity proxies. We also greatly appreciate the constructive comments provided by the reviewers, which have greatly improved the quality of this paper.
Conflict of interest
Authors XL, KX, and YW were employed by China National Oil and Gas Exploration and Development Company Ltd., CNPC. Authors XL and KX were employed by Research Institute of Petroleum Exploration and Development, CNPC.
The remaining authors declare that the research was conducted in the absence of any commercial or financial relationships that could be construed as a potential conflict of interest.
Publisher’s note
All claims expressed in this article are solely those of the authors and do not necessarily represent those of their affiliated organizations, or those of the publisher, the editors and the reviewers. Any product that may be evaluated in this article, or claim that may be made by its manufacturer, is not guaranteed or endorsed by the publisher.
References
Adams, T. D., Haynes, J. R., and Walker, C. T. (1965). Boron in holocene illites of the dovey estuary, wales, and its relationship to palaeosalinity in Cyclothems1. Sedimentology 4, 189–195. doi:10.1111/J.1365-3091.1965.Tb01288.X
Bathurst, R. G. (1972). “Carbonate sediments and their diagenesis”, in Developments in Sedimentology, Amsterdam: Elsevier 12.
Chamley, H. (1994). “Clay mineral diagenesis,” in Quantitative diagenesis: recent developments and applications to reservoir geology. Editors A. Parker, and B. W. Sellwood (Netherlands: Springer), 161–188.
Chang, X., Liu, X., Li, T., Xiong, Z., Duan, B., Huang, J., et al. (2024). Late Quaternary marine transgressions off the Shandong Peninsula inferred from paleosalinity indicators: implications for Holocene mud wedge formation. Chem. Geol. 658, 122117. doi:10.1016/j.chemgeo.2024.122117
Chen, L., Ji, H., Dou, L., Du, Y., Xu, Z., Zhang, L., et al. (2018). The characteristics of source rock and hydrocarbon charging time of precambrian granite reservoirs in the Bongor Basin. Chad. Mar. Pet. Geol. 97, 323–338. doi:10.1016/J.Marpetgeo.2018.06.003
Chen, Z. Y., Chen, Z. L., and Zhang, W. G. (1997). Quaternary stratigraphy and trace-element indices of the yangtze delta, eastern China, with special reference to marine transgressions. Quat. Res. 47 (2), 181–191. doi:10.1006/Qres.1996.1878
Cheng, D., Dou, L., Chen, Q., and Wang, W. (2022). Geochemical characteristics and origins of biodegraded oils in the Bongor Basin (Chad) and their implications for Petroleum exploration. Energy explor. Exploit. 40 (2), 682–700. doi:10.1177/01445987211069582
Cheng, D., Dou, L., Wang, J., Li, W., and Wen, Z. (2018). Geochemical characteristics and genesis of natural gas in the Bongor Basin. Earth Sci. Front. 25 (2), 112–120. doi:10.13745/j.esf.2018.02.012
Couch, E. L. (1971). Calculation of paleosalinities from boron and clay mineral data. AAPG Bull. 55, 1829–1837. doi:10.1306/819A3DAC-16C5-11D7-8645000102C1865D
Degens, E. T., Williams, E. G., and Keith, M. L. (1957). Environmental studies of carboniferous sediments. Part I: geochemical criteria for differentiating marine from fresh-water shales. AAPG Bull. 41 (11), 2427–2455. doi:10.1306/0BDA59A5-16BD-11D7-8645000102C1865D
Dou, L., Li, W., and Cheng, D. (2020). Hydrocarbon accumulation period and process in Baobab area of Bongor Basin. J. Afr. Earth Sci. 161, 103673. doi:10.1016/j.jafrearsci.2019.103673
Dou, L., Xiao, K., Hu, Y., Song, H., Cheng, D., and Du, Y. (2011). Petroleum geology and a model of hydrocarbon accumulations in the Bongor Basin, the republic of Chad. Acta Pet. Sin. 32 (3), 379–386. (In Chinese With English Abstract).
Genik, G. J. (1993). Petroleum geology of cretaceous-tertiary rift basins in Niger, Chad, and Central African Republic. AAPG Bull. 77 (8), 1405–1434. doi:10.1306/BDFF8EAC-1718-11D7-8645000102C1865D
Harder, H. (1970). Boron content of sediments as a tool in facies analysis. Sediment. Geol. 4 (1–2), 153–175. doi:10.1016/0037-0738(70)90009-6
Hu, Y., Hu, J., Du, Y., Lu, H., Yang, N., Wang, L., et al. (2023). Early cretaceous palynofloras from the Bongor Basin, Chad, and their palaeoenvironmental and palaeoclimatic significances. J. Afr. Earth Sci. 198, 104792. doi:10.1016/j.jafrearsci.2022.104792
Huber, B. T., Macleod, K. G., Watkins, D. K., and Coffin, M. F. (2018). The rise and fall of the cretaceous hot greenhouse climate. Glob. Planet. Change 167, 1–23. doi:10.1016/j.gloplacha.2018.04.004
Hudec, M. R., and Jackson, M. P. A. (2006). Advance of allochthonous salt sheets in passive margins and orogens. AAPG Bull. 90 (10), 1535–1564. doi:10.1306/05080605143
Jiang, F. J., Chen, D., Zhu, C. X., Ning, K. C., Ma, L., Xu, T. W., et al. (2022). Mechanisms for the anisotropic enrichment of organic matter in saline lake basin: a case study of the early eocene dongpu depression, eastern China. J. Pet. Sci. Eng. 210, 110035. doi:10.1016/J.PETROL.2021.110035
Li, W., Dou, L., Wen, Z., Zhang, G., and Cheng, D. (2017). Use of a geochemical method to analyze the hydrocarbon accumulation process in the Bongor Basin, Chad. Pet. Sci. Technol. 35, 2133–2138. doi:10.1080/10916466.2017.1386678
Potter, P. E., Shimp, N. F., and Witters, J. (1963). Trace elements in marine and fresh-water argillaceous sediments. Geochim. Cosmochim. Ac. 27, 669–694. doi:10.1016/0016-7037(63)90019-X
Price, P. B., and Walker, R. M. (1963). Fossil tracks of charged particles in mica and the age of minerals. J. Geophys. Res. 68 (16), 4847–4862. doi:10.1029/JZ068i016p04847
Qian, K., and Shi, H. (1982). The choice of the method of paleosalinity determination in resource evaluation. Pet. explor. Dev. 3, 32–38. (In Chinese With English Abstract).
Shimp, N. F., Witters, J., Potter, P. E., and Schleicher, J. A. (1969). Distinguishing marine and fresh-water muds. J. Geol. 77, 566–580. doi:10.1086/627454
Song, H., Wen, Z., and Bao, J. (2016). Influence of biodegradation on carbazole and benzocarbazole distributions in oils from the Bongor Basin, Chad. Chad. Org. Geochem. 100, 18–28. doi:10.1016/J.Orggeochem.2016.07.005
Sun, L., Wu, S., Yue, D., and Cui, W. F. (2024a). Paleosalinity reconstruction in offshore lacustrine basins based on elemental geochemistry: a case study of middle-upper eocene shahejie formation, zhanhua sag, bohai bay basin. J. Ocean. Limnol. 42, 1087–1105. doi:10.1007/s00343-023-3103-8
Sun, L., Wu, S., Yue, D., Jiang, S., Xiao, K., Li, X., et al. (2024b). Mineralogical and geochemical characteristics of mudstones from the Lower Cretaceous Prosopis Formation in the Bongor basin, Chad: implications for provenance, paleoenvironment and organic matter enrichment. Mar. Pet. Geol. 168, 107031. doi:10.1016/j.marpetgeo.2024.107031
Sun, L., Zhang, J., Li, Y., Yan, X., and Zhang, X. C. (2022a). Paleosalinity and lake level fluctuations of the 3rd member of Paleogene shahejie formation, chezhen sag, bohai bay basin. Front. Earth Sci-Prc. 16 (4), 949–962. doi:10.1007/S11707-022-0979-0
Sun, L., Zhang, J. L., Zhang, T. Y., Yan, X., Chen, T., and Liu, J. S. (2022b). Paleosalinity reconstruction for the paleocene sequence of lishui sag in the east China sea shelf basin. Arab. J. Sci. Eng. 47, 7433–7448. doi:10.1007/S13369-022-06696-7
Tan, M., Zhu, X., Geng, M., Zhu, S., and Liu, W. (2017). The occurrence and transformation of lacustrine sediment gravity flow related to depositional variation and paleoclimate in the lower cretaceous Prosopis Formation of the Bongor Basin, Chad. J. Afr. Earth Sci. 134, 134–148. doi:10.1016/J.Jafrearsci.2017.06.003
Walker, C. T. (1968). Evaluation of boron as a paleosalinity indicator and its application to offshore prospects. AAPG Bull. 52, 751–766. doi:10.1306/5D25C45D-16C1-11D7-8645000102C1865D
Walker, C. T., and Price, N. B. (1963). Departure curves for computing paleosalinity from boron in illites and shale. AAPG Bull. 47 (5), 833–841. doi:10.1306/BC743A93-16BE-11D7-8645000102C1865D
Wang, Y., Guo, W., and Zhang, G. (1979). Application of some geochemical indicators in determining of sedimentary environment of the funing group (Paleogene), jinhu depression, jiangsu province. J. Tongji Univ. 2, 51–60. (In Chinese With English Abstract).
Wang, Y., Xu, G., Zhou, W., Liang, J., Xu, F., and He, S. (2022). Predicting granitic buried-hill reservoirs using seismic reflection data—a case study from the Bongor Basin, southwestern Chad. Front. Earth Sci. 10, 949660. doi:10.3389/Feart.2022.949660
Wei, W., and Algeo, T. J. (2020). Elemental proxies for paleosalinity analysis of ancient shales and mudrocks. Geochim. Cosmochim. Ac. 287, 341–366. doi:10.1016/J.Gca.2019.06.034
Wei, W., Algeo, T. J., Lu, Y. B., Lu, Y. C., Liu, H. M., Zhang, S. P., et al. (2018). Identifying marine incursions into the Paleogene bohai bay basin lake system in northeastern China. Int. J. Coal. Geol. 200, 1–17. doi:10.1016/J.Coal.2018.10.001
Wei, W., Algeo, T. J., Lu, Y. C., Liu, H. M., Zhang, S. P., Zhang, J. Y., et al. (2021). Paleosalinity proxies and marine incursions into the paleogene Bohai Bay Basin Lake System, Northeastern China. Acta. Sedimentologica. Sinica. 39 (3), 571–592. doi:10.14027/j.issn.1000-0550.2021.004
Wei, W., Yu, W., Algeo, T. J., Herrmann, A. D., Zhou, L., Liu, J., et al. (2022). Boron proxies record paleosalinity variation in the North American Midcontinent Sea in response to Carboniferous glacio-eustasy. Geology 50 (5), 537–541. doi:10.1130/G49521.1
Yang, X., Ji, H., Dou, L., Du, Y., Jia, H., Chen, L., et al. (2020). Tectono-sedimentary characteristics in the area with distributed normal faults: lower cretaceous Prosopis Formation in the northern Slope of Bongor Basin, Chad. J. Pet. Sci. Eng. 190, 107081. doi:10.1016/J.Petrol.2020.107081
Ye, C. C., Yang, Y. B., Fang, X. M., and Zhang, W. L. (2016). Late eocene clay boron-derived paleosalinity in the qaidam Basin and its implications for regional tectonics and climate. Sediment. Geol. 346, 49–59. doi:10.1016/J.Sedgeo.2016.10.006
Keywords: paleosalinity, paleoclimate, paleosalinity proxy, Baobab North Sag, prosopis formation
Citation: Li X, Xiao K, Sun L, Wu S, Xu Z, Jiang S and Wu Y (2024) Paleosalinity characteristics of the 1st member in the lower cretaceous prosopis formation, Baobab North Sag, Bongor Basin. Front. Earth Sci. 12:1450001. doi: 10.3389/feart.2024.1450001
Received: 16 June 2024; Accepted: 04 September 2024;
Published: 26 September 2024.
Edited by:
Vlad Constantin Manea, National Autonomous University of Mexico, MexicoReviewed by:
Xiting Liu, Ocean University of China, ChinaJiaqi Yang, SINOPEC Petroleum Exploration and Production Research Institute, China
Copyright © 2024 Li, Xiao, Sun, Wu, Xu, Jiang and Wu. This is an open-access article distributed under the terms of the Creative Commons Attribution License (CC BY). The use, distribution or reproduction in other forums is permitted, provided the original author(s) and the copyright owner(s) are credited and that the original publication in this journal is cited, in accordance with accepted academic practice. No use, distribution or reproduction is permitted which does not comply with these terms.
*Correspondence: Kang Xiao, eGlhb2thbmc4NzAyMjRAcGV0cm9jaGluYS5jb20uY24=
 Xianbing Li1,2
 Kang Xiao
 Zhenhua Xu