- 1School of Geography, Liaoning Normal University, Dalian, Liaoning, China
- 2Center for Human Settlements, Liaoning Normal University, Dalian, Liaoning, China
- 3Research Base of Urban Agglomeration in Central-South Liaoning of China Urban Agglomeration Research Base Alliance, Liaoning Normal University, Dalian, China
- 4University Collaborative Innovation Center of Marine Economy High-quality Development of Liaoning Province, Dalian, Liaoning, China
Pseudo human settlements in the information age is an important part of human settlements geography, which has a comprehensive and profound impact on urban production, life and ecology in China and even the world, but the existing research on pseudo human settlements is still unclear, and cannot meet the requirements of China’s “digital-realistic fusion”, “network power” and the construction of a beautiful China. Therefore, this paper starts from the perspective of pseudo, based on the theory of the coupling system of human settlements, and applies the entropy weight method, coupling coordination model, geodetector and other methods and spatial technologies to deeply analyze the spatial and temporal evolution of the pseudo human settlements and the driving mechanism of the 14 cities in Liaoning Province from 2011 to 2020. The results show that: 1) Liaoning Province’s pseudo human settlements in the time evolution of the overall quality of the main theme of the rise, with the “Internet festival” node effect and significant stage. 2) The spatial distribution is characterized by the geographical layout of “1″-type high-quality development centers and concentric-circle spatial distribution; and the trend surface shows a low uniformity pattern of “high in the south-central part and low in the surrounding area”. 3) The degree of system coupling and the degree of coupling coordination both show a fluctuating upward trend, with the spatial heterogeneity characteristic of “high in the central part and low in the surrounding area”. 4) Tool system has become the emerging driving force, communication and social chat has become the basic driving force, and life service is the invisible driving force; communication class and community class are the important leading driving factors. The study aims to enrich the research system of human settlements, promote the development of the discipline of human settlements geography, provide a new basis for the construction of human settlements in the new era, and respond to the demand for decision-making in the strategy of network power.
1 Introduction
Since the 21st century, the Internet (Wehner et al., 2018), big data (Pržulj and Malod-Dognin, 2016), artificial intelligence (Noy and Zhang, 2023) and other continuous development to promote the Chinese and even the world’s cities in the digital economy, green development, smart city (Ramaswami et al., 2016), beautiful human settlements and other aspects of the construction of the city to accelerate the pace of transition to modern cities. At the same time has penetrated into all aspects of urban production, life, ecology, subconsciously changing people’s cognition of time, space, people, forms, patterns and other urban geographic phenomena and things (Weigle et al., 2024). On the spatial scale, the Internet has broadened the scope of people’s activities from real locations to the network world constructed by big data (Musial and Kazienko, 2013), so that human activities are not only limited to the specific field. On the time scale, the instantaneous and dynamic characteristics of the Internet also make the time series of pseudo human settlements (PHS) more refined, diversified, and visualized (Feng, 2019). In terms of content, the Internet drives the modernization of people’s lifestyles, with major changes constantly occurring in shopping, leisure and entertainment, socialization, and travel. Therefore, from the perspective of urban reality alone, it is no longer possible to comprehensively explain the “time”, “space” and “people” of the human settlements (HS), their interrelationships and internal mechanisms, and it is even more impossible to meet the needs of the construction of the “new human-land relationship” in the context of big data.
China’s development is currently at an important strategic opportunity period, the application of Internet construction and management is constantly improving, and the scale of the PHS is expanding at an accelerated pace. However, to achieve the socialist modernization goal of significantly narrowing the gap between urban and rural regional development and the gap between residents’ living standards, to meet people’s demand for a better “three-state” human settlements (reality human settlements, pseudo human settlements, imagery human settlements) life in the Internet era (Tian et al., 2021c), to balance the scale of development of the pseudo settlements among cities, and to build a “Community with a Shared Future in Cyberspace” (Qiu et al., 2021) which is in line with the world’s Internet development trend and the direction of human social development, it is necessary to discuss the internal mechanism of the “three-state” human settlements, especially the PHS.
HS is a gathering space for human survival and development, carrying an important place for production, life and other functions (Zhao et al., 2023). At the end of the 19th century and the beginning of the 20th century, Howard’s idyllic city, that the area of human settlements should be both urban and idyllic characteristics. Geddes proposed urban planning, arguing that the natural environment is the basis of urban planning. Mumford put forward the regional view and the natural view. With the continuous development of cities, research on urban planning, urban space (Valjarević et al., 2021), environmental types (Gao et al., 2016) and other studies have become increasingly rich, laying the foundation for the study of human settlements. In the 1950s, the Greek scholar Doxiadis put forward the “human settlement”, which takes human settlements as the core object of research and includes two major factors, namely, human beings and the environment. In the 1990s, Wu Liangyong put forward the concept of “ science of human settlement ”, which promoted the research and development of China’s HS. Human settlements science is a human settlement as the object of study, focusing on exploring the interrelationship between people and the environment science (Wu, 2001). As an open disciplinary system, it has attracted the attention of many scholars. In terms of spatiotemporal evolution and mechanism research, it mainly focuses on the assessment of the scale of HS (Halik et al., 2013; Li and Tian, 2015; Tian et al., 2021b), the study of the content of multi-perspective HS (Cong et al., 2021; Song et al., 2021; Wang et al., 2021), the study of HS evaluation methods (Xiong et al., 2007; Hu and Wang, 2020; Oliveira et al., 2020), the study of the relationship between nature and HS (Diaz, 2004; Nigst et al., 2014), the study of the relationship between human activities and HS (Coway-Gómez, 2007; Bradlow et al., 2011; Reinmann et al., 2016), and the construction of HS index system (Zhang and Wei, 2006; Fang et al., 2020; Zhang and Li, 2021). Current studies reflect the dynamic coordination, balance, and communication relationship between humans as social subjects and the environment.
The term “pseudo environment” was first proposed by Lippmann, which refers to the environment suggested to people through selective processing of information by mass communication media modeled on the real world (Lippmann, 1922). PHS is a kind of information environment constructed by people with the reality human settlements (RHS) as the base plate, based on their own judgment and preference, with the help of media such as cell phone clients, network ports, etc., using the big data generated by daily network activities as the basis and using the symbol system (Tian et al., 2024). It can be considered that PHS is the evolution of pseudo environment to HS (information environment to human settlements), and the extension of human settlements to pseudo environment (reality to virtual extension).
With the booming development of the Internet, on the basis of a large number of existing research on the RHS, the relevant research on the PHS has also achieved certain results, and its existing research mainly focuses on: 1) the relationship between network space and real space: interaction relationship research (Zhu et al., 2020), spatial behavior research methods (Carneiro et al., 2019), and spatial pattern research (Liu and Shi, 2016); 2) the relationship between network and real settlements: social relationship research (Xi et al., 2021), comparative studies (Lu et al., 2008), spatio-temporal behavior studies (Rout et al., 2021), visualization studies (Romano et al., 2019), theoretical studies (Zhen et al., 2012); 3) the relationship between PHS and RHS: spatial heterogeneity studies (Xue et al., 2021), transformation studies (Shah et al., 2019), interactions (Lila and Anjaneyulu, 2017); 4) the relationship between the virtual city and real city: simulation models (Lee et al., 2008), theoretical studies (Liu et al., 2008), practical approaches studies (Tian et al., 2022). Previous studies on HS mostly focused on the RHS and tended to make empirical analyses from multi-disciplinary fields, multi-geographical scales, and multi-analysis methods. The research on PHS mostly starts from the perspectives of psychology, media science, and social science, while research on PHS from the geographical level and measured from the perspective of spatio-temporal coupling is relatively poor, especially in the study of spatio-temporal differentiation characteristics, system coupling and coordination, and internal driving mechanisms.
The relationship between the PHS and the RHS makes the two closely integrated in the theoretical system. The development of interdisciplinary subjects provides the theoretical basis and reference for the model, motivation, and index of the spatio-temporal dimension of PHS. The theoretical framework of PHS is fused and includes 1) The paradigm of human settlement science formed based on the human settlement studies of Dosadias and the human settlement environment science of Wu Liangyon; 2) the theoretical basis of the coupling and coordination of the “three-state” human settlements, including reality, pseudo, and imagery human settlements; 3) and metaverse, cyberspace and other interdisciplinary achievements of the theoretical reference (Robison and Crenshaw, 2002).
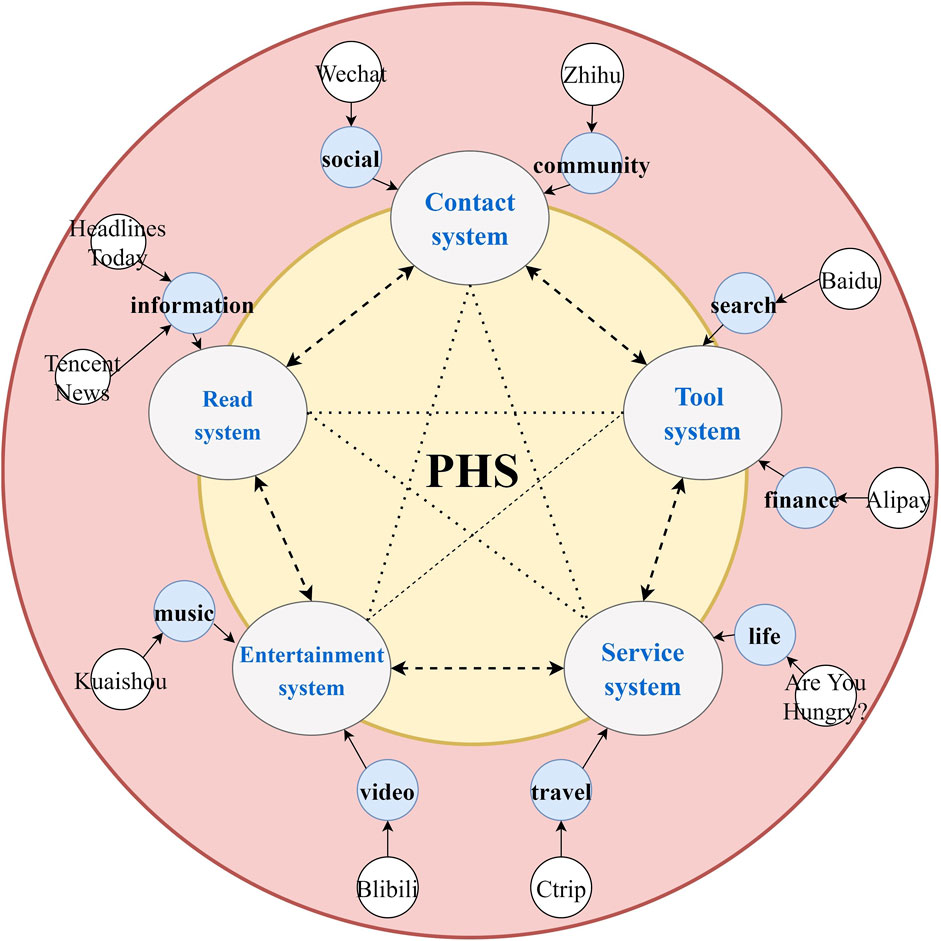
Based on the above theory, and in accordance with the principles of integrity, hierarchy, operability, and scientific construction of the index system, the conceptual expression of the spatio-temporal evolution of the PHS is proposed: It is considered that the PHS is a function of five systems, namely, contact (C), read (R), entertainment (E), service (S), and tool (T), changing with time (t) in a specific cyberspace scale (s).
This paper selects the Internet dynamic data of 14 cities in Liaoning Province from 2011 to 2020, portrays the spatial and temporal change characteristics of the PHS with the help of entropy weighting method, uses the coupling coordination model to study the coupling coordination of various subsystems, and analyzes the trade-off driving factors and the internal action mechanism through geodetectors. The study can promote the coordinated development of scale expansion and quality growth of pseudo-environment among regions and will have theoretical and practical significance for the governance of the world network system and the quality development of the settlements. This is the initial year of China’s “14th Five-Year Plan” and the approval of the “14th Five-Year Plan” for the comprehensive revitalization of Northeast China. The results also have applicability significance for promoting the full development and balance of HS in Northeast China represented by Liaoning. It is of practical significance to actively implement the “Internet plus” strategy, and the results are expected to provide a new perspective for the development theory of urban PHS, so as to better serve the relevant optimization and regulation decisions of the “14th Five Year Plan”.
2 Materials and methods
2.1 Data sources
Baidu has the largest number of Chinese search engine users in the world. The Baidu Index open-source data (http://index.baidu.com), which can significantly reflect the online search scale and frequency of Baidu netizens, is used as the data source. Taking the time series from 1 January 2011, to 31 December 2020, and taking 14 cities in Liaoning Province as the survey area, the daily survey of 37 indicators including WeChat, Today’s Headlines, and Tencent News. Basic data were collected, and a total of 1,891,736 items of data were acquired for 3,652 days.
It is worth noting that the larger the Baidu Index, the higher the user group pays attention to things in the region’s spatio-temporal conditions. The map data comes from the Resource and Environmental Science and Data Center of the Chinese Academy of Sciences (https://www.resdc.cn/).
2.2 Index system
The PHS evaluation index system is an important mechanism to measure the quality, development status, and development trend of the HS in a region. When selecting indicators and data, the following five principles of indicator system design need to be grasped: 1) the principle of integrity; 2) the principle of hierarchy; 3) the principle of operability; 4) the principle of scientificity; 5) the principle of objectivity and reality.
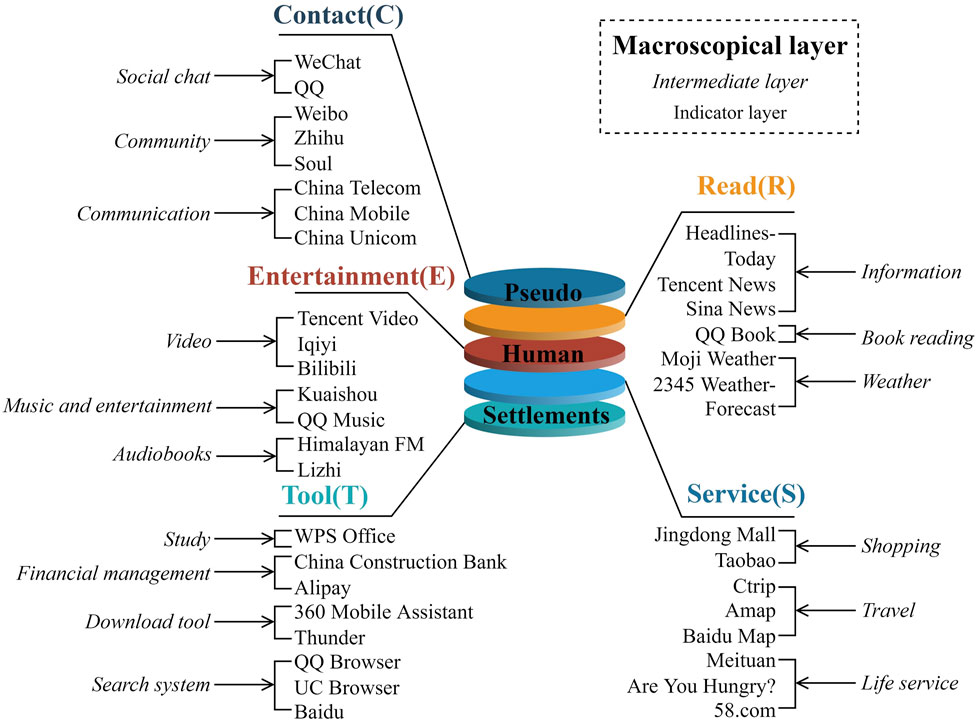
This paper designs a set of PHS indicator system based on the similarity of the attributes of PHS and HS indicators with reference to the research results on HS and PHS (Ying, 2011; Wang and Xu, 2017). The system mainly includes five macro layers, which are contact, read, entertainment, service, and tool system. Because the contents contained in each macro-layer are still relatively rich, the division of intermediate layers is carried out in order to make it more clear and concise. Under the principles of scientificity, typicality and representability, with reference to the relevant literature (Pei et al., 2019; Tian et al., 2021a; Yang et al., 2023) and combined with the actual situation of Internet use in Liaoning Province, each macro-layer is subdivided into 16 intermediate-layer indicators, such as chatting category, news category, video category, and so on. At the same time, each intermediate layer also includes 37 indicators such as WeChat, Headlines Today, and Tencent video (Figure 1).
2.3 Methods
(1) Entropy weight method. Entropy is initially derived from the thermodynamic concept in physics, mainly reflecting the degree of chaos in the system, which is now widely used in social and economic fields (Fang and Wei, 2001; Yuan and Qi, 2013). Entropy weighting method is an objective assignment method, which can evaluate the weights of indicators in a complex matrix system based on objective data, effectively avoiding the limitations of subjective assignment method (Wang et al., 2013; Shun and Chen, 2019). The specific calculation process is shown in Equations 1–4:
Where:
(2) Spatial trend surface. Spatial trend surface is a tool used to model the spatial distribution and evolutionary trend of geographic elements. Trend surface analysis can not only reveal the spatial distribution of change of continuously distributed phenomena on a surface area, but is also one of the main methods for describing spatial trends (Zhang and Gong, 2013). Assuming that
Where:
(3) Coupling coordination model. The coupling coordination model initially originated in physics, refers to the interaction and influence between circuit elements or electrical networks, through continuous development, the scope of application has been very wide, commonly used in the study of two or more systems interacting with each other, as well as evaluating the coordinated development of the process between each system (He et al., 2024).
a. Coupling degree. By applying the capacity coupling coefficient model and comprehensive evaluation index to the five systems of PHS, the Coupling degree model of each system interaction is obtained, The specific calculation process is shown in Equation 6:
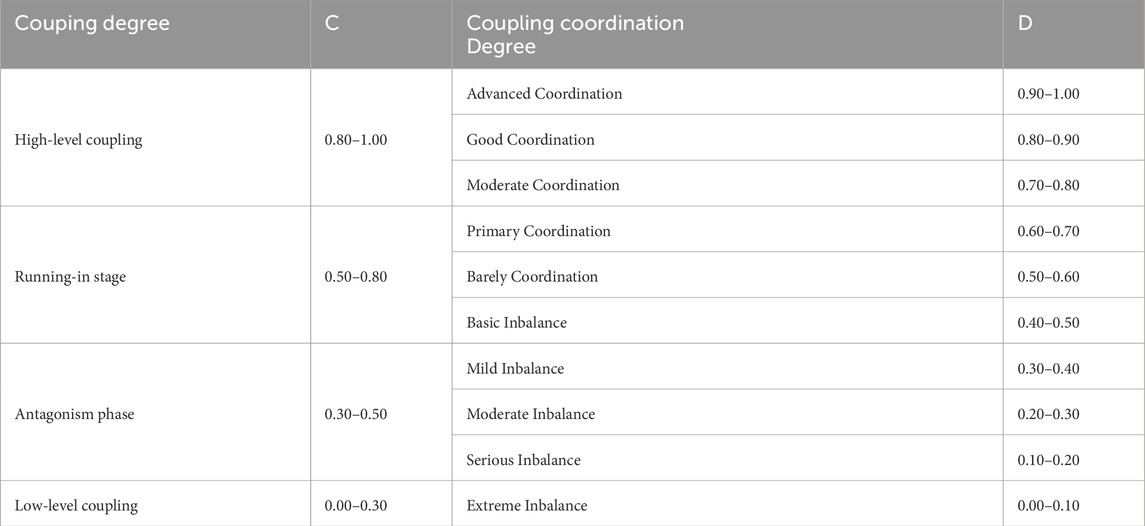
Where: C is the coupling degree, and the range is [0,1]. When C=0, it indicates that the five major systems or their internal elements are in an unrelated state, and the PHS will develop in a disorderly direction. When C=1, it indicates that the subsystems are well coupling and tend to a newly ordered structure. According to the median segmentation method, the coupling degree types are divided (Table 1).
b. Coupling coordination degree. The coupling coordination degree is to measure the similarity of system elements, which reflects the coordination degree of mutual coupling of various systems. The specific calculation process is shown in Equation 7:
Where: D is the coupling coordination degree; T is the comprehensive coordination index, and α, β, γ, δ, and μ are undetermined coefficients. In this paper, the five systems are given the same weight of 0.2. And the median segmentation method is used to obtain the classification standard of coupling coordination types.
(4) Geodetector. Geodetector is a statistical method based on the theory of spatial dissimilarity to explore spatial dissimilarity and reveal the driving factors, which is mainly categorized into four detectors, namely, factor detection, interaction detection, risk detection, and ecological detection (Qin et al., 2023; Qi et al., 2024). In this paper, we apply the factor detection tool to quantitatively investigate the extent to which each driver explains the quality of urban PHS. The specific calculation process is as shown in Equation 8.
Where: the value range of q is [0, 1], the larger the value of q, the stronger the explanatory power of driving factor X to PHS quality Y, and the weaker it is otherwise; q=1 indicates that the driving factor fully controls the spatial distribution of PHS quality Y, q=0 indicates that there is no relationship between them, a q-value means that X explains Y to a q-fold extent.
3 Results
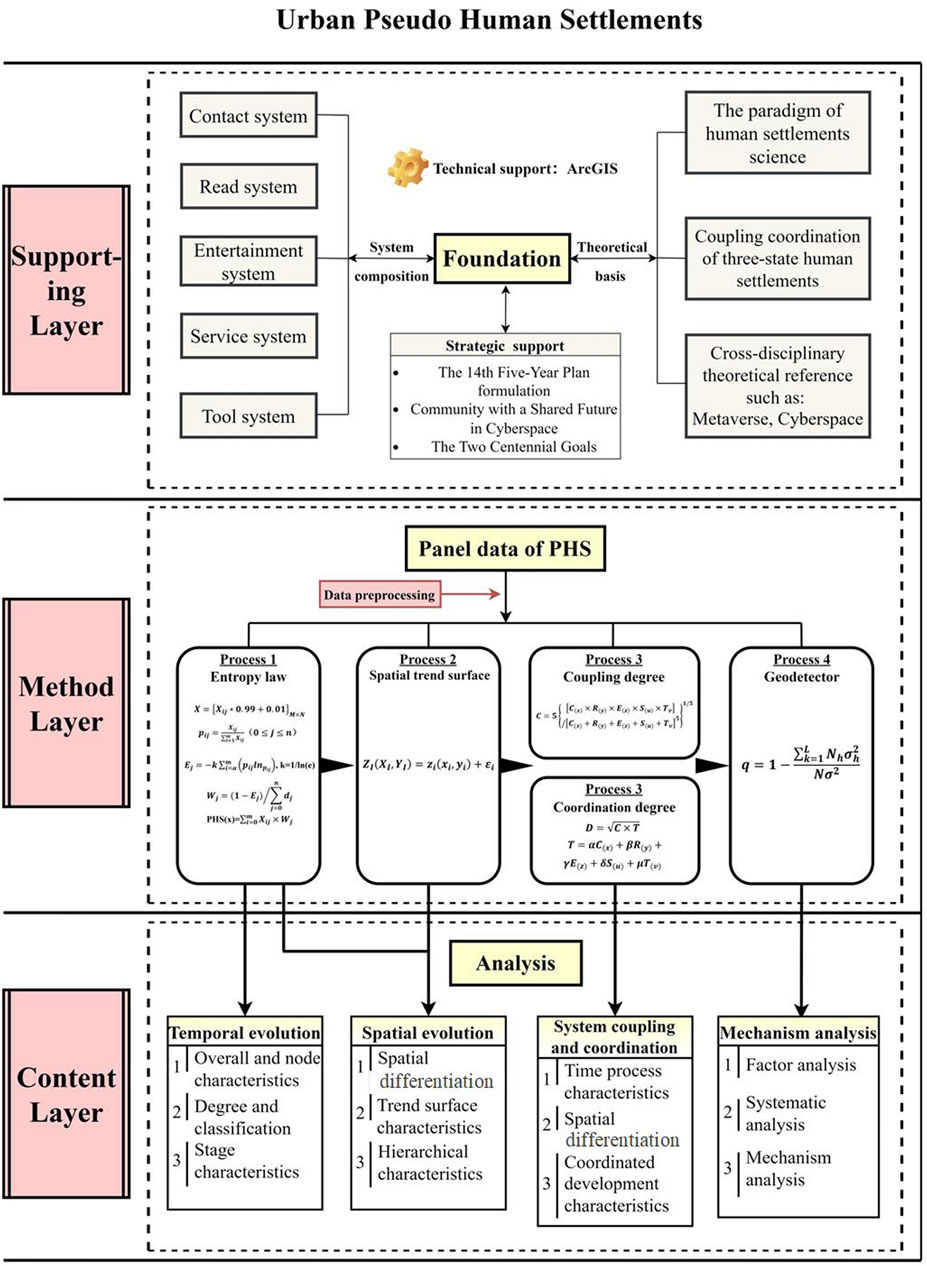
Taking the coupling and coordination of urban “three states” human settlements as the theoretical support, and based on the data obtained from the quality score of the PHS, a normative analysis of the PHS is carried out to provide a new basis for grasping the planning, construction, transformation and comprehensive development of the PHS of the city. The research framework is detailed in Figure 2.
3.1 The features of temporal process evolution
3.1.1 Overall and node characteristics
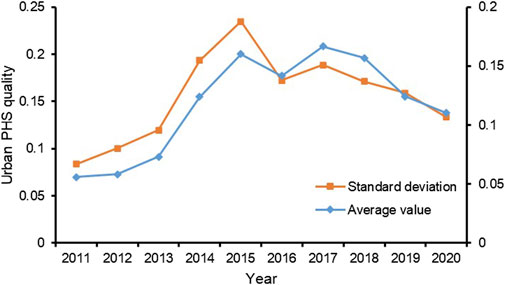
(1) The overall trend: the rise and drop nodes of the PHS with the reference of the long-term series, found that the quality of the PHS fluctuated and increased in the past 10 years (Figure 3). The average value of 0.05580 in 2011 rose to 0.11039 in 2020 after two significant fluctuations in 2015–2017. The two consecutive rose and fell during the period produced two similar peak values, which were 0.16011 in 2015 and 0.16684 in 2017 respectively. Individual years showed alternating development and contraction, and each city experienced at least one fluctuation, and individual cities such as Shenyang, Dalian, Fuxin, Liaoyang, and Panjin experienced two fluctuations. By comparison, it is found that the contraction years are mostly concentrated in 2015 and 2017, which is also the peak stage of the development of PHS, so it is judged that this period is an important node of the change of PHS.
(2) The node characteristics: using individual years as the reference for the growth and decline of the PHS, it is found that the PHS has an “Internet holiday” node effect. The PHS gave rise to the Internet festival and showed an upward trend in the period before and during this node, which was the peak of the development of the PHS every year. In the period after the special festival, there is a significant decline in the temporal characteristics of the PHS. This phenomenon is mostly manifested in e-commerce festivals with special meanings given by merchants, such as “6.18″, “11.11″, “12.12″, etc., which increase the usage and browsing volume of shopping apps such as Taobao, Jingdong and Pinduoduo. These time nodes increase the usage and browsing volume of shopping apps such as Taobao, Jingdong and Pinduoduo. May Day holiday, 11th National Day week, double holidays and other rest days, people’s leisure time increases on tourism, travel, shopping and other activities will increase the amount of attention, people will query in the jittery voice, small red book, etc., travel and card places, the use of gaode map, etc., planning routes, in the tuan, hungry mou, and other platforms to choose the food, the use of wechat, alipay, etc. Payment. There is an obvious regularity in the impact of a series of activities carried out by people at such time nodes on the PHS, i.e., the PHS before and after the time nodes will be characterized by rising and falling. This phenomenon is a unique rise and fall node effect of the PHS in the context of the Internet.
3.1.2 Degree and classification characteristics
The degree of deviation of the PHS of 14 cities in Liaoning Province from 2011 to 2020 shows a gradient characteristic consistent with the average value: 1) The first gradient: from 2011 to 2015, the standard deviation of PHS fluctuated and increased, which was the stage with the largest change in the overall standard deviation. The standard deviation jumped from 0.08373 to 0.23484, and there was a maximum point in the interval, which was also the maximum point in 10 years, which reflected that there was a big gap among 14 cities in Liaoning Province at that stage. 2) The second gradient: from 2015 to 2016, the standard deviation line of the PHS in 14 cities began to decline and decreased from 0.23484 to 0.17238, which was also the node where the overall standard eviation decreased for the first time. It reflected that the gap between the 14 cities in Liaoning Province began to narrow during this period. 3) The third gradient: from 2016 to 2017, the standard deviation of PHS in Liaoning Province rose gently, from 0.17238 to 0.18875, and the maximum point appeared in the interval, which reflected that the gap of PHS in 14 cities gradually increased, but the growth rate was slow. 4) The fourth gradient: from 2017 to 2020, the standard deviation of PHS decreased gently, from 0.18875 to 0.13338, and the change value was low, which showed that the gap of PHS in 14 cities gradually narrowed during this period.
Considering the annual variation of the deviation degree among cities, it is found that the PHS is inconsistent in development among different regions, and there are gaps between regions at different levels. Combined with the scores of PHS in various cities over the years, it can be found that the PHS presents a clear hierarchy and can be divided into three types (Table 2): 1) In the core area, the PHS scores fluctuate within the range of 0.4–0.6 (Shenyang, Dalian); 2) In the sub-core area, the PHS scores fluctuate within the range of 0.06–0.4 (Anshan, Jinzhou, Fushun); 3) In the developing area, the PHS scores fluctuate within the range of 0.04–0.06 (Yingkou, Huludao and other 9 cities).
3.1.3 Stage characteristics
The average value of the PHS quality shows a gradient characteristic from 2011 to 2020, which is manifested in the following four stages: 1) 2011–2015 was the first gradient stage. The quality of the PHS increased from 0.05580 in 2011 to 0.16011 in 2015. The broken line showed a steady increase, and the PHS index developed steadily, with a significant rate increase during the period. 2) 2015–2016 was the second gradient stage. The quality of the PHS dropped from 0.16011 in 2015 to 0.14164 in 2016. The broken line began to decline, and the PHS index contracted for the first time, with the first peak appearing in the interval. 3) 2016–2017 was the third gradient stage. The quality of the PHS rose from 0.14164 in 2016 to 0.16684 in 2017. The broken line showed a rise again, and the PHS index began to develop for the second time, with extremely low points in the interval. 4) 2017–2020 was the fourth gradient stage, in which the PHS continuously decreased from 0.16684 in 2017 to 0.11039 in 2020, and the broken line showed a continuous decline, and the PHS index shrunk at a lower level, with the second peak in the interval.
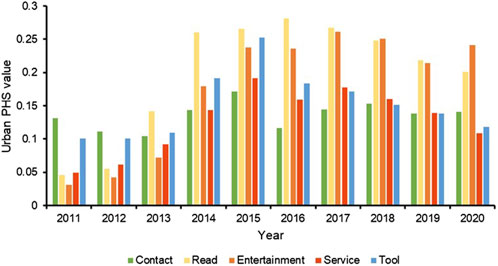
Analysis of the generation mechanism: (1) The continuous improvement in the quality of the PHS from 2011 to 2015 is the result of the interaction within the five major systems (Figure 4). Although the five major systems developed to different degrees during the 10-year period, they all showed an upward trend, thus causing the PHS to show an upward trend. During this period, the significant change in the rising rate of read, entertainment, and tool systems in 2013 was the reason for the accelerated development rate of the PHS in that year. 2) From 2015 to 2016, the PHS of Liaoning Province showed a downward trend for the first time. The contact, entertainment, service, and tool systems began to decline, with the highest point and inflection point in the overall trend. Although the read system showed an uptick, it did not interfere strongly with the general trend, so the PHS still showed a downtrend. 3) From 2016 to 2017, the PHS experienced a second rise. The reason was that compared with the decline of the read system and tool system, the development of contact, entertainment, and service systems were stronger. 4) From 2017 to 2020, the PHS experienced a second decline. The reason was that among the five major systems, read and service systems continued to decline, while the contact, entertainment, and tool systems declined after one fluctuation. Although the PHS has stages and deviations in individual time periods also with isolated contraction points, the progress of it is still the main theme.
The influence of the above five major systems on the overall trend side reflects the fact that netizens’ network activities generate different trends and tendencies under different conditions of time, space, and economic levels. Through a cross-sectional comparison of time in different years, with reference to the total value of GDP and the extent of Internet infrastructure construction in 14 cities in Liaoning Province in that year, it was found that the PHS was closely related to economic conditions and the level of Internet interaction, and had a significant indicative effect on the local economic condition: When the residents are at a lower income level, the demand of Internet users for PHS mainly focuses on contact, read while the demand for entertainment, service and tool systems is less, especially for shopping and travel under the indicators of service system. However, after the residents’ income has increased significantly, the network demands of netizens have shown a trend of diversification. The PHS has transformed from the leisure and entertainment-oriented type in the early stage to the life service type and entertainment-diverse type, which reflects the dynamic changes of the five systematic trends of PHS of netizens with the proportion of economic levels.
3.2 Evolution of spatial distribution
3.2.1 Characteristics of spatial differentiation
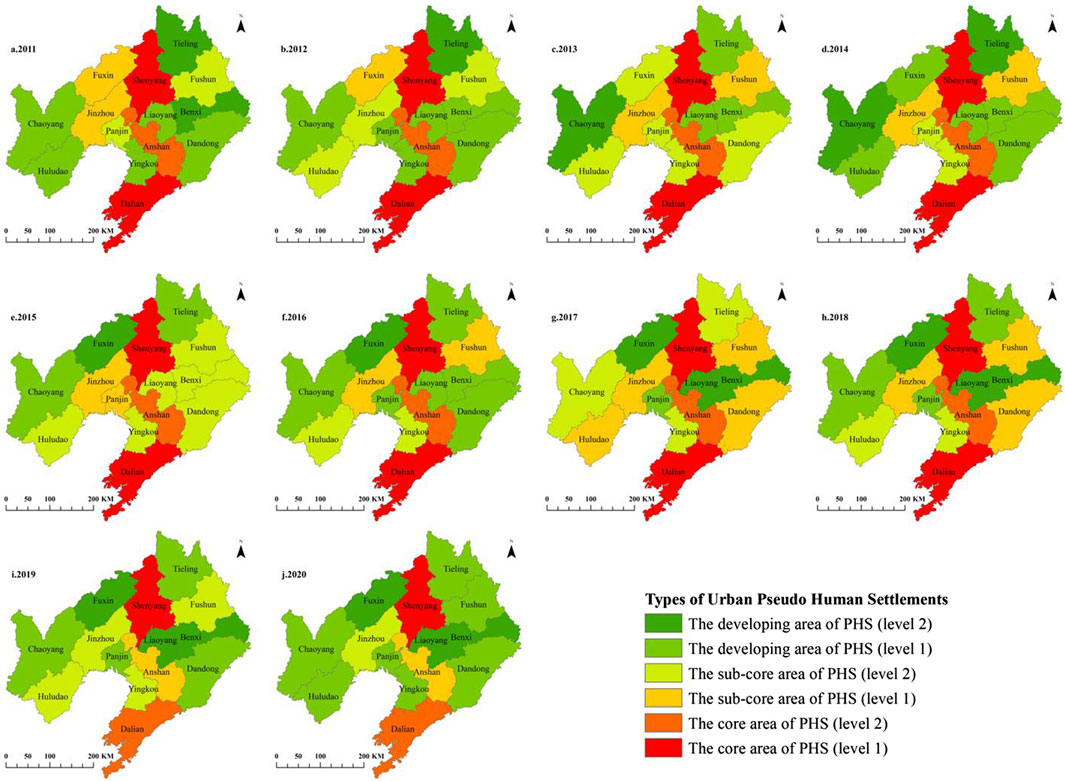
In order to distinguish the spatial differences of the PHS in 14 cities of Liaoning Province from 2011 to 2020, and ensure the balance between the change of median value and extreme value, ArcGIS geographic information technology was adopted, and the geometric separation method was used to optimize the category scope and generate the geographic distribution map of pseudo human settlements. In addition, in order to make the differences between areas with similar scores obvious on the geographical map, the extreme values are divided into six ranges and labelled with different colors, and the final results are shown in Figure 5.
(1) Spatial pattern characteristics of regional differentiation. During the past 10 years, the PHS in 14 cities of Liaoning Province showed obvious regional differentiation characteristics in the process of dynamic change. The quality of PHS in central and southern Liaoning, represented by Shenyang and Dalian, has maintained a high level of development and is in a leading position. Jinzhou to the west of Shenyang, Fushun to the east of Shenyang, Anshan to the south of Shenyang, and to the north of Dalian are at a relatively high level. The PHS in the other nine cities fluctuates with different frequencies over the years.
Specifically, in 2011, the PHS showed that Shenyang was the center to drive the surrounding Fuxin, Jinzhou, and Fushun to high-quality development. This area, together with Anshan and Dalian, formed the “T”-shaped Liaoning Province PHS Development Center. At the same time, the central and southern Liaoning areas are in a stepped divergence state with central Liaoning at the top, showing the first-level ladder represented by Shenyang, Anshan, and Dalian; the second-level ladder represented by Fuxin, Jinzhou, and Panjin; and Chaoyang, Huludao is represented by a three-level ladder. In that year, the quality of PHS in Eastern Liaoning, represented by Tieling, Benxi, and Dandong, was weak; From 2012 to 2014, the driving effect of central Liaoning on the northern Liaoning region was obvious; In 2015, the competitiveness of the PHS in Northwest Liaoning, represented by Fuxin, fluctuated and declined, while the development of the PHS in south and central Liaoning maintained its leading position. East Liaoning, represented by Fushun, Benxi, and Dandong, made significant progress, but still has a gap with the middle Liaoning region; In 2016, the PHS in southwestern Liaoning fluctuated significantly, and the regional advantages decreased. In terms of geographical distribution, the “T”-shaped PHS development center of Liaoning Province, centered on Shenyang, Dalian, and Anshan, coexisted with Huludao and Fushun; From 2017 to 2019, the PHS in southeastern Liaoning developed again from 2017 to 2019 after a short trough; In 2020, the fluctuation in south Liaodong decreases and the PHS resumes the “T” core development trend. Except for the central Liaoning region, the development of the PHS in other regions has a trend of moving from the north to the middle and then to the south.
Analysis of the generation mechanism: Shenyang and Dalian, as the leading provincial capital cities in Liaoning Province, have significant advantages in terms of the population, the number of Internet users, the degree of construction of big data, and the degree of Internet penetration, so the quality of the PHS is more superior and has a more advantageous degree of development than other cities in Liaoning Province. In the western region of Liaoning represented by Chaoyang and Huludao and the eastern region of Liaoning represented by Benxi City, the PHS is developing slowly due to the relatively backward economic level, weak Internet popularity, and other factors. Anshan City is under the influence of Shenyang and Dalian, and has great potential for the development of the PHS.
(2) The characteristics of hill-shaped dominant spatial patterns. The PHS in Liaoning Province has been in dynamic changes in the past 10 years, but the overall structure shows a structure that is dominated by Shenyang, Anshan, and Dalian, and diverges in all directions. Geographical distribution presents a hill-shaped feature, which is the spatial structure of the central area decreases in a step-like manner toward the east and west. During this period, although the lower value areas in the west, represented by Chaoyang and Huludao, the high value areas in the center, represented by Shenyang, Anshan and Dalian, and the lower value areas in the east, represented by Tieling, Fushun, Benxi and Dandong, declined to varying degrees on the time scale, the overall PHS quality landscape remains relatively stable.
3.2.2 Trend surface characteristics
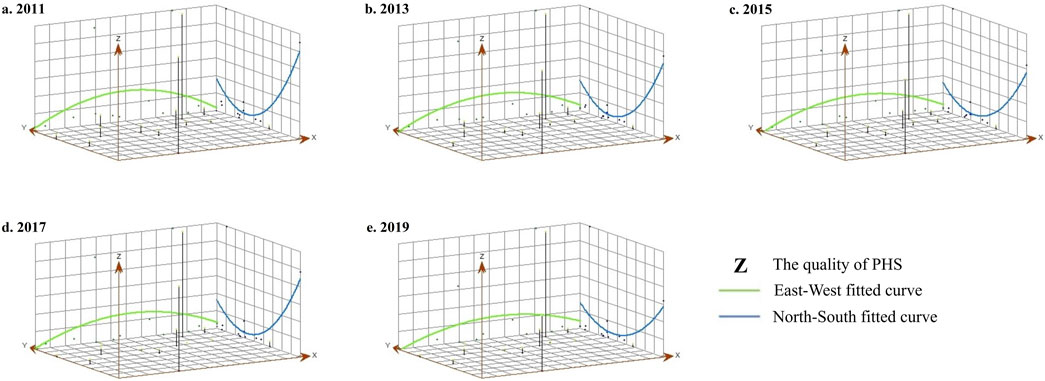
Based on the trend surface analysis in the ArcGIS geostatistical analysis method, the mathematical surface is used to simulate the spatial distribution and variation trend of the PHS quality, and the results are shown in Figure 6. In which, the positive direction of the X-axis indicates the true east direction, the positive direction of the Y-axis indicates the true north direction, and the Z-axis indicates the quality of PHS. In the fitting curve, the east-west direction is the green line and the north-south direction is the blue line.
(1) Overall, from 2011 to 2019, the quality of PHS in Liaoning Province showed a low uniformity pattern of “high in the south-central part and low around”. The fitting curve is relatively smooth, the spatial change trend of PHS is relatively balanced, and the trend analysis results are consistent with the spatial pattern characteristics of the study area.
(2) There is an obvious “U” distribution pattern in the north-south direction. From 2011 to 2019, the trend surface of PHS had the same direction in the north-south direction, and the quality of PHS in the south was stronger than that in the north, but the significance of the gap between the north and the south changed dynamically with the years.
Specifically, from 2011 to 2015, the quality gap of PHS in the north and south showed a decreasing trend; From 2015–2019, the significance of the gap between the north and the south decreased again, which indicated that the construction degree of PHS in the southern part of Liaoning Province was higher than that in the northern part, but the dominance was gradually decreasing.
(3) There is an arch-shaped distribution pattern in the east-west direction. From 2011 to 2019, the trend surface of the PHS is more consistent in the east-west direction, showing the spatial characteristics of “high in the middle and low in the east and west”, indicating that the quality of the PHS in the central region is more advantageous than that in the eastern and western regions. From 2011 to 2015, the dominance of the central region decreased, while the quality curve of the eastern and western regions slowed down; From 2015 to 2017, the dominance of the central region rebounded, leading the quality curve of the eastern and western regions to climb; From 2017 to 2019, the dominance of the central region dropped again, while the quality curve of the eastern and western regions slowed down.
3.2.3 Hierarchical characteristics
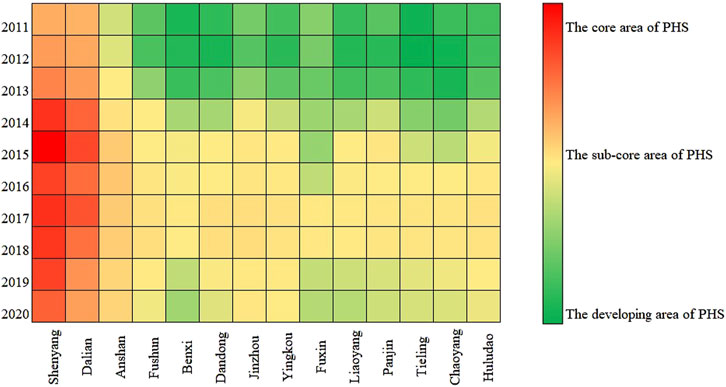
(1) The hierarchical characteristics of a “dual-core” dominant city. From 2011 to 2020, the PHS of Liaoning Province presents a “dual-core” dominant spatial feature centered on Shenyang and Dalian. The PHS in Shenyang and Dalian have been at a high level all the time, and both of them are located in the core area, and their PHS quality scores kept between 0.4 and 0.6, which is about 10 times higher than the range of the sub-core area of the PHS. The development and shrinking nodes in Shenyang and Dalian were consistent with the development and shrinking nodes of the PHS in Liaoning Province. The two have laid the foundation for the overall development trend of Liaoning Province, reflecting the great influence of provincial capital cities on the PHS in the province. At the same time, as the center cities, they have divergent and driving effects on the development of PHS in other cities, so they are the development centers in Liaoning Province.
(2) The hierarchical characteristics of a “triple sub-core” city. Anshan is an inter-mediate city linking Shenyang and Dalian, while Jinzhou and Fushun border Shenyang. The special geographical location and the level of Internet interaction make it obvious that the core area of the PHS has an impact on the three cities. The scores of Anshan, Jinzhou, and Fushun range from 0.06 to 0.4. As sub-core areas, they have a clear advantage over the PHS, but the gap between them and the “dual-core” areas is still large, which proves the hierarchical character of the PHS.
(3) Concentric circular development model. Comparing the geographical positions of the core area, sub-core area, and developing area of the PHS in 14 cities of Liaoning Province, it is found that the geographical space presents the concentric distribution of “core area—sub-core area—development area” (Figure 7). The northern part of Liaoning Province takes Shenyang City as the core area of latitude, and most of the years have the characteristics of the PHS quality ladder of Shenyang > Anshan, Jinzhou, Fushun > Chaoyang, and Huludao; The southern part of Liaoning Province takes Dalian as the latitude core area, and most years have the ladder-like characteristics of Dalian > Anshan, Yingkou, Dandong > Panjin, Liaoyang and Benxi. The development model that reflects the PHS is also centered on cities with high levels of economic construction, high-level Internet development, and high-level infrastructure construction, driving the hierarchical development of areas with low dominance. This has a similar relationship with the development model of the RHS, which effectively reflects the synchronicity and consistency of the development theory of the PHS and RHS.
3.3 System coupling and coordination
3.3.1 Time process characteristics of coupling and coordination degree
Overall, the coupling degree and coupling coordination degree of the PHS in Liaoning Province from 2011 to 2020 both show a fluctuating upward trend, and the coupling degree changes more significantly, indicating that the correlation within the five systems gradually increases and the similarity of system elements enhances. The type of coupling degree in Liaoning Province has undergone a transformation from the antagonism stage to the running-in stage to the high-level coupling stage, and the type of coupling coordination has undergone a transformation from moderate inbalance to mild imbalance, barely and primary coordination, and then fell back to mild imbalance (Figure 8).
(1) The development trend is good, but there is a gradual trend. From 2011 to 2020, the coupling of PHS systems in Liaoning Province showed a development trend, with the coupling degree significantly increasing from 0.3980 to 0.9862, and the coupling coordination degree gradually increasing from 0.2032 to 0.3902, indicating that the interdependence of the five systems was strengthened, the system structure and correlation degree tended to be stable and balanced, and the similarities among the systems tended to be consistent.
(2) There is a system coupling contraction point. 2015 is the contraction point of system coupling. The growth rate of coupling degree of this node system decreased significantly, and the coupling coordination degree increased rapidly and then decreased moderately in time development. The five systems of PHS experienced the hill-shaped transformation of “Inblance -Coordination-Inblance”.
(3) The coupling degrees among cities are all on the rise, and the gap is weakening, but there are differences in growth rates. Based on the magnitude of coupling degree changes, the coupling changes of the PHS can be divided into four categories: The first category is the high coupling degree development area, including Shenyang, Dalian, Tieling, and Benxi, with the fastest coupling degree development and the strongest system orderliness; The second category is the medium coupling degree development area, including Chaoyang, Yingkou and Fuxin, with faster coupling degree development and slightly weaker system orderliness changes than the first echelon; the third category is the coupling degree secondary development area, including Jinzhou, Fushun, Huludao and Anshan, with slower coupling development and system orderly changes; the fourth category is the low coupling development area, including Panjin, Dandong and Liaoyang, with small coupling changes and weak inter-system interactions.
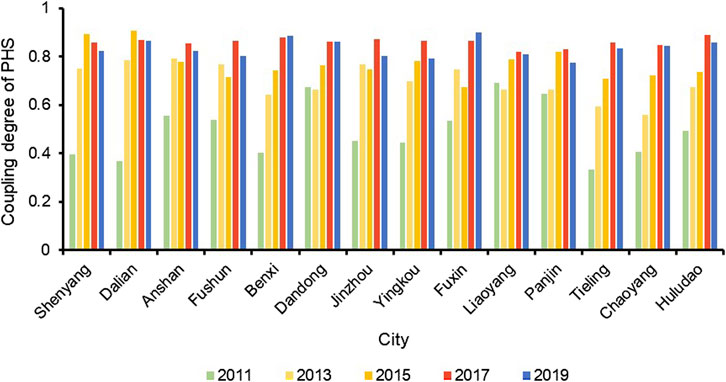
Figure 8. The evolution of coupling degree of urban PHS of 14 cities in Liaoning Province in 2011–2020.
3.3.2 Spatial pattern characteristics of coordination degree
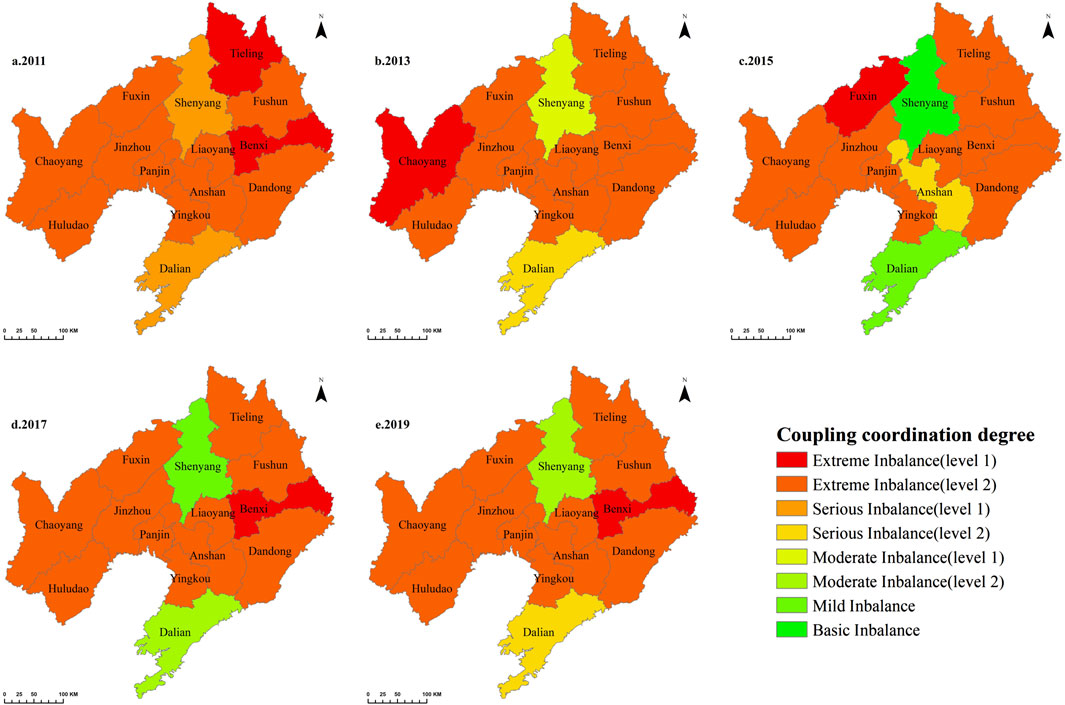
(1) Spatial differentiation of coupling and coordination degrees of the five major systems. Although the type of coupling coordination degree in Liaoning Province has changed from moderate imbalance to mild imbalance, barely and primary coordination, and then back to mild imbalance, it is found that the internal structure of the system between regions is quite different, and each region is always in a state of imbalance of different strengths. Shenyang experienced a transition of “serious-nearly-moderate” imbalance, Dalian experienced a transition of “serious-moderate” imbalance, Anshan experienced an alternation of “serious-extreme” imbalance, and the rest of the cities were in a state of extreme imbalance, but there is a weakening trend (Figure 9).
(2) Regional heterogeneity. From 2011 to 2020, although all cities have different degrees of growth, the centre of the PHS coupling coordination is always in the central part of Liaoning, showing the spatial heterogeneity characteristic of “high in the centre and low in the surroundings”. At the same time, this central dominant pattern has changed from “multiple-ternary-dual”. The multi-coupling and coordinating leader-ship represented by Shenyang, Dalian, Anshan, Fuxin, and Jinzhou gradually transformed to the three-city-dominant type of Shenyang, Dalian, and Anshan, and finally formed a binary system with Shenyang and Dalian as the core dominant pattern.
3.3.3 Coordinated development characteristics of coupling systems
The five major systems have strong and weak supporting and restrictive effects on the development of high-quality PHS, forming a hierarchical relationship of coordinated development among the systems, which is manifested as the spatial differentiation of the five major systems. Understanding the coordinated development of inter-regional systems is helpful to reveal the level of system coupling and coordination. According to the quality values of the five systems from 2011 to 2020, the high, medium, and low levels of high-quality development of the five systems of PHS are expressed, and six corresponding relationship types are obtained (Table 3), among which the left to right represent C, R, E, S and T systems respectively. (In Table three, L, M, and H represent low, medium, and high respectively).
(1) The coordinated development level of the five major systems varies significantly. The coordinated development level of C, and S systems are significantly higher than that of R and E systems, and the T system is at the intermediate level. With the improvement of the construction of the PHS, the development of each system has undergone a three-stage transformation of “low-medium-high”. In this process, the rising level of C, S systems is significantly higher than that of other systems. The regions represented by Shenyang and Dalian have experienced systematic high-level coordinated development for the first time, with the middle and high grades accounting for 42.9% and 28.6% of the province respectively. The R, E, and T systems are in the middle and low levels of coordinated development. When the tool system is at the medium level, it accounts for 21.4% of the whole province. The spatial differentiation of the coordinated development level may be the result of the comprehensive effects of the economic development stage, residents’ cultural level and local policy trends.
(2) There are obvious spatial differences and gradient characteristics in the corresponding relationship of system development. Shenyang and Dalian, as high-quality development areas of PHS, have the corresponding relationship of “H-M-M-H-M″, and the coordination degree among systems is at the highest level among all cities; Anshan and Jinzhou, as the transition zone between high-level system coordination and low-level system coordination, basically maintain the level of coordinated development among systems at a medium level, showing a “medium-low” staggered correspondence type, and the moderate development of systems is the main structure; Fu-shun, Dandong, and Yingkou are the transition zones from low-to-moderate coordination to low-level coordination. The coordinated development level of the system is basically low-level, with a few moderate developments. Benxi, Fuxin, and other places are in a state of low system coordination, and the development of each system is at a low level, but there are differences in the quality development among systems, among which Panjin’s life service system and Huludao’s communication and social service system have a tendency to moderate transition.
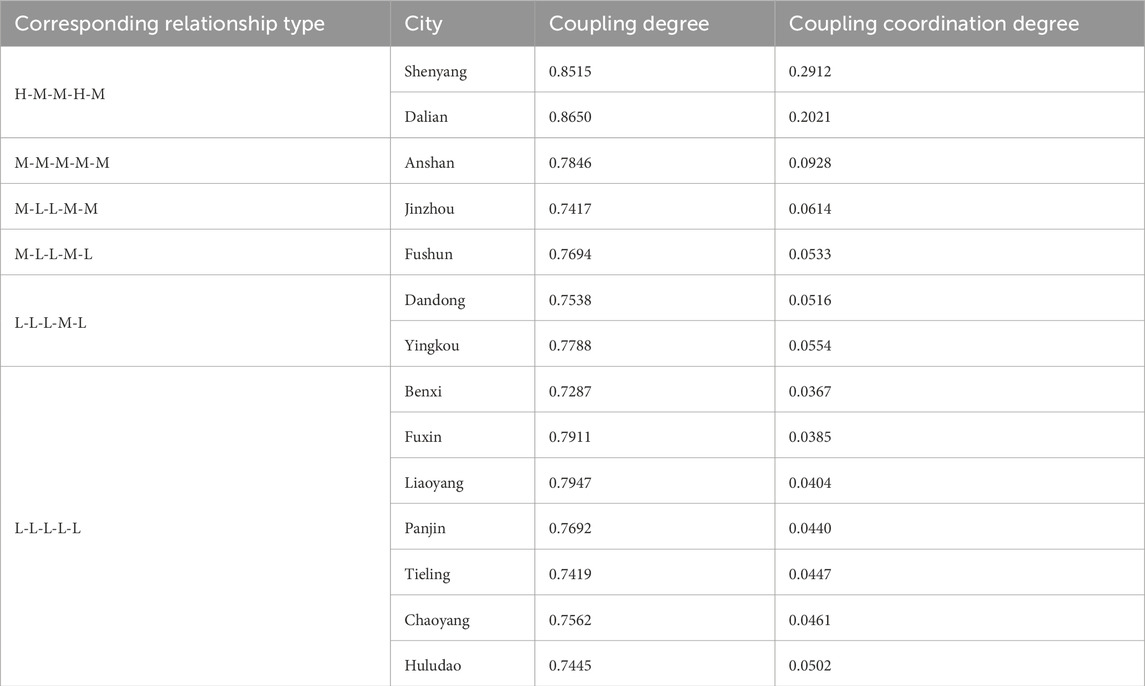
Table 3. Corresponding relationship, coupling degree and coupling coordination degree of coordinated development of PHS.
The above characteristics reflect that the quality development of the five systems of PHS is not a synchronous process, and the development level of each system tends to be coordinated with the improvement of the construction degree of urban PHS, resulting in different system correspondences between regions.
3.4 Mechanism analysis
The Geodetector is a tool used to analyze the spatial stratification quality and spatial pattern attributes (Luo et al., 2016). The coefficient of variation method is used to select two indicators that have a greater impact on the PHS in the five major systems for detection. The detection factors are WeChat and Zhihu in the contact system, Headlines Today and Tencent News in the read system, Bilibili and Kuaishou in the entertainment system, Ctrip and Are You Hungry (Hungry) in the service system, Baidu and Alipay in the tool system.
3.4.1 Factor analysis
The running results of factor detectors in Geodetector show that (Table 4), in the same year, the macroscopic systems represented by different index factors have significant differences in the influence and interpretation degree of PHS. In the five-time cross-sections, Headline Today, Kuaishou, and Hungry are important factors influencing the high-quality development of the PHS. In 2011, it was mainly influenced by two factors, Headlines Today and Kuaishou; In 2013, Alipay’s ability to influence increased significantly; In 2015, Kuaishou and Hungry continued to have a significant influence; In 2017, Hungry and Today’s Headlines continued to have a high influence status; In 2019, it was more influenced by the Today’s Headlines, Baidu and Hungry factors. Taken together, the high quality of the PHS development is the result of the factors acting with different intensities on the subsystem drive.
3.4.2 Systematic analysis
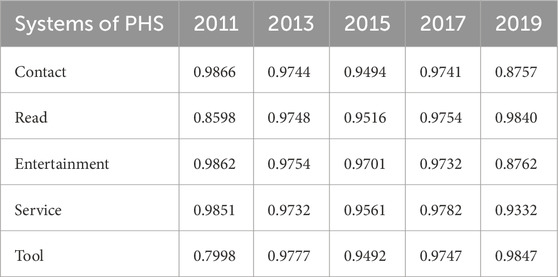
The quality of PHS has changed due to the strength of the interpretation of each index element. Based on the systematic analysis (Table 5), the five major systems have different explanatory abilities to the PHS. In 2011, the systems with the strongest explanatory power of PHS were the contact system and entertainment system. In 2013, they were the tool system and entertainment system. In 2015, they were the entertainment system and service system. In 2017, they were the read system and entertainment system. In 2019, they were the tool system and read system.
Specifically: (1) In the contact system, China Mobile > Weibo > QQ > WeChat, which are the dominant influencing factors of communication, community, and social chat, respectively. The former two are developing, while the latter is shrinking; (2) In the read system, Tencent News > Today’s Headlines > Moji Weather, Tencent News and Today’s Headlines are the dominant influencing factors of information category, and weather is the dominant influencing factor of weather category, among which Tencent News is developing; (3) In the entertainment system, Kuaishou > QQ music > Tencent video, Kuaishou and QQ music belong to the dominant influence factors of music and entertainment, while Tencent video belongs to the dominant influence fac-tors of video, all of which are in the contraction stage; (4) In the service system, 58.com > Meituan > Amap > JD.COM, among which 58.com and Meituan belong to the leading influencing factors of life service, Amap belongs to the leading influencing factors of travel, and JD.COM belongs to the leading influencing factors of shopping and is in a shrinking trend; (5) In the tool system, QQ Browser > Alipay, QQ Browser is the dominant influence factor of search system category, Alipay is the dominant in-fluence factor of financial management category, and both of them are in the devel-opment trend.
3.4.3 Mechanism analysis
(1) Tool system and read system are the emerging driving forces for the high-quality development of PHS. From 2011 to 2020, the influence of the tool system and read system on PHS has been continuously enhanced. The tool system is an important medium for life service, software management, and application in PHS, and the read system is a new driving source for information acquisition and dissemination in PHS. Generally speaking, both of them have always been in a high-scoring position, showing a steady and positive trend, which has further promoted the deepening and integrity of the construction of PHS and played a leading role.
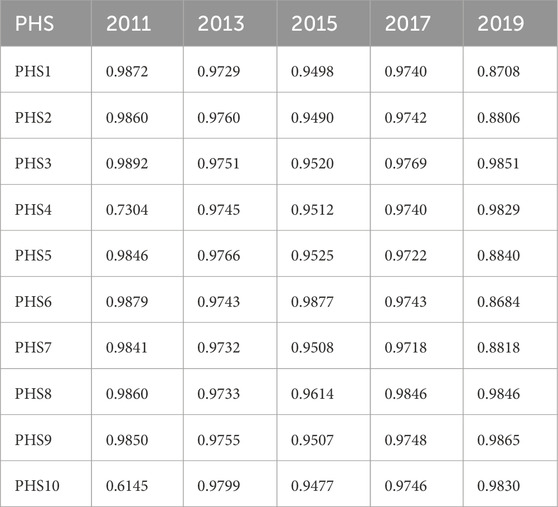
(2) Contact and entertainment system are the basic driving forces for the high-quality development of the PHS. Based on the system to which the detection factor in the geographic detector belongs, from 2011 to 2020, the communication, social, and audio-visual entertainment system in Liaoning Province has always been in an upper-middle position, until 2019, the explanatory power weakened, and the scores of the system’s PHS dropped to 0.8757 and 0.8762 respectively. It shows that the two are the basic driving forces to maintain the stable development of PHS.
(3) Service system is the invisible driving force for the development of PHS. From the results obtained by the factor detector, it can be found that the influence q of Ctrip and “Are you hungry” on the development of the PHS in the service system is relatively stable, and the quality of the PHS in the system fluctuates from 0.9332 to 0.9851, with a stable but not obvious explanatory power, indicating that from 2011 to 2020, the residents living service takes the Internet constructed PHS as the base plate, the degree of reliance on the service system is relatively stable, and the system becomes the invisible driver of the quality development of the PHS.
(4) From 2011 to 2020, the core dominant system of the PHS has undergone a dynamic transformation from contact system, entertainment system to tool system and read system. The essence of the transformation of the core domination system is the internal transformation of urban residents’ demands for “smart cities”. When basic psychological needs such as communication, social chat, music and entertainment are met through the Internet, residents will make in-depth use of information reading, work and study, financial investment, etc. Contact and entertainment have become the basic systems to maintain steady development, while tool system and read system have begun to accelerate their expansion in the network sector as emerging needs. Each system is based on human will as the starting point and foothold to penetrate each other and complement each other in the process of updating (Figure 10).
4 Discussion
HS is the cornerstone of human survival and development, and its quality directly affects the quality of people’s daily life, the speed of social progress and the balance of natural ecology. Most of the existing researches are conducted from a realistic perspective in terms of indicator system (Liu et al., 2022), management framework (Adeniran et al., 2021), resilience (Tang and Long, 2022), and sustainability (Wang and Chiou, 2019). However, in the context of the informationization era, PHS has become an important part of social development, this paper starts from the pseudo perspective, based on the “three states” human settlements theoretical system, and researches the spatial-temporal dynamics of the PHS in Liaoning Province and the driving mechanism.
The results of the study found that its temporal development has obvious nodal characteristics, and festivals, holidays, and e-commerce festivals bring certain fluctuating influences to the PHS, which corresponds to the studies of Zhan et al., (2024) on the heterogeneity of intercity travel time of the residents in the Yangtze River Delta region, and Zhang, (2021) in the study of the transition from “6.18”to “ 11.11”: the study of e-commerce festivals corresponds. It shows that specific time nodes have a great influence on people’s lives. The PHS in Liaoning Province during the study period generally presents a “1″geographical layout with Shenyang, Anshan and Dalian as the main body, which is consistent with the overall distribution pattern of Guan et al.'s (Guan et al., 2022) comprehensive suitability evaluation of urban HS in Liaoning Province, and Li et al.'s (Li et al., 2019) study on the suitability of urban HS in Liaoning Province, even though there are subtle differences.
The study of spatial patterns is useful for revealing the essential properties of space, exploring the interactions between space and human activities, and promoting the understanding and practice of urban and regional development. At present, there have been many international studies on spatial patterns, such as Balsa-Barreiro and others (Balsa-Barreiro et al., 2021) on population dynamics on a local scale, Huynh and others (Huynh et al., 2018) on the comparison of the spatial pattern of urban systems, and Yan and others (Yan et al., 2024) on the spatial pattern of China’s nighttime economy, which have all mentioned to varying degrees the influence of people on spatial patterns.
People are the main driving force of social life, and there are differences in driving strength and behavioral preferences among various groups, such as people’s own will, population migration, urban planning and other factors have a great impact on the evolution of spatial patterns and the distribution of spatial patterns in the region. Ulloa-Leon and others (Ulloa-Leon et al., 2023) have developed a study on healthy cities from the perspective of “15-min city” and the elderly, Wang and others (Wang et al., 2024) have developed a study on the interactive effects of human settlements and population migration from the perspective of disaster prevention, and Maswoswere and others (Maswoswere et al., 2023) studied town planning and development from the perspective of disaster prevention.
This paper researches the spatio-temporal dynamic evolution characteristics and driving mechanism of urban HS in Liaoning Province from the perspective of pseudo, and although some meaningful conclusions have been obtained, there are still deficiencies: ① Although this paper systematically researches the development characteristics of the PHS, the development of the PHS is rooted in the RHS and is influenced by the RHS, and it lacks the research on the interaction relationship between the two. In the future, we should carry out research on the coupling and coordination of PHS and RHS. ② The article has not yet taken into account the population factor behind the data, and the behavioral preferences of individuals will affect the composition of the data, such as the difference between youth groups and elderly groups, healthy groups and disabled groups. In the future, the subjects of PHS research should be further refined, such as for college students, special groups and other subjects of the subdivided research. ③ As a branch of human settlements science, PHS is a cross-disciplinary research field involving geography, sociology, psychology and other disciplines, and the research on PHS should emphasize the transformation of the research form into a “three-state” human settlements and interdisciplinary research.
5 Conclusion
Under the background of informationization, with the continuous development of big data, artificial intelligence, Internet of Things and so on, the development of PHS has been given a good opportunity for development. The construction and improvement of the HS is related to the residents’ daily life and their own interests, and the PHS is an important part of the HS in accordance with the development of the times. Liaoning province is the outlet of Northeast China, rich in sea and land resources, and as the only outlet province of Northeast Asian hinterland connecting Asia and Europe, Liaoning province is the key gateway to the world in Northeast China (Li et al., 2024). Therefore, this paper takes Liaoning Province as the study area, and investigates the spatial and temporal dynamic evolution characteristics of the PHS in 14 cities in Liaoning Province from 2011 to 2020, as well as the characteristics of the couping coordination of the system and the internal driving mechanism. In order to enrich the multiple changes of the HS, improve the research model of the coupling and coordination of the “three states” of the human settlements, promote the development of the discipline of human settlements geography and the coordinated development of cities, and provide reference and new ideas for the research in the field of PHS.
(1) Evolution characteristics of time process: 1) Overall and node characteristics: Taking the long time series as a reference, the quality of the PHS shows a fluctuating upward trend over a 10-year period. Taking individual years as a reference, the PHS has the node effect of “Internet festivals”, in which the PHS before and after a certain time node is characterized by an obvious increase or decrease. This phenomenon is mostly manifested in e-commerce festivals with special meanings given by merchants, such as “6.18″, “Double Eleven” and “Double Twelve”, as well as the May 1 long vacation and the 11th National Day Week, Double holidays and other netizens network active time period, and the regularity is obvious, there are every year; 2) Deviation degree and classification characteristics: From 2011 to 2020, the deviation degree of PHS showed gradient characteristics consistent with the average value, and experienced two significant fluctuations in the past 10 years, with deviations among cities in the province; The PHS shows obvious hierarchy, which can be divided into three types: core, sub-core, and development areas; 3) Stage characteristics: From 2011 to 2020, the average quality of PHS showed gradient characteristics, and the five major systems had obvious influences on the overall trend. The PHS has transformed from the leisure and entertainment-oriented type in the early stage to the life-service type and entertainment-rich type, and the network demands of netizens have shown a diversified trend.
(2) Evolution characteristics of spatial pattern: 1) Regional differentiation characteristics: From 2011 to 2020, the PHS showed obvious regional differentiation characteristics. Except for central Liaoning, the development of PHS in other areas has a trend of moving from the north to the middle and then to the south. The high-quality development center has always maintained the “1″geographical layout with Shenyang, Anshan, and Dalian as the main bodies; It presents the characteristics of a hill-type dominant spatial pattern, which is, the spatial structure of the central area decreases in a step-like manner from the north to the south; 2) Trend surface characteristics: The trend surface of the PHS shows a low uniformity pattern of “high in the central and southern regions and low in the surrounding areas”, with an obvious “U”-shaped distribution pattern in the north-south direction, and an obvious arch-shaped distribution pattern in the east-west direction; 3) It shows the spatial characteristic of the hilly type and produces the hierarchical characteristics of “dual-core” dominant city, “triple sub-core” city and concentric circular development model.
(3) Characteristics of system coupling and coordination: 1) The coupling degree and coupling coordination degree of the PHS system showed a fluctuating upward trend; The type of coupling degree in Liaoning Province has experienced the transformation from antagonism stage to running-in stage to high-level coupling stage, the type of coupling coordination degree has changed from moderate imbalance to mild imbalance, barely and primary coordination, and then fell back to mild imbalance; 2) In terms of time distribution: The coordination degree of the system is developing well, but there is a gradual slowing trend, and there is a contraction point of system coupling. The coupling degree among cities is on the rise, and the gap is weakening, but there is a difference in growth rate; 3) In terms of spatial distribution: The internal structure of the system between regions is quite different and has obvious differentiation characteristics. Each region is always in a state of imbalance of different strengths. The PHS coupling coordination center of Liaoning has the spatial heterogeneity characteristics of “high in the central part and low in the surrounding areas”, and this central dominant pattern has changed from “multiple-ternary-dual”.
(4) The PHS is the result of multiple systems and factors, the changes in various systems and factors reflect residents’ humanistic needs. Tool and read system become the emerging driving force, contact and entertainment system become the basic driving force, and service system is the invisible driving force; Communication, community, information, life service, financial management, etc. are important dominant factors; The level of coordinated development of contact system and service system is higher, and the corresponding relationship of urban system development has a gradient feature.
The research on the spatio-temporal evolution trend and driving mechanism of PHS reflects the multi-change trend of HS and improves the research model of “three-state” human settlements coupling and coordination. The research results can provide reference and new ideas for the research and coordinated development of PHS-related fields.
Data availability statement
The original contributions presented in the study are included in the article/Supplementary Material, further inquiries can be directed to the corresponding author.
Author contributions
HL: Conceptualization, Formal Analysis, Investigation, Writing–original draft. LL: Conceptualization, Validation, Writing–original draft. YW: Formal Analysis, Investigation, Validation, Writing–review and editing. ST: Formal Analysis, Funding acquisition, Validation, Writing–review and editing. JY: Validation, Writing–review and editing. XC: Validation, Writing–review and editing.
Funding
The author(s) declare that financial support was received for the research, authorship, and/or publication of this article. We would like to acknowledge the funding of the National Natural Science Foundation of China (42201221), Liaoning Province Natural Science Foundation Project (2023-MS-254), Liaoning Province Social Science Planning Fund Project (L22CJY016), Liaoning Province Social Science Association 2021 Liaoning Province Economic and social development research topic (2021lslqnkt-012), Dalian Federation of Social Sciences (2022dlskzd037).
Conflict of interest
The authors declare that the research was conducted in the absence of any commercial or financial relationships that could be construed as a potential conflict of interest.
Publisher’s note
All claims expressed in this article are solely those of the authors and do not necessarily represent those of their affiliated organizations, or those of the publisher, the editors and the reviewers. Any product that may be evaluated in this article, or claim that may be made by its manufacturer, is not guaranteed or endorsed by the publisher.
References
Adeniran, A. A., Mbanga, S., and Botha, B. (2021). A framework for the management of human settlements: Nigeria and South Africa as cases. Town Regional Plan. 78, 1–15. doi:10.18820/2415-0495/trp78i1.1
Balsa-Barreiro, J., Morales, A. J., and Lois-González, R. C. (2021). Mapping population dynamics at local scales using spatial networks. Complexity 2021. doi:10.1155/2021/8632086
Bradlow, B., Bolnick, J., and Shearing, C. (2011). Housing, institutions, money: the failures and promise of human settlements policy and practice in South Africa. Environ. Urbanization 23 (1), 267–275. doi:10.1177/0956247810392272
Carneiro, J. P., Arya, A., and Becerik-Gerber, B. (2019). Influencing occupant's choices by using spatiotemporal information visualization in Immersive Virtual Environments. Build. Environ. 150, 330–338. doi:10.1016/j.buildenv.2019.01.024
Cong, X., Li, X., and Gong, Y. (2021). Spatiotemporal evolution and driving forces of sustainable development of urban human settlements in China for SDGs. Land 10 (9), 993. doi:10.3390/land10090993
Coway-Gómez, K. (2007). Effects of human settlements on abundance of podocnemis unifilis and p. expansa turtles in northeastern Bolivia. Chelonian Conservation Biol. 6 (2), 199–205. doi:10.2744/1071-8443(2007)6[199:eohsoa]2.0.co;2
Diaz, J. H. (2004). The public health impact of global climate change. Fam. and Community Health 27 (3), 218–229. doi:10.1097/00003727-200407000-00008
Fang, C., Wang, Z., and Liu, H. (2020). Beautiful China Initiative: human-nature harmony theory, evaluation index system and application. J. Geogr. Sci. 30 (5), 691–704. doi:10.1007/s11442-020-1750-7
Fang, C., and Wei, Y. D. (2001). Evaluation on the sustainable development capacity and regularity of its regional differentiation in hexi region. Acta Geogr. Sin. (05), 560–568.
Feng, P. L. (2019) “Big data analysis of E-commerce based on the internet of things,” in International Conference on intelligent transportation, big data and smart city (ICITBS), 345–347.
Gao, J., Zhang, Y., and Li, X. (2016). Basic characteristics and spatial patterns of pseudo-settlements-taking dalian as an example. Int. J. Environ. Res. Public Health 13 (1), 145. doi:10.3390/ijerph13010145
Guan, Y., Li, X., Yang, J., Li, S., and Tian, S. (2022). Comprehensive suitability evaluation of urban human settlements based on gwr: a case study of liaoning province. Sci. Geogr. Sin. 42 (12), 2097–2108. doi:10.13249/j.cnki.sgs.2022.12.006
Halik, W., Mamat, A., Dang, J. H., Deng, B. S., and Tiyip, T. (2013). Suitability analysis of human settlement environment within the Tarim Basin in Northwestern China. Quat. Int. 311, 175–180. doi:10.1016/j.quaint.2013.06.018
He, C., Lu, X., and Liu, R. (2024). Analysis of industrial ecologization and high-quality development coupling and coordination in the yellow river basin. Ecol. Econ. 40 (08), 80–88.
Hu, Q., and Wang, C. (2020). Quality evaluation and division of regional types of rural human settlements in China. Habitat Int. 105, 102278. doi:10.1016/j.habitatint.2020.102278
Huynh, H. N., Makarov, E., Legara, E. F., Monterola, C., and Chew, L. Y. (2018). Characterisation and comparison of spatial patterns in urban systems: a case study of US cities. J. Comput. Sci. 24, 34–43. doi:10.1016/j.jocs.2017.12.001
Lee, B. Y., Bedford, V. L., Roberts, M. S., and Carley, K. M. (2008). Virtual epidemic in a virtual city; simulating the spread of influenza in a US metropolitan area. Transl. Res. 151 (6), 275–287. doi:10.1016/j.trsl.2008.02.004
Li, J., Yu, X., Liu, M., Zhang, Z., Bao, Y., and Zhong, H. (2024). Measuring marine ecosystem values and sustainable development in Liaoning Province. Chin. J. Ecol., 1–12.
Li, X., Bai, Z., Tian, S., Guo, Y., and Liu, H. (2019). Evaluation of the livability of urban human settlements: a case study of liaoning province. J. Hum. Settlements West China 34 (06), 86–93. doi:10.13791/j.cnki.hsfwest.20190612
Li, X., and Tian, S. (2015). The geographic scale of human settlements in China. Sci. Geogr. Sin. 35 (12), 1495–1501. doi:10.13249/j.cnki.sgs.2015.12.001
Lila, P. C., and Anjaneyulu, M. (2017). Networkwide impact of telework in urban areas: case study of Bangalore, India. J. Transp. Eng. Part a-Systems 143 (8). doi:10.1061/jtepbs.0000061
Liu, J., Zhang, J., and Wall, G. (2008). The geographical space of China's tourism websites. Tour. Geogr. 10 (1), 66–80. doi:10.1080/14616680701825180
Liu, Q., Gong, D., and Gong, Y. (2022). Index system of rural human settlement in rural revitalization under the perspective of China. Sci. Rep. 12 (1), 10586. doi:10.1038/s41598-022-13334-7
Liu, W., and Shi, E. (2016). Spatial pattern of population daily flow among cities based on ICT: a case study of Baidu Migration. Acta Ecol. Sin. 71 (10), 1667–1679. doi:10.11821/dlxb201610001
Lu, Z., Chi, F., Wang, R., Han, B., Wu, S., and Han, R. (2008). Comparison of realistic geo-space and virtual cyberspace in. China Sci. Geogr. Sin. (05), 601–606. doi:10.13249/j.cnki.sgs.2008.05.601
Luo, W., Jasiewicz, J., Stepinski, T., Wang, J. F., Xu, C. D., and Cang, X. Z. (2016). Spatial association between dissection density and environmental factors over the entire conterminous United States. Geophys. Res. Lett. 43 (2), 692–700. doi:10.1002/2015gl066941
Maswoswere, P., Matsa, M. M., and Sibanda, N. (2023). Town planning and development for disaster prevention: insights from gokwe town, Zimbabwe. J. Urban Plan. Dev. 149 (1). doi:10.1061/(asce)up.1943-5444.0000903
Musial, K., and Kazienko, P. (2013). Social networks on the internet. World Wide Web-Internet Web Inf. Syst. 16 (1), 31–72. doi:10.1007/s11280-011-0155-z
Nigst, P. R., Haesaerts, P., Damblon, F., Frank-Fellner, C., Mallol, C., Viola, B., et al. (2014). Early modern human settlement of Europe north of the Alps occurred 43,500 years ago in a cold steppe-type environment. Proc. Natl. Acad. Sci. U. S. A. 111 (40), 14394–14399. doi:10.1073/pnas.1412201111
Noy, S., and Zhang, W. (2023). Experimental evidence on the productivity effects of generative artificial intelligence. Science, 381(6654), 187–192. doi:10.1126/science.adh2586
Oliveira, S., Gonçalves, A., Benali, A., Sá, A., Zêzere, J. L., and Pereira, J. M. (2020). Assessing risk and prioritizing safety interventions in human settlements affected by large wildfires. Forests 11 (8), 859. doi:10.3390/f11080859
Pei, T., Liu, Y., Guo, S., Shu, H., Du, Y., Ma, T., et al. (2019). Principle of big geodata mining. Acta Geogr. Sin. 74 (03), 586–598. doi:10.11821/dlxb201903014
Pržulj, N., and Malod-Dognin, N. (2016). Network analytics in the age of big data. Science 353 (6295), 123–124. doi:10.1126/science.aah3449
Qi, Q., Wang, L., Chen, J., Wang, B., He, S., Han, J., et al. (2024). Interaction between rapid urban expansion and ecosystem service value trade-off/synergy in Wuhan City. Sci. Geogr. Sin. 44 (06), 953–963. doi:10.13249/j.cnki.sgs.20221597
Qin, S., Qian, T., Wu, Z., Li, Y., and Wang, J. (2023). Simulation of the spatial pattern of human travel activity intensity based on geodetector and maximum entropy model: a case study of Yunnan Province. Sci. Geogr. Sin. 43 (08), 1360–1370. doi:10.13249/j.cnki.sgs.2023.08.005
Qiu, L., Zhong, S., and Sun, B. (2021). Blessing or curse? The effect of broadband Internet on China’s inter-city income inequality. Econ. Analysis Policy 72, 626–650. doi:10.1016/J.EAP.2021.10.013
Ramaswami, A., Russell, A. G., Culligan, P. J., Sharma, K. R., and Kumar, E. (2016). Meta-principles for developing smart, sustainable, and healthy cities. Science 352 (6288), 940–943. doi:10.1126/science.aaf7160
Reinmann, A. B., Hutyra, L. R., Trlica, A., and Olofsson, P. (2016). Assessing the global warming potential of human settlement expansion in a mesic temperate landscape from 2005 to 2050. Sci. Total Environ. 545, 512–524. doi:10.1016/j.scitotenv.2015.12.033
Robison, K. K., and Crenshaw, E. M. (2002). Post-industrial transformations and cyber-space: a cross-national analysis of Internet development. Soc. Sci. Res. 31 (3), 334–363. doi:10.1016/S0049-089X(02)00004-2
Romano, S., Capece, N., Erra, U., Scanniello, G., and Lanza, M. (2019). On the use of virtual reality in software visualization: the case of the city metaphor. Inf. Softw. Technol. 114, 92–106. doi:10.1016/j.infsof.2019.06.007
Rout, A., Nitoslawski, S., Ladle, A., and Galpern, P. (2021). Using smartphone-GPS data to understand pedestrian-scale behavior in urban settings: a review of themes and approaches. Comput. Environ. Urban Syst. 90, 101705. doi:10.1016/j.compenvurbsys.2021.101705
Shah, S. A., Seker, D. Z., Rathore, M. M., Hameed, S., Yahia, S. B., and Draheim, D. (2019). Towards disaster resilient smart cities: can internet of things and big data analytics Be the game changers? IEEE Access 7, 91885–91903. doi:10.1109/access.2019.2928233
Shun, Z., and Chen, D. (2019). Spatio-temporal evolution and obstacle diagnosis of blue economy development in China based on entropy method. Ecol. Econ. 35 (05), 54–61.
Song, R., Hu, Y., and Li, M. (2021). Chinese pattern of urban development quality assessment: a perspective based on national territory spatial planning initiatives. Land 10 (8), 773. doi:10.3390/land10080773
Tang, L., and Long, H. (2022). Simulating the development of resilient human settlement in Changsha. J. Geogr. Sci. 32 (8), 1513–1529. doi:10.1007/s11442-022-2008-3
Tian, S., Li, X., Yang, J., Zhang, W., and Guo, J. (2021b). Spatio-temporal coupling coordination and driving mechanism of urban pseudo and reality human settlements in the three provinces of Northeast China. Acta Ecol. Sin. 76 (04), 781–798. doi:10.11821/dlxb202104002
Tian, S., Li, X., Yang, J., Zhang, W., and Guo, J. (2021c). Spatio-temporal coupling coordination and driving mechanism of urban pseudo and reality human settlements in the three provinces of Northeast China. Acta Geogr. Sin. 76 (04), 781–798. doi:10.11821/dlxb202104002
Tian, S., Li, X., Yang, J., Zhang, W., and Guo, J. (2021a). Spatio-temporal coupling coordination and driving mechanism of urban pseudo and reality human settlements in the three provinces of Northeast China. Acta Geogr. Sin. 76 (04), 781–798. doi:10.11821/dlxb202104002
Tian, S., Wang, Y., Li, X., Wu, W., Yang, J., Cong, X., et al. (2024). Spatio-temporal evolution and driving mechanism of coupling coordination of pseudo human settlements in Central China’s urban agglomerations. Land 13 (6), 858. doi:10.3390/land13060858
Tian, S., Yang, B., Liu, Z., Li, X., and Zhang, W. (2022). Coupling coordination of urban pseudo and reality human settlements. Land 11 (3), 414. doi:10.3390/land11030414
Ulloa-Leon, F., Correa-Parra, J., Vergara-Perucich, F., Cancino-Contreras, F., and Aguirre-Nuñez, C. (2023). “15-Minute city” and elderly people: thinking about healthy cities. Smart Cities 6 (2), 1043–1058. doi:10.3390/smartcities6020050
Valjarević, A., Filipović, D., Živković, D., Ristić, N., Božović, J., and Božović, R. (2021). Spatial analysis of the possible first Serbian conurbation. Appl. Spatial Analysis Policy 14 (1), 113–134. doi:10.1007/s12061-020-09348-1
Wang, F., Mao, A., Li, H., and Jia, M. (2013). Quality measurement and regional difference of urbanization in shandong province based on the entropy method. Sci. Geogr. Sin. 33 (11), 1323–1329. doi:10.13249/j.cnki.sgs.2013.11.006
Wang, F., Miao, C., Liu, F., Chen, X., Mi, W., Hai, C., et al. (2021). The locality and adaptability of human settlements in the Yellow River Basin: challenges and opportunities. J. Nat. Resour. 36 (01), 1–26. doi:10.31497/zrzyxb.20210101
Wang, G., Bai, Z., and Ji, S. (2024). Interacting relationship between human settlement environment of urban and population migration. Sci. Geogr. Sin. 44 (06), 940–952. doi:10.13249/j.cnki.sgs.20230467
Wang, H., and Chiou, S. (2019). Study on the sustainable development of human settlement space environment in traditional villages. Sustainability 11 (15), 4186. doi:10.3390/su11154186
Wang, J., and Xu, C. (2017). Geodetector: principle and prospective. Acta Ecol. Sin. 72 (01), 116–134. doi:10.11821/dlxb201701010
Wehner, S., Elkouss, D., and Hanson, R. (2018). Quantum internet: a vision for the road ahead. Science 362 (6412), eaam9288. doi:10.1126/science.aam9288
Weigle, M. C., Balsa-Barreiro, J., Chawla, N. V., Dávid-Barrett, T., Melchior, M., Pallante, V., et al. (2024). “Characterizing social environments in the physical and virtual worlds using digital data,” in Digital ethology: human behavior in geospatial context. Editors T. Paus, and H.-C. Kum (The MIT Press). 0.
Wu, L. Y. (2001). Introduction to sciences of human settlements. Beijing, China: China Architecture and Building Press.
Xi, G., Cao, X., and Zhen, F. (2021). How does same-day-delivery online shopping reshape social interactions among neighbors in Nanjing? Cities 114, 103219. doi:10.1016/j.cities.2021.103219
Xiong, Y., Zeng, G., Dong, L., Jiao, S., and Chen, G. (2007). Quantitative evaluation of the uncertainties in the coordinated development of urban human settlement environment and economy:taking changsha city as an example. Acta Ecol. Sin. (04), 397–406. doi:10.11821/xb200704006
Xue, Q., Yang, X., and Wu, F. (2021). A two-stage system analysis of real and pseudo urban human settlements in China. J. Clean. Prod. 293, 126272. doi:10.1016/j.jclepro.2021.126272
Yan, G., Zou, L., and Liu, Y. (2024). The spatial pattern and influencing factors of China's nighttime economy utilizing POI and remote sensing data. Appl. Sciences-Basel 14 (1), 400. doi:10.3390/app14010400
Yang, F., Xi, G., Zhen, F., and Hai, X. (2023). Suitability evaluation of territorial space development from the perspective of“form-flow integration”: a case study of the Nanjing Metropolitan Area. Resour. Sci. 45 (12), 2372–2384. doi:10.18402/resci.2023.12.06
Ying, X. (2011). Uncertainty evaluation of the coordinated development of urban human settlement environment and economy in Changsha city. J. Geogr. Sci. 21 (6), 1123–1137. doi:10.1007/s11442-011-0905-y
Yuan, J., and Qi, C. (2013). Dynamic assessment of regional agricultural sustainability of hunan province based on entropy method. Ecol. Environ. Sci. 22 (02), 152–157.
Zhan, W., Xi, G., Ju, Y., and Shi, F. (2024). Temporal heterogeneity and impact mechanism of intercity travel time in the Yangtze River Delta region tropical geography 44(05), 850–863. doi:10.13284/j.cnki.rddl.003865
Zhang, C., and Li, X. (2021). The evaluation index system of human settlements on livable community for the elderly in liaoning province. Sci. Geogr. Sin. 41 (01), 92–99. doi:10.13249/j.cnki.sgs.2021.01.010
Zhang, R., and Gong, W. (2013). Research on the way of the quantification and visualization to gas distribution in a coal mine by applying the spatial trend surface analysis method. China Min. Mag. 22 (04), 106–109.
Zhang, Y. (2021). From “618” to “Double 11”: e-commerce holiday marketing experience and its inspiration. J. Commer. Econ. (14), 102–105.
Zhang, Z., and Wei, Z. (2006). Study and application of urban human settlements assessment system Ecology and Environmental Sciences (01), 198–201. doi:10.16258/j.cnki.1674-5906.2006.01.042
Zhao, H., Gu, T., Sun, D., and Miao, C. (2023). Dynamic evolution and influencing mechanism of urban human settlements in the Yellow River Basin from the perspective of “production-living-ecological” function. Acta Geogr. Sin. 78 (12), 2973–2999. doi:10.11821/dlxb202312005
Zhen, F., Zhai, Q., Chen, G., and Shen, L. (2012). Mobile socile theory construction and urban geographic research in the information era. Geogr. Res. 31 (02), 197–206. doi:10.11821/yj2012020001
Keywords: pseudo human settlements, spatio-temporal dynamic evolution characteristics, coupling coordination, nodal characteristics, concentric circular development, new type of drive
Citation: Li H, Lou L, Wang Y, Tian S, Yang J and Cong X (2024) Spatio-temporal dynamic evolution characteristics and driving mechanism analysis of urban pseudo human settlements. Front. Earth Sci. 12:1454572. doi: 10.3389/feart.2024.1454572
Received: 25 June 2024; Accepted: 04 September 2024;
Published: 20 September 2024.
Edited by:
Kun Shi, Chinese Academy of Sciences (CAS), ChinaReviewed by:
Aleksandar Valjarević, University of Belgrade, SerbiaJose Balsa Barreiro, Massachusetts Institute of Technology, United States
Copyright © 2024 Li, Lou, Wang, Tian, Yang and Cong. This is an open-access article distributed under the terms of the Creative Commons Attribution License (CC BY). The use, distribution or reproduction in other forums is permitted, provided the original author(s) and the copyright owner(s) are credited and that the original publication in this journal is cited, in accordance with accepted academic practice. No use, distribution or reproduction is permitted which does not comply with these terms.
*Correspondence: Yadan Wang, d2FuZ3lkMDEyOUAxNjMuY29t
 Hang Li1,2,3,4
 Lin Lou
 Yadan Wang
 Jun Yang