- Research Institute, Shaanxi Yanchang Petroleum (Group) Co., Ltd., Xi’an, Shaanxi, China
In order to explain the difference in adsorption characteristics of CH4 and CO2 on continental shale from the perspective of thermodynamics, the isothermal adsorption experiments of CH4 and CO2 adsorbed by shale in Yanchang Formation in Ordos Basin were carried out, and the excess adsorption capacity was corrected to absolute adsorption capacity. Then the Clausius-Clapeyron equation was used to analyze the isosteric heat of adsorption of CH4 and CO2 on shale. The results show that, for calculating the absolute adsorption capacity, Ozawa empirical formula or Van der Waals approximation method should be used to calculate the adsorption phase density. The absolute adsorption capacity should be selected as the basic data for calculating the isosteric heat of adsorption. The reason is that the excess isosteric heat of adsorption has a negative value in the low adsorption capacity stage, which is contradictory to the fact that the adsorption process is exothermic, and is significantly higher than the absolute isosteric heat of adsorption. There is a good linear positive correlation between the isosteric heat of adsorption and the adsorption amount of CH4 and CO2 adsorbed by continental shale, and the isosteric heat of adsorption of CH4 is greater than that of CO2. The absolute initial isosteric heat of adsorption of CH4 and CO2 adsorbed by shale is 52.04 kJ/mol and 27.71 kJ/mol, indicating that the adsorption force of CH4 on Yanchang Formation shale is stronger than that of CO2.
1 Introduction
In recent years, with the increasing exploration and development of shale gas resources, shale gas has become an important support for the continuous growth of global natural gas production, shale gas production exceeds 8,000 × 108 m3 in 2021, accounting for 20% of total natural gas production (Zou et al., 2022). Shale gas mainly exists in free and adsorbed states on the surface of shale pores, clay mineral particles and organic matter pores (Xia et al., 2015; Zhou S. et al., 2016). Adsorption gas accounted for 20%–85% of the total gas (Curtis, 2002; Zhang et al., 2004). Study on the adsorption characteristics and mechanism of shale is an important part of theoretical research on shale gas exploration and development, which is of great significance to the evaluation of shale gas resources and the development programs compilation (Jia et al., 2012; Zou et al., 2012; Meng et al., 2021; Han et al., 2022).
Adsorption characteristics of shale are affected by many factors such as adsorbate type, shale material composition and pore structure, temperature and pressure conditions of the system (GASPARIK et al., 2014; M. E.Curtis, 2010). In terms of adsorbate types, many scholars have used physical simulation (Zhu et al., 2016; Yang et al., 2017; Zhang et al., 2019) or molecular simulation methods (Li et al., 2014; Hongguan and June 2016; Sui and Yao, 2016; Wang et al., 2017) to study the differences in the adsorption characteristics of CH4 and CO2 on shale (Zhu et al., 2016; Yang et al., 2017; Zhang et al., 2019) and its material composition (kerogen (Hongguan and June 2016), clay minerals (Li et al., 2014; Sui and Yao, 2016; Wang et al., 2017), etc.). The results show that for the same shale, under the same temperature and pressure conditions, the adsorption capacity of CO2 on shale, kerogen and clay minerals is greater than that of CH4. The adsorption capacity ratio of shale to CO2 and CH4 can reach more than 1.5 (Zhu et al., 2016; Yang et al., 2017), and some samples even reach about 5 times (Zhang et al., 2019). Shale has an obvious competitive adsorption advantage for CO2 (Wang et al., 2016; Liang and Li, 2021), which is the fundamental reason that supercritical CO2 can be used to enhance shale gas exploitation (Liang and Li, 2021; Lu et al., 2021). Although some studies have revealed the differences of adsorption characteristics of CO2 and CH4 on shale, the reasons for the differences are still lack of theoretical analysis. The adsorption system is accompanied by changes of thermodynamic energy during the adsorption process, that is reflected in the form of adsorption heat. The adsorption heat reflects the strength of the interaction between the adsorbent and the adsorbate, and the heterogeneity of the adsorbent surface. Therefore, studying the thermodynamic characteristics of shale adsorption process can further clarify the adsorption mechanism.
There are some understandings on the adsorption thermodynamic characteristics of marine shale and coal. Some scholars have studied the thermodynamic characteristics of CH4 adsorption on Longmaxi shale (GUO et al., 2013), Niutitang shale (YANG et al., 2014) in Sichuan Basin and Carboniferous shale (LI et al., 2016) in Qaidam Basin. The results show that there is a linear correlation between the adsorption heat and the adsorption capacity of CH4 adsorbed on shale, but the positive and negative correlations are different. NODZENSKI. (1998); KIM et al. (2011) analyzed the thermodynamic difference of adsorption of CO2 and CH4 on coal rock, indicating that the heat of adsorption of CO2 on coal is greater than that of CH4, revealing the essence of competitive adsorption of CO2 and CH4 on the surface of coal from thermodynamic perspective. Because the adsorption characteristics of different adsorption systems are obviously different, the existing research results are difficult to accurately reflect the adsorption mechanism of continental shale. At the same time, the existing research results use the excess adsorption capacity to analyze the thermodynamic characteristics. But the excess adsorption capacity cannot represent the actual adsorption capacity of the adsorbent. Therefore, the isosteric heat of adsorption calculated by using the excess adsorption capacity cannot reflect the thermodynamic characteristics of the adsorption process.
In this paper, the isothermal adsorption experiments of CH4 and CO2 adsorbed by the continental shale in Ordos Basin at 30°C, 45°C and 60°C were carried out. The difference between the excess and the absolute adsorption capacity was studied. The isosteric heat of adsorption of CH4 and CO2 adsorbed by continental shale was analyzed to explain the competitive adsorption mechanism. The research results are of great significance to improve the analysis method of adsorption thermodynamics and further clarify the competitive adsorption mechanism of CH4 and CO2 in continental shale.
2 Expeiment
2.1 Experimental samples
During the Chang7 period, the sedimentary center of Ordos basin is located in the central and southern part of the basin, mainly developing semi-deep and deep lake sedimentary microfacies. The thickness of the dark shale (Zhangjiatan shale) of the Chang7 strata formed by deposition is between 400 and 500 m, of which the thickness of the single layer is up to 30 m, and the thickness of the Chang7 shale in Ganquan area is between 45 and 60 m.
The experimental samples are form Well CY1 in Xiasiwan Town, Ganquan Area, Ordos Basin. The sampling horizon is the Upper Triassic Yanchang Formation. The samples are gray-black shale, with a specific surface area of 3.54 m2/g, TOC of 4.31%, organic matter type of II1, Ro of 0.91%, quartz content of 14.4%, feldspar content of 10.5%, clay mineral content of 53.7%, and a small amount of pyrite and carbonate.
Due to the low evolution degree of organic matter in Yanchang Formation shale, a large number of liquid hydrocarbons formed during the thermal evolution process occupy the micropores in the shale, and methane is easily soluble in liquid hydrocarbons. Therefore, in order to eliminate the influence of liquid hydrocarbons on the adsorption of CO2 and CH4 on samples, and truly reflect the thermodynamic characteristics of the adsorption process, organic matter solvent extraction is required for the shale sample. Experimental samples from the same core sample, through organic matter solvent extraction, vacuum drying, crushing, screening, made into a particle size of about 0.2 mm broken samples, and according to the experimental requirements are divided into three, and sealed spare.
2.2 Experimental method
The instrument used in this experiment is FY-KT1000 isothermal adsorption instrument. The experimental method refers to the relevant provisions of GB/T 19,560–2008 “high pressure isothermal adsorption test method of coal. “ According to the temperature and pressure conditions of the sampled formation, the experimental temperatures were set to 30°C, 45°C, and 60°C, respectively. The initial pressure of the experiment was 0.5 MPa, and the upper limit of pressure was 16 MPa. A total of 10–11 pressure points were measured at different temperatures. The test gradually increased from the initial pressure to the upper limit of pressure, and the equilibrium time at each equilibrium pressure point was not less than 12 h. The experimental gases are CH4 and CO2 with a purity of 99.99%.
3 Result and discussion
3.1 Adsorption properties of samples
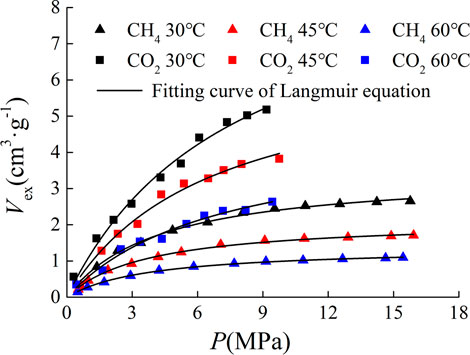
The experimental samples are from the same core with the same sample preparation method and sample specification. The difference of experimental results is mainly due to the difference of experimental temperature and pressure conditions and adsorbate types. The experimental results are shown in Figure 1.
It can be seen from Figure 1 that under the same temperature and pressure conditions, the adsorption capacity of CO2 is greater than that of CH4. With the increase of temperature, the adsorption capacity of shale decreases. The isothermal adsorption curve was fitted by Langmuir equation, which can be expressed as
Where V is isothermal adsorption capacity, g/cm3.
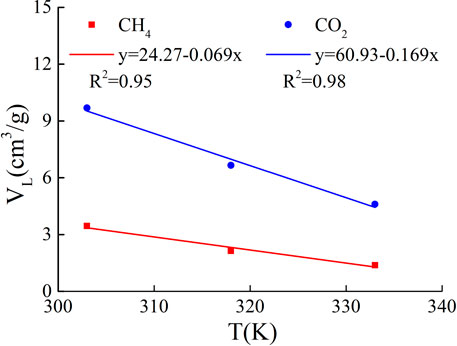
The Langmuir volume and temperature were fitted by linear function, and the fitting results are shown in Figure 2. There is a good negative linear correlation between Langmuir volume and temperature, and the Langmuir volume of CO2 adsorbed by shale is more sensitive to temperature than that of CH4. And the study shows that the Langmuir volume of shale is positively correlated with porosity, organic matter abundance, organic matter maturity and clay mineral content, and negatively correlated with average pore size.
Since the critical temperature of CH4 and CO2 is −82.6°C and 31°C, and the critical pressure is 4.64 MPa and 7.4 MPa, respectively, when the experimental temperature and pressure conditions exceed the critical point, the adsorption of gas in shale belong to supercritical adsorption. The isothermal adsorption curve under supercritical state will have a maximum value, but there is no maximum value in the experimental results. Liu Shengxin et al. (LIU et al., 2015) determined the isothermal adsorption curve of CO2 on the Carboniferous shale in the Qaidam Basin. The maximum value appeared near the temperature of 45°C and the gas pressure of 7.5 MPa, but the isothermal adsorption curve of CH4 in the same shale sample did not appear. It can be seen that the appearance of the maximum value is related to the gas type. Zhou et al. (2000) believed that the appearance of the maximum value required the high experimental pressure and large specific surface area.
3.2 Adsorption phase density
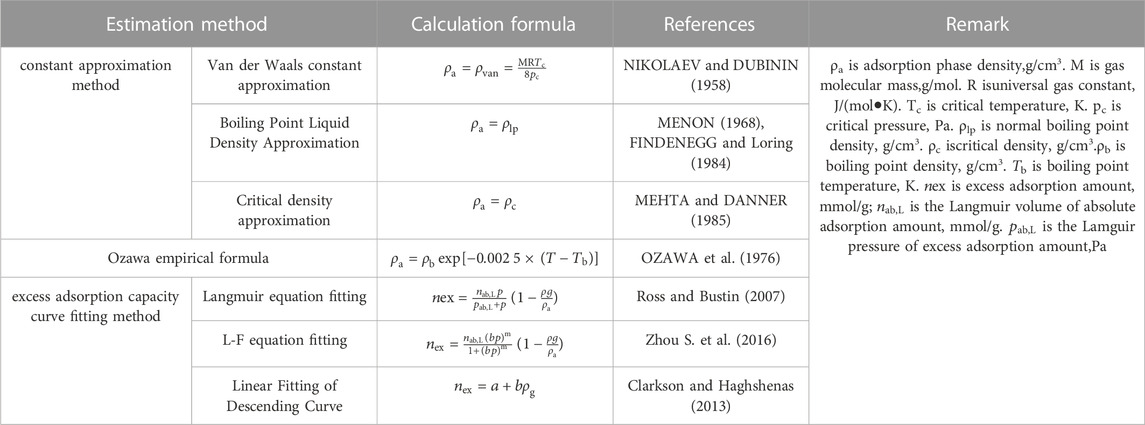
Adsorbed phase density is the key parameter to calculate the absolute adsorption capacity by using excess adsorption capacity. The density of adsorbed phase is often calculated by theoretical estimation and equation fitting, which cannot be measured directly under supercritical conditions. The commonly used calculation methods of adsorbed phase density (see Table 2) mainly include the adsorption phase density constant approximation method (MURATA et al., 2001; NIKOLAEV and DUBININ, 1958; MENON, 1968; FINDENEGG and Loring, 1984; MEHTA and DANNER, 1985), empirical formula method (OZAWA et al., 1976) and excess adsorption capacity curve fitting method (Ross and Bustin, 2007; Clarkson and Haghshenas, 2013; Zhou S. W. et al., 2016). The density of the adsorption phase has a great influence on the correction results of the absolute adsorption amount. The smaller the density of the adsorption phase is, the greater the absolute adsorption amount is. Therefore, considering the accuracy of the absolute adsorption amount correction results, it is necessary to screen the calculation method of adsorption phase density.
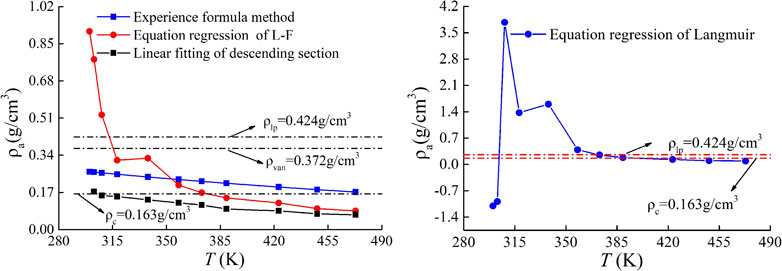
Under supercritical conditions, the adsorbed molecules lose the average moving energy due to the action of adsorption potential, but still have high rotational and vibrational energy. Therefore, the density of adsorbed phase under supercritical conditions is obviously higher than the critical density, and slightly lower than the density of boiling point liquid at atmospheric pressure (Hu et al., 2002). Theoretically, the curve of absolute adsorption capacity is monotonic, and there is no maximum value (Kondo et al., 2005). Therefore, the rationality of different adsorption phase density estimation methods in Table 2 can be verified from the perspectives of adsorption phase density range and absolute adsorption capacity monotonicity. Figure 3 is the relationship curve between CH4 adsorption phase density and temperature obtained by different adsorption phase density calculation methods.
In order to verify the rationality of the adsorbed phase density in a large temperature and pressure range, the excess adsorption data are derived from Reference (RexerBenhamAplin and Thomas, 2013). The temperature range of the data is 26.85°C–199.85°C, and the pressure range is 0.08–14 MPa.
It can be seen from Figure 3 that in the temperature range of 26.85°C–199.85°C, the liquid density at the normal pressure boiling point of CH4 is approximately 0.424 g/cm3, and the critical density is approximately 0.163 g/cm3.
Therefore, the adsorption phase density of CH4 should be in the range of 0.163 g/cm3–0.424 g/cm3. The approximate value of Van der Waals with 0.372 g/cm3, and the density of adsorption phase of CH4 obtained by Ozawa empirical formula method with 0.265–0.172 g/cm3 are reasonable.
There are only two data points in the descending section of the excess adsorption curve under the temperature of 26.85°C, and the data points are too few to carry out linear fitting. Therefore, for the excess adsorption capacity curve in the temperature range of 29.85–199.85°C, the linear fitting method of the downward section is used to calculate the adsorption phase density. The results show that the adsorption phase density is in the range of 0.17434–0.06772 g/cm3. With the increase of temperature, the adsorption phase density gradually decreases, and the adsorption phase density is only in a reasonable range at 29.85 °C. The rest are lower than the critical density value of 0.163 g/cm3.
The adsorption phase density obtained by the regression method of the L-F equation is between 0.9066 and 0.0807 g/cm3, and the calculation results are in a reasonable range only in the temperature range of 44.85–115.85°C. The density of the adsorbed phase obtained by the Langmuir equation regression method is only in a reasonable range at a temperature of 84.85°–115.85°C. At a temperature of 26.85°C and 29.85°C, the calculation results have negative values and that is meaningless. In the temperature range of 26.85–199.85°C, only the adsorption phase density obtained by Ozawa empirical formula and van der Waals approximation is in the reasonable range of CH4 adsorption phase density. In this paper, the Ozawa empirical formula is used to calculate the absolute adsorption capacity.
3.3 Excess and absolute adsorption capacity
Since the influence of the adsorbed phase volume is neglected in the data processing of the isothermal adsorption experiment, the experimental results represent the adsorption amount corresponding to the remaining part of the actual adsorbed gas density minus the gas phase density, which is called the excess adsorption amount. The actual adsorption amount is the absolute adsorption amount, and the absolute adsorption amount is greater than the excess. At present, the correction formula proposed by MOFFAT and WEALE. (1955) is used to realize the conversion from excess adsorption to absolute adsorption. The formula is expressed as
Where
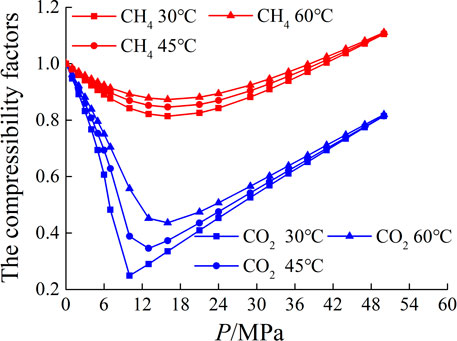
Due to the large variation of the compression factors of CH4 and CO2 under the experimental temperature and pressure conditions (as shown in Figure 4), if the ideal gas state equation is used to calculate the gas phase density, it will cause large errors. Therefore, the real gas state equation is used to calculate the gas phase density. The gas phase density can be expressed as
Where M is molar mass, g/mol. Z is real gas compression factor, which is calculated by Peng-Robinson equation. R is universal gas constant, 8.314 J/(K×mol). T is absolute temperature, K.
The phase change and density curve of CH4 and CO2 under the experimental temperature and pressure conditions are shown in Figure 5. For CH4, there is a phase change from gas phase to supercritical state under experimental conditions. For CO2, the experimental temperature 30°C is lower than its critical temperature (31°C), at which CO2 changes from gas phase to liquid phase. At the temperature of 45°C and 60°C, CO2 changes from gas phase to supercritical state, during the phase change of CO2, the density increases greatly.
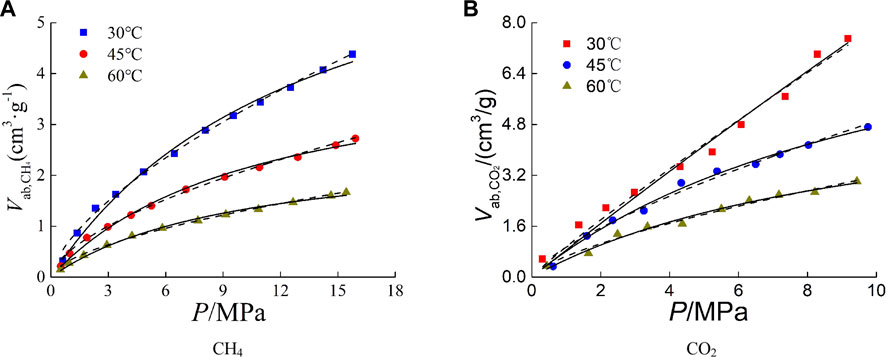
Based on the results of isothermal adsorption experiments, the excess adsorption capacity was converted to absolute adsorption capacity by using Formula (2) combined with the calculation method of gas phase density and adsorbed phase density. The absolute adsorption capacity and its fitting curve are shown in Figure 6.
The absolute adsorption capacity is greater than the excess, and the difference between them is affected by the temperature, pressure and gas type. In the low pressure range of 0 MPa–4 MPa, the difference between them is small, and the difference increases with the increase of pressure. Under low temperature, the difference is larger than that under high temperature. The difference between the absolute and excess adsorption capacity of CO2 on shale is greater than that of CH4 under the same temperature and pressure.
The absolute adsorption curve was fitted by Langmuir Eq. 1 and Freundlich equation. The Freundlich equation can be expressed as
Where k and n are fitting constants. Fitting results and fitting parameters are shown in Figure 6 and Table 3. The fitting results show that above the critical temperature, the fitting effect of Langmuir equation on the absolute adsorption curve is better than that of Freundlich equation. For the adsorption of CO2 below the critical temperature, due to the phase transition of CO2 from gas phase to liquid phase, the fitting parameters of Langmuir volume and Langmuir pressure are obviously not of practical significance, and the fitting degree of Freundlich equation is higher.
Langmuir and Freundlich equations reflect the different energy relationships in the adsorption process. The Langmuir equation represents that the adsorption heat does not change with the adsorption amount, and the adsorbate is less sensitive to the heterogeneity of the adsorbent surface. The Freundlich equation represents that the adsorption heat and adsorption amount satisfy the logarithmic correlation. The adsorbate is sensitive to the inhomogeneity of the adsorbent surface, and preferentially adsorbed at the highly active site.
3.4Isosteric heat of adsorption of CH4 and CO2 on shales
The isosteric heat of adsorption refers to the enthalpy change when a mol of gas is adsorbed when the temperature, pressure and surface area of the adsorbent are constant. That is, when the adsorption amount is constant, the heat released during the adsorbent adsorbs infinitely small amount of gas molecules. The heat is the instantaneous value of enthalpy change during adsorption process. The isosteric heat of adsorption can indirectly reflect the adsorption force of the adsorption system and the inhomogeneity of the adsorbent surface. Isosteric heat of adsorption is usually calculated by the Clausius-Clapeyron equation (RAMIREZ-PASTOR and BULNES, 2000) with isothermal adsorption capacity. The equation can be expressed as
Where qst is isosteric heat of adsorption, J/mol. By deforming and integrating both side of Eq. 5 can be expressed as
where C2 is integration constant. Eq. 6 shows that 1/T and lnp have a linear relationship, and the isosteric heat of adsorption qst corresponding to the adsorption capacity n can be obtained from the slope. Assuming the slope is A, the isosteric adsorption heat is
For the convenience of subsequent description, the isosteric heat of adsorption obtained based on excess adsorption capacity is referred to as the excess isosteric heat of adsorption, and based on absolute adsorption capacity is referred to as the absolute isosteric heat of adsorption. Relative to the initial isosteric heat of adsorption, respectively referred to as excess initial isosteric heat of adsorption and absolute initial isosteric equal heat of adsorption.
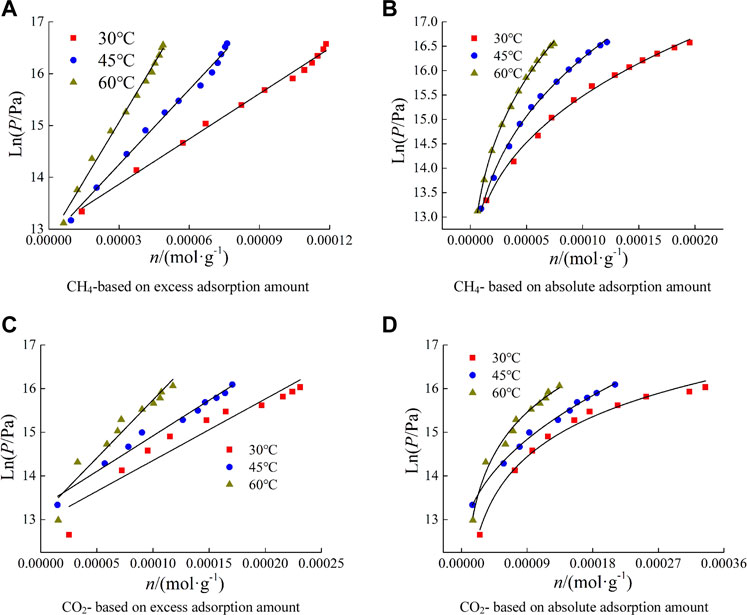
Linear function Eq. 8 and power function Eq. 9 were used to fit the pressure logarithm-adsorption amount (lnp-n) data based on excess and absolute adsorption amount, respectively.
where a1, b1, a2, b2 and c are fitting function parameters. nex is excess adsorption amount, mol/g. nab is absolute adsorption amount, mol/g. The fitting results of lnp-n are shown in Figure 7. The results showed that the lnp-n data based on excess adsorption conformed to linear function fitting, and the lnp-n data based on absolute adsorption conformed to power function fitting.
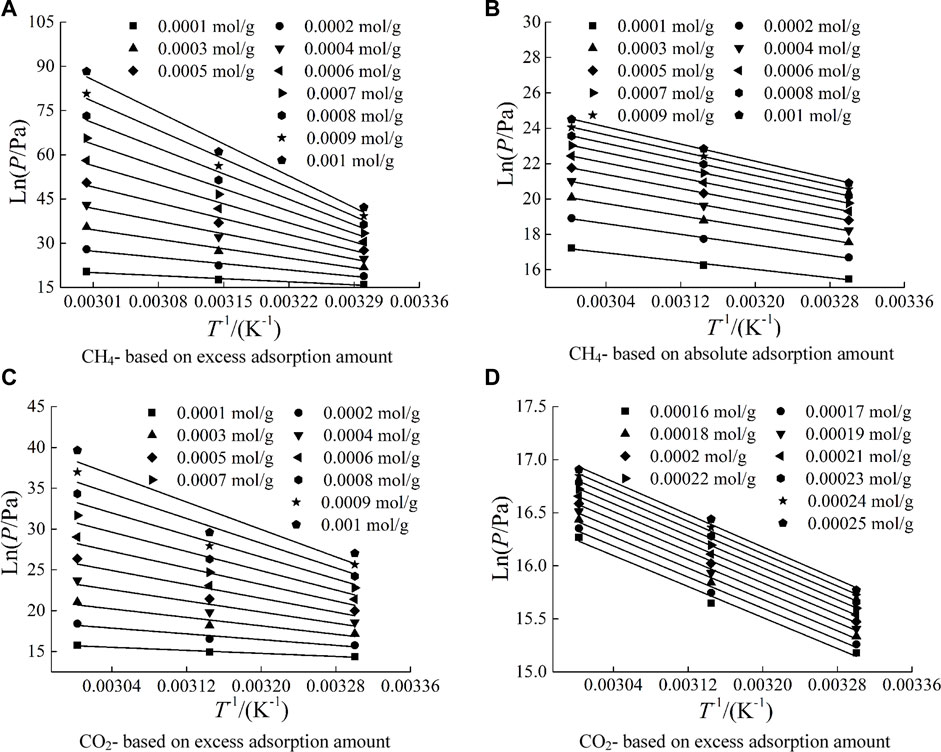
Using Eq.8–9, lnp under several adsorption capacities is calculated, and the data of lnP-T-1 is linearly fitted. The fitting function is
where A and B are fitting parameter。The fitting curves of lnP-T-1 based on different types of adsorption amounts are shown in Figure 8. The fitting results show that the lnp-T-1 data are linear, and linear function fitting correlation coefficient of lnp-T-1 based on absolute adsorption capacity is above 0.98.
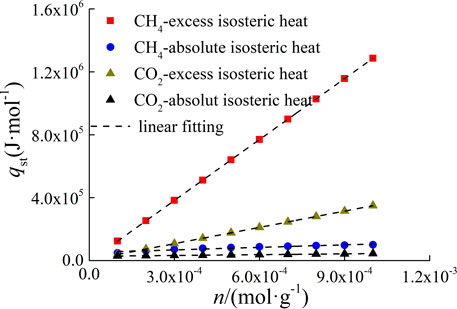
The isosteric heat of adsorption was calculated according to Eq. 7 combined with the slope of lnp-T-1 fitting function. The excess and absolute isosteric heat of adsorption curves of CH4 and CO2 adsorbed by Yanchang Formation shale are shown in Figure 9. The isosteric heat of adsorption of CH4 is greater than that of CO2. The excess isosteric heat of adsorption is obviously greater than the absolute, and as the adsorption amount increases, the difference between them gradually increases. Considering that the absolute adsorption capacity represents the actual adsorption capacity in the adsorption process, it can be considered that the excess isosteric heat of adsorption can not truly reflect the thermodynamic characteristics of the adsorption system. If the excess eat of adsorption is used as the characterization parameter of thermodynamic characteristics, the results of thermodynamic analysis will be higher. Therefore, the absolute adsorption capacity should be used as the basic data for thermodynamic analysis.
The linear function is used to fit the isosteric heat of and adsorption capacity. The linear fitting equation is expressed as,
Where a3, b3 is fitting constant. a3 is intial isosteric heat of adsorption,J/mol. b3 is change rate of isosteric heat of adsorption, J/mol. The linear fitting parameters of isosteric heat and adsorption capacity are shown in Figure 9 and Table 4.
For the adsorption of CH4 on shale, the excess initial adsorption heat is less than zero, which is inconsistent with the fact that the adsorption process is exothermic. Therefore, from the point of view of the rationality of the initial isosteric heat of adsorption, the use of excess adsorption capacity as the basic data of adsorption thermodynamic analysis will cause a negative value of isosteric heat of adsorption in the low adsorption capacity stage, which is contradictory to the exothermic phenomenon of adsorption process. This also shows that the adsorption thermodynamic analysis should be based on the absolute adsorption capacity.
And the calculation results of isosteric heat show that there is a linear positive correlation between the isosteric heat of adsorption and the adsorption amount of CH4 and CO2 adsorbed by shale. There are three kinds of change rules between isosteric heat and adsorption capacity, that is, isosteric heat is constant, with the increase of adsorption capacity increases, it decreases with the increase of adsorption amount. The variation law is affected by the heterogeneity of adsorbent surface and the interaction force between adsorbate molecules. The surface heterogeneity of the adsorbent determines that the adsorbate molecules are preferentially adsorbed at high active sites and then gradually adsorbed at relatively weak active sites, which results in the decrease of adsorption heat with the increase of adsorption amount. The interaction force between adsorbate molecules increases with the increase of adsorption amount, which leads to the increase of adsorption heat (RUTHVEN, 1984). It can be seen that the isosteric heat of adsorption of CH4 and CO2 adsorbed by Yanchang Formation shale is greatly affected by the interaction between gas molecules.
Under the same adsorption system, the initial isosteric heat of adsorption reflects the molecular force between the adsorbent and the adsorbate. The larger the initial isosteric heat, the greater the force of the adsorbent surface to the gas molecules (NODZENSKI, 1998). It can be seen from Table 4 that when n = 0, the absolute initial isosteric heats of CH4 and CO2 adsorbed by shale are 52.04 kJ/mol and 27.71 kJ/mol, respectively, indicating that the adsorption force of CH4 on Yanchang Formation shale is stronger than that of CO2, but this cannot be used to demonstrate the feasibility of replacing CH4 with CO2 in engineering practice. The reason is that the adsorption of CH4 and CO2 by shale in this experiment is carried out independently, while the replacement process in the actual reservoir is carried out on the basis of CH4 molecules adsorbed on the surface of shale. CH4 desorption and CO2 adsorption are carried out at the same time. There is an interaction between CH4 and CO2 molecules, which is reflected in the interaction between desorption heat and adsorption heat.
4 Conclusion
Based on the isothermal adsorption experimental data of CH4 and CO2 adsorbed by continental shale in Ordos Basin, the difference between excess adsorption capacity and absolute adsorption capacity was analyzed. Then, the Clausius-Clapeyron equation was used to study the thermodynamic characteristics of continental shale adsorption based on different types of adsorption capacity, and the reasons for the difference in adsorption performance of CO2 and CH4 by shale were revealed from the thermodynamic point of view.
(1) The absolute adsorption capacity is greater than the excess, the difference between them is affected by temperature, pressure and gas type. The difference decreases with increasing temperature, and increases with increasing pressure, and when the adsorption gas is CO2, the difference between them is larger than CH4.
(2) In the temperature range of 26.85–199.85°C, the adsorption phase density obtained by Ozawa empirical formula and Van der Waals approximation is in the reasonable range of CH4 adsorption phase density.
(3) The thermodynamic analysis of the adsorption process should use the absolute adsorption capacity as the basic analysis data. The reason is that the excess isosteric heat of adsorption has a negative value in the low adsorption capacity stage, which is contradictory to the fact that the adsorption is exothermic. And the excess isosteric heat is significantly higher than the absolute isosteric heat.
(4) There is a good linear positive correlation between the isosteric heat of adsorption and the adsorption amount of CH4 and CO2 adsorbed by continental shale in Ordos Basin, and the isosteric heat of CH4 is greater than that of CO2. The absolute initial isosteric heat of adsorption of CH4 and CO2 adsorbed by shale is 52.04 kJ/mol and 27.71 kJ/mol, indicating that the adsorption force of CH4 on Yanchang Formation shale is stronger than that of CO2.
Data availability statement
The original contributions presented in the study are included in the article/supplementary material, further inquiries can be directed to the corresponding author.
Author contributions
PX is responsible for writing the article. QL and CG are responsible for carrying out isothermal adsorption experiments. JY, SH, and QZ are responsible for drawing.
Conflict of interest
Authors PX, QL, CG, JY, SH, and QZ were employed by the company Shaanxi Yanchang Petroleum (Group) Co, Ltd.
Publisher’s note
All claims expressed in this article are solely those of the authors and do not necessarily represent those of their affiliated organizations, or those of the publisher, the editors and the reviewers. Any product that may be evaluated in this article, or claim that may be made by its manufacturer, is not guaranteed or endorsed by the publisher.
References
Clarkson, C. R., and Haghshenas, B. (2013). “Modeling of supercritical fluid ad-sorption on organic-rich shales and coal,” in SPE Unconventional Resources Conference-USA, The Woodlands Texas, USA, 10-12 April 2013. doi:10.2118/164532-MS
Curtis, J. B. (2002). Fractured shale-gas systems. AAPG Bull. 86, 1921–1938. doi:10.1306/61EEDDBE-173E-11D7-8645000102C1865D
Findenegg, G. H., and Loring, R. (1984). Fluid adsorption up to the critical point. Experimental study of a wetting fluid/solid interface. J. Chem. Phys. 81 (7), 3270–3276. doi:10.1063/1.448036
Gasparik, M., Bertier, P., Gensterblum, Y., Ghanizadeh, A., Krooss, B. M., and Littke, R. (2014). Geological controls on the methane storage capacity in organic-rich shales. Int. J. Coal Geol. 123 (2), 34–51. doi:10.1016/j.coal.2013.06.010
Guo, W., Xiong, W., Gao, S., Hu, Z., Liu, H., Yu, R., et al. (2013). Impact of temperature on the isothermal adsorption/desorption characteristics of shale gas. Petroleum Explor. Dev. 40 (4), 481–485. doi:10.1016/S1876-3804(13)60066-X
Han, S., Tang, Z., Wang, C., Horsfield, B., Wang, T., and Mahlstedt, N. (2022). Hydrogen-rich gas discovery in continental scientific drilling project of songliao basin, northeast China: New insights into deep Earth exploration. Sci. Bull. 67 (10), 1003–1006. doi:10.1016/j.scib.2022.02.008
Hongguan, S., and Jun, Y. (2016). Molecular simulation of CO2/CH4 competitive adsorption in kerogen. J. China Univ. Petroleum 40 (2), 147–154. doi:10.3969/j.issn.1673-5005.2016.02.019
Hu, T., Ma, Z., and Yao, H. (2002). Study on high pressure adsorption isotherms of supercritical methane. Nat. Gas Chem. industry(C1 Chem. Chem. Eng. 27 (2), 36–40. doi:10.3969/j.issn.1001-9219.2002.02.010
Jia, C., Zheng, M., and Zhang, Y. (2012). Unconventional hydrocarbon resources in China and the prospect of exploration and development. Petroleum Explor. Dev. 39 (2), 139–146. doi:10.1016/s1876-3804(12)60026-3
Kim, H. J., Yao, S., He, J., Lee, H. H., and Lee, C. H. (2011). Adsorption characteristics of CO2 and CH4 on dry and wet coal from subcritical to supercritical conditions. Chem. Eng. J. 171 (1), 45–53. doi:10.1016/j.cej.2011.03.035
Kondo, S., Ishikawa, Y., and Abe, I. (2005). Adsorption science. Beijing: Chemical Industry Publishing House.
Li, W., Fang, X., Li, B., and Zeng, F. (2014). Molecular simulaton of the sorption of methane and carbon dioxide in the montmorillonite. J. Northeast Petroleum Univ. 38 (3), 25–30. doi:10.3969/j.issn.2095-4107.2014.03.004
Li, X., Cao, F., Yue, G., Li, Y., and Yu, Q. (2016). The experimental study of adsorption characterisitic of Carboniferous shale in Eastern Qaidam. Earth Sci. Front. 23 (5), 95–102. doi:10.13745/j.esf.2016.05.010
Liang, X., and Li, L. (2021). Geological conditions and exploration potential for shale gas in upper permian wujiaping Formation in the region of Western hubei-eastern chongqing. Petroleum Geol. Exp. 43 (3), 386–394. doi:10.11781/sysydz202103386
Liu, S., Zhong, J., Ma, Y., Yin, C., Liu, C., Li, Z., et al. (2015). Super-critical isothermal adsorption of gas in shale. Coal Geol. Explor. 43 (3), 45–50. doi:10.3969/j.issn.1001-1986.2015.03.009
Lu, Y., Zhou, J., Xian, X., Tang, J., Zhou, L., Jiang, Y., et al. (2021). Research progress and prospect of the integrated supercritical CO2 enhanced shale gas recovery and geological sequestration. Nat. Gas. Ind. 41 (6), 60–73. doi:10.3787/j.issn.1000-0976.2021.06.007
M. E. Curtis, (2010). “Structural characterization of gas shales on the micro and nano-scales,” in SPE Unconventional Gas Conference, Calgary, Alberta, Canada, October 19–21, 2010.
Mehta, S. D., and Danner, R. P. (1985). An improved potential theory method for predicting gas-mixture adsorption equilibria. Industiral Eng. Chem. Fundam. 24 (3), 325–330. doi:10.1021/i100019a008
Meng, Q., Jin, Z., Sun, D., et al. (2021). Geological background and exploration prospects for the occurrence of high-content thydrogen. Petroleum Geol. Exp. 43 (2), 208–216. doi:10.11781/sysydz202102208
Menon, P. G. (1968). Adsorption at high pressures. Chem. Rev. 68 (3), 277–294. doi:10.1021/cr60253a002
Murata, K., El-Merraoui, M., and Kaneko, K. (2001). A new determination method of absolute adsorption isotherm of supercritical gases under high pressure with a special relevance to density-functional theory study. J. Chem. Phys. 114 (9), 4196–4205. doi:10.1063/1.1344926
Nikolaev, K. M., and Dubinin, M. M. (1958). Concerning adsorptional properties of carbon adsorbents3:A study of adsorption isotherm s of gases and vapors on active carbons over a wide interval of temperatures,including the critical region. Bull. Acad. Sci. USSR Div. Chem. Sci. 7 (10), 1124–1133. doi:10.1007/bf00914939
Nodzenski, A. (1998). Sorption and desorption of gases (CH4,CO2) on hard coal and active carbon at elevated pressures. Fuel 7 (11), 1243–1246. doi:10.1016/s0016-2361(98)00022-2
Ozawa, S., Kusumi, S., and Ogino, Y. (1976). Physical adsorption of gases at high pressure. IV. An improvement of the Dubinin—astakhov adsorption equation. J. Colloid Interface Sci. 56 (1), 83–91. doi:10.1016/0021-9797(76)90149-1
Ramirez-Pastor, A. J., and Bulnes, F. (2000). Differential heat of adsorption in the presence of an order–disorder phase transition. Phys. A 283 (1-2), 198–203. doi:10.1016/s0378-4371(00)00152-7
RexerBenhamAplin, T. F. T. M. J. A. C., and Thomas, K. M. (2013). Methane adsorption on shale under simulated geological temperature and pressure conditions. Energy & Fuels 27 (6), 3099–3109. doi:10.1021/ef400381v
Ross, D. J. K., and Bustin, R. M. (2007). Impact of mass balance calculations on adsorption capacities in microporous shale gas reservoirs. Fuel 86 (17/18), 2696–2706. doi:10.1016/j.fuel.2007.02.036
Ruthven, D. M. (1984). Principle of adsorption and adsorption process. New York: John Wiley & Sons, 62–84.
Sui, H., and Yao, J. (2016). Molecular simulation of CH4/CO2 adsorption in clay minerals. J. Northeast Petroleum Univ. 40 (2), 90–98.
Wang, Q., Li, C., Pan, S., and Jiang, J. (2017). A molecular simulation study on the adsorption of CH4 and CO2 on the mineral substances in oil shale. J. Fuel Chem. Technol. 45 (11), 1310–1316. doi:10.3969/j.issn.0253-2409.2017.11.005
Wang, X., Zhai, Z., Xu, J., Wu, S., Li, J., Sun, L., et al. (2016). Molecular simulation of CO2/CH4 competitive adsorption in organic matter pores in shale under certain geological conditions. Petroleum Explor. Dev. 43 (5), 841–848. doi:10.1016/s1876-3804(16)30100-8
Xia, Y., Jin, Y., Cheng, M., and Cheng, K. (2015). Gas flow in shale reservoirs. Chin. Sci. Bull. 60, 2259–2271. doi:10.1360/n972014-01175
Yang, F., Ning, Z., Wang, Q., Liu, H., and Kong, D. (2014). Thermodynamic analysis of methane adsorption on gas shale. J. Central South Univ. Sci. Technol. 45 (8), 2871–2877. doi:10.1117/12.536380
Yang, F., Yue, C., Li, S., Ma, Y., Xu, X., et al. (2017). Adsorption characteristics of CH4 and CO2 on silurian shale in Sichuan Basin. J. Chem. Industry Eng. 68 (10), 3851–3859. doi:10.11949/j.issn.0438-1157.20170488
Zhang, C., Zhou, S., Jing, L., Cheng, K., Sun, Z., Li, P., et al. (2019). Adsorption characteristics of CH4 and CO2 on shale and its application to binary mixture adsorption under high-pressure conditions: A case study of the Longmaxi Formation shale in jiaoshiba area of Sichuan Basin. Geochimica 48 (6), 580–589. doi:10.19700/j.0379-1726.2019.06.006
Zhang, J., Jin, Z., and Yuan, M. (2004). Reservoiring mechanism of shale gas and its distribution. Nat. Gas. Ind. 24 (7), 15–18.
Zhou, L., Ming, L., and Zhou, Y. (2000). Adsorption measurement and theoretical analysis of supercritical methane on high surface area activated carbon. Sci. China 30 (1), 49–56.
Zhou, S. W., Yan, G., Xue, H. Q., Guo, W., and Li, X. (2016). 2D and 3D nanopore characterization of gas shale in Longmaxi formation based on FIB-SEM. Mar. Pet. Geol. 73, 174–180. doi:10.1016/j.marpetgeo.2016.02.033
Zhou, S., Wang, H., Xue, H., Guo, W., and Lu, B. (2016). Difference between excess and absolute adsorption capacity of shale and a new shale gas reserve calculation method. Nat. Gas. Ind. 36 (1), 12–20. doi:10.3787/j.issn.1000-0976.2016.11.002
Zhu, Y., Song, X., Guo, Y., Xu, F., Sun, N., and Wei, W. (2016). High-pressure adsorption characteristics and controlling factor of CH4 and CO2 on shales from Longmaxi Formation, Chongqing, SichuanBasin. Nat. Gas. Geosci. 27 (10), 1942–1952. doi:10.11764/j.issn.1672-1926.2016.10.1942
Zou, C., Yang, Z., Tao, S., Li, W., Wu, S., Hou, L., et al. (2012). Nano-hydrocarbon and the accumulation in coexisting source and reservoir. Petroleum Explor. Dev. 39 (1), 15–32. doi:10.1016/s1876-3804(12)60011-1
Keywords: continental shale, isothermal adsorption, excess adsorption capacity, absolute adsorption capacity, isosteric heat of adsorption
Citation: Xue P, Liang Q, Gao C, Yin J, Hao S and Zhao Q (2023) Thermodynamic analysis of the difference in adsorption characteristics of CH4 and CO2 on continental shale. Front. Earth Sci. 11:1139981. doi: 10.3389/feart.2023.1139981
Received: 08 January 2023; Accepted: 25 January 2023;
Published: 08 February 2023.
Edited by:
Qingqiang Meng, SINOPEC Petroleum Exploration and Production Research Institute, ChinaReviewed by:
Chuanqi Tao, Liaoning Shihua University, ChinaXiangdong Gao, East China University of Technology, China
Copyright © 2023 Xue, Liang, Gao, Yin, Hao and Zhao. This is an open-access article distributed under the terms of the Creative Commons Attribution License (CC BY). The use, distribution or reproduction in other forums is permitted, provided the original author(s) and the copyright owner(s) are credited and that the original publication in this journal is cited, in accordance with accepted academic practice. No use, distribution or reproduction is permitted which does not comply with these terms.
*Correspondence: Pei Xue, Z3dsMzMwQDE2My5jb20=
 Pei Xue
 Quansheng Liang