
95% of researchers rate our articles as excellent or good
Learn more about the work of our research integrity team to safeguard the quality of each article we publish.
Find out more
ORIGINAL RESEARCH article
Front. Earth Sci. , 25 January 2022
Sec. Economic Geology
Volume 10 - 2022 | https://doi.org/10.3389/feart.2022.829322
This article is part of the Research Topic Overpressure in Sedimentary Basins and Petroleum Geomechanics View all 9 articles
 Chao Li1,2
 Likuan Zhang1,2*Xiaorong Luo1,2*Bing Wang3Yuhong Lei1,2Ming Cheng1,2Hongmei Luo4Changjiang Wang4Lan Yu5
Subsurface pore pressure affects the direction of hydrocarbon migration, determines the distribution of the hydrocarbon reservoir, and provides scientific reference for drilling planning. Overpressures are widespread in the Paleogene Shahejie Formation in the Linnan Sag, which is closely related to the distribution of oil reservoir. However, the overpressure generation mechanisms are undefined, let alone the relationship between the evolution of paleo-overpressure and hydrocarbon migration in the Linnan Sag, which brings great challenges for the understanding of oil accumulation and future oil exploration. Basin modeling was carried out to solve the issue of quantitative evaluation of overpressure mechanisms and to restore the overpressure evolution of the Paleogene source rocks. The implications for the pore pressure prediction and oil migration in the Linnan Sag were further discussed. The modeling results show that the disequilibrium compaction of mudstones is a dominated overpressure mechanism of source rocks in the Linnan Sag, which accounts for approximately 90% of the measured overpressure in the region. The remainder part of overpressure was generated by hydrocarbon generation; however, the effects of hydrocarbon generation on overpressure evolution were limited in the intervals deeper than 4000 m. The significance of the overpressure mechanism is that the porosity-dependent method will give a satisfactory pressure prediction result in the current exploration depth range (3800–4300 m). The overpressure evolution of the source rock has undergone a cycle of “accumulation-dissipation-reaccumulation,” which corresponds to the age of 45.5–24.0 Ma (Es3-Ed period), 24.6–14.0 Ma (Ed period), and 14.0–0 Ma (Ng-Qp period). The oil potential of the Es3l shows good inheritance with the overpressure in the source rock, indicating overpressure increased the driving force for oil migration. The oil released from the source rock has a trend to migration from the center of the sag to the uplift belt, which is also indicated by the physical properties of crude oil. The knowledge of the generation and evolution of overpressure has great significance for further exploration in the Linnan Sag and other extensional basins.
Abnormal pore pressure in the basins is closely related to the formation of hydrocarbon reservoirs, including generation, migration, accumulation, preservation of hydrocarbon, and even reservoir diagenesis (Hunt, 1990; Osborne and Swarbrick, 1997; Hao et al., 2007; Stricker et al., 2016; Feng et al., 2019; Li et al., 2021). The analysis about temporal and spatial distribution of overpressure in the perspective of historical can improve the knowledge on the hydrocarbon migration and accumulation. Therefore, the identification of generation mechanisms and construction of the evolution history of overpressure are key issues of hydrocarbon migration and accumulation dynamics (Borge, 2002; Luo et al., 2007; Chan et al., 2016; Radwan et al., 2019; Nifuku et al., 2020; Li et al., 2022).
Researchers have accepted that disequilibrium compaction and fluid expansion (especially gas generation) are two most common reasons for large-scale overpressure in extensional basins (Luo and Vasseur, 1992; Osborne and Swarbrick, 1997; Ruth et al., 2004; Tingay et al., 2013). However, the contributions and implications of different overpressure mechanisms are still unclear in basins. Although the logging responses of overpressured intervals can be used to distinguish the main overpressure mechanisms (Bowers, 2002; Katahara, 2006; Lahann and Swarbrick, 2011; Zhang, 2013; Li et al., 2021), the quantitative evaluation of a specific overpressure mechanism other than disequilibrium compaction cannot be performed. Basin modeling is an important tool for overpressure research; numerical models have been established to describe almost all overpressure mechanisms, making it possible to determine the overpressure mechanisms and their contributions at the same time (Wangen, 2001; Bolås et al., 2004; Madon, 2007; Nguyen et al., 2016; Qiu et al., 2020; Radwan, 2021).
In addition to mudstone compaction curves, fluid inclusion PVT simulation and basin modeling are widely used to restore the evolution of pore pressure (Magara, 1978; Aplin et al., 1999; Bolås et al., 2004; Qiu et al., 2020). Owing to the irreversibility of mudstone compaction, the paleo-pressure at the maximum burial depth can be calculated using sonic data (Magara, 1978). The PVT simulation gives the pressure at the period when the fluid inclusion has been trapped (Aplin et al., 1999). Each of these methods has advantages and limitations, but the common one is that they can only determine the paleo-pressure at a certain period, rather than the evolution history. Basin modeling provides an effective means to reproduce the complete evolutionary history of pore pressure and allows one to test different scenarios under which overpressure is developed. 2D and 3D modeling can reveal the impact of lateral and vertical flow on the dissipation of the overpressure through the formations (Gutierrez and Wangen, 2005; Hantschel and Kauerauf, 2009; Luo and Vasseur, 2016; Ashrafi et al., 2020).
Linnan Sag is a secondary unit of the Huimin Depression, the Paleogene Shahejie Formation is the major source rock and the important reservoir, and the widespread overpressure in the Shahejie Formation has attracted researchers’ attention. In general, the knowledge on the main mechanism and prediction of overpressure in the Linnan Sag are still superficial; studies mainly focused on the description of the measured pressure, the PVT simulation, and logging responses to overpressure (Liu, 2011; Li and Liu, 2013; Wang et al., 2018; Li et al., 2019). Although researchers had realized that the disequilibrium compaction and hydrocarbon generation are the main overpressure mechanisms (Wang et al., 2018; Li et al., 2019), the quantitative contribution of different overpressure mechanisms has not been evaluated, which restricts the accuracy of pre-drilling pressure prediction and the accurate understanding of overpressure distribution. More importantly, the pore pressure evolution, a key factor determining the oil migration and accumulation, has never been concerned, which limits the exploration of lithologic oil reservoirs. Thus, determining the mechanism of overpressure and restoring the overpressure evolution are key issues in the Linnan Sag.
In this study, geological models are established; the geological, geophysical, and geochemical data in the study area are integrated; and the PetroMod (V2012) software is used to quantitatively restore the paleo-pressure evolution history. Step-by-step modeling is carried out for each well, the first step is only considering disequilibrium compaction, and then, the disequilibrium compaction and hydrocarbon generation are considered at the same time. Based on the modeling results, the mechanisms of overpressure in the source rock were quantified; the implications on pressure prediction and dynamics conditions of hydrocarbon accumulation were explored. The coupling relationship between paleo-pressure evolution and oil migration is expected to lay a foundation for deepening the study of the oil accumulation mechanism in the study area.
The Linnan Sag is located in the southwest of Huimin Depression, Bohai Bay Basin (Figures 1A,B), and is further divided into three secondary structural units: the Central Uplift Belt, the Linnan Subsag, and the South Slope Belt (Figure 1C). The Linnan Sag is controlled by the Linshang Fault in northern edge and the Xiakou Fault in southern edge (Figure 1C), and shows an asymmetric half-graben with a faulted northern side and an overlapped southern side (Figure 1D). The Linnan Sag is the main source kitchen of the Huimin Depression, the distributions of hydrocarbon traps are controlled by faults, and lithologic reservoirs and structural-lithologic reservoirs are the main exploration objects in the Linnan Sag.
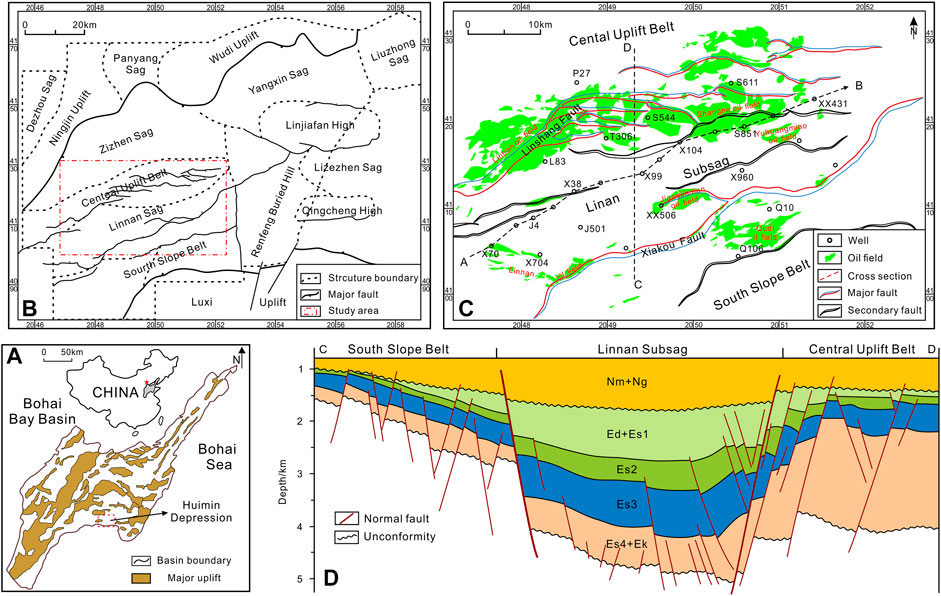
FIGURE 1. Division of structural units and well distribution of the Linnan Sag. (A) The structure of the Bohai Bay Basin and the location of the Huimin Depression. (B) Structural units of the Huimin Depression. (C) Tectonic setting of the Linnan Sag with the locations of wells. (D) Schematic north–south geologic cross section of the Linnan Sag.
The Cenozoic tectonic movement in the Linnan Sag can be identified as five stages (Feng and Ye, 2018): the initial rifting stage (65.0–46.0 Ma), the intense rifting stage (46.0–38.0 Ma), the shrinking rifting stage (38.0–24.6 Ma), the uplift stage (24.6-14.0 Ma), and the subsiding stage (14.0–0.0 Ma). The sag was uplifted during the Dongying movement (24.6–14 Ma), which produced the unconformity between the Paleogene and Neogene sequences.
The Cenozoic strata in the Linnan Sag comprise the Paleogene Shahejie Formation (Es) and Dongying Formation (Ed), the Neogene Guantao Formation (Ng) and Minghuazhen Formation (Nm), and the Quaternary Pingyuan Formation (Qp) (Figure 2). The Es formation is divided into four parts, which are labeled, respectively, as Es4, Es3, Es2, and Es1 from the bottom to top. The thickness of the Es4 encountered by drilling is usually less than 200 m, which mainly consists of brown siltstone and fuchsia mudstone, and is further divided into the bottom part (Es4l) and top part (Es4u). The Es3 is dominated by semi-deep lacustrine sediments with a thickness of 300–1200 m, which consists of the lower part (Es3l), middle part (Es3m), and upper part (Es3u). The Es3l is mainly black shale and gray mudstone intercalated with gray sandstone; the main lithology of the Es3m is gray sandstone and mudstone; and the deposits of Es3u are dark-gray siltstone and gray mudstone. The Es2 and Es1 deposited in similar environment; Es2 is composed of conglomerate, sandstone, and mudstone; and Es1 is mainly calcareous sandstone and gray mudstone. Ed is composed of grayish-green mudstone, and sandstone with interbedded siltstone; Ng and Nm are mainly composed of sandstone with interbedded mudstone; Qp is made up of variegated loess and unconsolidated conglomerate.
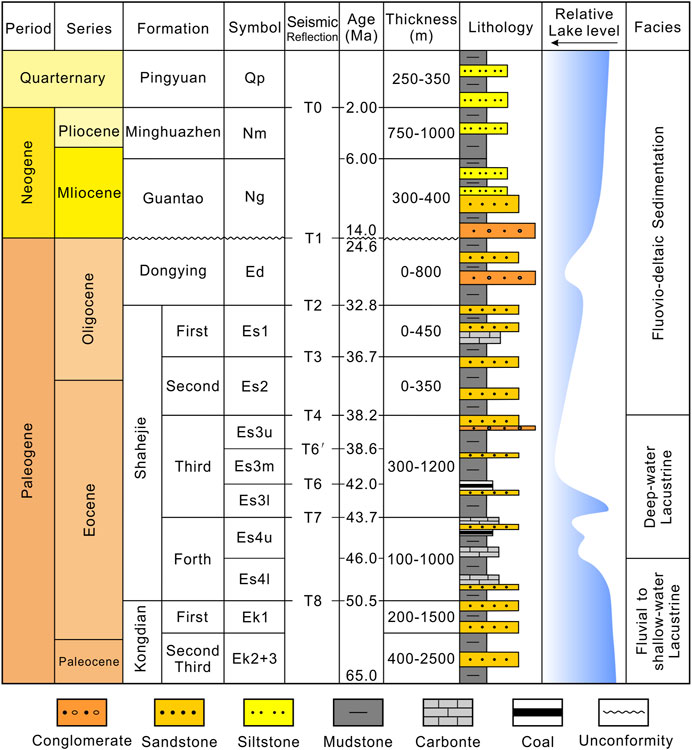
FIGURE 2. Schematic Cenozoic stratigraphy of the Linnan Sag, showing the symbols, age, thickness, and mainly lithology of each formation.
The widely distributed lacustrine mudstones and shales in Es3l are the dominant source rocks with an average total organic carbon content (TOC) of 1.55%, and the organic matter is mainly type II1 (Guo et al., 2009). The reservoirs are mainly composed of conglomerate and sandstone in the Es4, Es3, and Es2 formations. Paleogene mudstones, which are more than 200 m and show strong sealing capacity, play a role of regional caprocks.
The measured pressures were used to describe the characteristics of subsurface overpressure and served as constraints for overpressure modeling and pore pressure prediction. We collected the original drill stem testing (DST) report from Shengli Oilfield Company (SINOPEC) to extract the measured reservoir pressure. The original DST data were filtered to eliminate the unreliable pressures due to low permeability of the perforated interval, local mud invasion, and oil production (Li et al., 2019), and finally, 304 high-confidence DST data were obtained. In addition to the DST data, the mud weights were converted to equivalent pore pressure (MUD) and treated as an approximation of pore pressure in intervals where DSTs are not performed. The pore pressure is defined as normal pressure when the pressure gradient varies between 9.0 and 11.0 MPa/km.
The logging data were obtained from over 30 wells with overpressure, including gamma ray (GR), acoustic transit time (AC), density (DEN), resistivity (RT), neutron (CNL), and borehole diameter (CAL) logs. Quality control was performed to eliminate fluctuations in the logging curves due to facies changes and mineral composition variations in continental sedimentary basins (Li et al., 2019). The shale volume (Vsh) was calculated with the Larionov formula (Paleogene) from GR logs and applied to develop unique compositional lithologies as an input. Porosity values were calculated from density logs, and the calculated porosity values were delivered as the input values to the porosity–depth relationships to describe the compaction behaviors of the unique lithologies in basin modeling and were used as calibration of the modeling results. Moreover, the overpressure generation mechanisms are identified on the physical properties of shale samples that were separated based on the Vsh values. And finally, the appropriate pressure prediction method was determined to estimate the magnitude of pore pressure in the Es formation.
Shengli Oilfield Company friendly provided seismic profiles and relative seismic structure interpretation. We selected a typical through-well seismic section marked AB profile which crosses the whole of the Linnan Sag to carry out basin modeling. The boundaries of different formations are explained seismically, and the seismic sections are converted into structural profiles based on the time–depth relationship, and key horizons are constrained by well data (Figure 3). However, in the deeper part of the sag, almost no well penetrated the formation, and the interpretation was based only on seismic data. The 3D seismic structure interpretation results provide structural contours for each set of formation, and the results are used to build the 3D geological model.
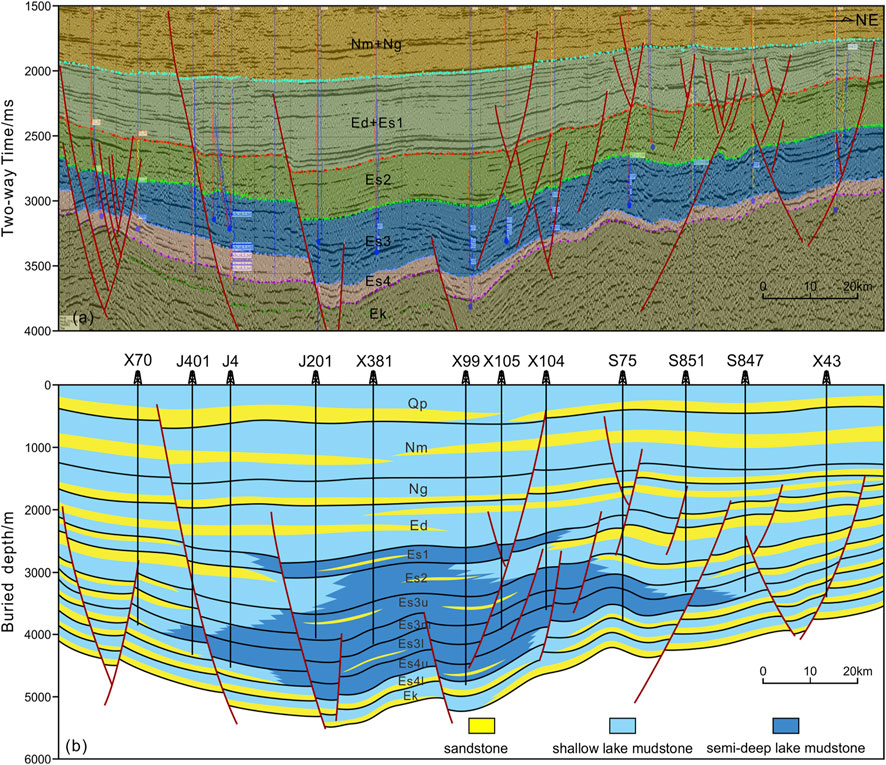
FIGURE 3. Interpreted seismic section showing the structural framework of the study area. (A) The seismic section through the study area. (B) The structural and lithology interpretation of the cross section. It is assumed that wellhead fluctuations are neglected considering the elevation is less than 20 m in the Linnan Sag. The location of the section is shown in Figure 1.
The PetroMod software package fully integrates seismic, stratigraphic, and geological interpretations into multidimensional simulations of temperature–pressure field, fluid flow, and petroleum migration in sedimentary basins. According to the stripping inversion method to reproduce the geological processes such as tectonic evolution, sedimentary filling, fluid migration, and thermal and pressure evolution, PetroMod provides the evolution of geological events at each output time (Hantschel and Kauerauf, 2009). Many studies have used PetroMod to quantitatively evaluate the mechanism of overpressure (Broichhausen et al., 2005; Hantschel and Kauerauf, 2009; Nguyen et al., 2016; Mosca et al., 2018; Li et al., 2021). The detailed numerical functions of different overpressure generation mechanisms in PetroMod can be found in the study by Hantschel and Kauerauf (2009). The pore pressure modeling includes five stages: start with the data collection, quality control and data summarizing, calculation process, model verification till the final model interpretation, and recommendations (Hantschel and Kauerauf, 2009; Radwan et al., 2020). The main input parameters and steps are highlighted in the following part.
Despite simplifications always being abound in regional modeling efforts, the temperature, pore pressure, and even locations of hydrocarbon in basins are satisfactorily reproduced. For the present geological model, these simplifications include the following: 1) a simplified structural model, where detailed fault trends and properties, and fractures present in Linnan Sag were not accounted for; 2) the lithological assignment was simplistic but realistic, where a lateral facies variation was introduced to better approximate the distribution of reservoir facies, the drainage areas, and the migration pathways. No lateral or vertical facies changes were considered for individual stratigraphic units, except for the main intervals.
The basin geometry and main sequences in the Linnan Sag are represented by 15 structural maps derived from seismic interpretation. The evolution history is divided into a series of events, and each stage represents the time period span over which sedimentation or uplifting occurs. These maps correspond to the top or base of the main stratigraphic sequences, and the age of events ranges from the Paleogene to the present. The ages of each formation and events are derived from the International Chronostratigraphic Chart (Table 1).
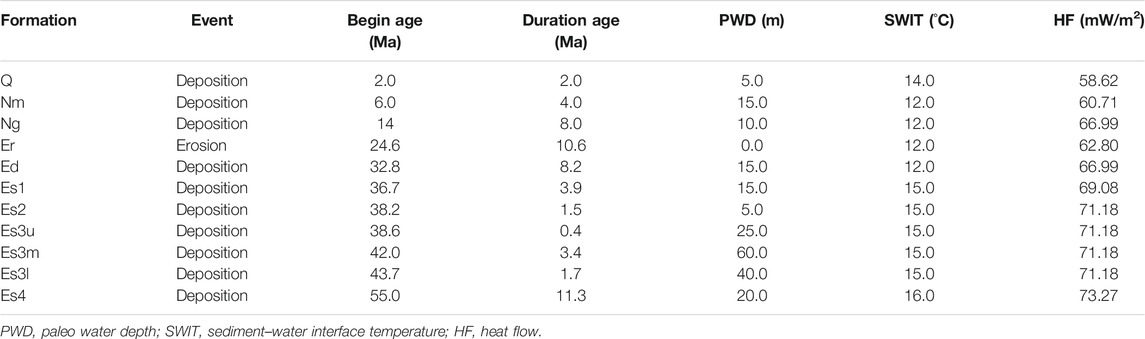
TABLE 1. Geological framework and boundary condition used in the basin modeling of the Linnan Sag (modified from Wang (2019)).
Combining the logging data, cores, and previous research results, the lithology is set separately for the 2D and 3D geological models. Lithologies of each formation in wells are distinguished based on core sample information; in areas where no wells are revealed, the lithology distribution is inferred based on the interpretation of sedimentary microfacies. Overall, five sedimentary facies were identified in the Linnan Sag, which include semi-deep lake, shallow lake, delta plain, delta front, and turbidite fan facies (Figure 4) (Chang, 2007; Liu, 2015; Lin et al., 2016; Cao et al., 2017). The average content of each lithology is calculated as a percentage for mixed lithologies in a single formation, and the properties of the lithologies in the simulations are summarized in Table 2.
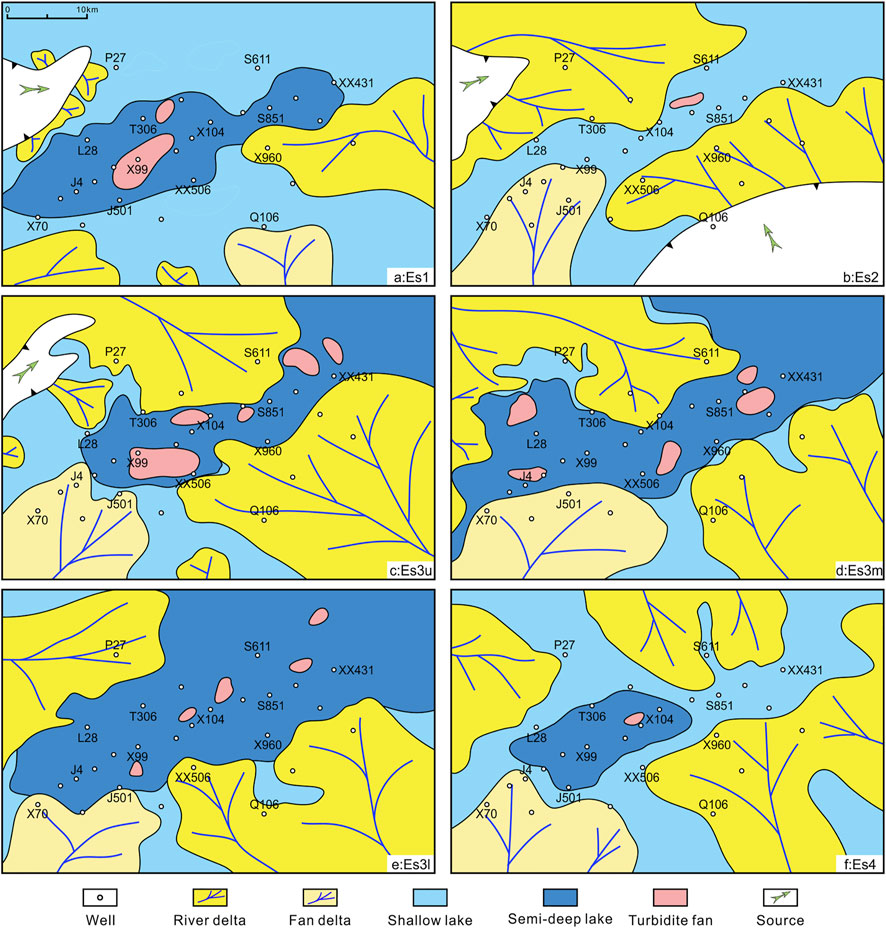
FIGURE 4. Representative sedimentary facies distribution of different formations in the Linnan Sag (modified from Chang, 2007; Liu, 2015; Lin et al., 2016; Cao et al., 2017). The lithologies have been assigned according to the different sedimentary facies.
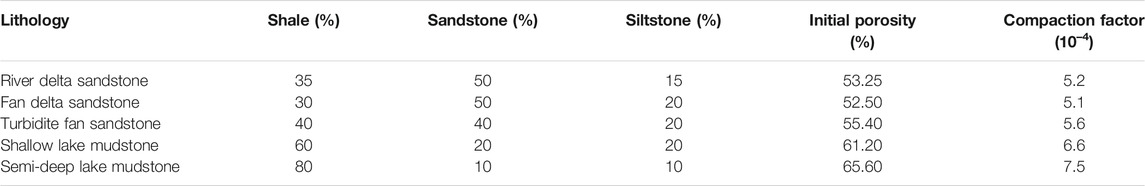
TABLE 2. Lithostratigraphy, physical, and thermal properties of sedimentary sequences defined in the model.
Input parameters used in basin modeling include the predominant petrophysical property (porosity, compaction behavior), erosion time and thickness, boundary conditions, TOC and hydrogen index (HI) values for source rock, and kinetic models of hydrocarbon generation.
The compaction parameters (surface porosity and compaction coefficient) are the main factors affecting fluid flow and pore pressure development in formations, and are also the basis for calculating porosity, permeability, and density of formations during the buried process. These properties were extracted from the built-in software library and used according to the sediment type present in the model and porosity evolution over time due to compaction. The surface porosities of mudstone, sandstone, and siltstone are 70, 40, and 55%, respectively, and the corresponding compaction coefficients are 8.0 × 10⁻⁴, 3.0 × 10⁻⁴, and 5.0 × 10⁻⁴ (Hantschel and Kauerauf, 2009). The compaction parameters of the mixed lithology are obtained according to the weighted average of the composition of three components (Table 2). The porosity–depth relationship is expressed by the Athy function, and the porosity–permeability relationship is described by the Kozeny–Carman formula (Hantschel and Kauerauf, 2009).
One key aspect of the burial history is the reconstruction of the erosion history; the age and thickness of erosion events are important for restoring the pressure evolution of the basin (Luo and Vasseur, 1995). The Linnan Sag were uplifted and eroded during the period of 24.6–14 Ma, and researchers have carried out a detailed study on the erosion event in the study area (Jiang et al., 2008). Overall, the erosion thickness varies from 180 to 780 m; the smallest value is in the center of the sag and gradually increases toward the uplift (Guo, 2012).
The PWD curve was modified based on previous studies, which was revealed by obtaining the distribution characteristics of sedimentary structures, paleontological sets, and ecology and wave-base surfaces (Table 1). The HF history of the Linnan Sag revealed the surface HF values from different ages. Since Paleocene, the HF decreased gradually from 75 mW/m2 to 58 mW/m2 (Table 1) (Qiu et al., 2006; Su et al., 2006). The HF is calibrated against corrected bottom temperature and measured vitrinite reflectance. The SWIT is the upper boundary condition of heat transfer in basins, which varies from 12°C to 16°C in the Linnan Sag (Table 1).
The type of organic matter, TOC, and HI of source rocks are important parameters for the simulation of maturity and hydrocarbon generation. Three groups of source rocks with different rock properties are developed in the Linnan Sag, including E1, E3, and E4u. The geochemical parameters of source rocks are defined by statistical analysis from the results of previous studies (Zeng, 2006; Guo et al., 2009). The TOC of the Es1 is between 0.5 and 4.9%, with an average of 1.26%, and the value of Es3 is between 0.4 and 7.1%, with an average of 1.55%; the TOC of Es4 is between 1.1 and 1.3%. According to the results of the whole-rock pyrolysis analysis, the main types of kerogen in the Linnan Sag are type II, and the HI is between 300 and 600 mg/g (Table 3).
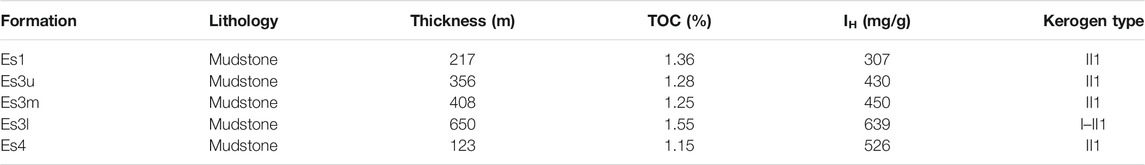
TABLE 3. Types and content of organic matter in each of the source rocks (modified from Guo et al. (2009)).
The transformation of kerogen to hydrocarbon during burial of source rocks proceeds through a series of quasi-irreversible reactions controlled by first-order chemical kinetics; the published kinetics model can be used to describe the hydrocarbon generation (Hantschel and Kauerauf, 2009). Based on the pyrolysis experimental results of source rock samples around the world, Burnham (2017) constructed kinetic models for different kerogen types, named Burnham TII and Burnham TIII kinetic models. We did not perform a pyrolysis experiment on the source rocks in the Linnan Sag. However, analyzing the hydrocarbon component data by referring to previous studies indicated that the source rock properties and the hydrocarbon expulsion rules were a good fit for the Burnham TII kinetic model (Zeng, 2006). The EASY% Ro model is used to simulate a mature history (Hantschel and Kauerauf, 2009).
The available DST data are plotted depending on the stratigraphy to show the vertical overpressure distribution. The measured pressures in the Es2 and Es1 members are mainly normal pressures (Figure 5A). The pressures in the Es3 and Es4 members are different above and below 3,000 m; it is mainly hydrostatic in the upper part but shows coexistence of overpressure and normal pressure in the lower part. The pressure gradient in Es3 is mainly from 9.0 to 16.2 MPa/km, and overpressure is 0–24 MPa and concentrated at 3,000–4,300 m (Figure 5B). While the pressure gradient in Es4 ranges from 9.0 to 14.3 MPa/km, overpressure varies from 0 to 14 MPa and mainly occurs at approximately 3,000–4,000 m (Figure 5C).
FIGURE 5. Plots of measured pressures versus depth for Shahejie Formation in the Linnan Sag. (A) Es1-Es2, (B) Es3, and (C) Es4.
The acoustic transit time, density, and neutron logging data from mudstone sections can be used to analyze the characteristics of mudstone compaction and the logging responses to overpressure (Zhang, 2013; Radwan et al., 2020; Li et al., 2021). Considering the measured pressure, mud weight, and quality of logging data, well X99 and well T306 in the Linnan Sag were selected to reveal the pressure characteristics.
The top of the overpressure zone is interpreted at 3,600 m, and the overpressure is mainly concentrated in Es3l and Es4u. The variations in the overpressure are reflected well in the logging responses; the sonic and neutron logs gradually decrease with depth above 3,600 m, while the density increases, all three logs exhibit no anomalies with depth, suggesting the mudstone is normally compacted (Figure 6A). The log curves deviate from the normal compaction trend (NCT) approximately below 3,600 m, the sonic and neutron logs are higher than the values for the NCT, while the density is lower than that at the same depth. The uniformly deviating well log curves reflect obvious undercompaction characteristics of mudstones (Figure 6A).
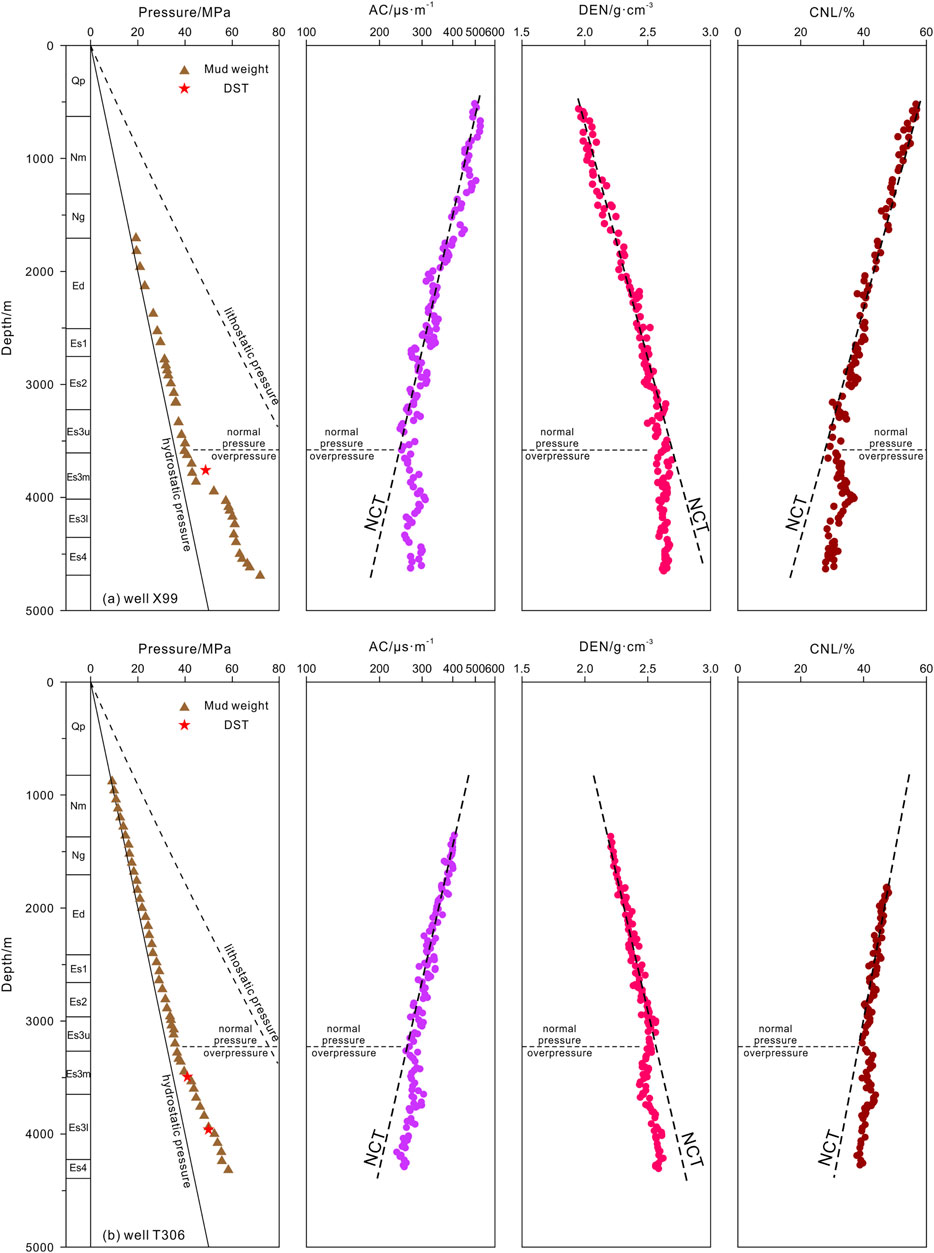
FIGURE 6. Profiles of the well logging parameters of mudstone to overpressure of (A) well X99 and (B) well T306, including mud weights and DSTs data, sonic transit time (AC), density (DEN), and neutron (CNL) logs. The well locations are shown in Figure 1.
The equivalent pressure and the measured pressure reflect overpressure developed from 3,300 m in well T306 (Figure 6B). The mudstones are normally compacted above 3,300 m, and all three log responses obey the NCTs. However, the sonic, density, and neutron logs of mudstone deeper than 3,300 m deviate from the NCTs, showing abnormally higher sonic and neutron values than those for the normal compaction trend and lower density, reflecting undercompaction (Figure 6B).
Calibration is a fundamental step for numerical modeling to achieve realistic results in accordance with available data even when well data do not exist. When the simulated results deviate the measured obviously, we must adjust the boundary conditions and parameters until we get a satisfied simulation result, and parameters must be kept consistent across all models. At least three recommended parameters must be involved in the calibration, including temperature, maturity, and pore pressure.
The bottom hole temperature values were acquired from DST reports; core-based vitrinite reflectance data have been used as maturity proxy to constrain the thermal and maturity modeling results. If the modeling results do not conform to the measured data, the original HF values are adjusted during the subsequent model operation. Profiles of modeled Ro versus depth for the four wells calibrated with measured data are presented in Figure 7. In general, there is a good fit between modeled and measured data although some discrepancies occur.
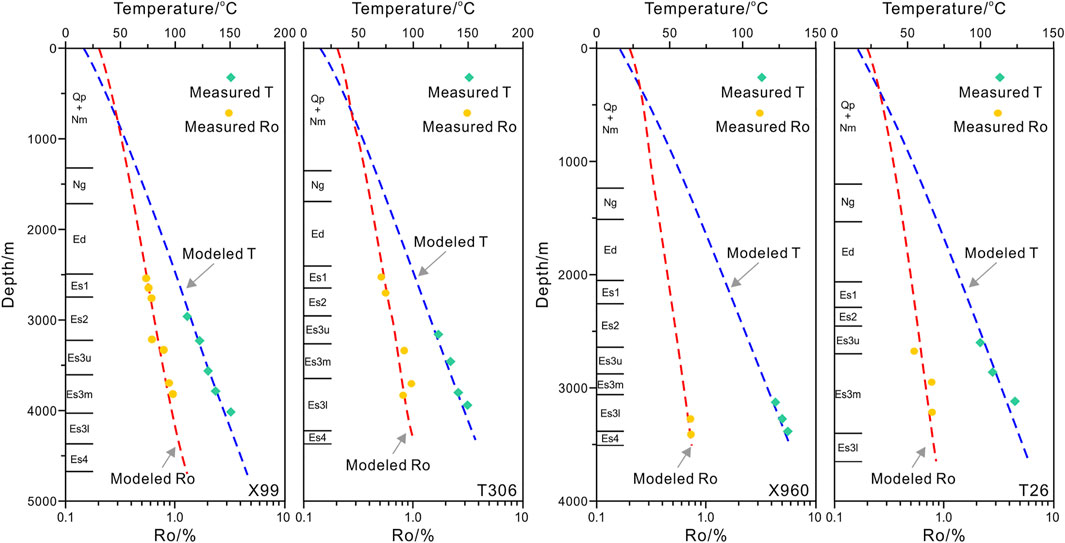
FIGURE 7. Calibration of thermal and maturity modeling for four wells in the Linnan Sag showing good correlations between the measured and calculated values. The well locations are shown in Figure 1.
The development of pore pressure in mudstone is inherited and continuous, and not affected by drainage or charging. Under condition of without fluid flow, the pore pressure in sandstone is approximately equal to the pressure in adjacent mudstone (Luo et al., 2000). The DST data are used to test the final modeling results, and the modeled pore pressure coupling with the main overpressure generation mechanisms in the source rock (disequilibrium compaction and hydrocarbon generation) shows a high degree of agreement with the measured pressure (Figure 8A).
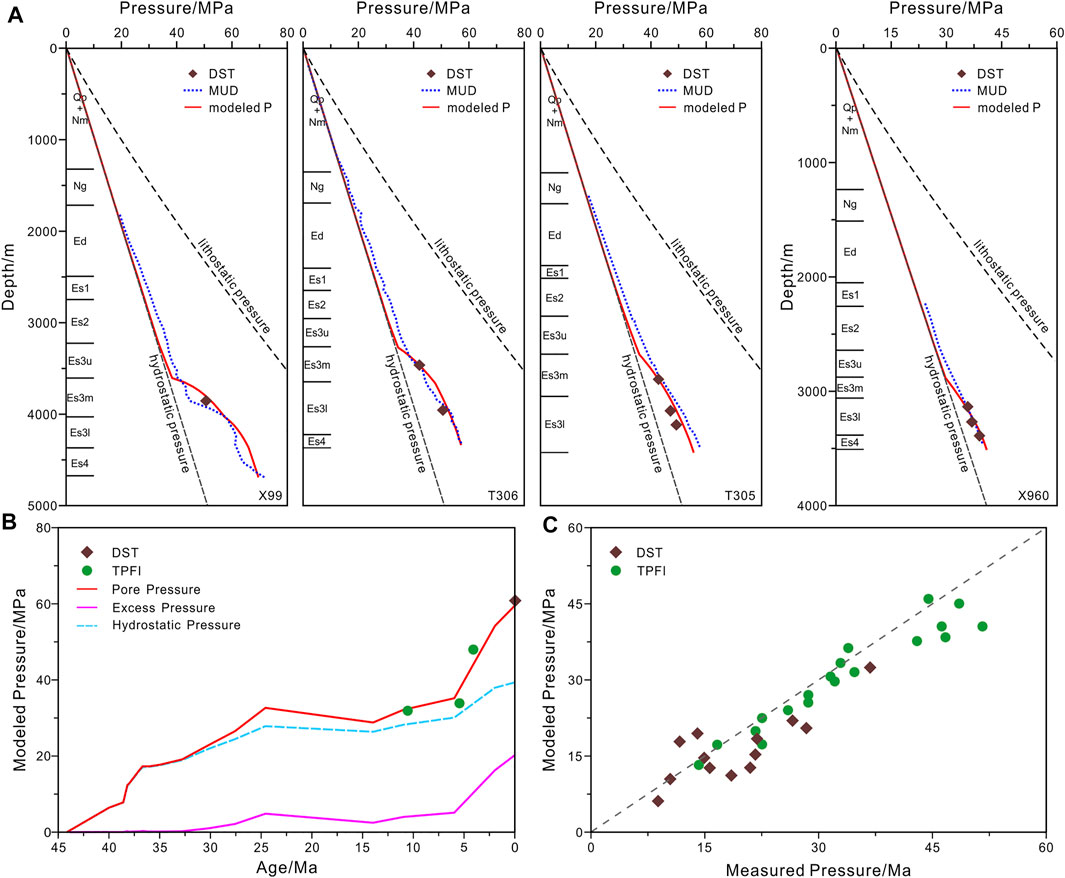
FIGURE 8. Calibration of pore pressure modeling in the Linnan Sag showing good correlations among the measured pressures, fluid inclusion pressures, and modeled pressures. (A) Calibration of pore pressure modeling for four wells in the Linnan Sag. (B) The evolution of pore pressure and calibration results. (C) The comparison of the DST, TPFI, and modeled pressures of Es3l. The well locations are shown in Figure 1.
The trapping pressures of fluid inclusions (TPFI) reflect the paleo-pressure of sandstones during hydrocarbon accumulation, and are also important calibration data required for pressure evolution modeling (Aplin et al., 1999). Researchers have carried out lots of studies on fluid inclusion PVT simulation in the study area; the homogenization temperature and TPFI were sourced from published results (Zeng, 2006; Li and Liu, 2013). The trapping time of fluid inclusions is confirmed by a comparison between the homogenization temperature and modeled temperature. The TPFI obtained by PVT simulation can be used to calibrate the paleo-pressure. Through the calibration, we can not only get the modeling results agree with the present pore pressure but also the paleo-pressure evolution can be determined by constraining the simulation results at different times (Figure 8B).
Comparing the measured pressures, the TPFI and the modeled pressures of Es3l indicated that the modeled pressures are in good agreement with the calibration pressures (DST data and TPFI), indicating that the existing geological model meets the needs of the quantitative evaluation of pore pressure and the evolution process (Figure 8C).
According to the tectonic evolution history of the Linnan Sag, six time periods (32.8, 24.6, 14, 6, 2, and 0 Ma) were selected to show the evolution of paleo-overpressure in sections and planes.
The selected section crosses through the center of the Linnan Sag from east to west, and is parallel to the structural trend of the sag. Figure 9 shows the evolution of the overpressure since 32.8 Ma; obviously, three stages can be summarized as follows:
1) Initial overpressure accumulation period (45.5–24.6 Ma; Es-Ed deposition period): The pore pressure maintains hydrostatic pressure until Ed deposition. The deposition rate of the Es formation exceeds 550 m/Ma in the center, and it is over 1000 m/Ma for Ed, which led to disequilibrium compaction of mudstones, and then the overpressure began to occur (Figure 9A). At the end of the Ed deposition, the source rock started to mature, which increases overpressure, and the overpressure reached a maximum value at 24.6 Ma at this stage (Figure 9B).
2) Overpressure dissipation period (24.6–14.0 Ma, end of Ed deposition period): During this period, the Linnan Sag was uplifted because of regional tectonic movement, and the sag was eroded by 180–780 m. The erosion causes overpressure decrease, overpressure accumulated in the early stage was dissipated noteworthy, but it did not reduce to zero, and the center of the sag still retains weak overpressure (Figure 9C).
3) Late pressure accumulation period (14.5-0 Ma, Ng deposition period: now): The continuous burial leads to the increase of burial depth and thermal evolution of the source rocks since the deposition period of Ng (Figures 9D,E). Disequilibrium compaction and hydrocarbon generation resulted in overpressure to increase continuously. Until now, the overpressure reached the maximum value, and it is up to approximately 23 MPa in the center. The mudstone content decreases and the burial depth becomes shallower from the center of the sag to the south gentle slope, and the overpressure is less than 10 MPa, while the geological conditions of the northern uplift belt do not fit to overpressure development (Figure 9F).

FIGURE 9. Modeling results showing the overpressure evolution of a cross section in the Linnan Sag. (A) 32.8 Ma, (B) 24.6 Ma, (C) 14.0 Ma, (D) 6.0 Ma, (E) 2.0 Ma, (F) 0.0 Ma. The location of the section is shown in Figure 1.
It is worth noting that this study focuses on the generation and evolution of overpressure in the source rock. Since the fault activities in the study area are not clear (Wang et al., 2020), the influence of fault on overpressure in the permeable formation was not discussed. However, according to previous research, it is speculated that the effects of fault on the overpressure were limited in the permeable sand bodies. Unless the fault is opening currently, the impacts of the faults on the pressure can be negligible (Luo et al., 2000; Luo et al., 2003).
The Es3l is the main source rock in the study area and the main overpressure development interval, and the 3D pressure modeling results are shown using Es3l as an example (Figure 10). Clarifying the overpressure development characteristics of the Es3l is useful for judging the direction of underground oil migration and the most likely accumulation location.
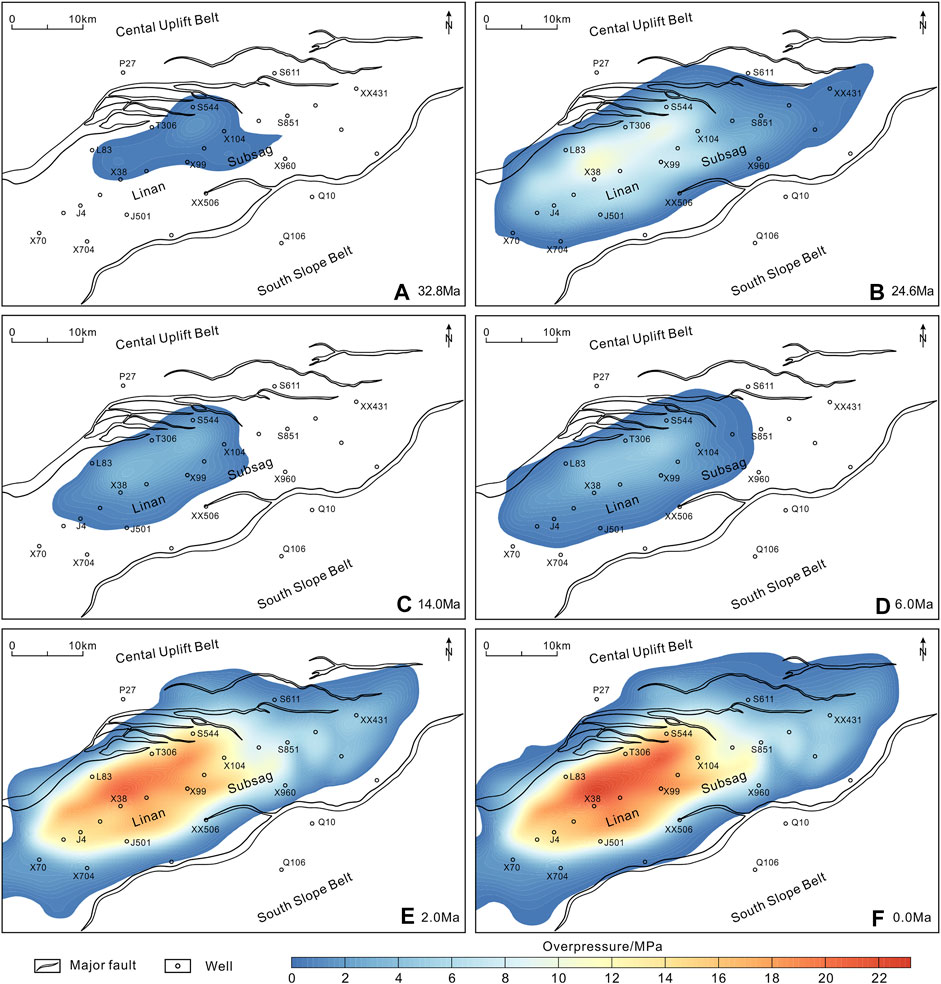
FIGURE 10. Evolution of the overpressure of Es3l in the Linnan Sag obtained from 3D basin modeling results. (A) 32.8 Ma, (B) 24.6 Ma, (C) 14.0 Ma, (D) 6.0 Ma, (E) 2.0 Ma, (F) 0.0 Ma.
At 32.8 Ma, the overpressure developed in the center of the sag is only about 2 MPa (Figure 10A). The higher sedimentary rate during 32.8-24.6 Ma leads to the disequilibrium compaction of mudstones, and then overpressure starts to occure and the maximum value is about 8 MPa in the central of the sag (Figure 10B). The Dongying movement leads to the erosion in the sag between 24.6 and 14.0 Ma, which results in the overpressure dissipation obviously; only 1–2 MPa remain in the center of the sag at the end of the uplift event (Figure 10C). From 14 Ma to present, the Linnan Sag entered a quickly subsidence period. Owing to the fast deposition and the maturity of the organic matters, the overpressure in the source rock increased rapidly till now (Figures 10D–F).
The thickness of the mudstone and the maturity of organic matters are the main factors to determine the overpressure. The geologic setting in the center is the most favorable place for the development of overpressure; the overpressure center shows that it consists of the center of the sag. At present, the maximum overpressure occurred in the X99-X381 well zone, which is also the depocenter. The largest overpressure exceeds 20 MPa, and the overpressures decrease gradually from the center of the sag to both the north and south, and approach hydrostatic pressure in the uplift belts (Figure 10F).
Since different overpressure mechanisms determine the differences in pressure evolution and prediction methods, it is necessary to determine the contribution of every overpressure mechanism.
Mudstone sonic and density logging data have been widely utilized to distinguish different overpressure mechanisms (Ruth et al., 2004; Lahann and Swarbrick, 2011; Tingay et al., 2013; Li et al., 2021). Figure 11 shows the sonic transit time–density cross plots from two wells in the Linnan Sag, which clearly distinguish the two types of overpressuring mechanisms. The overpressure points with buried depth less than 4000 m basically plot on the loading curve, which indicates that the overpressures are only generated by disequilibrium compaction (Figure 11). Furthermore, the overpressure points with depths greater than 4,000 m fall on the unloading curves, which manifested as density is maintained stable, whereas the sonic transit time increases sharply, indicating overpressures generated by both disequilibrium compaction and fluid expansion (Figure 11). Since these points that deviate from the loading curve are from source rocks in the center of the sag, the overpressure associated with unloading characteristics may be related to fluid expansion caused by source rock maturation (Li et al., 2019).
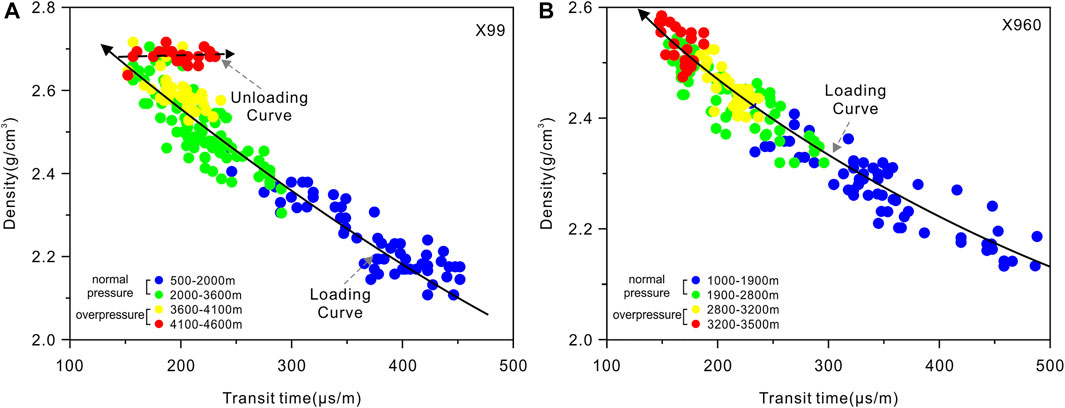
FIGURE 11. Sonic transit time versus density cross plots for well (A) X99 and well (B) X960 in the Linnan Sag. The well locations are shown in Figure 1.
To determine the quantitative contribution of the disequilibrium compaction and hydrocarbon generation, three wells distributed in different structural units were selected. Taking the principle of single-variable modeling, that is, for the same well, first only disequilibrium compaction is considered, the pore pressure was modeled; then the disequilibrium compaction and hydrocarbon generation are considered at the same time. When the results of the two modeling are compared, the quantitative contribution of each of overpressure mechanisms can be obtained.
Figure 12 shows the quantitative evaluation results of three wells, where the solid line represents the overpressure evolution trend including two mechanisms of mechanical compaction and hydrocarbon generation, and the dotted line represents the overpressure evolution caused only by mechanical compaction. Therefore, the difference between those two series of models reflects the contribution to overpressure of hydrocarbon generation (Figure 12). The modeling results show that during the evolution of pressure in well X99 in the center of the sag, it has been accompanied by pressurization of hydrocarbon generation since 32.8 Ma to the present, but the overpressure is relatively low. The calculation results show that disequilibrium compaction contributes over 90% to overpressure, while the contribution of hydrocarbon generation to overpressure is less than 10%. Similarly, disequilibrium compaction contributes over 93% to overpressure in well T306, which is located in the central uplift belt, and the hydrocarbon generation contribution rate never exceeds 7%. However, the hydrocarbon generation in well X960, a well located in the southern slope belt, contributes almost 0% to overpressure (Figure 12).
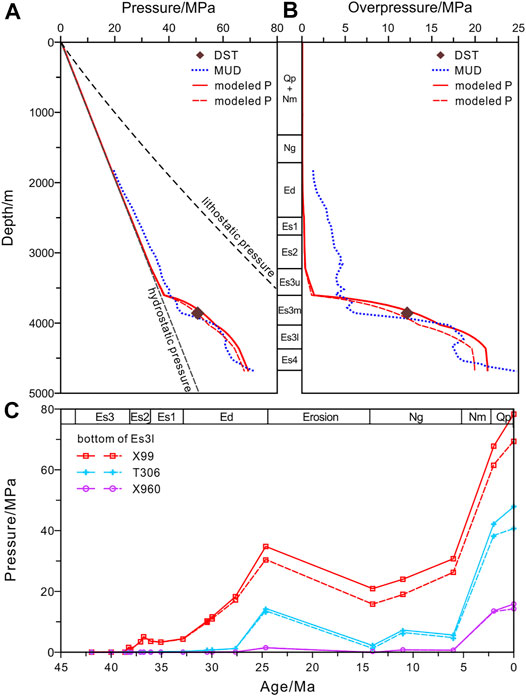
FIGURE 12. Modeling results of different overpressure mechanisms in the Linnan Sag. (A) The modeled pore pressure in well X99. (B) The modeled overpressure in well X99. (C) Pore pressure evolution for three wells in the Linnan Sag. The solid lines are the excess pressure with hydrocarbon generation, and the dashed lines are without hydrocarbon generation. The well locations are shown in Figure 1.
Overall, the TOC of the source rocks in the Linnan Sag is less than 1.5% and Ro does not exceed 1.2%, so the liquid hydrocarbons are mainly produced from organic matter. Our modeling results and the existing research results (Luo and Vasseur, 1996; Osborne and Swarbrick, 1997; Li et al., 2021) indicated that the hydrocarbon generation in the study area is not enough to cause obvious pressure increase. Both the qualitative identification of the overpressure mechanisms and the quantitative evaluation results of numerical modeling confirmed that the overpressure in the Es formation in the Linnan Sag was mainly caused by the disequilibrium compaction; the hydrocarbon generation contribution was limited, and it mainly existed at source rocks with depth exceeding 4000 m.
The logging response in the overpressure interval can be used to predict the pore pressure (Bowers, 2002; Zhang, 2011). Reliable pore pressure prediction depends on the understanding of the origin of the overpressure, and the changes in rock physical characteristics relate to the overpressure mechanisms (Sayers et al., 2002; Ruth et al., 2004; Tingay et al., 2013). For the overpressure caused by disequilibrium compaction, standard pore pressure prediction techniques based on porosity can be used, such as the equivalent depth method (Zhang, 2011). Since the quantitative evaluation results confirmed that the disequilibrium compaction is the main overpressure mechanism in the Linnan Sag, we have confidence to try to predict the overpressure in the Linnan Sag based on the equivalent depth method.
Three wells were selected to compile mudstone compaction curves, and then the pore pressure prediction was carried out using the equilibrium depth method (Figure 13). The following are the pressure prediction results of three wells located in the center of the sag (X99), the southern slope (XX960), and the central uplift (T306). The results show that the top of the overpressure zone is approximately 3,600 m in the middle of Es3m in well X99. The pore pressure increases with depth but with a return prediction pressure at the boundary of Es3l and Es4u. The prediction overpressure is mostly 5–20 MPa, and the maximum value is approximately 23 MPa, corresponding to a depth of approximately 4,615 m. There is good agreement between the predicted results from the well logging data and the measured pressure from DSTs, except that the mud weight is slightly higher than the prediction pressure in the interval of 4,150–4,250 m; the pressure prediction results are credible as whole (Figure 13A). Well T306 has a shallow depth of 3,300 m for the top of the overpressure zone, which corresponds to the top of Es3m. The overpressure is about 3–11 MPa, which is slightly lower than that for X99. Similarly, the measured pressure is in good agreement with the predicted values (Figure 13B). Owing to the slow deposition rate, lower mudstone content, and shallow burial depth, it is unfavorable for the formation and preservation of overpressure in the south slope zone. The measured pressure and predicted pressure in well XX960 show a lower magnitude of overpressure (Figure 13C).
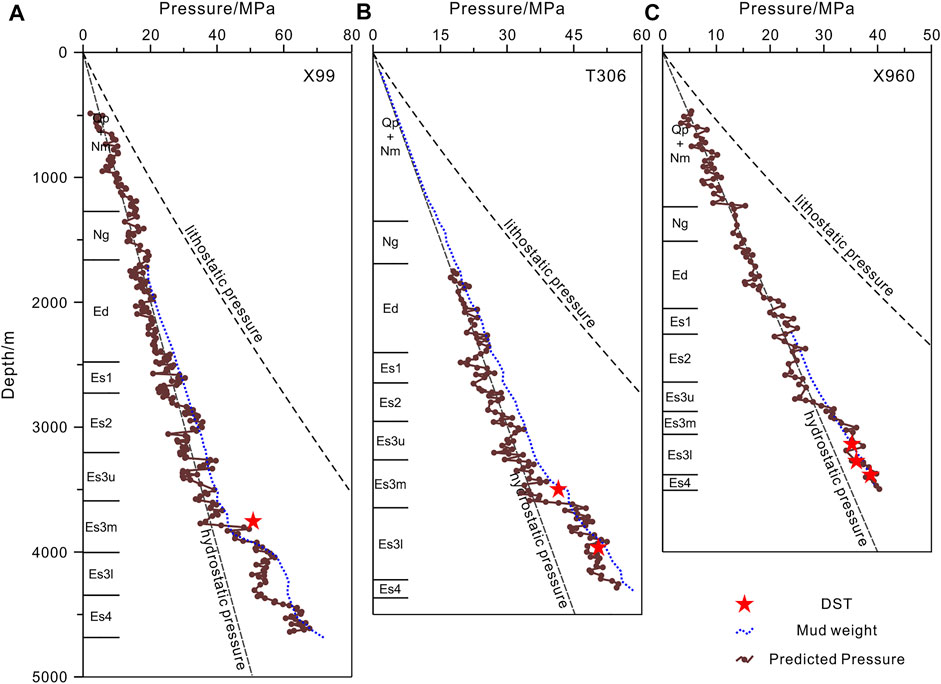
FIGURE 13. Pore prediction results of mudstones using the equivalent depth method in the Linnan Sag for well (A) X99, (B) T306, and (C) XX960. The measured pressures and mud weights are also shown for comparison. The well locations are shown in Figure 1.
The well consistency between the predicted pressure and the measured pressure confirmed that the contribution of hydrocarbon generation is limited, and will not bring obvious errors for pressure prediction in current exploration depth ranges (approximately 4,000–4,500 m). But the contribution of the hydrocarbon generation should be given sufficient attention in the further oil exploration. Especially, when the depth exceeds 4500 m, the porosity-based prediction method will underestimate the pore pressure because the pore pressure may be affected by hydrocarbon generation (especially gas generation). Therefore, for deep oil exploration (≥4500 m), the pore pressure must be carefully predicted to configure an appropriate mud density and reduce drilling risks.
The generation and evolution of overpressure provides a snapshot of how the overpressure affects fluids moving through the petroleum system. Therefore, the recognition of the origin and distribution of overpressure will also contribute to the understanding of the hydrocarbon migration and accumulation processes, and will guide potential exploration.
The process of hydrocarbon generation of the Es3l source rock was reconstructed; the oil generation has a positive relation with the source rock maturation. The source rock in the Es3l reached the low maturity stage (Ro: 0.5–0.7%) at 36 Ma, and the hydrocarbon generation threshold was approximately 2,500 m (Figure 14A). The first stage hydrocarbon generation lasted until the erosion event started at 24.6 Ma (Figure 14B). The second stage started at 14 Ma after the erosion and continued to present. The Ro value exceeds 1.0% at a depth of 4,000 m. Presently, Ro is less than 1.1%, indicating that liquid hydrocarbons are the main products of the source rock (Figure 14B).
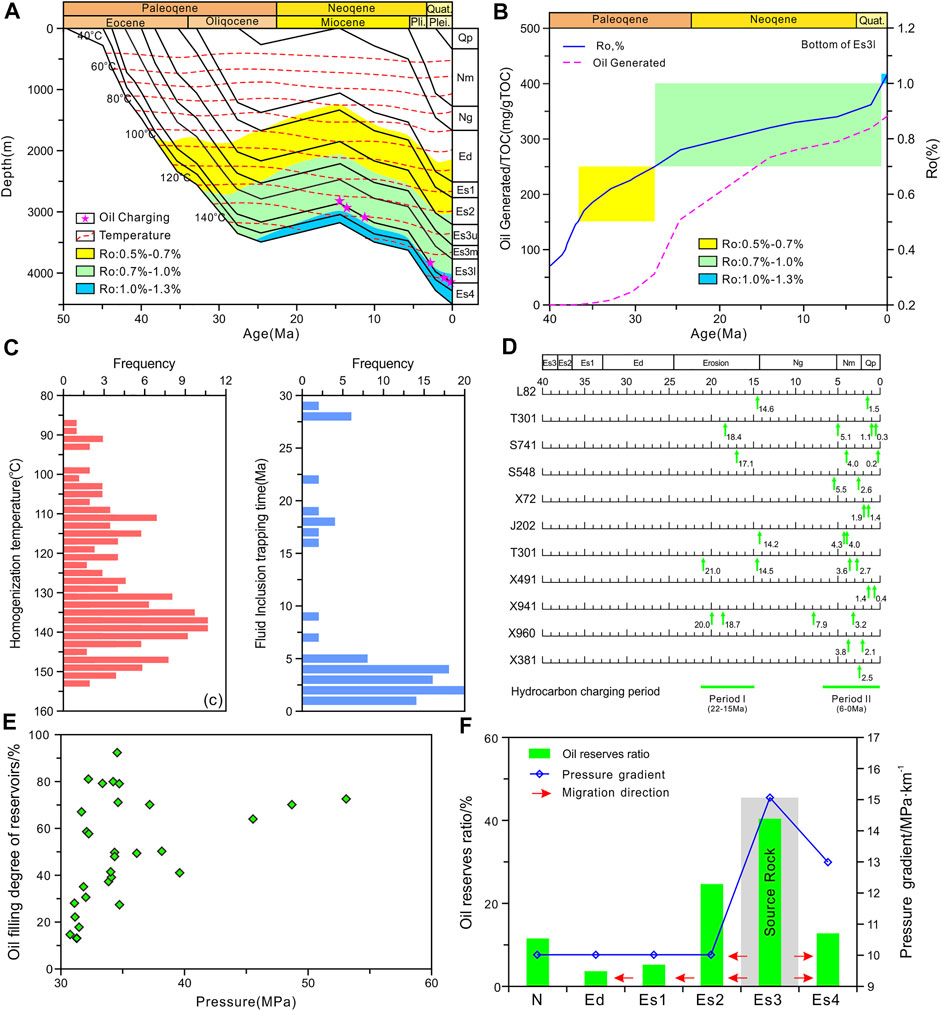
FIGURE 14. Hydrocarbon generation and expulsion of the Linnan Sag. (A) Maturation and burial history of X99. (B) History of oil generation from theEs3l source rock (Es3l). (C) The homogenization temperature and trapping time of fluid inclusions. (D) Hydrocarbon accumulation stages and charging periods of wells in the Linnan Sag. (E) The relationship between pore pressure and oil filling degree of reservoirs. (F) The relationship between overpressure and oil reserves ratio of the Linnan Sag (modified from Jiang et al. (2016)).
The fluid inclusion analysis technique is used widely in the orientation of hydrocarbon pool forming, and the homogenization temperature indicates the temperature of reservoir forming and fluid injection in the Linnan Sag (Liu et al., 2008; Zeng, 2006; Li and Liu, 2013). The fluid inclusion analysis of core samples from wells shows the main homogenization temperature range is between 130°C and 145°C, and another secondary group of results gather around 105°C and 120°C (Figure 14C). When combined with the burial and temperature history map, the oil reservoir forming period can be limited between 22 Ma and 15 Ma, and the second filling process started from 6 Ma to now (Figure 14D).
The pore pressures corresponding to the two charging phases are different in the Linnan Sag. During the first oil charging phase, the burial depth and the amount of hydrocarbon generation of the source rock were smaller than those of the second oil charging stage, and the pressure gradient was less than 12.5 MPa/km. Since 14 Ma, the source rocks entered the second stage of hydrocarbon generation, and the overpressure gradually increased. The pressure gradient was as high as 15.5 MPa/km, which greatly exceeded the value corresponding to the first phase of oil charging.
The oil filling degree of reservoirs, a factor that reflects the accumulation of oil (Feng et al., 2019), shows a trend of increasing with the overpressure (Figure 14E). In addition, the lenticular sand bodies in Es3 source rocks show the highest oil reserve ratio (Figure 14F). The overpressure difference between Es2 and Es3 is greater than that of other formations, which promote the oil to prioritize migration into Es2 so that the oil reserves in Es2 are much than those in other formations in the Linnan Sag (Figure 14F). The author speculates that the overpressures in source rocks play a driving role in accelerating the oil migration and accumulation in the sandstone reservoirs.
Oil in basins always flows from a high potential energy zone to a low energy zone, ultimately being accumulated in traps, where the hydrocarbon potential energy is minimum (Hunt, 1990). During oil migration, the hydrocarbon potential energy mainly depends on buoyancy, hydrodynamic force, and capillary pressure, where the capillary pressure always can be ignored (Luo, 2003). Based on the oil potential calculation model, the modeling pore pressures of Es3l are converted to oil potential, and the distribution of oil potential in source rocks at the main charging period is restored.
The oil potential of the Es3l is consistent with the distribution of overpressure, shows highest values in the center of the sag, and decreases around the uplift units (Figure 15). The oil potential also increased rapidly with the burial depth and overpressure gradually increasing since 6Ma (the main oil accumulation period). The maximum oil potential in the center of the sag reaches 39 × 103 J/kg at present, which is higher than 29 × 103 J/kg under hydrostatic pressure. The oil migration directions are perpendicular to the oil potential contours and diverge from the subsag with relatively high potential to the surrounding zones with relative low potential (Figure 15).
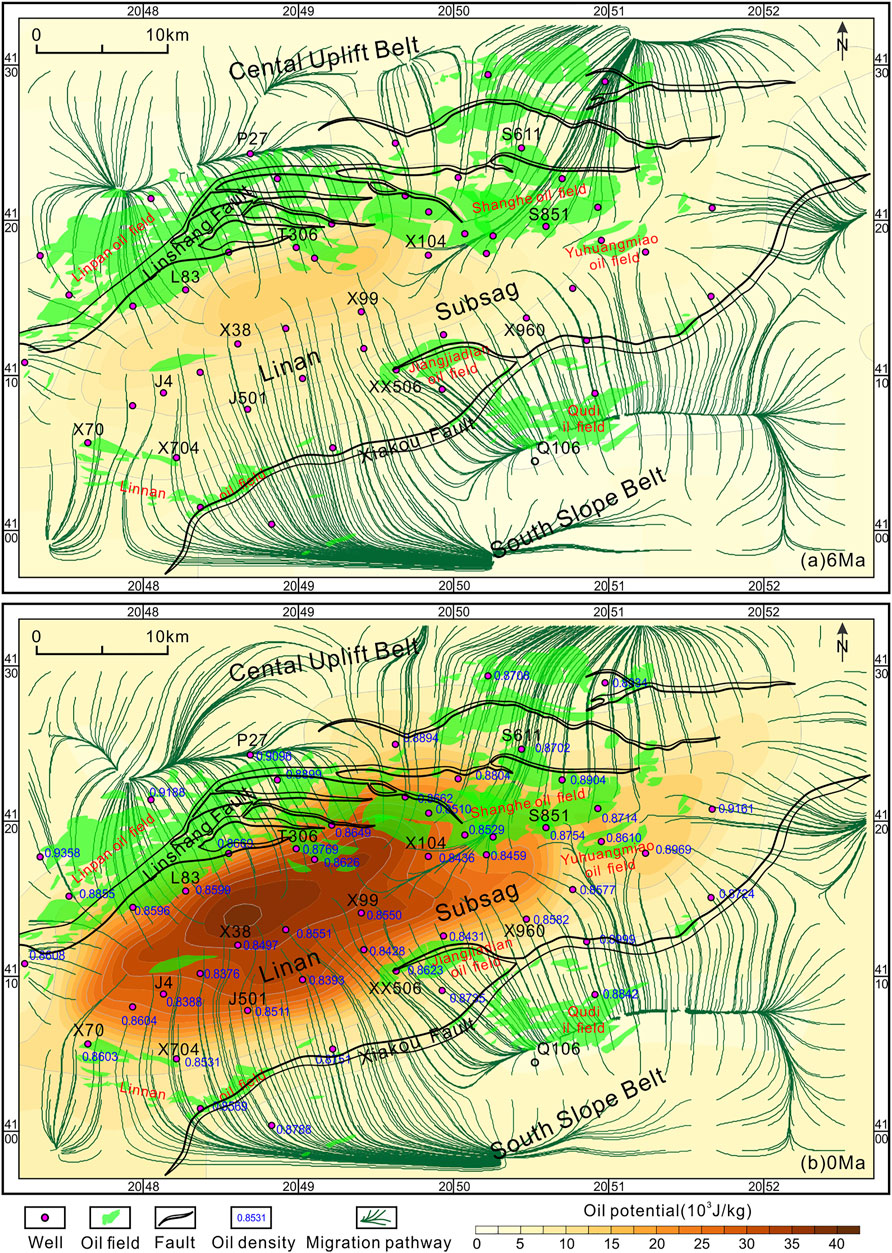
FIGURE 15. Oil potential at the main oil accumulation period of (A) 6 Ma and (B) 0 Ma in the Es3l carrier bed. The modeled oil migration pathways and locations of oil field in the Linnan Sag are also superposed.
The model assumes that the positions of hydrocarbon migration pathways in carrier beds are controlled by the morphology of the reservoir surface and overpressure without taking into consideration the influence of physical property variations in the carrier beds and the effect of faults sealing on oil migration. However, when comparing the migration pathway and the discovered oil field, we can see that the oil potential distribution has successfully predicted the oil migration in the Linnan Sag (Figure 15). It should be noted that the predicted favorable zones cover only a small amount of hydrocarbon accumulations found to date, whereas more hydrocarbons were trapped in the migration pathways, suggesting a great exploration prospect in the Linnan Sag.
Except for a few oil fields (Qudi Oilfield) which are located at the lowest oil potential zone, the other oil fields that have been discovered are not at the lowest oil potential zone, but are located in the slope zone where the migration pathway flowed. The reason maybe that the oil potential is not the only factor controlling the formation of oil reservoirs, accumulation of oil is generally controlled by the oil potential, but it is also affected by the connectivity of sand bodies and fault activities. The activity intensity and the vertical sealing of the faults played great roles in the hydrocarbon distribution in the Linnan Sag. During the main hydrocarbon charging period, the weak activity and strong vertical sealing restricted the occurrence of vertical migration around the Xiakou Fault, while the relatively strong movement and weak vertical sealing resulted in multilayer hydrocarbon accumulations around the Linshang Fault (Wang et al., 2020).
The direction of oil migration can also be reflected in the changes in physical properties of crude oil. The density of crude oil produced in the center of the sag is between 0.83 and 0.85 g/cm3, which is lower than that around the Linnan Sag. The slope and uplift zones farther from the hydrocarbon generation center have a higher density, most of which is above 0.87 g/cm3 (Figure 15B). The density of crude oil in the Linnan sag increases with the increase in the migration distance, suggesting that the 3D migration modeling is a powerful tool to reduce exploration risks in this area.
This study carried out basin modeling to quantify the overpressure mechanisms, restore the evolution of paleo-overpressure of the source rocks, and discuss the implications on pressure prediction and dynamic conditions of hydrocarbon accumulation. The main conclusions of the study can be summarized as follows:
1) The main mechanism of overpressure in the Paleogene source rock in the Linnan Sag is the disequilibrium compaction of rapidly buried mudstone, and the contribution rate of pressurization exceeds 90%. However, the hydrocarbon generation plays a secondary role to overpressure in the intervals with a temperature of 140–150°C and a Ro value of 0.9–1.1%, and the contribution rate is generally less than 10%.
2) The overpressure in the Es3l interval experienced a cycle of early low-amplitude overpressure accumulation period (Es1-Ed deposition period), overpressure dissipation period (end of the Ed deposition period), and overpressure reaccumulation period (Ng deposition period: now). The overpressure is currently in the highest value stage, which is mainly distributed in the center of the sag. The maximum overpressure is approximately 23 MPa and decreases to the slope zone, and it is normal pressure at the uplift zone.
3) Considering that the main cause of the overpressure in the Linnan Sag is the disequilibrium compaction of the mudstone, the porosity-based prediction method can roughly predict pressure accurately in the current exploration depth range in the Linnan Sag. It will not lead to obvious errors in predicted pressure when neglecting the proportion of hydrocarbon generation to overpressure in a depth range of 4000–4300 m.
4) The existence of overpressure at a period of main oil charging significantly changed the distribution pattern of the oil potential field and effected the oil migration. Based on the evolution of pressure, the history of oil migration and accumulation has been restored since the Ng-Nm period; the oil potential showed a ring-shaped decline from the deep center to the surroundings, which has promoted the migration of oil.
The original contributions presented in the study are included in the article/Supplementary Material; further inquiries can be directed to the corresponding authors.
CL provided the main conceptual ideas and wrote the manuscript; CL, LZ, and BW designed research and analyzed the results; XL worked on technical details and revised the manuscript; YL and MC helped with the sampling and data analysis; HL, CW, and LY validated and curated the data. All authors contributed to the article and approved the submitted version.
This study was supported by the National Natural Science Foundation of China (42030808 and 42102176), the National Science and Technology Major Project (2017ZX05008-004), and the Strategic Priority Research Program of the Chinese Academy of Sciences (XDA14010202).
HL and CW were employed by the SINOPEC Shengli Oilfield Company, and LY was employed by the company SINOPEC.
The remaining authors declare that the research was conducted in the absence of any commercial or financial relationships that could be construed as a potential conflict of interest.
All claims expressed in this article are solely those of the authors and do not necessarily represent those of their affiliated organizations, or those of the publisher, the editors, and the reviewers. Any product that may be evaluated in this article, or claim that may be made by its manufacturer, is not guaranteed or endorsed by the publisher.
The study would not have been possible without the support from Shengli Oil Company of China Petroleum and Chemical Corporation. We thank Shengli Oil Company for permission to publish this work. Editor Radwan A.E. and two reviewers are appreciated for their critical comments and insightful suggestions, which significantly improve the quality of this work.
Aplin, A. c., Macleod, G., Larter, S. R., Pedersen, K. S., Sorensen, H., and Booth, T. (1999). Combined Use of Confocal Laser Scanning Microscopyand PVT Simulation for Estimating the Composition Andphysical Properties of Petroleum in Fluid Inclusions. Mar. Pet. Geology. 16, 97–110. doi:10.1016/S0264-8172(98)00079-8
Ashrafi, T., Saberi, M. H., and ZareNezhad, B. (2020). 1D and 2D basin Modeling, in Evaluating the Hydrocarbon Generation-Migration-Accumulation Potential, at Coastal Fars Area, Southern Iran. J. Pet. Sci. Eng. 195, 107594. doi:10.1016/j.petrol.2020.107594
Bolås, H. M. N., Hermanrud, C., and Teige, G. M. G. (2004). Origin of Overpressures in Shales: Constraints from basin Modeling. Bulletin 88, 193–211. doi:10.1306/10060302042
Borge, H. (2002). Modelling Generation and Dissipation of Overpressure in Sedimentary Basins: an Example from the Halten Terrace, Offshore Norway. Mar. Pet. Geology. 19, 377–388. doi:10.1016/S0264-8172(02)00023-5
Bowers, G. L. (2002). Detecting High Overpressure. The Leading Edge 21, 174–177. doi:10.1190/1.1452608
Broichhausen, H., Littke, R., and Hantschel, T. (2005). Mudstone Compaction and its Influence on Overpressure Generation, Elucidated by a 3D Case Study in the North Sea. Int. J. Earth Sci. (Geol Rundsch) 94, 956–978. doi:10.1007/s00531-005-0014-1
Burnham, A. K. (2017). Global Chemical Kinetics of Fossil Fuels: How to Model Maturation and Pyrolysis. Cham: Springer.
Cao, Y. C., Wang, S. J., Wang, Y. Z., Yang, T., Zhang, S. M., and Zhang, H. N. (2017). Sedimentary Characteristics and Depositional Model of Slumping Deep-Water Gravity Flow Deposits: A Case Study from the Middle Member 3 of Paleogene Shahejie Formation in Linnan Subsag, Bohai Bay Basin. J. Palaeogeogr. 19, 419–432. doi:10.7605/gdlxb2017.03.032
Chan, B. B., Meisling, K. E., and Graham, S. (2016). Basin and Petroleum System Modelling of the East Coast Basin, New Zealand: a Test of Overpressure Scenarios in a Convergent Margin. Basin Res. 28, 536–567. doi:10.1111/bre.12121
Chang, X. C. (2007). Formation Mechanism and Occurrences of Lithological Petroleum Reservoirs of Es3 in Linnan Sag. Dissertation Thesis. Qingdao(China): Shandong University of Science and Technology. doi:10.7666/d.D301413
Feng, D.-X., and Ye, F. (2018). Structure Kinematics of a Transtensional basin: An Example from the Linnan Subsag, Bohai Bay Basin, Eastern China. Geosci. Front. 9, 917–929. doi:10.1016/j.gsf.2017.05.012
Feng, Y., Liu, H., Song, G., Yuan, F., Li, J., and Jiang, Z. (2019). Relationship between Decreased Pressure Gradient and Reservoir Filling Degree of Paleogene in Bonan Sag. J. Pet. Sci. Eng. 180, 615–630. doi:10.1016/j.petrol.2019.04.038
Guo, X. L., Xiong, M., Zhou, Q., Tian, H., and Xiao, X. M. (2009). Petroleum Generation and Expulsion Kinetics: A Case Study of the Shahejie Formation Source Rocks from Linnan Sag of Huimin Depression. ACTA Sedmentologica SINICA 27 (4), 723–731. doi:10.14027/j.cnki.cjxb.2009.04.09
Guo, Y. (2012). Restoration of the Stratigraphical Paleothickness and its Tectonic Significance in the central Uplift belt of Huimin Depression and its Neigbouring Area. Dissertation Thesis. Qingdao(China): Shandong University of Science and Technology.
Gutierrez, M., and Wangen, M. (2005). Modeling of Compaction and Overpressuring in Sedimentary Basins. Mar. Pet. Geology. 22, 351–363. doi:10.1016/j.marpetgeo.2005.01.003
Hantschel, T., and Kauerauf, A. I. (2009). Fundamentals of Basin and Petroleum Systems Modeling. Berlin: Springer.
Hao, F., Zou, H., Gong, Z., Yang, S., and Zeng, Z. (2007). Hierarchies of Overpressure Retardation of Organic Matter Maturation: Case Studies from Petroleum Basins in China. Bulletin 91, 1467–1498. doi:10.1306/05210705161
Hunt, J. M. (1990). Generation and Migration of Petroleum from Abnormally Pressured Fluid Compartments. AAPG Bull. 74, 1–12. doi:10.1306/0c9b21eb-1710-11d7-8645000102c1865d
Jiang, S. H., Wang, Y. S., Liu, H. M., Xu, X. M., and Gao, P. (2008). Research on the denudation thickness of the fourth member of Shahejie Formation and Kongdian Formation by wave analysis method in Huimin Depression. Petroleum Geology and Recovery Efficiency 15 (1), 6–9. doi:10.3969/j.issn.1009-9603.2008.01.002
Jiang, Y. L., Wang, X., Yu, Q. Q., Wang, Y. S., Liu, H., and Jing, C. (2016). Pressure Field Characteristics of Petroliferous Depressions and its Relationship with Hydrocarbon Enrichment in Bohai Bay Basin. Acta Petrolei Sinica 37, 1361–1369. doi:10.7623/syxb201611004
Katahara, K. (2006). Overpressure and Shale Properties: Stress Unloading or Smectite‐illite Transformation? 76th SEG 12, 1520–1524. doi:10.1190/1.2369809
Lahann, R. W., and Swarbrick, R. E. (2011). Overpressure Generation by Load Transfer Following Shale Framework Weakening Due to Smectite Diagenesis. Geofluids 11, 362–375. doi:10.1111/j.1468-8123.2011.00350.x
Li, C. Q., and Liu, H. M. (2013). Abnormal Formation Pressure and its Evolution Features of the Third Member, Shahejie Formation, Linnan Sag. Earth Sci. J. China Univ. Geosci. 38, 105–111. doi:10.3799/dqkx.2013.010
Li, C., Luo, X., Zhang, L., Fan, C., Xu, C., Liu, A., et al. (2022). New Understanding of Overpressure Responses and Pore Pressure Prediction: Insights from the Effect of clay mineral Transformations on Mudstone Compaction. Eng. Geology. 297, 106493. doi:10.1016/j.enggeo.2021.106493
Li, C., Luo, X., Zhang, L., Wang, B., Guan, X., Luo, H., et al. (2019). Overpressure Generation Mechanisms and its Distribution in the Paleocene Shahejie Formation in the Linnan Sag, Huimin Depression, Eastern China. Energies 12, 3183–3206. doi:10.3390/en12163183
Li, C., Zhang, L., Luo, X., Lei, Y., Yu, L., Cheng, M., et al. (2021). Overpressure Generation by Disequilibrium Compaction or Hydrocarbon Generation in the Paleocene Shahejie Formation in the Chezhen Depression: Insights from Logging Responses and basin Modeling. Mar. Pet. Geology. 133, 105258. doi:10.1016/j.marpetgeo.2021.105258
Lin, Y. X., Zhao, C. J., Zhu, C. Z., Wu, Y. C., Li, J., and Li, X. Q. (2016). Migration Pattern and Geodynamic Mechanism of Cenozoic Depocenter and Subsidence center in Huimin Sag, Bohai Bay Basin. Oil Gas Geology. 37, 509–519. doi:10.11743/ogg20160407
Liu, C. Y., Yan, X. B., Xu, X. H., Zhou, Q. F., and Qin, W. J. (2008). Application of Fluid Inclusion to the Study of Hydrocarbon Charge History of the South Slope in the Huimin Sag. Oil Gas Geology. 29, 507–510. doi:10.11743/ogg20080414
Liu, H. (2015). Sedimentary Filling Diversity in the Third Member of Shahejie Formation in South Part of Linnan Subsag. Pet. Geology. Recovery Efficiency 22, 57–61. doi:10.3969/j.issn.1009-9603.2015.03.010
Liu, X. F. (2011). Distribution and Origin of the Abnormal Pressure in a Transtensional basin: a Case Study from Linan Subsag, Humin Sag. Geol. Sci. Tech. Inf. 30, 1–4. doi:10.3969/j.issn.1000-7849.2011.05.001
Luo, X. R. (2003). Review of Hydrocarbon Migration and Accumulation Dynamics. Nat. Gas Geosci. 14, 337–346. doi:10.3969/j.issn.1672-1926.2003.05.002
Luo, X. R., and Vasseur, G. (1992). Contributions of Compaction and Aquathermal Pressuring to Geopressure and the Influence of Environmental Conditions. AAPG Bull. 76, 1550–1559. doi:10.1016/0920-4105(93)90041-C10.1306/bdff8a42-1718-11d7-8645000102c1865d
Luo, X. R., and Vasseur, G. (1995). Modelling of pore pressure evolution associated with sedimentation and uplift in sedimentary basin. Basin Research 7, 35–52. doi:10.1111/j.1365-2117.1995.tb00094.x
Luo, X. R., and Vasseur, G. (1996). Geopressuring Mechanism of Organic Matter Cracking: Numerical Modeling. AAPG Bulltein 80 (6), 856–874. doi:10.1306/64ED88EA-1724-11D7-8645000102C1865D
Luo, X. R., Yang, J. H., and Wang, Z. F. (2000). The Overpressuring Mechanisms in Aquifers and Pressure Prediction in Basins. Geol. Rev. 46, 22–31. doi:10.16509/j.georeview.2000.01.005
Luo, X., Dong, W., Yang, J., and Yang, W. (2003). Overpressuring Mechanisms in the Yinggehai Basin, South China Sea. Bulletin 87 (4), 629–642. doi:10.1306/10170201045
Luo, X., and Vasseur, G. (2016). Overpressure Dissipation Mechanisms in Sedimentary Sections Consisting of Alternating Mud-Sand Layers. Mar. Pet. Geology. 78, 883–894. doi:10.1016/j.marpetgeo.2016.04.001
Luo, X., Wang, Z., Zhang, L., Yang, W., and Liu, L. (2007). Overpressure Generation and Evolution in a Compressional Tectonic Setting, the Southern Margin of Junggar Basin, Northwestern China. Bulletin 91, 1123–1139. doi:10.1306/02260706035
Madon, M. (2007). Overpressure Development in Rift Basins: an Example from the Malay Basin, Offshore Peninsular Malaysia. Pet. Geosci. 13, 169–180. doi:10.1144/1354-079307-744
Magara, K. (1978). Compaction and Fluid Migration: Practical Petroleum Geology. Amsterdam: Elsevier Science.
Mosca, F., Hantschel, T., Djordjevic, O., McCarthy, J., Krueger, A., Phelps, D., et al. (2018). Pore Pressure Prediction while Drilling: Three-Dimensional Earth Model in the Gulf of Mexico. Bulletin 102, 691–708. doi:10.1306/0605171619617050
Nguyen, B. T. T., Kido, M., Okawa, N., Fu, H., Kakizaki, S., and Imahori, S. (2016). Compaction of Smectite-Rich Mudstone and its Influence on Pore Pressure in the deepwater Joetsu Basin, Sea of Japan. Mar. Pet. Geology. 78, 848–869. doi:10.1016/j.marpetgeo.2016.07.011
Nifuku, K., Kobayashi, Y., Araki, Y., Ashida, T., and Taniwaki, T. (2020). Overpressure Evolution Controlled by Spatial and Temporal Changes in the Sedimentation Rate: Insights from a basin Modelling Study in Offshore Suriname. Basin Res. 33, 1293–1314. doi:10.1111/bre.12514
Osborne, M. J., and Swarbrick, R. E. (1997). Mechanisms for Generating Overpressure in Sedimentary Basins: a Reevaluation. Bulletin 81 (1997), 1023–1041. doi:10.1306/522B49C9-1727-11D7-8645000102C1865D
Qiu, N. S., Su, X. G., Li, Z. Y., Liu, Z. Q., and Li, Z. (2006). The Cenozoic Tectono-thermal of Jiyang Depression, Bohai Bay Basin, East China. Chin. J. Geophys. 49, 1127–1135. doi:10.3321/j.issn:0001-5733.2006.04.02610.1002/cjg2.923
Qiu, N., Liu, Y., Liu, W., and Jia, J. (2020). Quantitative Reconstruction of Formation Paleo-Pressure in Sedimentary Basins and Case Studies. Sci. China Earth Sci. 63, 808–821. doi:10.1007/s11430-019-9556-8
Radwan, A. E., Abudeif, A. M., Attia, M. M., Elkhawaga, M. A., Abdelghany, W. K., and Kasem, A. A. (2020). Geopressure Evaluation Using Integrated basin Modelling, Well-Logging and Reservoir Data Analysis in the Northern Part of the Badri Oil Field, Gulf of Suez, Egypt. J. Afr. Earth Sci. 162, 103743. doi:10.1016/j.jafrearsci.2019.103743
Radwan, A. E., Abudeif, A. M., Attia, M. M., and Mohammed, M. A. (2019). Pore and Fracture Pressure Modeling Using Direct and Indirect Methods in Badri Field, Gulf of Suez, Egypt. J. Afr. Earth Sci. 156, 133–143. doi:10.1016/j.jafrearsci.2019.04.015
Radwan, A. E. (2021). Modeling Pore Pressure and Fracture Pressure Using Integrated Well Logging, Drilling Based Interpretations and Reservoir Data in the Giant El Morgan Oil Field, Gulf of Suez, Egypt. J. Afr. Earth Sci. 178, 104165. doi:10.1016/j.jafrearsci.2021.104165
Ruth, Pv., Hillis, R., and Tingate, P. (2004). The Origin of Overpressure in the Carnarvon Basin, Western Australia: Implications for Pore Pressure Prediction. Pet. Geosci. 10, 247–257. doi:10.1144/1354-079302-562
Sayers, C. M., Johnson, G. M., and Denyer, G. (2002). Predrill Pore‐pressure Prediction Using Seismic Data. Geophysics 67, 1286–1292. doi:10.1190/1.1500391
Stricker, S., Jones, S. J., and Grant, N. T. (2016). Importance of Vertical Effective Stress for Reservoir Quality in the Skagerrak Formation, central Graben, North Sea. Mar. Pet. Geology. 78, 895–909. doi:10.1016/j.marpetgeo.2016.03.001
Su, X. G., Qiu, N. S., Liu, Z. Q., and Zhang, L. Y. (2006). Analysis of thermal Evolution History of Huimin Sag in Jiyang Depression. Nat. Gas Industry 26, 15–17. doi:10.3321/j.issn:1000-0976.2006.10.005
Tingay, M. R. P., Morley, C. K., Laird, A., Limpornpipat, O., Krisadasima, K., Pabchanda, S., et al. (2013). Evidence for Overpressure Generation by Kerogen-To-Gas Maturation in the Northern Malay Basin. Bulletin 97, 639–672. doi:10.1306/09041212032
Wang, D, Wu, Z. P., Yang, L.L., Liu, H., and Zhao, Y. (2020). Growth and Linkage of the Xiakou fault in the Linnan Sag, Jiyang Depression, Eastern China: Formation mechanism and sedimentation response. Mar. Pet. Geol. 116, 104319. doi:10.1016/j.marpetgeo.2020.104319
Wang, B. (2019). Mechanism and Evolution of Abnormal High Pressure of Paleocene Shahejie Formation in Linnan Sag. Dissertation Thesis. Wuhan(China): China University of Geosciences.
Wang, B., Zhang, L. K., Li, C., Chen, K. Y., Song, G. Q., and Luo, H. M. (2018). Mechanism and Distribution Prediction of Abnormal High Pressure of the Paleocene Shahejie Formation in Linnan Sag, Huimin Depression. Oil Gas Geology. 39, 641–652. doi:10.11743/ogg20180402
Wangen, M. (2001). A Quantitative Comparison of Some Mechanisms Generating Overpressure in Sedimentary Basins. Tectonophysics 334, 211–234. doi:10.1016/S0040-1951(01)00064-6
Zeng, Q. H. (2006). Petroleum Generation Kinetics Modeling and Petroleum Pool System in the Linnan Depression. Dissertation Thesis. Beijing(China): Chinese Academy of Sciences.
Zhang, J. (2013). Effective Stress, Porosity, Velocity and Abnormal Pore Pressure Prediction Accounting for Compaction Disequilibrium and Unloading. Mar. Pet. Geology. 45, 2–11. doi:10.1016/j.marpetgeo.2013.04.007
Keywords: overpressure mechanism, paleo-pressure evolution, basin modeling, hydrocarbon migration, Shahejie formation
Citation: Li C, Zhang L, Luo X, Wang B, Lei Y, Cheng M, Luo H, Wang C and Yu L (2022) Modeling of Overpressure Generation–Evolution of the Paleogene Source Rock and Implications for the Linnan Sag, Eastern China. Front. Earth Sci. 10:829322. doi: 10.3389/feart.2022.829322
Received: 05 December 2021; Accepted: 03 January 2022;
Published: 25 January 2022.
Edited by:
Ahmed E. Radwan, Jagiellonian University, PolandReviewed by:
Shuai Yin, Xi’an Shiyou University, ChinaCopyright © 2022 Li, Zhang, Luo, Wang, Lei, Cheng, Luo, Wang and Yu. This is an open-access article distributed under the terms of the Creative Commons Attribution License (CC BY). The use, distribution or reproduction in other forums is permitted, provided the original author(s) and the copyright owner(s) are credited and that the original publication in this journal is cited, in accordance with accepted academic practice. No use, distribution or reproduction is permitted which does not comply with these terms.
*Correspondence: Likuan Zhang, emhhbmdsaWt1YW5AbWFpbC5pZ2djYXMuYWMuY24=; Xiaorong Luo, bHVveHJAbWFpbC5pZ2djYXMuYWMuY24=
Disclaimer: All claims expressed in this article are solely those of the authors and do not necessarily represent those of their affiliated organizations, or those of the publisher, the editors and the reviewers. Any product that may be evaluated in this article or claim that may be made by its manufacturer is not guaranteed or endorsed by the publisher.
Research integrity at Frontiers
Learn more about the work of our research integrity team to safeguard the quality of each article we publish.