 Nicolas Launay
94% of researchers rate our articles as excellent or good
Learn more about the work of our research integrity team to safeguard the quality of each article we publish.
Find out more
ORIGINAL RESEARCH article
Front. Earth Sci. , 11 April 2018
Sec. Geomagnetism and Paleomagnetism
Volume 6 - 2018 | https://doi.org/10.3389/feart.2018.00032
The geological sources of major magnetic field anomalies are still poorly constrained, in terms of nature, geometry, and vertical position. A common feature of several anomalies is their spatial correlation with cratonic shields and, for the largest anomalies, with Banded Iron Formations (BIF). This study first unveils the magnetic properties of some BIF samples from Mauritania, where the main part of the West African magnetic anomaly is observed. It shows how strong the magnetic susceptibility and natural remanent magnetization for such rocks are. High Koenigsberger ratios imply that the remanent magnetization should be taken into account to explain the anomaly. A numerical modeling of the crust beneath this anomaly is performed using these constraints and both gravity and magnetic field data. A forward approach is used, investigating the depth, thickness and magnetization intensity of all possible crustal lithologies. Our results show that BIF slices can be the only magnetized crustal sources needed to explain the anomaly, and that they could be buried several kilometers deep. The results of this study provide a new perspective to address the investigation of magnetic field anomaly sources in other cratonic regions with BIF outcrops.
The largest anomalies of the Earth's magnetic field are often observed over old transition zones at the edges of cratonic regions. The best example corresponds to the Kursk magnetic anomaly in Russia, which is centered on 51°N, 37°E and stretches over 200 km wide and 850 km long in the NW-SE direction at the Ukrainian-Russian border (Alexandrov, 1973; Thébault et al., 2016). This anomaly reaches about 37 nT at satellite altitude. Another good example corresponds to the Bangui magnetic anomaly (Regan and Marsh, 1982; Ouabego et al., 2013) located between the North African and Congo cratons in the Panafrican Belt. An usual characteristic of these areas is the presence of Banded Iron Formations (BIF) (e.g., Alexandrov, 1973; Ravat et al., 1993; Schmidt et al., 2007). However, they sometimes outcrop only at local scale (~200 km) compared to the wavelength (~1,000 km) of the magnetic field anomaly. Geophysical exploration, boreholes and mining exploitations show that some BIFs can be thicker than 1 or 2 km (Alexandrov, 1973), but they usually are very thin (typically a few 100 m thick). Therefore there is still a problem to link large satellite magnetic field anomalies with thin layers of BIF, and most models of crustal anomalies invoke highly magnetized bulk lower crust rather than BIF (Toft and Haggerty, 1986; Ravat, 1989).
Additionally, previous crustal models including BIFs and constrained by potential-field data of such large anomalies only considered the induced magnetic field, i.e., magnetic susceptibility (see Ravat, 1989 for the source of the Bangui magnetic anomaly). This model is based on the assumption of a 40 km thick magnetic crust, with important susceptibilities in the Archean and lower Proterozoic zones of the West African Craton. Recent studies showed that the remanence can play a role too (e.g., Toft and Haggerty, 1986; Whaler and Langel, 1996; Schmidt et al., 2007; Li et al., 2015). Observations show that some rocks found beneath major magnetic anomalies possess strong remanent magnetization values, with Koenigsberger ratio above 1 (Ouabego et al., 2013). This reinforces the hypothesis that Natural Remanent Magnetization (NRM) cannot be neglected when dealing with crustal magnetization. Additionally, the increase of thickness should be taken into account in the case of metamorphic belts, as multiple geological observations of folded BIFs (or slices of BIF) have been done on different areas (Alexandrov, 1973; Ravat et al., 1993; Schmidt et al., 2007; Guo et al., 2011).
One of the main problems in such case of potential-field modeling is the vertical position of the strongly-magnetized source: the non-uniqueness of the modeling method cannot lead to a satisfying solution concerning magnetization depth. This effect is wider when the hypothesis of “induced magnetization only” is considered. To reduce non-uniqueness in potential-field modeling, adding either other geophysical data (essentially gravimetry) or rock magnetic measurements on target lithologies can help. Of course, additional potential-field data at lower/higher altitude(s) are welcome to decipher the vertical position of the source, but still petrophysical constraints are needed. This is the main goal of the present study. The crustal structure of the so-called West African magnetic field anomaly—named WAMA in the rest of this paper—is investigated using numerical modeling constrained from BIF and other rock magnetism properties, potential field data, and available geological data. The first part introduces the geological context of the WAMA anomaly. The second section deals with the magnetic properties of some Mauritanian BIFs. The last section shows some possible models of the crustal structure beneath the WAMA anomaly. These models are then discussed and compared with other models in similar contexts.
The first evidence of large magnetic field anomalies over West Africa was given by the NASA POGO and Magsat missions (Langel et al., 1982). Then Oersted, CHAMP and the recent ESA Swarm mission allowed to produce high-resolution spherical harmonic models that now better define its characteristics. The anomaly reaches about 6 nT in amplitude at 400 km of altitude (Toft et al., 1992; Thébault et al., 2016) and extends from the Atlantic coast to Mali, and from Central Morocco to Ivory Coast. Considering the recent World Digital Magnetic Anomaly Map (WDMAM; Dyment et al., 2015) compilation (Figure 1), its overall shape correlates to the local disposition of basins and cratons (Hastings, 1982; see next section). The northern part comprises two sub-anomalies, a 250 km-wide dipolar one centered on (−11°E, 26°N), and a 600 km-wide dipolar one centered on (−13°E, 22°N). These anomalies correspond to the most intense part of the WAMA and will henceforth be the focus of the present study.
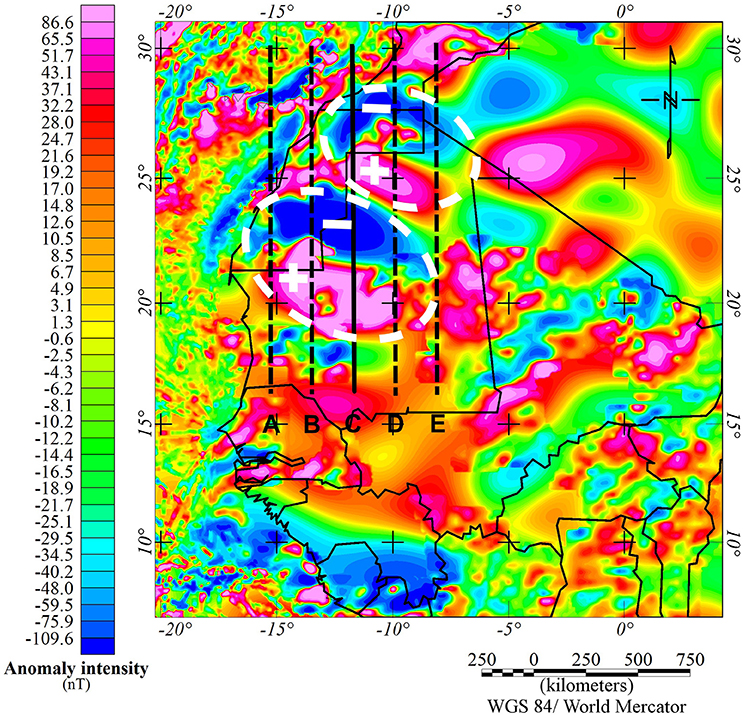
Figure 1. The West Africa Magnetic Anomaly (WAMA) in the World Digital Magnetic Anomaly Map (WDMAM) model at 5 km altitude. Segments A–E correspond to the selected profiles used for 2D modeling. Solid segment C corresponds to the profile shown in this article.
Using MagsatT data, Toft and Haggerty (1986) built a numerical model of the crust of this area, using both inverse and direct modeling for different regions. Despite the apparent simplicity of the model that uses rectangular prisms, it is the only way to investigate the crust in this area in the absence of deep geophysical profiles, like seismic and/or magnetotelluric data. Another model was produced by Ravat (1989) and fits both magnetic field data and expected magnetic susceptibility values. However, it is still incomplete since no remanence is considered and there is still a lack of geophysical investigation.
In addition to the potential field data, the rock magnetic properties of some local crustal rocks are considered to build a more realistic numerical model of the crust beneath the WAMA. While the western part of the WAMA is observed over some sedimentary rocks, its area mainly corresponds to the location of the Reguibat rise and the West African craton (Hastings, 1982; Figure 2A). Despite the lack of deep geophysical soundings of the crust, one can derive the geological background from field observations and from the comparison with other cratonic region and their suture zones (Regan and Marsh, 1982; Ravat, 1989). The West African craton is a vast portion of Precambrian crust extending over 4,500 thousands of km2, going from the coast of Mauritania to the southern border of Mali, and from the south of Morocco to the shores of Ivory Coast. Half of this region is covered by younger sediments (from late Precambrian up to Carboniferous) forming the Taoudeni Basin. To the north and the south of this basin, the Reguibat and Man rises are the two parts of the cratons emerging at the surface. The craton is surrounded by the hercynian Mauritanides fold belt to the west, and the pan African mobile belt to the east (Bessoles, 1977).
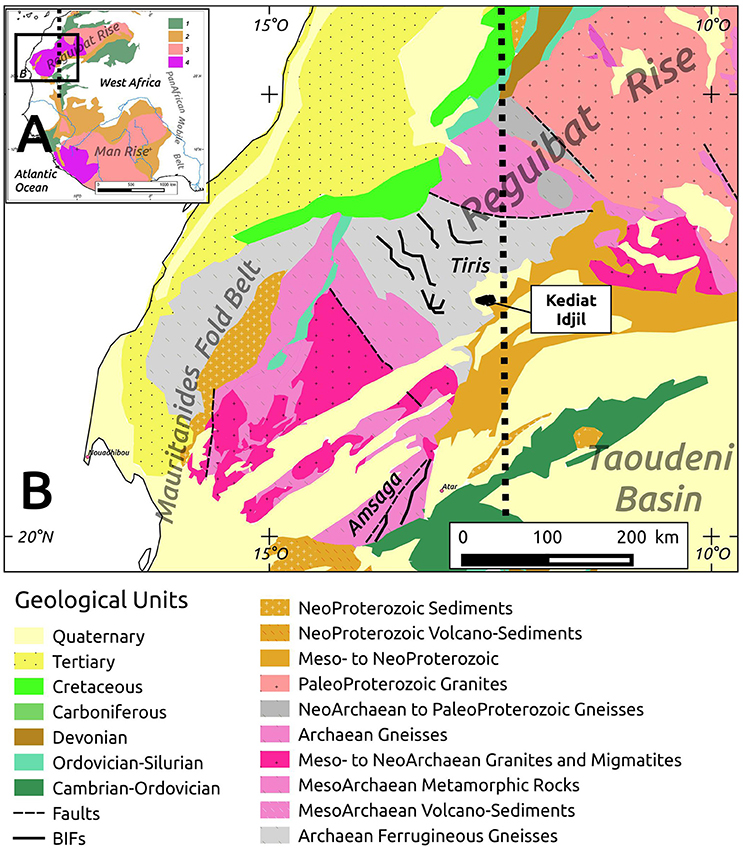
Figure 2. Geological context of the studied area at large scale in the West African Craton (A) and at regional scale in the Reguibat Ridge (B). All samples come from drillings in the Banded Iron Formations (BIFs) of the Kediat Idjil (6 samples), Tiris (12), and Amsaga (4) regions. In (A), 1—Palaeozoic (Hercynian) Rocks, 2—Meso- to NeoProterozoic Rocks, 3—NeoArchaean to PalaeoProterozoic Rocks, and 4—Archaean Rocks. On both maps, the thick dashed solid line shows the location of the magnetic field data main profile selected for modeling. Map modified from Bronner (1990) and Thièblemont et al. (2016).
The Reguibat rise is the septentrional emerging part of the West African craton. It extends over 1,500 km long in SW-NE direction, and 250–400 km wide and is composed of two different zones. (i) The eastern zone contains rocks younger than 2 Ga and numerous faults. There is a strong proportion of intrusive granites in the west, the eastern part being dominated by volcanic formations. (ii) On the western side of the rise, rocks older than 2.5 Ga with few faults are observed. The other differences with the previous zone are the presence of high grade metamorphism around 3 Ga, numerous outcrops of migmatites, and major BIFs deposits. These deposits occur mainly within gneiss and metavolcanic rocks belts, with Al and Fe-rich formations (Bronner, 1990).
We will focus on the BIFs of the Kedjat Idjil, a specific basin area of the iron-bearing province of Tiris, in the western-central part of the Reguibat rise (Figure 2B), because they show interesting magnetic properties. These iron formations are characteristic from the Archean zone of the rise. The Kedjat Idjil is an important outcrop of iron-rich formations which rises above the surrounding desert due to thrust faults forming a tectonic window, and is still massively mined for its iron ore.
The samples were collected in the 80–90s (G. Bronner, pers. comm.) from mining exploration boreholes in the Tiris (max 50 km around Kediat Idjil) and Amsaga areas. The depth of these samples ranges from few tens of meters to about 400 meters, meaning that the majority doesn't show the classical alteration found in surface samples (e.g., chemical alteration or surface magnetic perturbations such as lightning strikes). Additionally, it represents a unique sequence from sedimentary pristine BIFs to high-grade metamorphic BIFs. Therefore the rock magnetic data of those samples should reproduce their properties at greater depth, where the geological processes may have buried them after the initial deposition (Eburnean, Panafrican orogens, for instance). Each of the 96 samples corresponds to a core fragment drilled to obtain 1–4 “plugs” of 10 mm in diameter. These plugs were then cut to 8.8 mm in length using a diamond saw, for a final volume of 691 mm3. The initial cores were not oriented. The only information we could get is the plug orientation along the vertical axis of their core. Since we ignored the down direction and the east-west orientation, a down direction was arbitrarily set, obtaining a total of 229 plugs.
Rock magnetic measurements were performed in order to get the magnetic mineralogy, grain size, and magnetization values. Low field magnetic susceptibility and its anisotropy were measured using a Kappabridge susceptibilimeter, and the Natural Remanent Magnetization (NRM) of all of our plugs was measured using the SQUIDs magnetometer of the CEREGE Magnetism laboratory. Since NRM of BIF samples can reach values up to 1,000 A/m, a Molspin spinner magnetometer was used when the magnetic moment of the samples exceeded the tolerance of the SQUIDs. K-T curves (susceptibility vs. temperature), hysteresis cycles and Anhysteretic Remanent Magnetization (ARM) measurements were also realized on a selection of 19 representative samples. A subset of eight samples representative of the various macroscopic facies was also submitted to stepwise thermal demagnetization of 3 axis Isothermal Remanent Magnetization (IRM) acquired at 3T, 0.3T, and 0.1T according to the protocol of Lowrie (1990).
Results of rock magnetic measurements, summarized in Table 1, reveal highly magnetic rocks (Figure 3), even when compared to basement formations like granites, gneisses, granulites and amphibolites where some magnetic minerals already carry a significant magnetization (Hemant, 2003). The mean magnetic susceptibility is up to 2.8 SI, with a median at 1.52 SI. Accordingly saturation magnetization Ms is up to 44 Am2/kg with median at 20.7 Am2/kg. Median density is 4.35 g/cm3. All these parameters point toward magnetite as the dominant mineral in these rocks. The K-T curves show Curie temperatures around 585°C (Figure 4), which is consistent with near-end member magnetite as the main susceptibility carrier. The hysteresis cycles' parameters are also consistent with multi-domain magnetite (Figure 5 and Table 1). Note that hysteresis was obtained on subsamples of the plug used for susceptibility, NRM and ARM measurements, thus leading to possible incoherent results for the same sample ID due to the heterogeneity of the rock at mm scale [e.g., sample 236A where NRM exceeds Isothermal Remanent Magnetization (IRM)]. The hysteresis parameters given in Table 1 are mean values of measurements realized on the three axes of each subsample.
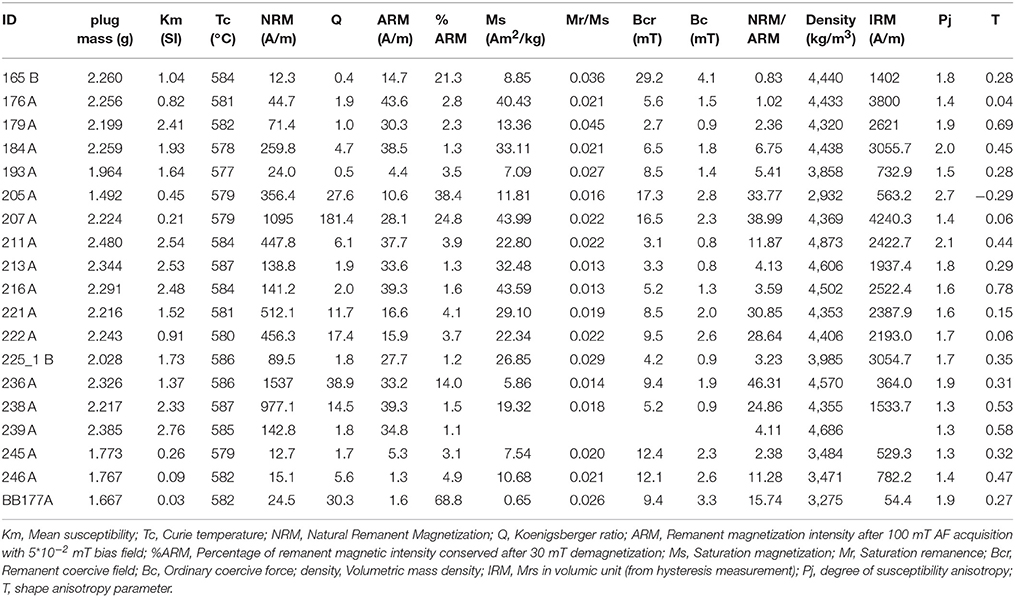
Table 1. Table summarizing the key values measured on the 19 samples selected for magnetic mineralogy measurements.
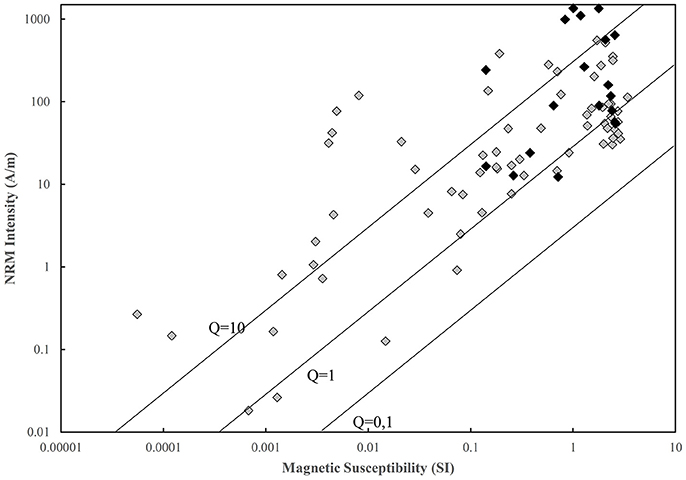
Figure 3. NRM vs. Susceptibility plot representing values for the different samples from Mauritania. Each diamond corresponds to a core fragment: black ones were selected for magnetic mineralogy measurements. The black lines represent different values of Koenigsberger ratio (Q) with induced magnetization proportional to the chosen natural magnetic field reference value measured in Mauritania (36.34 μT; Thébault et al., 2015).
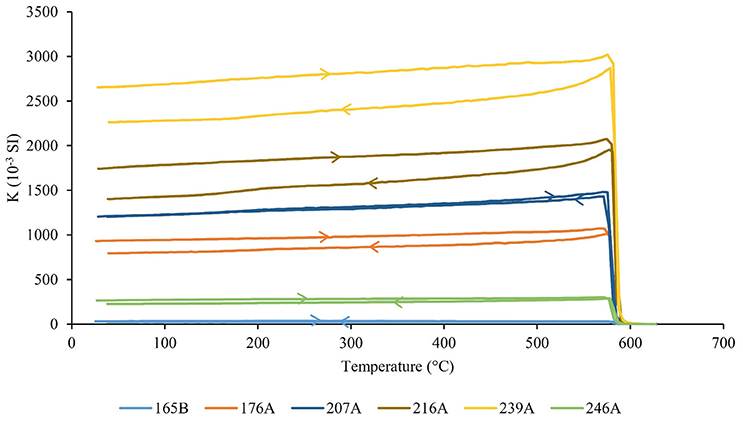
Figure 4. Examples of K-T curves obtained for our BIF samples. The curves selected here span the entire variety of our samples susceptibility values.
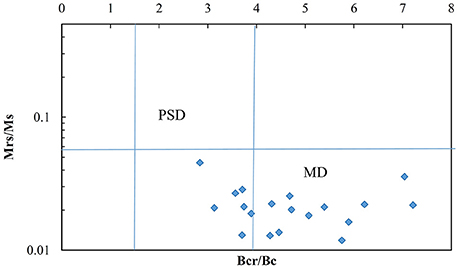
Figure 5. Day plot showing the ratio saturation remanence (Mrs) by saturation magnetization (Ms) against the ratio remanent coercivity (Bcr) by ordinary coercivity (Bc). Each point corresponds to one of the core samples selected for magnetic mineralogy measurements. PSD, Pseudo Single Domain; MD, Multidomain.
Figure 3 shows that Koenigsberger ratio values (Q, defined as the ratio of remanent magnetization over induced magnetization) are systematically close to 1 (24% of samples between 0.3 and 1), often above (76% of samples), and sometimes greater than 10 (26% of samples). High Q ratios may suggest the additional presence of hematite, but the hysteresis data do not support this hypothesis). Furthermore, the IRM thermal demagnetization performed on a selection of eight samples representative of the various macroscopic facies, confirmed that the remanence magnetic carrier is magnetite. Only one sample appears to also include some low coercive hematite (see Supplementary Figure 3). Mean susceptibility (Km) is correlated with ARM (0.79 R2 coefficient) while no correlation appears between NRM and ARM or Km (R2 below 0.1). NRM/ARM ratio is on average 14.5 and peaks at 46. This is high for a TRM and may indicate that NRM was contaminated by partial IRM due to exposure to stray fields during storage (1 mT is already producing serious effects due to Bcr as low as 3 mT). The AMS measurements reveal an oblate susceptibility ellipsoid, generally parallel to the subhorizontal bedding (Figures 6, 7), which is coherent with the fact that in BIFs, anisotropy can be caused by sediment deposit or syn-metamorphic deformation. Indeed, the resulting anisotropy will be related to the bedding planes in sediments, and to the direction of the possible compaction in post-depositional deformations regime (Dunlop and Özdemir, 1997). A consequence of these results is that the induced field may be biased up to 10° (±5°) from the ambient magnetic field due to susceptibility anisotropy at sample scale. Moreover, due to the high susceptibility (>1 SI), a shape anisotropy effect will arise at the scale of the whole body imbedded as a slice in weakly magnetic crust, leading to a further deviation of magnetization within body elongation (see discussion on serpentinite magnetization in Rochette, 1994). This may mean that considering an induced magnetization in the ambient field direction is not straightforward for such rocks.
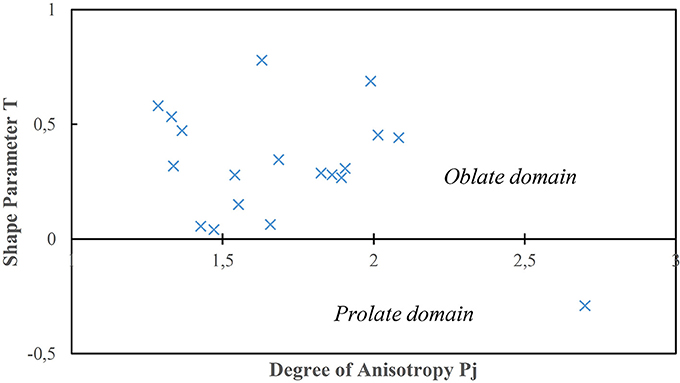
Figure 6. Jelinek plot showing the relationship between the shape parameter and degree of anisotropy. Each point corresponds to one of the core fragments selected for magnetic mineralogy measurements. The shape parameter reflects the overall aspect of the ellipsoid, while the degree of anisotropy approximately translates the difference between its largest and smallest dimensions.
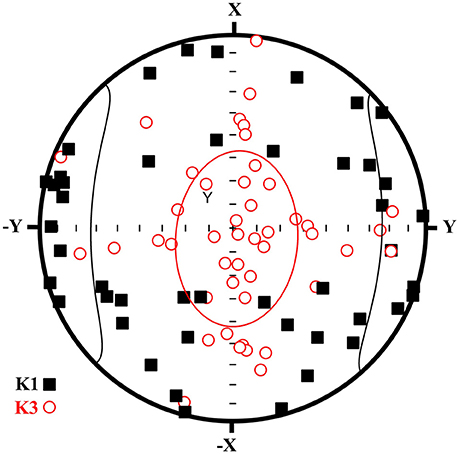
Figure 7. Stereographic projections of maximum (K1) and minimum (K3) susceptibility directions. Each point corresponds to one of the core samples selected for magnetic mineralogy measurements. Thin contours correspond to confidence angles.
In the absence of data from investigation of the deep geological structure, composition and geometry beneath the WAMA, a 2D numerical model was built starting with a simple crustal structure: sedimentary cover, upper, middle, and lower crust with thicknesses constrained by large seismic models (CRUST2.0 model; Bassin et al., 2000) and some standard values about density/magnetization (induced only for the initial model) (Telford et al., 1990; Dentith and Mudge, 2014). We slightly adjusted these density values and interfaces' topography to fit the Bouguer gravity data coming from a GRACE model (Tapley et al., 2005). Then, the recent compilation of airborne/satellite magnetic data of the WDMAM (Dyment et al., 2015; Lesur et al., 2016) was used as magnetic field anomaly observations. Several adjacent profiles were selected in the area (Figure 1). Each profile was then considered in a forward modeling approach using the GM-SYS module of the GEOSOFT Oasis montaj software (Geosoft Incorporated., 2017). A weak magnetization (K = 0.058 SI) was added in the lower and middle crusts, in concordance with the assumptions of Ravat (1989) for the main magnetic source in his model of the region. Lastly, some BIF layers were input (beneath the geological outcrops) when it was needed because of large residuals after the modeling with modifications of the crustal geometry and induced magnetization only. Their properties correspond to the mean values of our measurements on sampled rocks (K = 0.9 SI, NRM intensity = 156 A/m). The directions of the remanent magnetization vector correspond to those of the induced field (2014 field in Mauritania: F = 36.34 μT, I = 26.3°, D = −4.4°; Thébault et al., 2015). It is thus possible that this doesn't simulate exactly the true remanence direction, but it allows us to study the impact of its intensity on the anomaly.
The next figures show resulting models for only one of the profiles (profile C), but all were considered in the modeling, and show similar features (see Supplementary Material). All models predict the Bouguer gravity data with weak Root Mean Square (RMS) residual value. Figure 8 shows two possible models (for the same profile): the first one considers only the induced magnetization while the second one considers also the remanence. The latter concerns BIF rocks at shallow depths in the crust, but one can already see that even thin (<1 km) layers of such magnetized rocks can significantly increase the quality of the model. We also investigated the vertical position and thickness of such formations (with strong NRM) in the models. Figure 9 unveils that, with similar thicknesses <1 km, the vertical position of such BIF layers is unknown. However, if those layers are closer to the surface, then RMS values sharply increase for the magnetic anomaly profile (Figure 8). Some BIF layers outcrop (for instance in Kediat Idjil), but our model suggests buried deeper layers. Indeed BIF layers with strong remanence are probably present below 5 km, which could explain some discrepancies observed between expected magnetic characteristics and actual rock magnetism measurements (McEnroe et al., 2004). Considering a larger thickness leads to a decrease of the magnetization to get RMS values similar to those of deep bodies (Figure 10). Therefore, we prefer to consider magnetization values close to our own measurements, and so, thin layers of BIF rocks. We also tested the necessity of a deep and large magnetic source like in the Ravat (1989) model (Figure 11) to see if the BIFs alone could explain the WAMA. Our results show a slightly better fit (RMS inferior by 1.5 nT) with only BIFs bodies, adjusted to compensate for the absence of deep source (present in Figure 9), meaning that a deep magnetized crust is not really needed in this case.
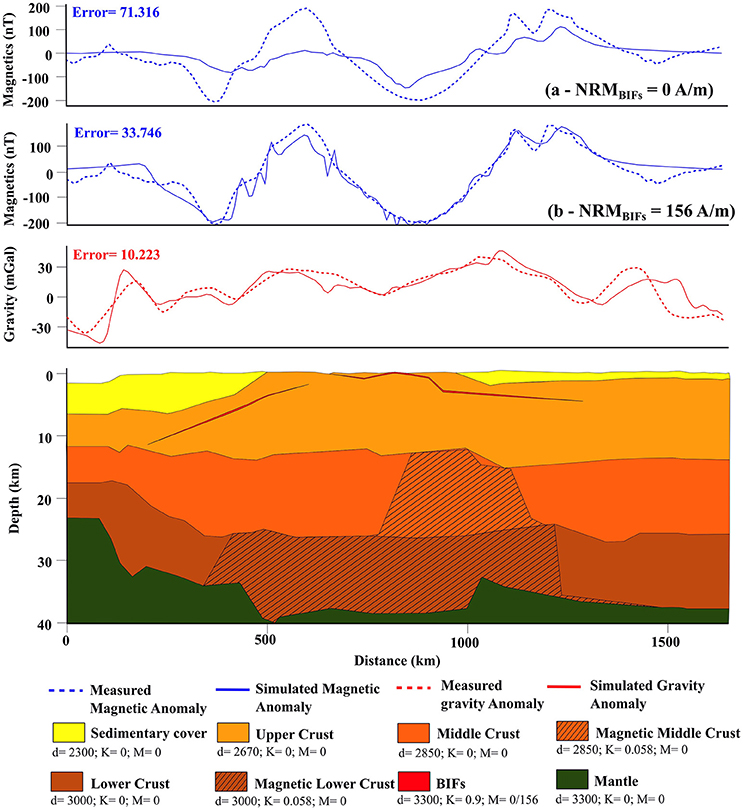
Figure 8. Two possible simulation results for a model of the crustal structure along profile C beneath the WAMA, with induced magnetization only (a: M = 0 A/m) and adding remanence (b: M = 156 A/m). d, density (kg/m3); K, Magnetic susceptibility (SI); M, Remanence intensity (A/m). Remanence Inclination and Declination are (I = 26.33°, D = −4.37°) and remain unchanged in following models. The origin of the profile is North-oriented. The fitted gravity anomaly remains unchanged in the following models. The error parameter shown in the magnetic and gravity anomaly profiles corresponds to the RMS value.
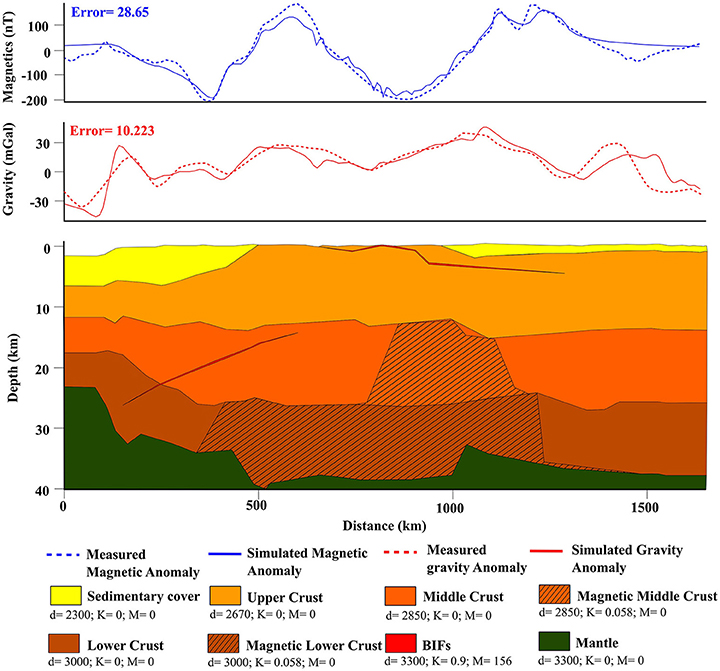
Figure 9. Model of the crustal structure along profile C beneath the WAMA, with remanence, and considering deep BIFs. The parameters are identical to the ones in Figure 8.

Figure 10. Model of the crustal structure along profile C beneath the WAMA with remanence, considering mid-crustal thick BIF layers. The parameters are identical to the ones in Figure 8.
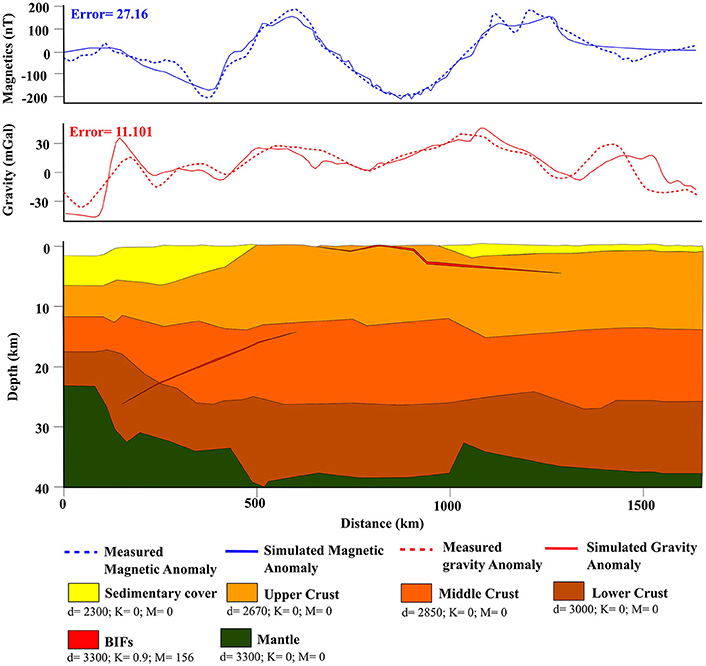
Figure 11. Model of the crustal structure along profile C beneath the WAMA considering deep BIFs with remanence and without magnetic lower crust. The parameters are identical to the ones in Figure 8.
The Precambrian ages of BIF rocks imply that they were impacted by several tectonic/geologic events which could have deformed and buried them at great depth in the current basement (Dentith and Mudge, 2014). Considering also the metamorphic facies of the investigated rocks (temperature/high pressure granulite-like; Bronner, 1990), it seems reasonable to infer the possibility of BIFs bodies in the deep layers of the upper, middle—and possibly lower—crusts. Since the granulite facies corresponds to depths down to 50 km, one can assume the possibility of BIF presence above this depth. Nonetheless, it is still difficult to consider those metasedimentary rocks at such depths. Available geological cross-sections derived from field geological observations and further mining exploration data (Bronner, 1990) show folding of BIFs in the Reguibat area. This is approximately the same context in Central Africa where BIFs are considered as the potential source for the Bangui magnetic anomaly (Ouabego et al., 2013): they are not flat-lying, but folded and compressed within the crust.
The impact of metamorphism on magnetic properties is poorly known for rocks other than basalts and high metamorphism conditions. Some sedimentary rocks have shown strong dependence to metamorphism (Rochette, 1987), but it is mainly magnetite breakdown and pyrrhotite creation, which at high grade conserve magnetic susceptibility. Since none of our samples show any sign of such modifications, and given that magnetic sources can subsist even at great depth (Demory et al., 2013; Ferré et al., 2013; Li et al., 2015; Launay et al., 2017), it is unclear whether metamorphism should have a strong impact on our source's magnetic parameters in depth. To investigate this issue, one has to systematically study the magnetic properties of a large range of BIF samples from worldwide drillings (see Klein, 2005 for a review).
Concerning the numerical models, the non-uniqueness of the potential-field data modeling approach still stands in our results, but at least some impossible models are shown. Those without strongly remanently-magnetized layers, and some with such layers but too close to the surface, are less coherent. Indeed the geological sources of the WAMA seem to be located in the upper and middle crust, down to 15 km for instance. It leads to a new interpretation of the sources of large magnetic anomalies in similar areas in the world, like the Kursk or Bangui magnetic anomalies. By combining all 2D layers, the total volume of BIFs reaches 350,000 km3. By comparison, this value differs from the volume of iron formations extrapolated from outcrops in the Kursk region by almost 5 orders of magnitude (Alexandrov, 1973). This could imply either that the magnetization of the Kursk iron formations is weaker, or that their volume has been overestimated. Furthermore, the depth of our “shallow” BIF bodies is in agreement with the one (~5 km) of the strongly magnetized body proposed by Ravat (1989) for the Bangui magnetic anomaly. Nevertheless, our models show a better fit to the data with a deeper BIF source. It would then be interesting to realize the same kind of model for the Bangui Anomaly to test the pertinence of this choice.
Our study brings new insights about the geological sources of large magnetic field anomalies such as the WAMA. Specifically, we show that BIF crustal layers are the best possible sources, even at depths down to 15 km. The total volume needed to fit the WAMA reaches 350,000 km3 from Mauritania to Mali, which implies that one should revise previous source models of large magnetic field anomalies that usually consider a “mafic iron body” or a “source of iron.” A database of rock magnetic data on BIFs sampled all other the world should be built in every cratonic region. Though it is possible that their unusually strong magnetic properties may be less intense in some areas, and therefore could not explain all magnetic anomalies, this has to be checked first, since their amount appears to be even more important in some areas. Such database cannot be built without ore mining data from private companies, which is why this work also aims at encouraging strong relationships between academics and mining industry.
NL did the rock magnetism measurements under supervision of PR and FD and the numerical modeling under supervision of YQ. NL, YQ, PR, FD wrote the manuscript.
The authors declare that the research was conducted in the absence of any commercial or financial relationships that could be construed as a potential conflict of interest.
We would like to thank CNRS-INSU PNP that partially funded this work. We also thank Georges Bronner, retired assistant professor at Aix-Marseille University, for giving us access to his extensive collection of samples from Mauritania.
The Supplementary Material for this article can be found online at: https://www.frontiersin.org/articles/10.3389/feart.2018.00032/full#supplementary-material
Alexandrov, E. A. (1973). The precambrian Banded Iron-Formations of the soviet union. Econ. Geol. 68, 1035–1062. doi: 10.2113/gsecongeo.68.7.1035
Bassin, C., Laske, G., and Masters, G. (2000). The current limits of resolution for surface wave tomography in North America. EOS, Transactions American Geophysical Union. 81:F897.
Bessoles, B. (1977). Géologie de l'Afrique: Le Craton Ouest-Africain, Vol. 88. Paris: BRGM Editions.
Bronner, G. (1990). La dorsale Reguibat Occidentale: Structure d'un Craton Archéen, Tectonique et Métallogénie des Quartzites Ferrugineux. Ph.D. thesis, 447. Université de Droit, d'économie et des sciences d'Aix-Marseille, Marseille.
Demory, F., Rochette, P., Gattacceca, J., Gabriel, T., and Bezaeva, N. S. (2013). Remanent magnetization and coercivity of rocks under hydrostatic pressure up to 1.4 GPa. Geophys. Res. Lett. 40, 3858–3862. doi: 10.1002/grl.50763
Dentith, M., and Mudge, S. T. (2014). Geophysics for the Mineral Exploration Geoscientist. Cambridge: Cambridge University Press.
Dyment, J., Lesur, V., Hamoudi, M., Choi, Y., Thebault, E., Catalan, M., et al. (2015). World Digital Magnetic Anomaly Map Version 2.0. Digital Map and Grid. Available online at: www.wdmam.org
Ferré, E. C., Friedman, S. A., Martin-Hernandez, F., Feinberg, J. M., Conder, J. A., and Ionov, D. A. (2013). The magnetism of mantle xenoliths and potential implications for sub-Moho magnetic sources. Geophys. Res. Lett. 40, 105–110. doi: 10.1029/2012GL054100
Guo, W. W., Li, Z.-X., and Dentith, M. C. (2011). Magnetic petrophysical results from the Hamersley Basin and their implications for interpretation of magnetic surveys. Aust. J. Earth Sci. 58, 317–333. doi: 10.1080/08120099.2011.552984
Hastings, D. A. (1982). Preliminary correlations of Magsat Anomalies with tectonic features of Africa. Geophys. Res. Lett. 9, 303–306. doi: 10.1029/GL009i004p00303
Hemant, K. (2003). Modelling and interpretation of global lithospheric magnetic anomalies. Ph.D. thesis, Freie Univ., Berlin.
Klein, C. (2005). Some Precambrian banded iron-formations (BIFs) from around the world: their age, geologic setting, mineralogy, metamorphism, geochemistry and origin. Am. Mineral. 90, 1473–1499. doi: 10.2138/am.2005.1871
Langel, R., Phillips, J., and Horner, R. (1982). Initial scalar magnetic anomaly map from Magsat. Geophys. Res. Lett. 9, 269–272. doi: 10.1029/GL009i004p00269
Launay, N., Rochette, P., Quesnel, Y., Demory, F., Bezaeva, N. S., and Lattard, D. (2017). Thermoremanence acquisition and demagnetization for titanomagnetite under lithospheric pressures. Geophys. Res. Lett. 44, 4839–4845. doi: 10.1002/2017GL073279
Lesur, V., Hamoudi, M., Choi, Y., Dyment, J., and Thébault, E. (2016). Building the second version of the World Digital Magnetic Anomaly Map (WDMAM). Earth Planets Space 68:27. doi: 10.1186/s40623-016-0404-6
Li, Z., Zheng, J., Liu, Q., Griffin, W., and Hu, X. (2015). Magnetically stratified continental lower crust preserved in the North China Craton. Tectonophysics 643, 73–79. doi: 10.1016/j.tecto.2014.12.012
Lowrie, W. (1990). Identification of ferromagnetic minerals in a rock by coercivity and unblocking temperature properties. Geophys. Res. Lett. 17, 159–162. doi: 10.1029/GL017i002p00159
McEnroe, S., Langenhorst, F., Robinson, P., Bromiley, G., and Shaw, C. S. (2004). What is magnetic in the lower crust? Earth Planet. Sci. Lett. 226, 175–192. doi: 10.1016/j.epsl.2004.07.020
Ouabego, M., Quesnel, Y., Rochette, P., Demory, F., Fozing, E., Njanko, T., et al. (2013). Rock magnetic investigation of possible sources of the Bangui magnetic anomaly. Phys. Earth Planet. inter. 224, 11–20. doi: 10.1016/j.pepi.2013.09.003
Ravat, D. N. (1989). Magsat Investigations Over the Greater African Region. Ph.D Thesis. Purdue University.
Ravat, D. N., Hinze, W. J., and Taylor, P. T. (1993). European tectonic features observed by Magsat. Tectonophysics 220, 157–173. doi: 10.1016/0040-1951(93)90229-D
Regan, R. D., and Marsh, B. D. (1982). The Bangui magnetic anomaly: its geological origin. J. Geophys. Res. 87, 1107–1120. doi: 10.1029/JB087iB02p01107
Rochette, P. (1987). Metamorphic control of the magnetic mineralogy of black shales in the swiss alps: toward the use of “magnetic isogrades”. Earth Planet. Sci. Lett. 84, 446–457. doi: 10.1016/0012-821X(87)90009-4
Rochette, P. (1994). Comments on “Anisotropic magnetic susceptibility in the continental lower crust and its implications for he shape of magnetic anomalies” by G. Florio et al. Geophys. Res. Lett. 21, 2773–2774. doi: 10.1029/94GL02443
Schmidt, P. W., McEnroe, S. A., Clark, D. A., and Robinson, P. (2007). Magnetic properties and potential field modeling of the Peculiar Knob metamorphosed iron formation, South Australia: an analog for the source of the intense Martian magnetic anomalies? J. Geophys. Res. 112, 1–19. doi: 10.1029/2006JB004495
Tapley, B., Ries, J., Bettadpur, S., Chambers, D., Cheng, M., Condi, F., et al. (2005). GGM02 - an improved earth gravity field model from GRACE. J. Geod. 79, 467–478. doi: 10.1007/s00190-005-0480-z
Telford, W. M., Geldart, L. P., and Sheriff, R. E. (1990). Applied Geophysics, 2nd Edn. Cambridge: Cambridge University Press.
Thébault, E., Finlay, C. C., Beggan, C. D., Alken, P., Aubert, J., Barrois, O., et al. (2015). International geomagnetic reference field: the 12th generation. Earth planets space 67:79. doi: 10.1186/s40623-015-0228-9
Thébault, E., Vigneron, P., Langlais, B., and Hulot, G. (2016). A SWARM lithospheric magnetic field model to SH degree 80:126. Earth Planets Space 68. doi: 10.1186/s40623-016-0510-5
Thièblemont, D., Liégeois, J. P., Fernandez-Alonso, M., Ouabadi, A., Le Gall, B., Maury, R., et al. (2016). Geological Map of Africa at 1:10M Scale. Geological Map. CGMW-BRGM.
Toft, P. B., and Haggerty, S. E. (1986). A remanent and induced magnetization model of magsat vector anomalies over the west african craton. Geophys. Res. Lett. 13, 341–344. doi: 10.1029/GL013i004p00341
Toft, P. B., Taylor, P. T., Arkani-Hamed, J., and Haggerty, S. E. (1992). Interpretation of satellite magnetic anomalies over the west african craton. Tectonophysics 212, 21–32. doi: 10.1016/0040-1951(92)90137-U
Keywords: magnetic anomaly, BIF, modeling, rock magnetism, Mauritania
Citation: Launay N, Quesnel Y, Rochette P and Demory F (2018) Iron Formations as the Source of the West African Magnetic Crustal Anomaly. Front. Earth Sci. 6:32. doi: 10.3389/feart.2018.00032
Received: 15 December 2017; Accepted: 26 March 2018;
Published: 11 April 2018.
Edited by:
Manuel Catalán, Royal Institute and Observatory of the Spanish Navy, SpainReviewed by:
Anita Di Chiara, Lancaster Environment Centre, Lancaster University, United KingdomCopyright © 2018 Launay, Quesnel, Rochette and Demory. This is an open-access article distributed under the terms of the Creative Commons Attribution License (CC BY). The use, distribution or reproduction in other forums is permitted, provided the original author(s) and the copyright owner are credited and that the original publication in this journal is cited, in accordance with accepted academic practice. No use, distribution or reproduction is permitted which does not comply with these terms.
*Correspondence: Yoann Quesnel, quesnel@cerege.fr
Disclaimer: All claims expressed in this article are solely those of the authors and do not necessarily represent those of their affiliated organizations, or those of the publisher, the editors and the reviewers. Any product that may be evaluated in this article or claim that may be made by its manufacturer is not guaranteed or endorsed by the publisher.
Research integrity at Frontiers
Learn more about the work of our research integrity team to safeguard the quality of each article we publish.