 David Harris
 Judith Oduol
 Karl Hughes3
- 1School of Natural Sciences, Bangor University, Bangor, United Kingdom
- 2International Crops Research Institute for the Semi-Arid Tropics, Nairobi, Kenya
- 3World Agroforestry Centre, Nairobi, Kenya
The current paradigm of agricultural research and extension in support of rural development in Sub-Saharan Africa (SSA) is to disseminate improved technologies designed to increase the generally low crop yields per hectare on individual farms. Using data from a baseline survey (n = 7,539) from a large rural development programme implemented in five countries in SSA, we calculate the increases in yield per hectare required to significantly contribute to poverty alleviation for households managing such farms. We estimate the gap between current crop productivity and the productivity required to reach a poverty line of $1.90 per capita per day adjusted for Purchasing Power Parity (PPP). We find this gap to be very large, both in percentage and absolute terms. Median additional gross crop productivity required to reach this poverty threshold was: $324/ha/year (254% increase) in Mali; $1,359/ha/year (1,157% increase) in Niger; $4,989/ha/year (665% increase) in Ethiopia; $1,742/ha/year (818% increase) in Burkina Faso; $2,893/ha/year (1,297% increase) in Kenya. The required additional productivity taking account of production costs including the opportunity cost of family labor would need to be even higher. Given that (a) values of net productivity of improved rainfed crop technologies reported in the literature rarely exceed $1,000/ha/year; and (b) the majority of arable farms in SSA are two hectares or less with increasing trends toward land fragmentation, we argue that closing the yield gap among smallholder farmers in SSA will never—alone—be sufficient to meaningfully alleviate the high levels of poverty and deprivation many currently experience.
Introduction
The current paradigm of agricultural research and extension in support of rural development in Sub Saharan Africa (SSA) acknowledges that smallholder farmers are numerous, widespread and together produce large amounts of food and other produce (Lowder et al., 2016; Ricciardi et al., 2018a). Crop yields per hectare on individual smallholder farms, however, tend to be relatively low (Tittonell and Giller, 2013; Van Ittersum et al., 2016; Ricciardi et al., 2018b; Giller et al., 2021). Yield gaps, the difference between current yields obtained by farmers vs. potential yields obtainable under ideal conditions, exist for all major crops grown in SSA (Van Ittersum et al., 2013; Global Yield Gap Atlas, 2020). Therefore, the current predominant theory of change is that these low yields must be increased substantially to alleviate poverty and increase food security of smallholder farm families, as well as to increase national, regional and global food production (Godfray et al., 2010; Godfray and Garnett, 2014). Many improved technologies have been developed to enable this. New varieties of crops, appropriate input use (e.g., fertilizers, pesticides, and herbicides) and more effective natural resource management techniques have demonstrated impressive percentage increases over farmer practice in yields and profitability per hectare on research stations and in trials in farmers' fields (Harris and Orr, 2014; Devkota et al., 2019). If smallholder farmers adopt these improved technologies and operate them at a farm scale, while maintaining “small plot” levels of efficiency, logic would suggest that both poverty and food security goals can be achieved simultaneously.
However, we know that most arable farms in the world are two hectares or less (Lowder et al., 2016, 2021) and recent evidence suggests that farms of one hectare or less form the majority in SSA (Giller et al., 2021). It is legitimate, then, to ask how much difference these promised large percentage increases in yield per hectare will make to households operating on such small parcels of land? How much will the value of that extra produce contribute to the alleviation of poverty and food insecurity among such households? Although we recognize that poverty is multi-dimensional (e.g., Hellin et al., 2020) we have limited our analysis to consideration of income and consumption.
We attempt to answer these questions using data collected through a baseline survey from a large rural development programme—the Drylands Development Programme (DryDev)—that operated in dryland areas defined as receiving average annual rainfall between 400 and 800 mm, i.e., including “semi-arid” (400–600 mm) and the drier end of “sub-humid” 600–1,200 mm) of five countries in SSA. Crop production is widely practiced in such rainfall regimes, so this 6-year initiative was designed to provide relevant, contextually appropriate support to smallholder farmers in selected dryland areas of Burkina Faso, Mali, Niger, Ethiopia, and Kenya. It sought to facilitate a transition among these farmers from subsistence farming and dependence on emergency aid to sustainable rural development by increasing food and water security, enhancing market access, strengthening the local economy and reducing poverty.
Methodology
The data that informs this paper were drawn from a baseline survey that was carried out in the latter half of 2015 as part of the DryDev project led by the World Agroforestry Center (Drylands Development Programme, 2015; Hughes et al., 2016). Here, a quasi-experimental impact assessment was implemented. Changes in the status of various socioeconomic and land health indicators were compared between 3,466 households residing in 37 semi-arid sub-catchment sites targeted by the programme and 4,435 other households residing in another 34 neighboring and purposively matched comparison sub-catchment sites. Data from both the intervention and comparison sites were obtained through the administration of a household survey using mobile devices operating on the Open Data Kit (ODK) platform. Stratified proportionate random sampling was used to obtain representative data from targeted smallholder households within these sub-catchment sites. To further obtain representative data on male and female farmers from these households, the gender of each household's respondent was also randomly determined. Given the nature of our analysis in this paper, we pooled these data (collected before any project interventions) from all the surveyed sub-catchments, while excluding households that reported operating no agricultural land, those with missing consumption expenditure or household crop production data. The result is a total sample of 7,539 households, the country breakdown of which is presented in the tables and figures below.
Four main variables from DryDev's baseline survey are used in our analysis: household size, household land size, consumption expenditure per day per capita, and gross annual harvest value. While we acknowledge that the latter three variables in particular are associated with considerable measurement error (Fraval et al., 2019), we argue that it is not large enough to undermine our analysis and the resulting conclusions.
We obtained household landholding size by simply asking each interviewed farmer the size of his or her household's landholdings in locally familiar units, which were subsequently converted into hectares. We are cognizant of the findings of Carletto et al. (2015a) that farmers with small farms tend to overestimate the size of their holdings, while the reverse is the case for those with larger farms. However, given the results of our analysis (see below), we argue that such measurement error would have to be unrealistically large to affect our conclusions.
The second variable we use is daily household consumption expenditure per capita adjusted for purchasing power parity (PPP). We use this variable given that the measurement of global and national poverty, particularly in non-industrialized countries, relies heavily on the data that underlie it (Haughton and Khandker, 2009). To capture these data, several modules adapted from those used in many of the World Bank's Living Standards Measurement Surveys (LSMS) (Grosh and Glewwe, 2000) were integrated into DryDev's baseline survey instrument. We recognize that the timing of such surveys can influence results because consumption, income, etc., are not evenly distributed throughout the year (e.g., Murphy et al., 2012) but, as part of the baseline survey the timing was largely beyond the control of the project. Respondents were asked, in particular, the types of food their households consumed over the previous 7-day period, as well as the quantities. These quantities were then converted into monetary values by asking the respondent how much was paid for each food item or, if the food item was sourced through the household's own production, how much it would have cost if it were purchased from the local market. The respondents were further asked how much they spent on non-food items and services from a detailed list, such as soap, toothpaste, and minibus fares, over the past 4 weeks (regular non-food expenditure). Finally, they were asked about particular “big ticket” expenditures over the previous 12 months from another pre-defined list, such as school and hospital fees, clothes, and home repair (irregular non-food expenditure).
The per capita measure was computed as follows for each household: (1) the weekly cash values of each food item consumed during the past 7 days were added together and divided by seven, thereby estimating the daily cash value of food consumed by the household; (2) household expenditure on items from both the regular monthly non-food expenditure list and annual non-food expenditure list were added together and divided by 30 and 365, respectively, thereby estimating the household's average daily expenditure on regular and irregular non-food items; (3) the daily consumption expenditure estimated for food and the regular and irregular non-food items were then added together and converted into USD adjusted for PPP; and (4) to derive each household's per capita consumption expenditure, its PPP adjusted dollar value was divided by the number of its members (household size).
Finally, data on baseline crop production levels were obtained by asking the interviewed farmers (a) the specific crops their households grew in 2014; (b) the quantity of these crops that were harvested and their cash value at the time of harvest. There is a complex interplay between seasonal changes in prices and potential increases in incomes for farmers who are able and willing to store some or all surpluses (Djurfeldt, 2012), although storage itself may incur additional costs, and consequences would differ for each household so farm gate prices at the time of survey were used for convenience. (c) the expenses incurred in producing and/or marketing each crop (e.g., inputs, labor, and transport); and, finally, (d) the quantity sold, if any. The resulting data for each crop were aggregated to construct several variables, including gross harvest cash value and net harvest cash value. We focus our analysis for this paper on the former for several reasons: (a) while efforts during data collection were made to mitigate double counting crop production and marketing expenses, it is unlikely that these efforts were entirely successful, thereby leading to additional measurement error; (b) only hired labor costs were captured as a possible expense and not that of the interviewed farmer and/or other household members so any shadow prices for family labor were not captured; (c) the gross and net harvest values do not differ considerably for the vast majority of households in the dataset (Table 1), thereby indicating minimal costs and/or underreporting (including the value of family labor as mentioned above) and (d) the concept of gross harvest value is closer to the key concepts agronomists use when defining improvements, e.g., increases in yield. To ensure compatibility of this measure with the consumption expenditure per capita measure, we similarly converted the associated figures into PPP using data from the World Bank's website: http://data.worldbank.org/indicator/PA.NUS.PPPC.RF
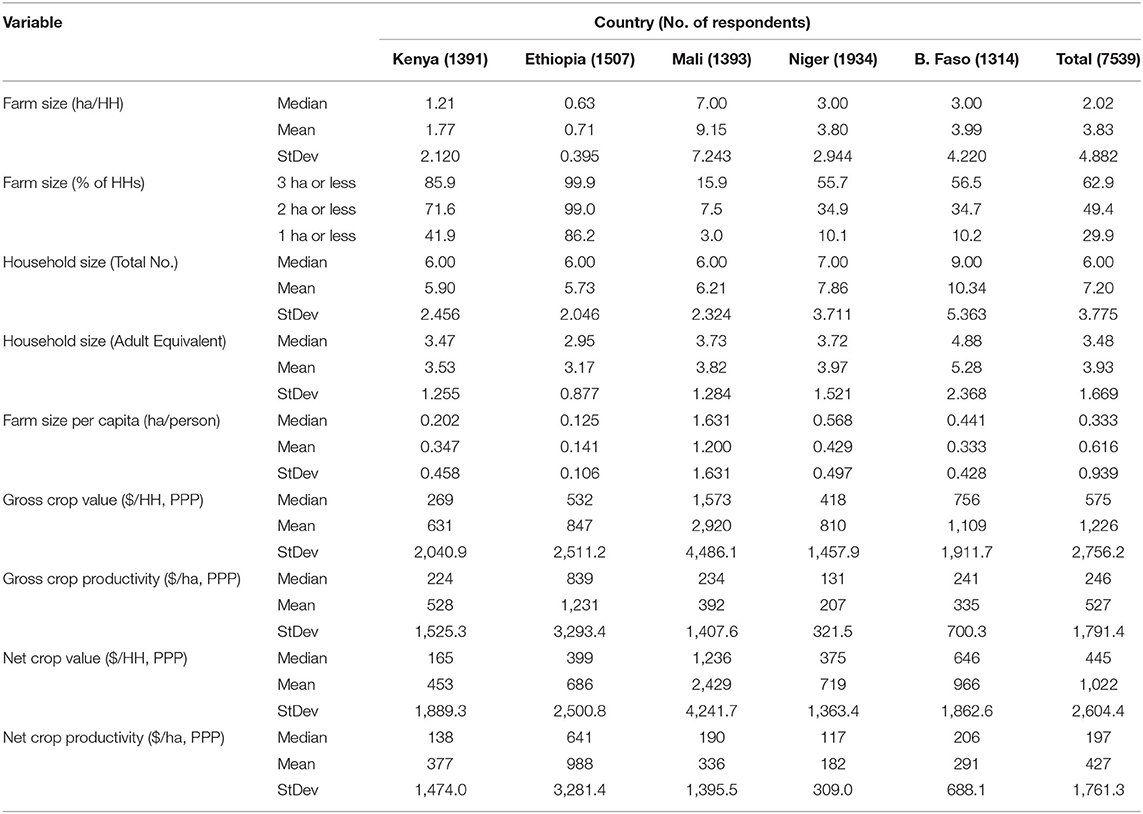
Table 1. Farm size, household size, and crop performance.
In order to be able to compare per capita household daily income (PDI) from farming with per capita daily consumption and with the potential per capita daily farm income given the farm size and the household size, we used the following equation (from Harris and Orr, 2014) to calculate current per capita household daily income from farming:
By setting the PDI to a particular target value such as a poverty “line” and re-arranging the equation slightly we are able to calculate the (gross or net) Required Return to Land (RR1.9, $/ha/y) necessary for a household to cross that line, in this case $1.90 per person per day (Ferreira et al., 2015). We chose this international value to enable simple cross-country comparisons and we recognize that other targets are possible, such as the living wage (Wage Indicator Foundation, 2021). However, living wage values are usually calculated on the basis of representative families or single individuals and are of limited use in comparing individual households of differing sizes as we have done here. Since living wage values are generally (much) higher than the international poverty line, the latter represents an “easier” target to achieve.
In addition, we calculated an Intensification Benefit Index (IBI)—the rate at which PDI will increase if (gross or net) returns to land increase, by whatever means—which is a measure of the responsiveness of personal daily income from farming to agricultural intensification. IBI is a ratio with units of cents/dollar and so is independent of cost-of-living differences and exchange rates between countries and over time (Harris, 2019). The relation between PDI, annual return to land and IBI is shown schematically for three hypothetical households in Figure 1. The point at which PDI crosses the poverty line is the annual return to land required to generate $1.90/p/d for members of any household with a given number of members and amount of operated land. Changes in household size or land farmed will change IBI. For instance, the hypothetical household in Figure 1 with an IBI value of 0.39 cents/dollar farms 7.1 ha and has 5 members. If they can only farm 5 ha then their IBI will decline to 0.27 cents/dollar as a consequence of a reduction in potential supply from less land. Conversely, if an additional person joins the household while still farming 7.1 ha, IBI will also fall to 0.32 cents/dollar but as a consequence of increased demand for supporting income. Values of IBI calculated in this paper represent a snapshot in time.
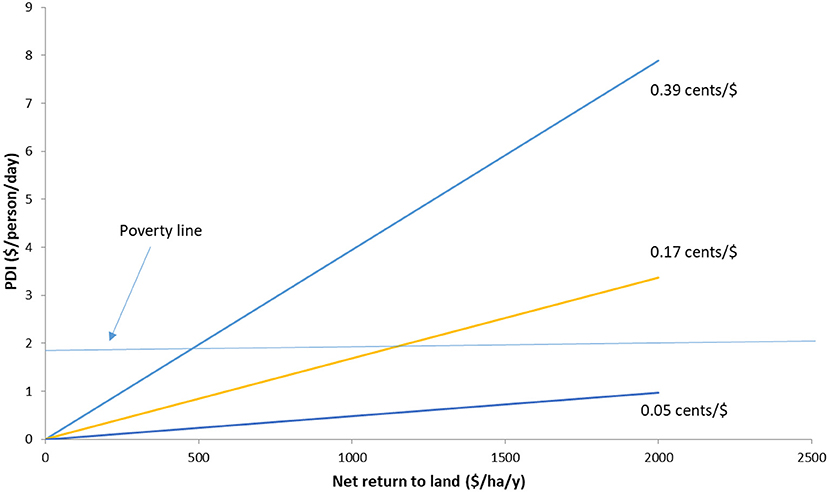
Figure 1. Relation between personal daily income (PDI) and annual returns to land for three exemplar households that vary in size and farm size. IBI is the gradient of the line for each household and the International Poverty Line of $1.90 per person per day is also shown.
Results
Farm and Household Characteristics and Farm Performance
Farm size per household varied markedly both within and between country samples (Table 1). Median farm size ranged from only 0.63 hectares in Ethiopia to 7 hectares in Mali. Mean values were larger than the median in all countries, reflecting the skewed distribution toward smaller farms, and coefficients of variation ranged from 65% for Ethiopia to 120% for Kenya. The percentage of farms of two hectares or less for the whole sample was around 50%, i.e., less than the estimate of 73.8% by Lowder et al. (2021) for all of SSA. The two East African countries Kenya (71.6%) and Ethiopia (99.0%) had higher proportions of these small farms than the three West African samples: Mali (7.5%); Niger (34.9%); Burkina Faso (34.7%).
Household size varied between country samples less than farm size with a median size of 6 in Kenya, Ethiopia, and Mali (and overall) but 7 in Niger and 9 in Burkina Faso. Median farm size per capita (based on the total number of people in the household) ranged from 0.125 ha per person in Ethiopia to 1.631 ha per person in Mali, with an overall median for the sample of 0.333 ha per person. Mean values ranged from 0.141 ha per person in Ethiopia to 1.20 ha per person in Mali. The mean for the whole sample was 0.616 ha per person and, again, in all countries the median values were smaller than the means, reflecting distributions skewed towards smaller values.
There were large differences between country samples in the value of crops produced per household, with an almost 6-fold difference in median values (and an almost 5-fold difference in mean values) of gross production between those for Kenya and for Mali. However, when expressed on a per hectare basis, median gross productivity was clustered between 130 and 250 $/ha/y, with only Ethiopia being markedly more productive with $839/ha/y. Mean values for gross productivity followed a broadly similar pattern (Table 1). Net crop value per household and net crop productivity per hectare were all, as expected, less than their gross counterparts but not by very large margins, suggesting quite small production costs or, more likely, difficulties mentioned earlier in assigning all costs to crop production. Typically, the ratio of net value (when all costs, including all labor, are taken into account) to gross value in maize-based systems ranges from around 40% to 60% depending on management (Kihara et al., 2012, Table 4) and can go lower, to around 25%, on low fertility soils (e.g., Guto et al., 2011, Table 6).
Income From Crops and Contribution to Household Consumption
Overall, median ($1.27/p/d) and mean ($1.75/p/d) values of consumption were small, and below the poverty line of $1.90/p/d. Country sample median values varied from $0.80/p/d in Burkina Faso to $1.96/p/d in Kenya whereas mean values ranged from $1.02/p/d in Burkina Faso to $2.85/p/d in Kenya (Table 2). Overall, crop gross value contributed only 19.2% to median household consumption (ranging from 7.1% in Kenya to 49.3% in Mali) and in only 7.3% of households did it contribute to 100% of their consumption (range 0.9% in Kenya to 24.6% in Mali). On the basis of net crop value, contributions to household consumption were lower still, with even fewer households (0.7% in Kenya to 19.7% in Mali) achieving or exceeding their daily consumption levels. Given that net cropping income values are likely to be overestimates because the value of family labor was not considered, actual contributions to consumption will likely be reduced even further in real terms.
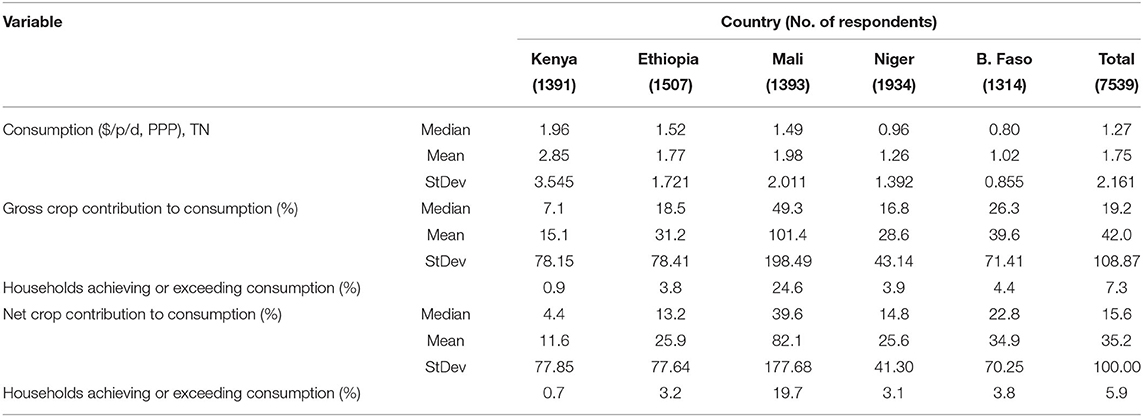
Table 2. Household consumption ($ per person per day), the percentage contribution of gross- and net crop contribution to it and the percentage of households for which crop production meets or exceeds it.
Income From Crops and Contributions to Crossing the Poverty Line
Gross crop production contributed only small proportions of the value required for households to achieve $1.90/p/d, with median values varying from 7 to 15% and only in Mali with 38% did it contribute more (Table 3). Except for Mali, where gross crop production value exceeded the poverty line in 19% of households, only a small proportion (1.4–2.3%) of households in the other four countries had reached the line with gross crop income. Net values (but excluding the opportunity cost of family labor) were all correspondingly smaller but varied in a similar pattern.
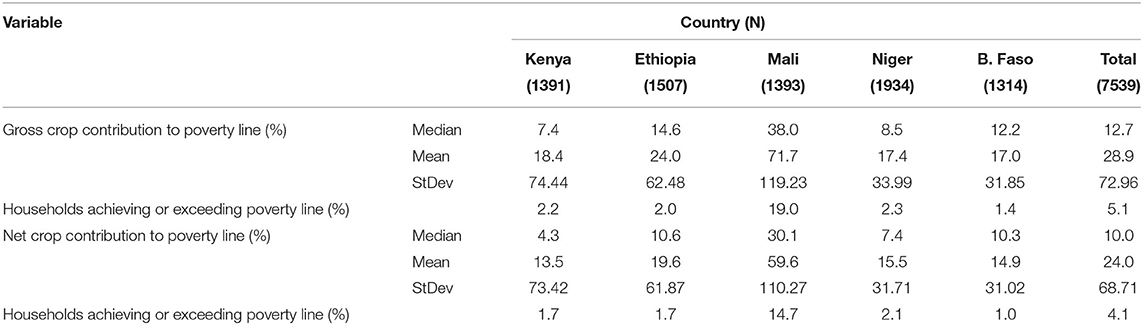
Table 3. Gross and net crop contribution toward generating $1.90 per person per day.
Median- and mean crop productivity per hectare were very low in all country samples except, perhaps, in Ethiopia (Table 1) and crop production was not contributing very much toward current household consumption (Table 2) or to reaching the poverty line (Table 3). Figure 2 shows the proportion of households in each country sample that require a given net agricultural return ($/ha/y) to generate a personal daily income of $1.90 per person per day.
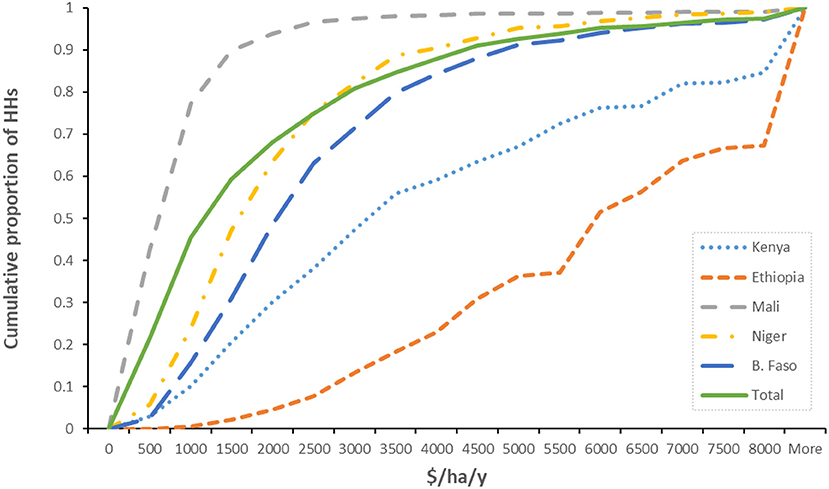
Figure 2. The proportion of households that require a given agricultural return ($/ha/y) to generate a personal daily income of $1.90 per person per day.
The median additional gross crop productivity required to generate $1.90/p/d for successive quartiles of households is shown in Table 4 while the percentage increase over current productivity which that represents is shown in Table 5. Although it is difficult to generalize about the feasibility of achieving these additional levels of productivity because they are composite values comprised of different crops and prices aggregated for each household, gross productivity in these terms is broadly proportional to “yield.” At first glance the value of 713 $/ha/y for the 25th percentile of the overall sample (Table 4) seems achievable. However, this represents a 365% increase in “yield” over the current cropping performance (Table 5). Ethiopia requires the same 365% increase in productivity from a base that is already relatively high at $839/ha/y (Table 1) and Kenya, Niger and Burkina Faso all need to increase gross productivity by over 500%. Even Mali needs to more than double productivity. The large percentage increases in gross productivity noted above are just for the first quartile (least needy) of households and the necessary increases become even larger for successive quartiles, with the 50th percentile of households in Kenya and Niger requiring increases of more than 1,000%. For the 75th percentile, all countries except Mali (where over 500% increase is required) need to improve gross crop production by 1,500–3,500%. Required increases in net productivity are even greater than for gross increases (data not shown).
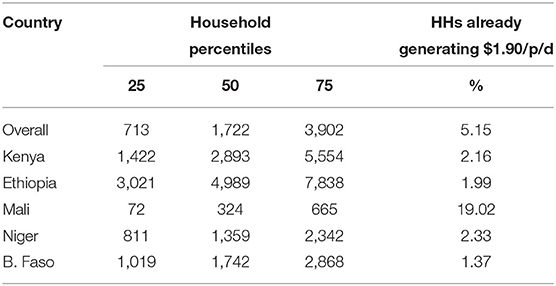
Table 4. Additional (by quartile of households' required increase) gross crop productivity ($/ha/y) required for households to generate $1.90 per person per day.
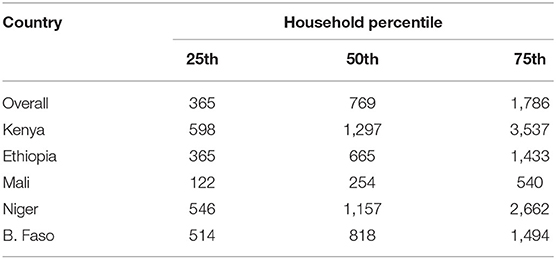
Table 5. Percent increase in gross crop productivity required (by quartile of households' required increase) for households to generate $1.90 per person per day.
Intensification Benefit Index of Households
The second metric used in this paper, IBI, describes the rate in cents per dollar at which household members will benefit from productivity increases (Harris, 2019), and its distribution within each country sample is shown in Figure 3. The distribution is negatively skewed for all countries except Mali, reflecting the larger median and mean per capita land values for that country (Table 1).
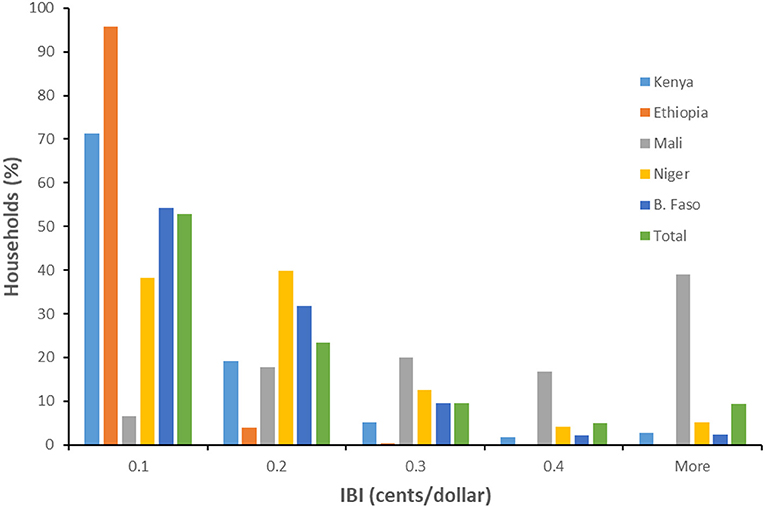
Figure 3. The proportion of households with a given Intensification Benefit Index (cents/dollar).
Gender Differences
Overall, only around 9% of households were headed by women, ranging from 4% in Mali and Niger, 7% in Burkina Faso, 9% in Ethiopia but 20% in Kenya (Table 6). While it is difficult to be definitive about such relatively small samples, the median value of household size for male-headed households tended to be larger than for female-headed households by around 20% in Kenya and Mali, by around 40% in Niger, by 50% in Ethiopia and by 100% in Burkina Faso. In contrast, median farm size of male-headed households overall was about twice that of female-headed households although this difference was not consistent across countries, with little difference in Kenya and Ethiopia, small differences in Mali and Niger but a large difference, around 100%, in Burkina Faso (Table 6). Values of consumption per capita did not differ substantially in relation to gender in any country and trends were inconsistent. Gross- and net crop productivity were remarkably consistent by gender within countries.
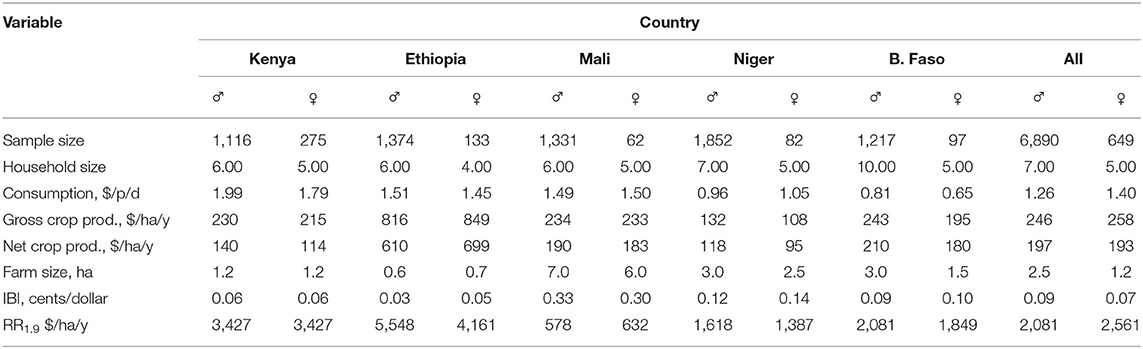
Table 6. Median household characteristics and agricultural performance by country and by gender.
Because female-headed households tended to have less land but also smaller households, the median values of RR1.9 did not differ as much as one might have expected. Although overall female-headed households required 23% higher productivity to reach the poverty line than male-headed households, this was predominantly due to a large gender gap in Ethiopia. Percentage differences were much smaller in the other countries, ranging from no difference in Kenya to 16% in Niger. Similarly, and for the same reasons, values of IBI, though small, were the same (0.06 cents/dollar) for men and women in Kenya and actually higher for women than for men in Ethiopia (0.05 vs. 0.03), Nigeria (0.14 vs. 0.12), and Burkina Faso (0.10 vs. 0.09). Only in Mali, where overall IBI values were highest, did men have higher values (0.33 vs. 0.30).
Discussion
Crop productivity per hectare was very low and there would seem to be opportunities for project interventions to raise it, even in Ethiopia where productivity was much higher than in the other four country samples. This difference requires some explanation. Median and mean farm size in Ethiopia is the smallest of the five countries and there is some evidence in the literature that the relation between productivity and farm size is U-shaped, because operations on very small farms can be much more efficient (Carter, 1984; Carletto et al., 2013, 2015a). The productivity advantage of small farms is also likely to be exaggerated when family labor is not accounted for, as here.
The project targeting was successful in that households in the five countries were predominantly poor with median and mean consumption estimates below the World Bank poverty line (Ferreira et al., 2015). The actual contribution of crop production to household consumption was mostly small (and was likely smaller still given the uncertainties surrounding production costs) except, perhaps, for Mali where the median gross contribution was almost 50%.
The proportion of very small farms, i.e., those two hectares or less, of just under 50% was lower for the overall sample than estimates of the average for SSA as a whole (e.g., 74% by Lowder et al., 2021, Figure 2, Appendix A) but was higher in the two East African samples and lower in the three West African ones. Farm size tends to be larger in less productive areas and where population pressure is less, and it is a matter of judgement whether farm size distribution in this survey can be considered representative of SSA. Nevertheless, there is a huge number of farms in SSA smaller than 5 hectares; 50,834,728 according to Lowder et al. (2021), Table 2, Appendix B, comprising 92.7% of all SSA farms. Given the closed relation between farm size, family size, and personal daily incomes, the prospects for taking those farmers out of poverty through crop-, or even farm-, production alone must be slim.
Consumption would have been supported by sources of income other than from crop production. Unfortunately, we do not have detailed information about these other activities. However, substantial proportions of the households in each country indicated, by answering the question “Did anyone from your household do any of the following (livestock production; off-farm, casual or formal work) in the last 12 months,” that this was the case. The proportion of households involved in some form of livestock-related activity ranged from 55% in Niger to 91% in Kenya. Although livestock keeping was quite common, the proportion of households owning more than two cattle ranged from 13% in Ethiopia to 27% in Mali (data not shown) and suggests that our original assumption that these were not livestock-intensive areas was reasonable. Those households involved in some form of off-farm work ranged from 27% in Mali to 81% in Kenya (data not shown). Broadly speaking, the mean percentage cropping contribution to household consumption of each country was inversely proportional to the proportion of households reporting engagement in off-farm work.
We have used two measures of possible impact on household prosperity of improvements in crop production. Both require only three variables related to households. Two (farm size and household size) are relatively easy to collect through surveys although it should be noted that difficulties may be encountered (Carletto et al., 2015b; Fraval et al., 2019) and care is required in defining exactly what the two terms mean in any given circumstance, e.g., what constitutes a household and to what extent land is utilized. Field area can now be measured using a variety of GPS-enabled smartphone apps, a development that should improve data quality in the future. The third variable, net or gross profitability per hectare per year, is more difficult to measure. Few datasets exist that have detailed estimates of actual net crop (or livestock) profitability on farms in developing countries, particularly on a whole-farm basis rather than for individual crops, and we would urge greater research effort in this area. Having said that, once collected on a large scale these three variables can be of immense value in targeting and planning development interventions both within and beyond agriculture.
Both measures assume equitable benefits within households which may not always be the case (Quisumbing and Maluccio, 1999; Anderson et al., 2017; Acosta et al., 2019), but this is a reasonable assumption in the absence of more detailed data on intra-household dynamics that is both expensive to collect and difficult to interpret. Both also, in this paper, use the total number of individuals as the measure of household size, rather than Adult Equivalents because the international poverty line is defined per person rather than per adult equivalent (Ferreira et al., 2015). Using adult equivalents in the calculations reduces the number of “units” in any household to be supported by income, thus lowering thresholds for success and giving a more optimistic scenario. So, for example, a value of RR1.9 of $2,000 per hectare per year for a household in Kenya, based on adult equivalents is approximately equal to $3,175 per hectare per year based on the total number of people in the household. Conversely, an IBI value in Mali of e.g., 0.31 cents per dollar based on adult equivalents would be around 0.20 cents per dollar when all individuals are counted.
The first measure, RR1.9, is the level of production required to take household members above the specified poverty line of $1.9 per person per day. Together with estimates of current income or consumption, we can then define the size of the task at hand, i.e., the gap in crop productivity or profitability that needs to be closed to move households across the poverty line. Figure 2 and Tables 4, 5 show that very high levels of returns per hectare per year would be required to generate a personal daily income of $1.90 per person per day for large proportions of the samples from all countries.
We know crop productivity at baseline, and we have calculated the size of the “yield” gap between this and the levels required to support consumption of $1.90 per person per day, both in absolute terms (RR1.9, Table 4) and as a percentage of current productivity (Table 5). The increases required are substantial, ranging from 122 to 3,537% depending on the country and the quartile of each population (Table 5). It should be noted that Tables 4, 5 are based on required increases in gross productivity and that targets based on net productivity, i.e., considering all costs of production, including the opportunity cost of family labor—important for smallholder rural households that generally pursue diverse livelihoods (Harris and Orr, 2014; Giller et al., 2021)—would be higher still and so even more difficult to achieve. It should also be noted that $1.90/p/d is not an ambitious measure of prosperity, representing as it does very low levels of welfare and well-being.
Now we know the size of the profitability gap, we ask the question “Can our proposed interventions, if adopted, close this gap?” Unfortunately, there is limited information concerning the net returns to land of the project interventions. One technology, the construction and use of Zai pits—shallow planting basins with organic materials such as manure added and designed to harvest rainwater and improve its infiltration—was widely promoted by the project (ICRAF, 2020) to address the dual objectives of increasing crop yields and reclaiming degraded land. In Kenya, Muli et al. (2017) reported a 167% increase (from 0.9 t/ha to 2.4 t/ha) in the yield of maize when grown in Zai pits compared with conventional farmers' practice, although gross margins were only about $25 per hectare per season due to high production costs. Also in Kenya, Kimaru (2017) measured yield and profitability of sorghum grown in Zai pits with various combinations of manure and mineral fertilizer. She reported total gross margins using Zai pits over two short-rain seasons and one long-rain season that ranged from minus $16/ha (i.e., a loss) to $1624/ha. With two seasons per year in this part of Kenya this gives a crude annual average estimate ranging from minus $10.7/ha/year to $1088/ha/year. Conventional planting (not Zai pits) with comparable nutrient inputs tended to produce lower yields but were similarly profitable, due to lower production costs. In Burkina Faso, Schuler et al. (2016) reported a small average increase in gross margins (from $67/ha to $81/ha) when Zai pits were used, with a maximum value of $169/ha in the case of pearl millet. Returns to labor were less than the local wage rate, although the authors speculated that off-farm opportunities were rare.
The project further promoted a wide range of interventions and training at local- and community levels, some of which are more complicated (and costly) than others but also potentially more profitable. For instance, there was a large programme of training and facilitation in building farm ponds for water collection and storage, thus enabling supplementary irrigation and so broadening the choice of crops to include higher value options. Many farm ponds of varying sizes were built that contributed positively to the livelihoods of multiple households, although it is not clear to what extent each household, or each household member, benefited in net terms (ICRAF, 2020).
Without more information on the economic performance of the various interventions once adopted and operated by farmers it is not possible to analyze in detail the contributions any gains might make to household income. However, based on the limited information presented above on one of them (Zai pits), surveys of the literature on the profitability of cropping best practices, e.g., Harris and Orr (2014) and limited data on the performance of various cropping “best practices” in these five countries (Duguma et al., 2010; Mucheru-Muna et al., 2010; Otinga et al., 2013; Badolo, 2017; Elias et al., 2017; Theriault et al., 2018; Issoufa et al., 2020), it is unlikely that even large percentage increases in yield following adoption of improved technologies will significantly increase the income of most households. Crop production increases can improve household food security and nutritional quality and will contribute some progress toward poverty lines, but they are insufficient on their own to take smallholder farmers out of poverty (Gassner et al., 2020).
The second metric used in this paper, IBI, describes the rate in cents per dollar at which household members will benefit from productivity increases and can be used to characterize individual households and communities (Harris, 2019). IBI is particularly useful because, as a ratio of two locally measured values it is independent of differences between currencies and so can be used for comparisons between households or communities in different countries. Because farm size and household size are relatively easy to obtain, IBI could be used to quickly characterize households and communities in relation to how, and to what extent given the potential and limitations of likely interventions, households and communities would benefit financially from their adoption. In the absence of changes in household size or farm size, increased returns to land will move households along their particular IBI line (Figure 1), resulting in higher PDI values. In theory these lines continue to infinity; in practice limitations of climate, soils, markets, resources, infrastructure, and skills will influence how much the potential of new technologies will be realized and where the “end point” on the line will be for any household. It is interesting to note that IBI values in four of the five country samples were either the same or higher for women than for men. This is counterintuitive in that it implies that female-headed households need not be disadvantaged in the income they would derive from any profitability increases. However, widely acknowledged gender-related difficulties in learning about and effectively adopting improved technologies (e.g., Kilic et al., 2015) mean that such a potential advantage may not be realized in practice.
Although only crop production data were used in this analysis, the form of these two metrics allows the effects of all agricultural production, including livestock, to be taken into account. These data also constitute a baseline against which the effects of project interventions (and other development initiatives) can be measured. The relation between per capita land and the profitability required to reach any given personal income target, in this case $1.90/p/d, is summarized in Figure 4 and reflects the difference between Mali and the other four countries' samples. The degree of closure of the gap (movement along the x-axis of Figure 4) between current performance and RR1.9 will be a measure of the effectiveness of agricultural interventions in raising household consumption toward the $1.90/p/d—or any other—poverty line and will enable a degree of partitioning of any effects between technology adoption and changes in farm size and household size.
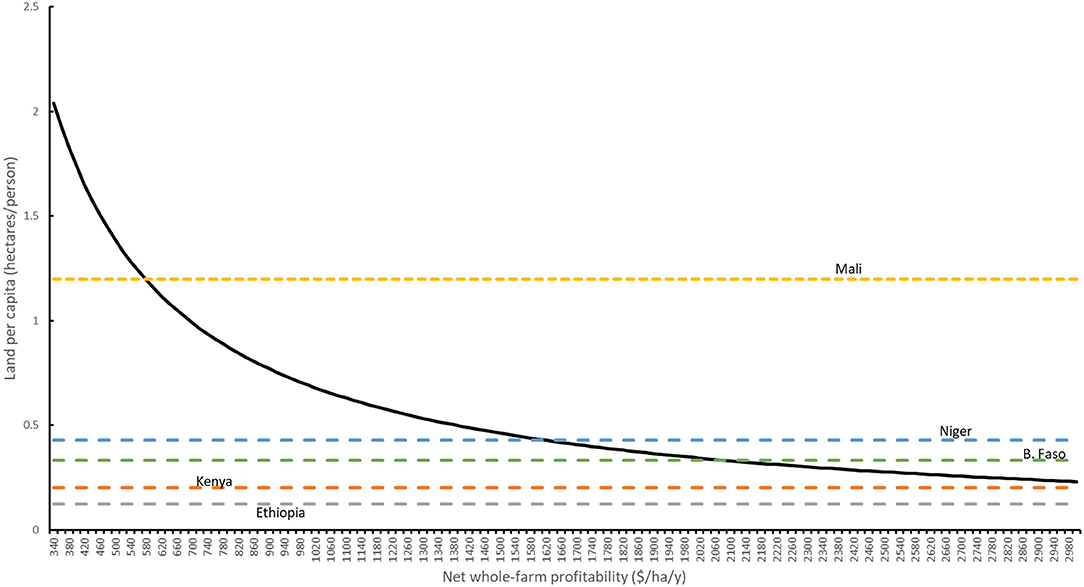
Figure 4. Combinations of land per capita and net whole-farm profitability that will generate an income of $1.90 per person per day. Horizontal lines are the median per capita values for the five country samples.
DryDev—like many other rural development projects—sought to bolster the income, food security, and resilience of the smallholder farming households it targeted. A key pathway that was followed involved the promotion of “improved technologies,” such as Zai pits and farm ponds. The project impact assessment report (ICRAF, 2020) reveals that this pathway yielded mixed results, a finding that is certainly not atypical of interventions that promote research-informed technologies (Stevenson et al., 2019). However, we have demonstrated in this paper that even if the adoption and resulting effects of improved cropping technologies were realized at optimal levels, the project's transformative impacts would not have been realized. The returns for households with small farms would just be too small.
Small-farm households in these dryland areas are structurally constrained in the degree to which they can improve their livelihoods through crop production. More generally, the limited range of profitability values per hectare using best practice technologies suggests that this is also the case in more productive areas (Harris and Orr, 2014). A recent study involving a larger number of rural households across SSA (Giller et al., 2021) has come to a similar conclusion. Despite these structural limitations there is still potential to bolster smallholder productivity. Our central argument is that the inherent limitations of what can be achieved should be explicitly considered and communicated when devising and promoting such technologies (Berrea et al., 2017). As long as they continue to exist, the majority of smallholder farmers across Africa and other non-industrialized settings will continue to rely on multiple non-farming related endeavors—where they exist—out of sheer necessity. Assuming that farmers will invest additional labor and/or resources associated with improved technologies, even when convinced of their profitability enhancing effects, should therefore not be taken for granted and this theory of change needs to be revisited.
Data Availability Statement
The raw data supporting the conclusions of this article will be made available by the authors, without undue reservation.
Ethics Statement
Ethical review and approval was not required for the study on human participants in accordance with the local legislation and institutional requirements. Written informed consent for participation was not required for this study in accordance with the national legislation and the institutionalrequirements.
Author Contributions
DH conceived the study, analyzed the data, and wrote the paper. KH designed the data collection exercise and wrote the paper. JO collected and collated the data and wrote the paper. All authors contributed to the article and approved the submitted version.
Funding
The Ministry of Foreign Affairs, the Netherlands. Grant no. NETH-1075. World Vision Australia. CGIAR Research Program on Grain Legumes and Dryland Cereals (GLDC). Grant no. GLDC-FP3-3.13.
Conflict of Interest
The authors declare that the research was conducted in the absence of any commercial or financial relationships that could be construed as a potential conflict of interest.
Publisher's Note
All claims expressed in this article are solely those of the authors and do not necessarily represent those of their affiliated organizations, or those of the publisher, the editors and the reviewers. Any product that may be evaluated in this article, or claim that may be made by its manufacturer, is not guaranteed or endorsed by the publisher.
References
Acosta, M., van Wessel, M., van Bommel, S., Ampaire, E. L., Twyman, J., Jassogne, L., et al. (2019). What does it mean to make a 'joint' decision? Unpacking intra-household decision making in agriculture: implications for policy and practice. J. Dev. Stud. 56, 1210–1229. doi: 10.1080/00220388.2019.1650169
Anderson, C. L., Reynolds, T. W., and Gugerty, M. K. (2017). Husband and wife perspectives on farm household decision-making authority and evidence on intra-household accord in rural Tanzania. World Dev. 90, 169–183. doi: 10.1016/j.worlddev.2016.09.005
Badolo, F.. (2017). Cost and Benefit Analysis of Cropping Systems for Sorghum and Maize Production Under the Africa RISING Project in Mali. Ibadan: International Institute of Tropical Agriculture.
Berrea, D., Corbeels, M., Rusinamhodzi, L., Muyenje, M., Thierfelder, C., and Lopez-Ridara, S. (2017). Thinking beyond agronomic yield gap: Smallholder farm efficiency under contrasted livelihood strategies in Malawi. Field Crops Res. 214, 113–122. doi: 10.1016/j.fcr.2017.08.026
Carletto, C., Gourlay, S., and Winters, P. (2015a). From guesstimates to GPStimates: Land area measurement and implications for agricultural analysis. J. Afr. Econ. 24, 593–628. doi: 10.1093/jae/ejv011
Carletto, C., Jolliffe, D., and Banerjee, R. (2015b). From tragedy to renaissance: improving agricultural data for better policies. J. Dev. Stud. 51, 133–148. doi: 10.1080/00220388.2014.968140
Carletto, C., Savastano, S., and Zezza, A. (2013). Fact or artefact: The impact of measurement errors on the farm size-productivity relationship. J. Dev. Econ. 103, 254–261. doi: 10.1016/j.jdeveco.2013.03.004
Carter, M. R.. (1984). Identification of the inverse relationship between farm size and productivity: An empirical analysis of peasant agricultural production. Oxf. Econ. Pap. 36, 131–145. doi: 10.1093/oxfordjournals.oep.a041621
Devkota, K. P., Pasuquin, E., Elmido-Mabilangan, A., Dikitanan, R., Singleton, G. R., Stuart, A. M., et al. (2019). Economic and environmental indicators of sustainable rice cultivation: A comparison across intensive irrigated rice cropping systems in six Asian countries. Ecol. Indic. 105, 199–214. doi: 10.1016/j.ecolind.2019.05.029
Djurfeldt, A. A.. (2012). Seasonality and farm/non-farm interactions in Western Kenya. J. Mod. Afr. Stud. 50, 1–23. doi: 10.1017/S0022278X11000589
Drylands Development Programme (2015). A Farmer-Led Programme to Enhance Water Management, Food Security, and Rural Development in the Drylands of Burkina Faso, Mali, Niger, Ethiopia, and Kenya. Inception Report. Ministry of Foreign Affairs, Netherlands.
Duguma, L. A., Darnhofer, I., and Hager, H. (2010). The financial return of cereal farming for smallholder farmers in the Central Highlands of Ethiopia. Experi. Agri. 46, 137–153. doi: 10.1017/S0014479709990846
Elias, A., Nohmi, M., and Yasunobu, K. (2017). Cost-benefit analysis of cultivating three major crops and its implication to agricultural extension service: a case study in North-West Ethiopia. Japan. J. Agri. Econ. 19, 31–36. doi: 10.18480/jjae.19.0_31
Ferreira, F. H. G., Chen, S., Dabalen, A., Dikhanov, Y., Hamadeh, N., Jolliffe, D., et al. (2015). A Global Count of the Extreme Poor in 2012: Data Issues, Methodology and Initial Results. Poverty Global Practice Group &Development Data and Research Groups, Policy Research Working Paper 7432. World Bank, Washington, DC. doi: 10.1596/1813-9450-7432
Fraval, S., Hammond, J., Wichern, J., Oosting, S. J., de Boer, I. J. M., Teufel, N., et al. (2019). Making the most of imperfect data: a critical evaluation of standard information collected in cross-sectional farm household surveys. Experi. Agri. 55, 230–250. doi: 10.1017/S0014479718000388
Gassner, A., Harris, D., Mausch, K., Terheggen, A., Lopes, C., Finlayson, R. F., et al. (2020). Poverty eradication and food security through agriculture in Africa: rethinking objectives and entry points. Outlook Agric. 48, 309–315. doi: 10.1177/0030727019888513
Giller, K. E., Delaune, T., Silva, J. V., van Wijk, M., Hammond, J., Descheemaeker, K., et al. (2021). Small farms and development in sub-Saharan Africa: Farming for food, for income or for lack of better options? Food Security. doi: 10.1007/s12571-021-01209-0
Global Yield Gap Atlas (2020). Available online at: http://www.yieldgap.org/ (accessed December 30, 2020).
Godfray, C., Beddington, J. R., Crute, I. R., Haddad, L., Lawrence, D., Muir, J. F., et al. (2010). Food security: the challenge of feeding 9 billion people. Science 327, 812–818. doi: 10.1126/science.1185383
Godfray, H. C. J., and Garnett, T. (2014). Food security and sustainable intensification. Philos. Trans. R. Soc. B Biol. Sci. 369, 2012–0273. doi: 10.1098/rstb.2012.0273
Grosh, M. E., and Glewwe, P. (2000). Designing Household Survey Questionnaires for Developing Countries: Lessons from 15 Years of the Living Standards Measurement Study, Volume 2. Washington, DC.
Guto S. N. Pypers P. Vanlauwe B. de Ridder N. and K. E. Giller K.E. (2011). Socio-ecological niches for minimum tillage and crop-residue retention in continuous maize cropping systems in smallholder farms of Central Kenya. Agron. J. 103, 1–11. doi: 10.2134/agronj2010.0359
Harris, D.. (2019). Intensification Benefit Index: how much can rural households benefit from agricultural intensification? Experi. Agri. 55, 273–287. doi: 10.1017/S0014479718000042
Harris, D., and Orr, A. (2014). Is rainfed agriculture really a pathway from poverty? Agric. Syst. 123, 84–96. doi: 10.1016/j.agsy.2013.09.005
Haughton, J. H., and Khandker, S. R. (2009). Handbook on Poverty and Inequality. Washington, DC: World Bank.
Hellin, J., Bali,é, J., Fisher, E., Blundo-Canto, G., Meah, M., Kohli, A., et al. (2020). Sustainable agriculture for health and prosperity: stakeholders' roles, legitimacy and modus operandi. Dev. Pract. 30, 965–971. doi: 10.1080/09614524.2020.1798357
Hughes, K., Oduol, J., Coulibaly, J., Binam, J., Vagen, T.-G., Hagazi, N., et al. (2016). The Drylands Development Programme (DRYDEV) Baseline Survey Report. Nairobi: World Agroforestry Center.
ICRAF (2020). The Drylands Development Programme (DRYDEV) Impact Assessment Report. Nairobi: World Agroforestry Center.
Issoufa, B. B., Ibrahim, A., and Abaido, R. C. (2020). Agronomic and economic benefits of integrated nutrient management options for cowpea production. Experi. Agri. 56, 440–452. doi: 10.1017/S0014479720000071
Kihara, J., Bationo, A., Waswa, B., Kimetu, J. M., Vanlauwe, B., Okeyo, J., et al. (2012). Effect of reduced tillage and mineral fertilizer application on maize and soybean productivity. Experi. Agri. 48, 159–175. doi: 10.1017/S0014479711000895
Kilic, T., Winters, P., and Carletto, C. (2015). Gender and agriculture in sub-Saharan Africa: introduction to the special issue. Agri. Econ. 46, 281–284. doi: 10.1111/agec.12165
Kimaru, S. W.. (2017). Zai Pits and Integrated Soil Fertility Management Enhances Crop Yields in the Drier Parts of Tharaka Nithi County, Kenya. PhD Thesis, Kenyatta University, Kenya.
Lowder, S. K., Sánchez, M. V., and Bertini, R. (2021). Which farms feed the world and has farmland become more concentrated? World Dev. 142:105455. doi: 10.1016/j.worlddev.2021.105455
Lowder, S. K., Skoet, J., and Raney, T. (2016). The number, size, and distribution of farms, smallholder farms, and family farms worldwide. World Dev. 87, 16–29. doi: 10.1016/j.worlddev.2015.10.041
Mucheru-Muna, M., Pypers, P., Mugendi, D., Kung'u, J., Mugwe, J., Merckx, R., et al. (2010). A staggered maize-legume intercrop arrangement robustly increases crop yields and economic returns in the highlands of Central Kenya. Field Crops Res. 115, 132–139. doi: 10.1016/j.fcr.2009.10.013
Muli, M. B., Kengo, D, Mzingirwa, A., and Musila, R. (2017). Performance of drought tolerant maize varieties under water harvesting technologies in the coastal region of Kenya. East African Agri. Forestry J. 82, 168–174. doi: 10.1080/00128325.2017.1387225
Murphy, S., Ruel, M., and Carriquiry, A. (2012). Should Household Consumption and Expenditures Surveys (HCES) be used for nutritional assessment and planning? Food Nutr. Bull. 33:213. doi: 10.1177/15648265120333S213
Otinga, A. N., Pypers, P., Okalebo, J. R., Njoroge, R., Emong'ole, M., Six, L., et al. (2013). Partial substitution of phosphorus fertiliser by farmyard manure and its localised application increases agronomic efficiency and profitability of maize production. Field Crops Res. 140, 32–43. doi: 10.1016/j.fcr.2012.10.003
Quisumbing, A. R., and Maluccio, J. A. (1999). Intrahousehold Allocation and Gender Relations: New Empirical Evidence. Policy Research Report on Gender and Development Working Paper Series. World Bank Development Research Group/Poverty Reduction and Economic Management Network.
Ricciardi, V., Ramankutty, N., Mehrabi, Z., Jarvis, L., and Chookolingo, B. (2018a). How much of the world's food do smallholders produce? Global Food Security 17, 64–72. doi: 10.1016/j.gfs.2018.05.002
Ricciardi, V., Ramankutty, N., Mehrabi, Z., Jarvis, L., and Chookolingo, B. (2018b). An open-access dataset of crop production by farm size from agricultural censuses and surveys. Data Brief 19, 1970–1988. doi: 10.1016/j.dib.2018.06.057
Schuler, J., Voss, A. K., Ndah, H. T., Traore, K., and de Graaff, J. (2016). A socioeconomic analysis of the zaï farming practice in northern Burkina Faso. Agroecol. Sustain. Food Syst. 40, 988–1007. doi: 10.1080/21683565.2016.1221018
Stevenson, J., Vanlauwe, B., Macours, K., Johnson, N., Krishnan, L., Place, F., et al. (2019). Farmer adoption of plot- and farm-level natural resource management practices: Between rhetoric and reality. Global Food Security 20, 101–104. doi: 10.1016/j.gfs.2019.01.003
Theriault, V., Smale, M., and Haider, H. (2018). Economic incentives to use fertilizer on maize under differing agro-ecological conditions in Burkina Faso. Food Security 10, 1263–1277. doi: 10.1007/s12571-018-0842-z
Tittonell, P., and Giller, K. E. (2013). When yield gaps are poverty traps: The paradigm of ecological intensification in African smallholder agriculture. Field Crops Res. 143, 76–90. doi: 10.1016/j.fcr.2012.10.007
Van Ittersum, M. K., Cassman, K. G., Grassini, P., Wolf, J., Tittonell, P., and Hochman, Z. (2013). Yield gap analysis with local to global relevance-A review. Field Crops Res. 143, 4–17. doi: 10.1016/j.fcr.2012.09.009
Van Ittersum, M. K., van Bussel, L. G. J., Wolf, J., Grassini, P., van Wart, J., Guilpart, N., et al. (2016). Can sub-Saharan Africa feed itself? Proc. Natl. Acad. Sci. U.S.A. 113, 14964–14969. doi: 10.1073/pnas.1610359113
Wage Indicator Foundation (2021). Available online at: https://wageindicator.org/ (accessed October 2021).
Keywords: rural development, small farms, intensification benefit index, returns to land, productivity gaps, personal daily income
Citation: Harris D, Oduol J and Hughes K (2021) Poverty Alleviation Through Technology-Driven Increases in Crop Production by Smallholder Farmers in Dryland Areas of Sub-Saharan Africa: How Plausible Is This Theory of Change? Front. Sustain. Food Syst. 5:723301. doi: 10.3389/fsufs.2021.723301
Received: 10 June 2021; Accepted: 17 November 2021;
Published: 10 December 2021.
Edited by:
Mark Van Wijk, International Livestock Research Institute (ILRI), KenyaReviewed by:
Simon Fraval, Wageningen University and Research, NetherlandsAyala Wineman, Michigan State University, United States
Copyright © 2021 Harris, Oduol and Hughes. This is an open-access article distributed under the terms of the Creative Commons Attribution License (CC BY). The use, distribution or reproduction in other forums is permitted, provided the original author(s) and the copyright owner(s) are credited and that the original publication in this journal is cited, in accordance with accepted academic practice. No use, distribution or reproduction is permitted which does not comply with these terms.
*Correspondence: David Harris, daveh548@gmail.com