- 1Indian Council of Agricultural Research (ICAR)-Indian Agricultural Research Institute, New Delhi, India
- 2Global Wheat Program, International Maize and Wheat Improvement Center (CIMMYT), Texcoco, Mexico
Development of biofortified wheat lines has emerged as a sustainable solution to alleviate malnutrition. However, for these varieties to be successful, it is important that they meet the minimum quality criteria required to produce the local food products. In the present study, a set of 94 biofortified common wheat lines were analyzed for their grain micronutrients content (Fe and Zn) and for their processing quality and glutenin profile. Most of the analyzed lines exhibited a grain Zn concentration greater than the non-biofortified check varieties, of at least 3 ppm. The content of both Fe and Zn appeared to be significantly associated with grain protein content (r = 0.21–0.65; p < 0.01) but not with grain yield or other wheat quality traits. Wide allelic variation was observed at both the high-molecular-weight glutenin (HMW-GS) and the low-molecular-weight glutenin (LMW-GS) loci and alleles associated with greater dough strength were identified. Specifically, among the HMW-GS alleles, the Glu-B1i, Glu-B1al, and Glu-D1d alleles were associated with greater mixograph and alveograph values and greater loaf volume. Similarly, among the LMW-GS alleles, the Glu-A3b and Glu-B3b alleles were associated with stronger gluten and better bread-making quality. Overall, results of this study suggest that biofortification does not profoundly alter wheat end-use quality and that the effect of the different glutenin alleles is independent of the grain protein and micronutrient content.
Introduction
Wheat is one of the most important food crop in the world and it currently provides ≈20% of the daily dietary energy and protein (Shewry and Hey, 2015). Wheat also represents a good source of essential micronutrients such as iron (Fe) and zinc (Zn). However, deficiency of these micronutrients is unfortunately common, especially in developing countries where cereal-based foods represent the major daily caloric intake. This condition is mainly determined by the poor consumption of other micronutrient-rich food such as meat, fish, fruits and vegetables. For this reason, development of genetically biofortified wheat varieties with enhanced micronutrient concentrations, has emerged as a sustainable solution to alleviate malnutrition (Velu et al., 2012).
Currently the International Maize and Wheat Improvement Center (CIMMYT) supported by the HarvestPlus Program and the CGIAR Research Program on Agriculture for Nutrition and Health, is leading a global effort to develop and disseminate in developing countries, high-yielding biofortified wheat varieties with greater grain Zn concentration (Velu et al., 2019). However, in order for these varieties to be successful, it is paramount that they meet the minimum quality criteria required by the food industry, the local food manufacturers, and the consumers (Guzmán et al., 2014). In fact, compared to maize and rice, wheat is almost always milled into flour and processed into a wide range of products such as bread, cakes, cookies, crackers, pasta, and noodles (Shewry et al., 2003). However, each wheat-derived food product requires specific quality characteristics and therefore, understanding the different genetic and non-genetic factors affecting quality is very important in order to make selection for wheat quality more efficient.
The ability to process wheat into such a wide range of products is determined largely by gluten, a macropolymer constituted by a group of wheat grain proteins which confers the unique viscoelastic properties to wheat doughs (Shewry et al., 2003). Variation in the quantity and quality of the gluten-forming proteins has been shown to greatly affect wheat end-use quality. For this reason, the study and improvement of gluten quality has become one of the major breeding objectives in the past years (Liu et al., 2005). Gluten proteins constitute ≈80% of the total wheat grain proteins and are composed by roughly the same quantity of gliadins and glutenins. Gliadins constitute the monomeric part of gluten and have been found to be the major contributor to the viscosity of the gluten network. Glutenins are connected among each other through inter-molecular disulphide bonds, constituting the gluten polymeric fraction. Their variation has been associated with major differences in gluten strength and elasticity (Shewry et al., 2003). Depending on their molecular weight, glutenins have been further classified into high-molecular-weight glutenin subunits (HMW-GS) and low molecular weight glutenin subunits (LMW-GS). The HMW-GS are encoded by genes at the Glu-A1, Glu-B1, and Glu-D1 loci, on the long arm of the homoeologous group 1 chromosome. At each locus are located two genes, encoding for a x- and y-type HMW-GS (Shewry et al., 2003). Differently, the LMW-GS are encoded by multiple genes located at the Glu-A3, Glu-B3, and Glu-D3 loci, on the short arm of homoeologous group 1 chromosome. Depending on the locus and the variety, the number of LMW-GS genes could vary. However, in general, individual common wheat varieties contain more than 15 LMW-GS genes (Ibba et al., 2017). Because of the central role that the glutenins play in the wheat processing and end-use quality, several studies have been reported on the association between different HMW- and LMW-GS alleles and wheat quality, and alleles associated with stronger or weaker gluten have been identified (Branlard et al., 2001; He et al., 2005; Liu et al., 2005; Ito et al., 2011).
Breeding for an increased content of Fe and Zn did not appear to be detrimental for quality. On the contrary, several studies found that typically, increased micronutrient content is associated with greater protein content (Feil and Fossati, 1995; Morgonuov et al., 2007; Guzmán et al., 2014), suggesting that genetically biofortified varieties could have an even better quality profile compared to non-biofortified wheat lines. However, more studies are needed in order to better understand the relationship (if any) between wheat quality and micronutrient accumulation. Also, to the best of our knowledge, no studies have been reported on the role of different HMW- and LMW-GS alleles on biofortified wheat lines. Given the change in the protein content and, according to Morgonuov et al. (2007) also of the gluten protein fractions ratio, it could be possible that the effect that some glutenin alleles have on wheat quality is different in biofortified lines compared to the effect they have in non-biofortified lines.
For these reasons, the objectives of the present study are to (1) understand the association among Fe, Zn, wheat quality parameters and to (2) determine the effect of the variation in the HMW- and LMW-GS alleles on different end-use determining parameters in a set of 94 advanced CIMMYT biofortified wheat lines.
Materials and Methods
Plant Material
A field trial consisting of 40 and 54 bread wheat cultivars were grown, respectively, in the 2017–2018 and 2018–2019 crop seasons in the Campo Experimental Norman E. Borlaug (CENEB) located in Ciudad Obregon, Mexico. The analyzed cultivars were grown under full irrigation, following standard control procedures for weed, diseases and insects. After harvesting, yield was recorded.
Quality Traits
All quality analyses were performed according to the AACC International approved methods or other modified methods described in Battenfield et al. (2016).
Specifically, 1,000-kernel weight (TKW [g]) was calculated using the Single-Kernel Characterization System (SKCS, Perten Instruments, Sweden). Test weight (TESTWT, kg hL−1) was measured using a 37.81-mL sample. Grain protein (GRNPRO) and flour protein (FLRPRO) content were determined using near-infrared spectroscopy (DA 7200 NIR, Perten Instruments, Sweden), with a calibration validated using Leco®/Dumas method (Equipment FP828 Leco Instruments, St Joseph, Michigan, USA), as reported in the official methods AACC 39-10 and AACC 46-11A, respectively. The GRNPRO was reported at 12.5% moisture whereas the FLRPRO was reported at 14% moisture. Grain hardness (GRNHRD) was analyzed using the SKCS following the AACC method 55-31 (American Association of Cereal Chemists, 2010). Depending on grain hardness and moisture content, grain samples were optimally tempered, and milled using a Brabender Quadrumat Senior mill (C. W. Brabender OHG). Experimental flour yield (FLRYLD) intended as the % of flour obtained from the initial grain sample, was recorded. Sodium dodecyl sulfate (SDS) sedimentation (FLRSDS) was conducted as in Peña et al. (1990). A 35 g mixograph was used to estimate the dough mixing and rheological properties, following the AACC method 54-40A (American Association of Cereal Chemists, 2010). The following parameters were recorded: time to peak mixing strength (MIXTIM) and midline peak integral (MPI). Dough rheological characteristics were also assessed using the Chopin Alveograph (Tripette & Renaud) with a 60 g flour sample and according to the AACC method 54-30A (American Association of Cereal Chemists, 2010). For this analysis, the following parameters were recorded: dough deformation energy, indicative of the overall gluten strength (ALVW) and curve configuration ratio, indicative of the ratio between dough tenacity and extensibility (ALVPL). Both the mixograph and alveograph methods were adjusted for unified optimum water absorption based on solvent retention capacity, as reported by Guzmán et al. (2015). The lines were also assessed for yeast-leavened bread quality following the AACC method 10-09 (American Association of Cereal Chemists, 2010) and using the Guzmán et al. (2015) adjustment for optimal water absorption. Bread loaf volume (LOFVOL) was measured by rapeseed displacement in accordance with AACC method 10-05.01 (American Association of Cereal Chemists, 2010). Grain Zn and Fe concentrations (unit: ppm) were determined by using a “bench-top,” non-destructive, energy-dispersive X-ray fluorescence spectrometry (EDXRF) instrument (model X-Supreme 8000, Oxford Instruments plc, Abingdon, UK), which has been standardized for high throughput screening of Zn and Fe in whole grain wheat (Paltridge et al., 2012). The advantage of the Zn concentration among the analyzed biofortified samples was measured against the average Zn grain content of two field checks.
Protein Extraction and Separation
Glutenin fraction was obtained according to Singh et al. (1991) with some modifications. Specifically, 20 mg of refined flour were mixed at 1,400 rpm with 0.75 ml of 50% propanol (v/v) for 30 min at 65°C in a Thermomixer Comfort (Eppendorf). The tubes were then centrifuged for 2 min at 10,000 rpm, and the supernatant containing the gliadins was discarded. The pellet was then mixed with 0.1 ml of a 1.5% (w/v) DTT solution in a Thermomixer for 30 min at 65°C, 1,400 rpm, and centrifuged for 2 min at 10,000 rpm. A 0.1 ml volume of a 1.4% (v/v) vinylpyridine solution was then added to the tube with was subsequently placed again in a Thermomixer for 15 min at 65°C, 1,400 rpm, and centrifuged for 5 min at 13,000 rpm. The supernatant was mixed with the same volume of sample buffer [2% SDS (w/v), 40% glycerol (w/v), and 0.02% (w/v) bromophenol blue, pH 6.8] and incubated in the Thermomixer for 5 min at 90°C and 1,400 rpm. Tubes were centrifuged for 5 min at 10,000 rpm, and 8 ml of the supernatant were used for the glutenins gel. Glutenins were separated in polyacrylamide gels (15% T) prepared using 1 M Tris buffer, pH of 8.5. Gels were run at 12.5 mA per gel for about 19 h. Glu-1 and Glu-3 alleles were classified using the systems developed by Jackson et al. (1996) and Branlard et al. (2003).
Statistical Analysis
Mean, standard deviation (SD), minimum and maximum values and correlation among quality traits were computed for all genotypes using SAS University Edition (SAS/STAT®, SAS Institute Inc., NC, USA). All further analysis was done with R studio v3.6.2. Specifically, a two-way analysis of variance (ANOVA) was performed on each quality trait using the function “aov” and treating each Glu locus, the year and the interaction between the Glu locus and the year as fixed effects. Comparison of the least square means for the allelic variants at each Glu locus, was performed using Fisher's protected least significant differences (LSD) test using the “lsd” function in the package R package “Agricolae.”
Results
Quality Trait Variation and Fe and Zn Concentration
The lines selected for this study, were analyzed for different grain, rheological, and end-use quality parameters (Supplementary Table 1) and the obtained data were used to estimate mean, standard deviation, minimum and maximum values of each trait (Table 1). The analysis showed the presence of significant variation among the lines within each set. However, even if significant differences could be observed for the different traits across the years, overall, the two sets of lines analyzed during the 2017–2018 and 2018–2019 cycles showed comparable average values for the parameters studied. Specifically, when looking at the Fe and Zn concentration, the lines analyzed in the first set exhibited greater Fe and Zn average content compared to the lines from the second set. This trend could be observed also when analyzing the Zn values of the different breeding lines against the field checks, suggesting that the observed differences across the years are more associated with genotypic effects rather than environmental effects (Figure 1). Specifically, lines from the first set showed an average increment in Zn of 26% (60.5 mg/kg) compared to the control (48 mg/kg) whereas lines from the second set showed an average increment in Zn content of 10% (52 mg/kg).
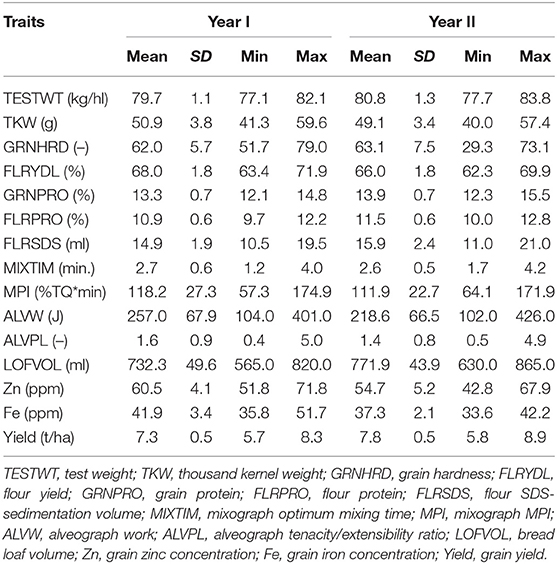
Table 1. Mean, standard deviation (SD), and range of yield and quality parameters among the biofortified wheat lines from Year I and II.
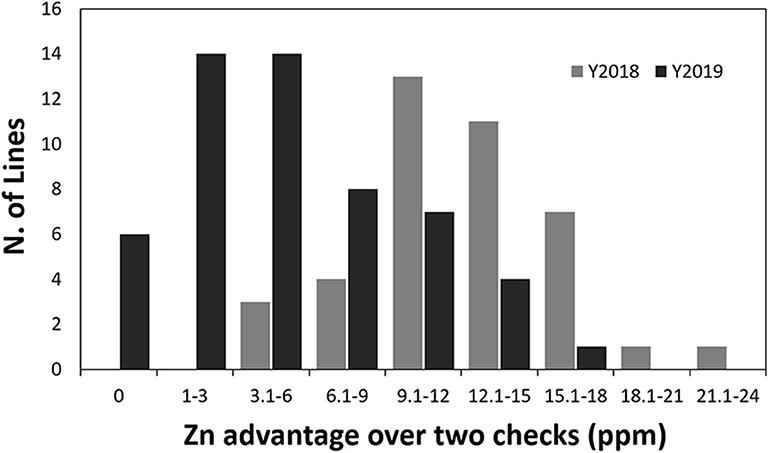
Figure 1. Variation in grain Zn concentration among the biofortified analyzed lines, in relationship with the average grain Zn content from two non-biofortified field checks. Both the results from the 2018 and 2019 crop cycle are reported.
Correlation Between Quality Traits, Fe and Zn Content and Grain Yield
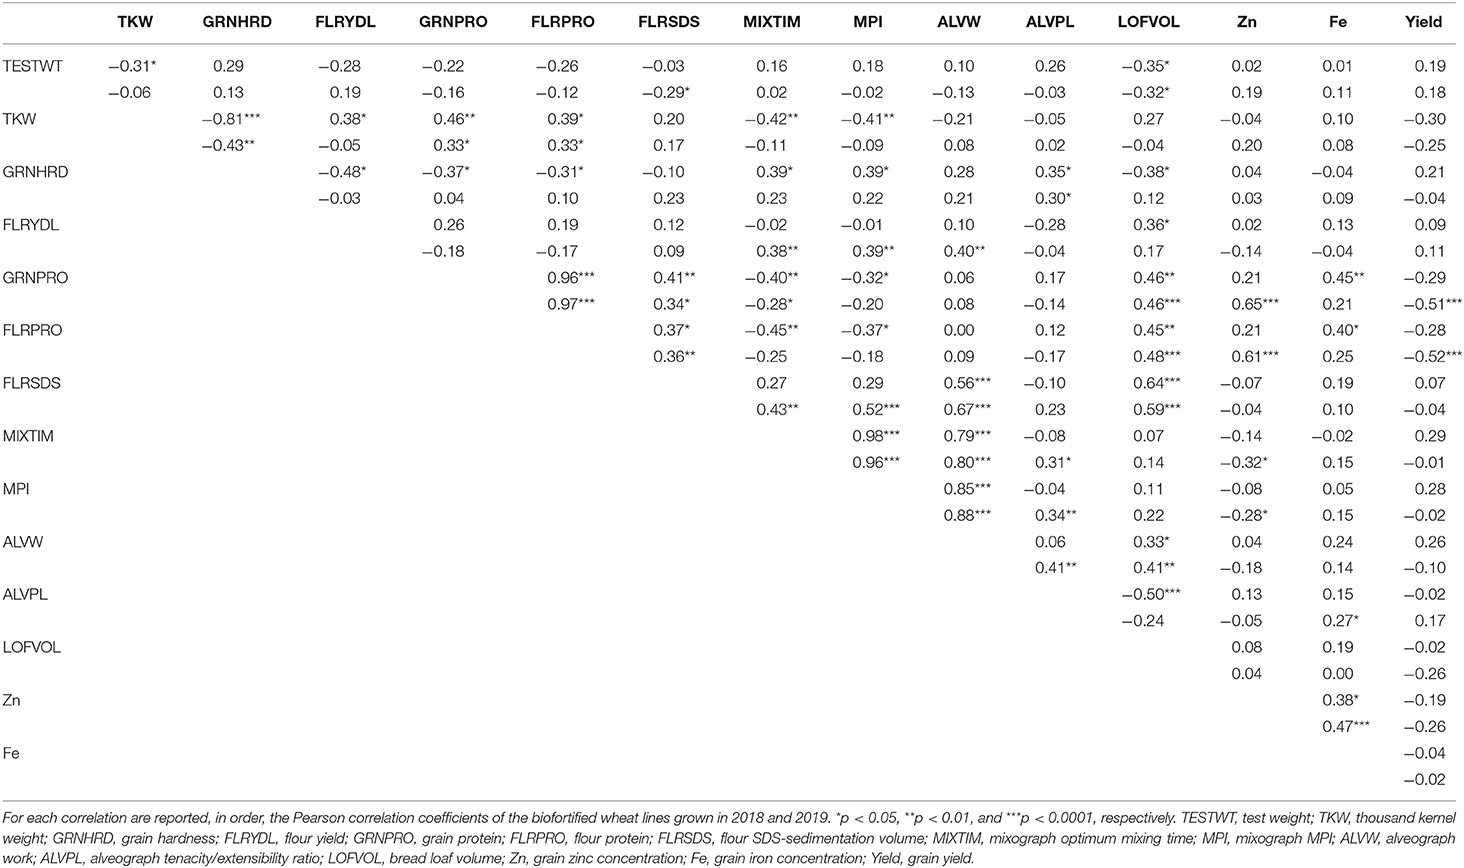
In order to identify the association among the different quality traits, the Pearson correlation coefficients were calculated for all the traits for the two years (Table 2).
Among the grain physical properties, test weight appeared to be significantly and negatively correlated in both years only with bread loaf volume (r ~ −0.30) whereas it was significantly negatively correlated with TKW and flour SDS-sedimentation volume only in the first and second year, respectively. On the contrary, variation in TKW appeared to be more significantly associated with changes in other grain and flour properties such as grain hardness, protein content and the mixograph parameters. For instance, TW or TKW, and kernel hardness exhibited a significant effect on several grain and flour properties and appeared to be negatively associated with flour yield (r = −0.48), protein content (r = −0.31 to −0.37), and bread loaf volume (r = −0.38), and positively associated with both the mixograph and alveograph parameters (r = 0.28–0.39). Contrasting values were obtained for flour yield, which appeared to be significantly and negatively associated with gluten strength, as indicated by the mixograph and alveograph parameters, but only among the lines analyzed in the second year (r = 0.38–0.40). Positive association between FLRYLD and bread loaf volume was however detected in both years at a different degree of association (r = 0.17–0.36).
As expected, both grain and flour protein content appeared to profoundly influence several quality traits. In general, consistent correlation values were detected across the years and protein content was significantly and positively associated with flour SDS-sedimentation volume and bread loaf volume (r = 0.34–0.48). Contrarily, negative correlations were identified between either grain or protein content and mixograph parameters (r = −0.18 to −0.45). Positive and in general highly significant association were typically identified among the traits indicative of gluten strength, such as SDS-sedimentation volume, mixograph mixing time and MPI, alveograph W value, and bread loaf volume. The only difference was the ALVPL value which appeared to be slightly positively associated with gluten strength and significantly and negatively correlated with bread loaf volume. The ALVPL value in fact, is indicative of the balance between gluten strength and extensibility and the present results would suggest that an appropriate balance of these two factors are necessary to ensure an optimum bread loaf volume.
Regarding the Fe and Zn content, significant positive associations were detected between the content of these two micronutrients in the grain (r = 0.38 and 0.47) and, interestingly, positive and generally significant associations were also identified between either Fe or Zn content and grain or flour protein content (r = 0.21–0.65; Figure 2A). No significant correlations could be identified between the grain micronutrient content and grain yield (Figure 2B).
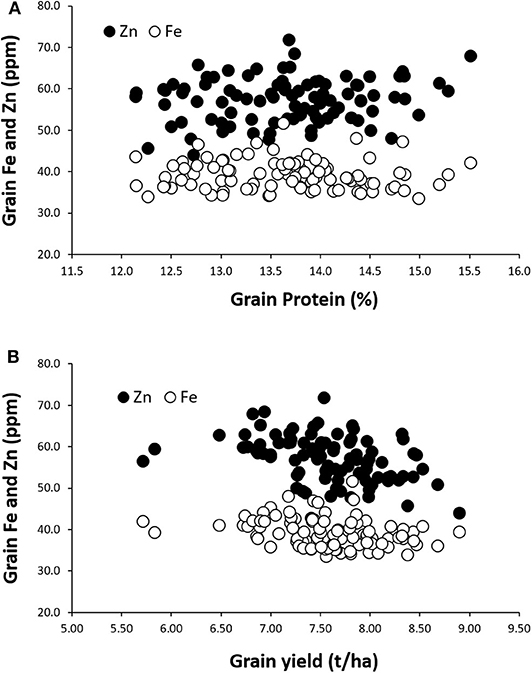
Figure 2. Relationships between grain Zn and Fe concentrations and grain protein content (A) and grain yield (B) among the 94 lines grown either during the 2018 or 2019 crop cycle.
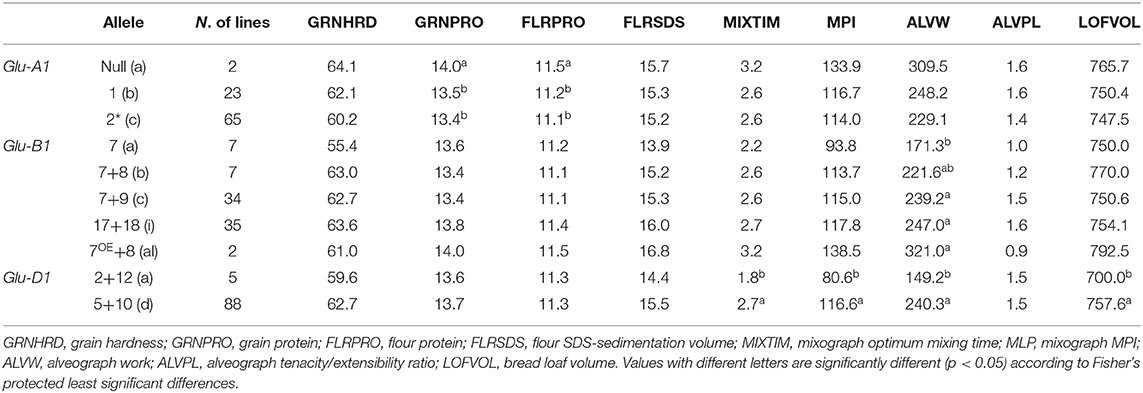
Effect of the HMW-GS Alleles on Quality Traits
Wide allelic variation was identified at the glutenin Glu-1 loci in both sets of varieties with 3, 5 and 2 different allelic variants identified at the Glu-A1, Glu-B1, and Glu-D1 loci, respectively (Supplementary Figure 1).
According to the results obtained from the ANOVA, all the Glu-1 loci appeared to be significantly associated with different wheat quality parameters, at different degrees (Supplementary Table 2). The Glu-D1 locus was found to have higher importance among the HMW-GS loci in defining traits like mixing time (p < 0.001) and mixograph MPI, alveograph W value and bread loaf volume (p < 0.01). In particular, the allele Glu-D1d (subunit Dx5+Dy10) was found to be consistently associated with greater gluten strength compared to the allele Glu-D1a (subunit Dx2+Dy12). The second most significant Glu-1 locus was Glu-A1 which was found to significantly affect both grain and flour protein content (p < 0.05). In this case, the Glu-A1c allele was associated with slightly higher grain and flour protein content values compared to the Glu-A1a (subunit 2*) and Glu-A1b (subunit 1) alleles. Finally, variation in the Glu-B1 locus was significantly associated only with variation in the alveograph W value (p < 0.05). In this case, the alleles Glu-B1al (subunit Bx7OE+By8), Glu-B1i (Bx17+By18), and Glu-B1c (Bx7+By9) had comparable and greater effects than allele Glu-B1b (Bx7+By8) and Glu-B1a (Subunit Bx7). Also, in general, alleles Glu-B1al and Glu-B1a were associated with stronger and weaker gluten, respectively, as indicated by the different analysis performed (Table 3).
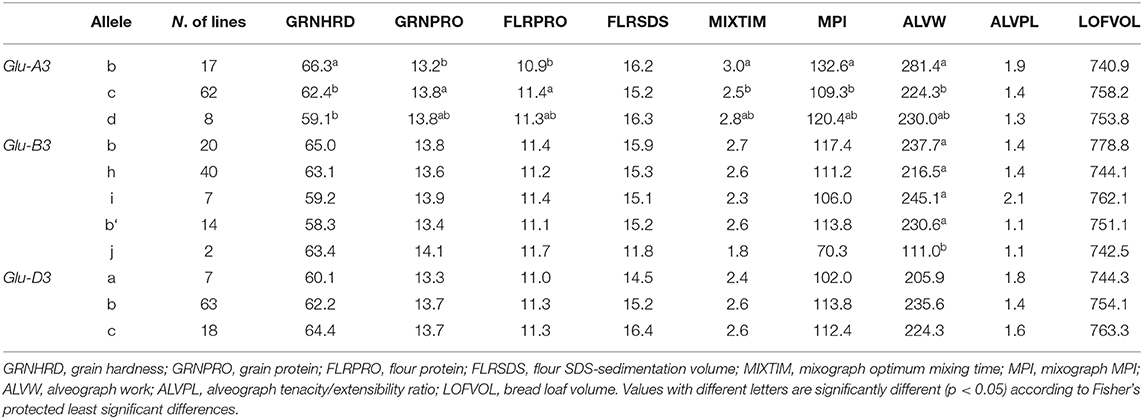
Effect of the LMW-GS Alleles on Quality Traits
Among the Glu-3 loci, 3, 5 and 3 alleles were identified, respectively, at the Glu-A3, Glu-B3, and Glu-D3 loci (Supplementary Figure 1).
Among the LMW loci, only the Glu-A3 locus was significantly associated with variation in some of the analyzed quality traits (Supplementary Table 2) with the allele Glu-A3b being associated with greater GRNHRD, MIXTIM, MPI, and ALVW values in comparison to both alleles Glu-A3c and Glu-A3d. Variation at the Glu-B3 locus was not found to be significantly associated with any of the quality traits studied. However, when looking more in details the average trait values associated with each Glu-B3 allele, the allele Glu-B3b was associated with greater mean values for bread loaf volume, flour SDS sedimentation, mixograph mixing time and MPI and alveograph W value, as well as higher grain hardness. The genotypes with allele Glu-B3i were associated with greater alveograph P/L value. In contrast, the lines with allele Glu-B3j were associated with drastically weaker gluten compared to the other Glu-B3 alleles, as indicated by the FLRSDS, mixograph, and alveograph parameters. Similarly, also variation at the Glu-D3 locus did not appear to be significantly associated with any of the quality parameters studied here. However, even if not significantly, alleles Glu-D3b and Glu-D3c appeared to be consistently associated with greater kernel hardness, protein content and gluten strength, compared to allele Glu-D3a (Table 4).
Discussion
Numerous studies have been done in the past to understand the effect of various glutenin alleles on wheat quality. However, similar studies are lacking to explain the behavior of these traits and the effect of glutenin subunits among biofortified wheat lines. The growth of genetically biofortified wheat is likely to increase in the future, especially in developing countries. For this reason, it is of paramount importance to understand if any of the quality parameters is affected by the higher grain micronutrient content and if the different glutenin alleles exert the same effect on wheat quality as in non-biofortified wheat.
In the present study, 94 common wheat lines derived from the CIMMYT HarvestPlus program were analyzed for their micronutrient content (Fe and Zn) and for their end-use quality and glutenin profile. Most of the lines exhibited a micronutrient content greater than the one recorded in the two non-biofortified checks. Also, the Fe and Zn levels did not appear in any case to be significantly associated with either grain quality (TESTWT and TKW) or grain yield, suggesting that the increased levels of these minerals are associated with genetic improvement rather than with the reduced grain weight or size (Gomez-Becerra et al., 2010; Velu et al., 2019). However, it has to be noted that the micronutrient concentration was measured from whole grain and not from the resulting refined flour. Also, flour ash content, a measurement indicative of the flour total mineral content which is associated with flour bran contamination and with milling extraction efficiency, was not analyzed. More detailed analysis will be done in future on biofortified wheat samples in order to better understand the association between milling quality and flour micronutrient content but also to better understand in which part of the grain the additional micronutrients are accumulated. Differently from grain quality and yield, a significant and positive correlation between the micronutrient and protein content, was found in both the sets of lines grown in the two cropping cycles. This finding is in accordance with the reports from Morgonuov et al. (2007), Zhao et al. (2009), and Gomez-Becerra et al. (2010) and suggests not only that the mechanism at the basis of protein and mineral remobilization are partially common but also that, possibly, genetically biofortified wheat lines are associated with improved wheat quality. As reported in previous studies in fact (Uauy et al., 2006; Alhabbar et al., 2018a,b) wheat lines with an improved nitrogen remobilization capacity determined by the allelic composition of the NAM genes are also associated with a greater Fe and Zn grain content.
However, wheat end-use quality is determined not only by flour protein content but also by its protein composition. As reported by Laidig et al. (2017) in fact, even if over the years there has been a decline in the grain protein content due to the selection of high-yielding varieties, there has also been a steady improvement in bread-baking quality mainly due to the selection of specific HMW and LMW-GS alleles associated with the desired end-use quality (Guzmán et al., 2019). For this reason, understanding the allelic composition of both the HMW-GS and LMW-GS is of paramount importance to better interpret the observed variation in wheat quality.
Overall, wide variation in both the HMW and LMW-GS was identified among the analyzed biofortified lines. As widely reported in the literature (Branlard et al., 2001; Liu et al., 2005; Ito et al., 2011), variation in the glutenin subunit composition is in fact associated with different wheat end-uses thus suggesting that the present biofortified wheat lines could potentially be used for a variety of applications. Regarding the specific effect of the different glutenin loci, as reported in previous studies (Liu et al., 2005) variation at the Glu-D1 locus had the greatest impact among the Glu-1 loci on both the rheological and end-use quality results, followed by the Glu-B1 and the Glu-A1 loci, respectively. When looking in detail at the different Glu-1 allelic variants among the studied lines, overall it could be observed that the most frequent alleles at the three Glu-1 loci were also the ones that, according to the literature, are associated with medium-strong to strong gluten (Glu-A1b, Glu-A1c, Glu-B1c, Glu-B1i, and Glu-D1d) (Branlard et al., 2001; Liu et al., 2005; Ito et al., 2011; Park et al., 2011). This apparently unbalanced allelic frequency is likely due to the selection pressure applied in the breeding program toward wheat lines with improved gluten strength. Also, the effect on wheat quality of these “superior” alleles, was confirmed in the present study suggesting that, independently of the grain protein and micronutrient content, the effect of the different Glu-1 alleles on wheat mixing, rheological, and end-use quality, is consistent. The only exception was observed for Glu-A1a (null allele) which is typically associated with weaker gluten (Branlard et al., 2001) and that in the present study was associated with higher protein content and greater gluten strength. However, in this case, the apparent discrepancy between the results obtained and those previously reported, is probably determined by the low representation of the Glu-A1a allele (only two lines) and/or by the effect of the other glutenin alleles.
Similarly to the Glu-1 loci, also the effect of the different Glu-3 loci appeared to be consistent with previous studies and confirmed the greater effect of the Glu-A3 and Glu-B3 loci on wheat quality compared to the Glu-D3 locus (Branlard et al., 2001; He et al., 2005; Ibba et al., 2017). However, this was different from the HMW-GS, in that it could not be observed a prevalence among the analyzed lines of the Glu-3 alleles known to be associated with greater gluten strength. This observation would suggest that no deliberate selection has been done for specific LMW-GS alleles. Indeed, among the Glu-A3 alleles, the most common allele was Glu-A3c which was associated in this study and in previous studies with medium to low gluten strength. The allele Glu-A3b instead, which has been shown to have a positive effect on the overall mixing and end-use quality (He et al., 2005; Liu et al., 2005), was only present in 17 lines. A similar situation could be observed at the Glu-B3 locus where the allele Glu-B3b, associated with good bread-making quality, did not appear to be prevalent among the lines analyzed. Furthermore, two of the 94 advanced lines even exhibited the Glu-B3j allele, indicative of the 1B/1R translocation and associated with a drastic reduction in gluten strength (Branlard et al., 2001; He et al., 2005; Liu et al., 2005; Park et al., 2011).
Conclusions
Results of this study confirm that grain Fe and Zn concentration is associated with grain protein content but not with variation in other wheat quality traits. Also, the effect of the different HMW-GS and LMW-GS alleles appeared to be in general consistent between biofortified and non-biofortified lines suggesting that the alleles already known to be associated with specific end-use quality characteristics could be selected also when working with genetically biofortified wheat lines. This may be due to the fact that high Fe and Zn alleles from diverse progenitors were introgressed into high yielding elite wheat lines with better quality parameters. However, given the limited number of samples analyzed in the present study, more studies will be needed to confirm these results.
Data Availability Statement
All datasets presented in this study are included in the article/Supplementary Material.
Author Contributions
NDR: formal analysis and writing-original draft preparation. AM-S: supervision and writing—review and editing. VG: resources, conceptualization, and writing-review and editing. MI: conceptualization, project administration, and writing-review and editing. All authors contributed to the article and approved the submitted version.
Funding
This research was supported by the CRP-Wheat program of CGIAR consortium, the HarvestPlus challenge program (partly funded by Bill and Melinda Gates Foundation [OPP1019962]) and the World Bank-funded NAHEP-CAAST Fellowship Program.
Conflict of Interest
The authors declare that the research was conducted in the absence of any commercial or financial relationships that could be construed as a potential conflict of interest.
Acknowledgments
We would like to acknowledge all CIMMYT scientists, field workers, and lab assistants who helped in the collection of the data used in this study. Special thanks goes to all the members of the CIMMYT Wheat Chemistry and Quality Laboratory.
Supplementary Material
The Supplementary Material for this article can be found online at: https://www.frontiersin.org/articles/10.3389/fsufs.2020.583367/full#supplementary-material
Supplementary Figure 1. Example of an SDS-PAGE used for the determination of the high- and low-molecular-weight glutenin subunits (HMW-GS and LMW-GS) alleles.
Supplementary Table 1. End-use quality, grain Fe and Zn content and yield data.
Supplementary Table 2. ANOVA of Glu-1 and Glu-3 alleles on end use quality traits in biofortified wheat lines based on the combined data from 2 years.
References
Alhabbar, Z., Islam, S., Yang, R., Diepeveen, D., Anwar, M., Balotf, S., et al. (2018b). Associations of NAM-A1 alleles with the onset of senescence and nitrogen use efficiency under Western Australian conditions. Euphytica 214:180. doi: 10.1007/s10681-018-2266-4
Alhabbar, Z., Yang, R., Juhasz, A., Xin, H., She, M., Anwar, M., et al. (2018a). NAM gene allelic composition and its relation to grain-filling duration and nitrogen utilisation efficiency of Australian wheat. PLoS ONE 13:e0205448. doi: 10.1371/journal.pone.0205448
American Association of Cereal Chemists (2010). Approved Methods of Analysis. 11th Edn. St. Paul, MN: AACC International.
Battenfield, S. D., Guzmán, C., Gaynor, R. C., Singh, R. P., Peña, R. J., Dreisigacker, S., et al. (2016). Genomic selection for processing and end-use quality traits in the CIMMYT spring bread wheat breeding program. Plant Genome 9, 1–2. doi: 10.3835/plantgenome2016.01.0005
Branlard, G., Dardevet, M., Amiour, N., and Igrejas, G. (2003). Allelic diversity of HMW and LMW glutenin subunits and omega-gliadins in French bread wheat (Triticum aestivum L.). Genet. Resour. Crop Evol. 50, 669–679. doi: 10.1023/A1025077005401
Branlard, G., Dardevet, M., Saccomano, R., Lagoutte, F., and Gourdon, J. (2001). Genetic diversity of wheat storage proteins and bread wheat quality. Euphytica 119, 59–67. doi: 10.1023/A1017586220359
Feil, B., and Fossati, D. (1995). Mineral composition of triticale grains as related to grain yield and grain protein. Crop Sci. 35, 1426–1431. doi: 10.2135/cropsci1995.0011183X003500050028x
Gomez-Becerra, H. F., Yazici, A., Azturk, L., Budak, H., Peleg, Z., Morgunov, A. I., et al. (2010). Genetic variation and environmental stability of grain mineral nutrient concentrations in Triticum dicoccoides under five environments. Euphytica 171, 39–52. doi: 10.1007/s10681-009-9987-3
Guzmán, C., Ammar, K., Velu, G., and Singh, R. P. (2019). Genetic improvement of wheat grain quality at CIMMYT. Front. Agr. Sci. Eng. 6:260. doi: 10.15302/J-FASE-2019260
Guzmán, C., Medina-Larque, A. S., Velu, G., Gonzalez-Santoyo, H., Singh, R. P., Huerta-Espino, J., et al. (2014). Use of wheat genetic resources to develop biofortified wheat with enhanced grain zinc and iron concentrations and desirable processing quality. J. Cereal Sci. 60, 617–622. doi: 10.1016/j.jcs.2014.07.006
Guzmán, C., Posadas-Romano, G., Hernandez-Espinosa, N., Morales-Dorantes, A., and Peña, R. J. (2015). A new standard water absorption criteria based on solvent retention capacity (SRC). to determine dough mixing properties, viscoelasticity, and bread-making quality. J. Cereal Sci. 66, 59–65. doi: 10.1016/j.jcs.2015.10.009
He, Z. H., Liu, L., Xia, X. C., Liu, J. J., and Peña, R. J. (2005). Composition of HMW and LMW glutenin subunits and their effects on dough properties, pan bread, and noodle quality of chinese bread wheats. Cereal Chem. 82, 345–350. doi: 10.1094/CC-82-0345
Ibba, M. I., Kiszonas, A. M., and Morris, C. F. (2017). Influence of low-molecular-weight glutenin subunit haplotypes on dough rheology in elite common wheat varieties. Cereal Chem. 94, 1016–1027. doi: 10.1094/CCHEM-07-17-0137-R
Ito, M., Fushie, S., Maruyama-Funatsuki, W., Ikeda, T. M., Nishio, Z., Nagasawa, K., et al. (2011). Effect of allelic variation in three glutenin loci on dough properties and breadmaking qualities of winter wheat. Breed. Sci. 61, 281–287. doi: 10.1270/jsbbs.61.281
Jackson, E. A., Morel, M. H., Sontag-Strohm, T., Branlard, G., Metakovsky, E. V., and Redaelli, R. (1996). Proposal for combining the classification systems of alleles of Gli-1 and Glu-3 loci in bread wheat (Triticum aestivum L.). J. Genet. Breed. 50, 321–336.
Laidig, F., Piepho, H. P., Rentel, D., Drobek, T., Meyer, U., and Huesken, A. (2017). Breeding progress, environmental variation and correlation of winter wheat yield and quality traits in German official variety trials and on-farm during 1983–2014. Theor. Appl. Genet. 130, 223–245. doi: 10.1007/s00122-016-2810-3
Liu, L., He, Z., Yan, J., Zhang, Y., Xia, X., and Peña, R. J. (2005). Allelic variation at the Glu-1 and Glu-3 loci, presence of the 1B.1R translocation, and their effects on mixographic properties in Chinese bread wheats. Euphytica 142, 197–204. doi: 10.1007/s10681-005-1682-4
Morgonuov, A., Gomez-Becerra, H. F., Abugalieva, A., Dzhunusova, M., Yessimbekova, M., Muminjanov, H., et al. (2007). Iron and zinc grain density in common wheat grown in Central Asia. Euphytica 155, 193–203. doi: 10.1007/s10681-006-9321-2
Paltridge, N. G., Milham, P. J., Ortiz-Monasterio, J. I., Velu, G., Yasmin, Z., Palmer, L. J., et al. (2012). Energy-dispersive X-ray fluorescence spectrometry as a tool for zinc, iron and selenium analysis in whole grain wheat. Plant Soil 361, 251–260. doi: 10.1007/s11104-012-1423-0
Park, C. S., Kang, C. S., Jeung, J. U., and Woo, S. H. (2011). Influence of allelic variations in glutenin on the quality of pan bread and white salted noodles made from Korean wheat cultivars. Euphytica 180, 235–250. doi: 10.1007/s10681-011-0385-2
Peña, R. J., Amaya, A., Rajaram, S., and Mujeeb-Kazi, A. (1990). Variation in quality characteristics associated with some spring 1B/1R translocation wheats. J. Cereal Sci. 12, 105–112.
Shewry, P. R., Halford, N. G., and Lafiandra, D. (2003). Genetics of wheat gluten proteins. Adv. Genet. 49, 111–184. doi: 10.1016/S0065-2660(03)01003-4
Shewry, P. R., and Hey, S. J. (2015). The contribution of wheat to human diet and health. Food Energy Secur. 4, 178–202. doi: 10.1002/fes3.64
Singh, N. K., Shepherd, K. W., and Cornish, G. B. (1991). A simplified SDS-PAGE procedure for separating LMW subunits of glutenins. J. Cereal Sci. 14, 203–208. doi: 10.1016/S0733-5210(09)80039-8
Uauy, C., Distelfeld, A., Fahima, T., Blechl, A., and Dubcovsky, J. (2006). A NAC gene regulating senescence improves grain protein, zinc, and iron content in wheat. Science 314, 1298–1301. doi: 10.1126/science.1133649
Velu, G., Crespo-Herrera, L., Guzmán, C., Huerta, J., Payne, T., and Singh, R. P. (2019). Assessing genetic diversity to breed competitive biofortified wheat with enhanced grain Zn and Fe concentrations. Front. Plant Sci. 9:1971. doi: 10.3389/fpls.2018.01971
Velu, G., Singh, R. P., Huerta-Espino, J., Peña, R. J., Arun, B., Mahendru-Singh, A., et al. (2012). Performance of biofortified spring wheat genotypes in target environments for grain zinc and iron concentrations. Field Crops Res. 137, 261–267. doi: 10.1016/j.fcr.2012.07.018
Keywords: wheat quality, biofortification, grain Zn and Fe, glutenins composition, Triticum aestivum (bread wheat)
Citation: Rathan ND, Mahendru-Singh A, Govindan V and Ibba MI (2020) Impact of High and Low-Molecular-Weight Glutenins on the Processing Quality of a Set of Biofortified Common Wheat (Triticum aestivum L.) Lines. Front. Sustain. Food Syst. 4:583367. doi: 10.3389/fsufs.2020.583367
Received: 14 July 2020; Accepted: 31 August 2020;
Published: 06 October 2020.
Edited by:
Maryke T. Labuschagne, University of the Free State, South AfricaReviewed by:
Wujun Ma, Murdoch University, AustraliaMichael Tilley, Center for Grain and Animal Health, Agricultural Research Service (USDA), United States
Copyright © 2020 Rathan, Mahendru-Singh, Govindan and Ibba. This is an open-access article distributed under the terms of the Creative Commons Attribution License (CC BY). The use, distribution or reproduction in other forums is permitted, provided the original author(s) and the copyright owner(s) are credited and that the original publication in this journal is cited, in accordance with accepted academic practice. No use, distribution or reproduction is permitted which does not comply with these terms.
*Correspondence: Maria Itria Ibba, bS5pYmJhQGNnaWFyLm9yZw==
 Nagenahalli Dharmegowda Rathan
 Anju Mahendru-Singh
 Velu Govindan
 Maria Itria Ibba