 Vera Sokolov1,2*
 Andrew VanderZaag2Jemaneh Habtewold2
 Kari Dunfield3
 James T. Tambong2
 Claudia Wagner-Riddle3Jason J. Venkiteswaran1Robert Gordon4
- 1Department of Geography and Environmental Studies, Wilfrid Laurier University, Waterloo, ON, Canada
- 2Agriculture and Agri-Food Canada, Ottawa, ON, Canada
- 3School of Environmental Science, University of Guelph, Guelph, ON, Canada
- 4School of the Environment, University of Windsor, Windsor, ON, Canada
Liquid manure storages are an important source of greenhouse gases (GHG) on dairy farms. Methane (CH4) and nitrous oxide (N2O) are the predominant GHGs, while ammonia (NH3) is an indirect source of N2O. Addition of acid to manure has shown promising emission reductions, however, cost of acidification may be unfeasible for farmers. Fully cleaning storages has also shown to reduce CH4, due to removal of inoculating effects of residual manure (“inoculum”) on fresh manure (FM). However, complete removal of inoculum is practically impossible on large farms, thus acidifying only the inoculum may reduce GHGs without requiring acidification of all FM. This study aimed to quantify the effect of acidified inoculum on CH4, N2O, and NH3 emissions from stored manure and quantify the changes in methanogen abundance and activity. Emissions were measured from six 10.6 m3 storages filled with 20% inoculum (1-year-old manure) and 80% FM. Inoculum was treated in three ways: untreated (control); previously acidified (1-year prior); and newly acidified with 70% H2SO4 (1.1 L m−3 manure). The CH4 and N2O emissions were continuously measured from June—November using tunable diode trace gas analyzers coupled with venturi air flow systems. The NH3 emissions were measured at 24-h intervals 3 × weekly using acid traps. The activity and abundance of methanogens were quantified by targeting the Methyl Coenzyme M Reductase A (mcrA) gene and transcript which encodes a subunit of the key enzyme that catalyzes the final step of methanogenesis. Bacterial abundance was quantified by targeting the bacterial 16S rRNA gene. Quantifications were performed using quantitative real-time PCR. CH4 emissions were reduced by 77% using newly acidified inoculum and 38% using previously acidified inoculum, compared to the control with untreated inoculum (36.1 g CH4 m−2). Significant treatment reductions in mcrA gene and transcript abundance suggest that CH4 reductions were caused by disruption of methanogen activity. NH3 and N2O emissions were reduced by 33 and 73% using acidified inoculum and 23 and 50% using previously acidified inoculum, respectively, compared to the control. Results suggest that lower acid rates and acidifying less frequently may still have good treatment effects while minimizing cost.
Introduction
Liquid dairy manure is a substantial source of methane (CH4) and moderate source of nitrous oxide (N2O), and ammonia (Le Riche et al., 2016; Sokolov et al., 2019). Both CH4 and N2O are greenhouse gases (GHG) contributing to global warming and climate change, while ammonia (NH3) is an indirect source of N2O and is a toxic gas hazardous to human health (Jayasundara et al., 2016; Sokolov et al., 2019). Liquid manure is often stored on farms for >100 days prior to spreading onto fields. During this storage period considerable amounts of GHGs and NH3 are emitted to the atmosphere (Jayasundara et al., 2016).
Dairy manure acidification (to pH 6–6.5) with sulfuric acid (H2SO4) was found to decrease CH4 (>87%) and NH3 (>40%) emissions (Sokolov et al., 2019). Sommer et al. (2017) reported 68% reductions of CH4 and 62% of NH3 with H2SO4 acidification (to pH 5.2–5.5). Kavanagh et al. (2019) reported 96% reductions of CH4 and 85% of NH3 with H2SO4 acidification (to pH of 5.5). The mechanism of CH4 reduction is still unclear, as H2SO4 and pH reduction can disrupt microbial communities throughout all the processes of organic matter degradation as well as methanogens directly (Habtewold et al., 2018). Habtewold et al. (2018) reported a methanogen reduction of 6% in abundance and 20% in activity between untreated and acidified dairy manure but observed no difference in the microbial communities. This suggests that H2SO4 primarily disrupts methanogenesis rather than other microbial processes, however, more research is necessary to confirm these results. Petersen et al. (2012) reported substantial methanogen inhibitions (63–67%) from cattle slurry using potassium sulfate with no corresponding pH reduction. They suggest that sulfur transformations inhibit methanogenesis independent of any pH reduction. Therefore, lower rates of H2SO4 may reduce CH4 production without necessarily aiming for a certain manure pH value. However, it is important to note that in the acid of acidification, decreasing NH3 volatilization may still require lowering pH. Therefore, sulfate alone may not have the best overall treatment differences.
Due to the cost of acid, infrastructure and equipment, there is a need to make manure acidification more feasible. Treating only the inoculum (manure remaining in storage tanks after emptying) has been suggested to reduce the quantity and the frequency of acidification (Sokolov et al., 2020). As storages are difficult to completely empty, the residual manure becomes an inoculum for incoming fresh manure and increases subsequent CH4 emissions by 34–52% (Ngwabie et al., 2016). If the inoculation process can be disrupted, then reductions can be expected (Sokolov et al., 2020). Sokolov et al. (2020) measured CH4 production from manure incubated with 6-month-old, previously acidified inoculum and with 6-month-old, newly acidified manure inoculum. They reported 82 and 63% CH4 reductions, respectively, compared to the manure with untreated inoculum. They suggest that long-term effects of acidification could lower inoculation effect and reduce the frequency of acidification to every other tank emptying. These laboratory results are promising, however there is need to evaluate inoculum acidification on a large scale in outdoor manure storage tanks.
The objectives of this research were to: (a) quantify the effect of acidified aged manure as inoculum on CH4, NH3, and N2O emissions from dairy manure storages and (b) quantify changes in methanogen and bacterial abundance relative to CH4 reductions.
Methods
Meso-Scale Chambers
The study was conducted at the Bio-Environmental Engineering Center (BEEC) at Dalhousie University's Agricultural Campus in Truro, Nova Scotia, Canada (45°45' N, 62°50' W). The research site contained 6 in-ground, cement, meso-scale manure tanks (6.6 m2 and 1.8 m deep). This site has been previously described by Wood et al. (2012) and Le Riche et al. (2016). Each tank was filled with 10.6 m3 (160 cm depth) of liquid dairy manure, consisting of 20% inoculum (2.1 m3) and 80% fresh manure (FM; 8.5 m3). Manure was obtained from a local diary operation which housed 95 lactating cows in a free stall barn. The manure was gathered from an in-ground manure tank adjacent to the dairy barn and was a mixture of feces, urine, and sand bedding.
Two types of inoculum were used in this study: (i) 1-year-old untreated manure, and (ii) 1-year-old manure that was previously acidified (Table 1). This manure inoculum was obtained from the same farm in spring 2017 (12 months prior to the start of this trial). The previously acidified (PA) manure was acidified using sulphuric acid (70% H2SO4; 2.4 L m−3 manure) to pH 6. Both the PA manure and untreated manure inoculum remained in storage for 1-yr (Sokolov et al., 2019). Additional information about storage conditions of the inoculating manure prior to this study can be found in Sokolov et al. (2019).
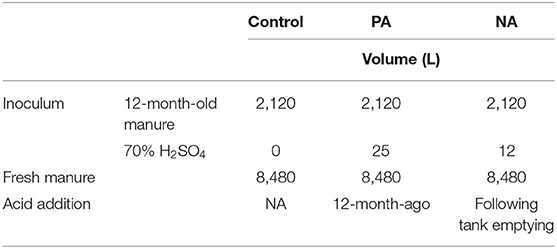
Table 1. Volume (L) of 70% sulfuric acid (H2SO4), inoculum, and manure added to the control, previously acidified inoculum treatment (PA), and newly acidified inoculum treatment (NA).
The six manure tanks were assigned within two blocks, each containing two treatments and a control. Inoculum was prepared on May 15–16, 2018 by pumping out of old storages and distributing 2.1 m3 to new storages using a pumping truck. The newly acidified (NA) inoculum treatment received 2.1 m3 of 1-yr-old untreated inoculum and was acidified on May 17, 2018 with 1.1 L m−3 70% H2SO4 (i.e., 12 L per 10.6 m3 tank). The PA inoculum treatment received 2.1 m3 of 1-yr-old inoculum which had been acidified the previous year (spring 2017) at 2.4 L m−3 (i.e., 5.04 L added to 2.1 m3; Table 1). Lastly, the control received 2.1 m3 of 1-year-old untreated manure inoculum. Fresh manure was added to each tank on May 28 and 29, 2018 using a pumping truck to transport manure from the farm to the research site. The NA inoculum treatment received 1.1 L m−3 H2SO4, which is half as much as a previous meso-scale study (Sokolov et al., 2019) but considerably more than in the laboratory study where rates were only 0.16 L H2SO4 m−3 of total manure (i.e., 0.03 mL of 98% H2SO4 in 180 mL of stored manure; Sokolov et al., 2020).
Sulfuric acid (industrial grade) was obtained from Bebbington Industries (Dartmouth, NS) and was pumped into the inoculum manure using acid resistant tubing and a peristaltic pump. The tubing was attached to an aluminum pole which was moved around the inoculum as the acid was being pumped.
Flux Monitoring
Emissions of CH4 and N2O were monitored continuously from Jun 8 to Nov 10, 2018 (155 days). Each manure storage tank was covered by a flow-through, steady-state chamber (~13 m3 headspace) consisting of an aluminum frame and 0.15 mm greenhouse plastic. Air was pulled through the chamber through intake slits at the front of the chamber and out through an exhaust fan and outflow exhaust duct and the opposite end. The rate of air flow within each chamber was approximately two full air exchanges per minute (~0.5 m3 s−1). The airspeed was measured within each exhaust duct using cup anemometers recorded by a CR1000 data logger (Campbell Scientific, Edmonton, AB). The air temperature within each chamber was measured using copper-constantan thermocouples at 10 cm above the manure surface and along with manure temperature at 80 cm depth and 150 cm depth, recorded by the same CR1000 data logger (Campbell Scientific, Edmonton, AB). Ambient air temperature was obtained from the nearest Environment Canada climate station (Debert, NS, 45.42 N, 63.42 W; Climate ID: 8201380).
Methane and Nitrous Oxide
Air samples were continuously pumped (RC0021, Busch Vacuum Pumps and Systems, Boisbriand, QC) from the exhaust duct of each tank and two ambient inflow locations, and carried through polyethylene tubing (3.2 mm i.d.; Rubberline Products Ltd., Kitchener, ON) to a 8 × 2 manifold (Campbell Scientific In., Logan, UT) containing 12 V DC valves (The Lee Co., Essex, CT). The valves directed two samples every 30 s through high-flow air dryers (Perma Pure LLC.; Toms River, NJ) and into one of two tunable diode trace gas analyzers (TDLTGA, Campbell Scientific, Logan, UT). Sample CH4 and N2O concentrations were continuously recorded by a CR5000 data logger (Campbell Scientific Inc., Logan, UT) and an adjacent PC computer monitored the analyzer performance by running the TDLTGA software (Campbell Scientific, Logan, UT).
Concentrations were averaged hourly and used to calculate flux rates using to the following:
where F is the hourly flux (mg m−2 h−1), Q is the flowrate of air out of the chamber [m3 h−1; calculated using average hourly windspeed × cross-sectional area of the exhaust duct (0.0645 m2)], A is the surface area of the manure surface (6.63 m2), and C is the concentration of gas (mg m−3) in the ambient inflow air (Ci) and sample outlet air (Co).
Due to technical issues, block one had missing flux data Aug 21-Sep 2, and block two had missing data Jul 18-Sep 2. This resulted in missing the peak fluxes in block two tanks. Linear interpolation was used to estimate the missing data, although the values were likely underestimated. All values are presented as treatment average.
Ammonia
Ammonia concentrations were determined using 125 mL 0.005 M H3PO4 acid traps. Three times per week, air was pumped (Model 2107CA20B; Thomas Pumps and Compressors, Sheboygan, WI) from the exhaust of each tank and two ambient inflow locations and bubbled through acid traps (dispersion tubes id = 35 mm) at 1.5 L min−1. Air was continually pumped through the traps for 24 h at each deployment. Airflow for each sample was measured using inline flow meters (Gallus 2000; Actaris Metering Systems, Greenwood, SC). Following deployment, evaporated liquid was replaced to 125 mL and a sample frozen until analysis. Samples were shipped to Agriculture and Agri-Food Canada (Ottawa, ON) where they were analyzed for NH3-N using the QuikChem® Method 12-107-06-2-A modified for 0.005 mol L−1 H3PO4 matrix using a Lachat QuikChem FIA+ Q8500 Series. Daily gas concentrations were calculated using the following:
where CNH3 air is the daily NH3-N concentration (mg m−3), CNH3 aq is the NH3-N concentration in sample liquid (mg L−1), Vaq is the volume of liquid in the acid trap (L), and Vair is the volume of air pumped through the acid (m3) (Hofer, 2003).
Ammonia emissions on days that were not sampled were estimated using linear interpolation and daily total NH3-N losses were added together to find the entire monitoring period.
Manure Sampling and Analysis
Six FM composite samples were taken during tank filling (May 29). Manure in each tank was sampled monthly throughout the study with one sample per tank made from a composite of 12 subsamples. Subsamples were taken from each tank in a grid at two depths and six locations. All samples were kept frozen until analyzed at the Nova Scotia Department of Agriculture's Provincial Soils Lab (Bible Hill, NS). Samples were analyzed for total solids (TS) and volatile solids (VS) (American Public Health Association method 2540 B), total nitrogen (TN) (combustion method AOAC 990.03-2002), ammonium-N (TAN) (American Public Health Association method 4500-NH3 B), and pH using an electrode (American Public Health Association method 4500-H+) (Clesceri et al., 1998). To verify pH, a FieldScout pH 400 meter (Spectrum Technologies, Aurora, IL, USA) was used to measure pH in the manure at 10, 50, 100, and 150 cm across 6 locations in each tank (24 pH points) on May 26, Jul 1, and Jul 31, 2018. These are not reported in the paper but verify the results of lab analysis.
For microbial analysis, duplicate composite samples were taken during storage tank filling (May 29, 2018) of FM, untreated inoculum, and previously acidified inoculum. Throughout the study, monthly composite manure samples were collected in duplicate and kept frozen until nucleic acid extraction. For each sampling, ~2 g of manure sample was stored in 5 mL of LifeGuard soil preservation solution (MoBio Laboratories Inc., Carlsbad, CA).
Nucleic Acid Extraction and Quantitative Real-Time PCR
Based on the typical CH4 emission curve, three sampling dates and starting FM and the two inoculums were chosen for analysis. The DNA or RNA PowerSoil total DNA/RNA isolation kit with RNA/DNA elution accessories (MoBio Laboratories, Inc., Carlsbad, CA) were used for DNA or RNA extraction. In triplicate, 8 μL of each extracted RNA sample was reverse transcribed to cDNA using Maxima First Strand cDNA Synthesis Kit (Thermo Scientific, Waltham, MA) following manufacturer's protocols.
Real-time qPCR was performed using an Applied Biosystems StepOnePlus real-time PCR system using clear 96-well PCR plates (Bio-Rad Laboratories, Inc., Hercules, CA). The total and active fraction of the methanogen populations were quantified by targeting methyl coenzyme A reductase (mcrA) genes and transcripts, respectively, using mlas-mod F and mcrA-rev-mod R primers (Habtewold et al., 2018). The total and active fraction of the methanogen populations were quantified by targeting methyl coenzyme A reductase (mcrA) genes and transcripts, respectively, using mlas-mod F and mcrA-rev-modR primers (Habtewold et al., 2018). Methyl Coenzyme M Reductase A gene is a fragment of DNA commonly found in methanogens that encodes the α-subunit of methyl-coenzyme M reductase enzyme which catalyzes the final step in methanogenic pathway (i.e., releases CH4) (Evans et al., 2019). Although methanogens may involve one or more of the methanogenic pathways (i.e., hydrogenotrophic, acetoclastic, and methylotrophic), all pathways share the final step which requires methyl-coenzyme M reductase enzyme. Thus, the functional mcrA gene has been used extensively to effectively target all methanogens (Evans et al., 2019). Each reaction well-contained 10 μL of Ssofast EvaGreen supermix (Bio-Rad Laboratories, Inc.), 1 μL (10 pM) of each primer, 2 μL of DNA or cDNA, and 6 μL of PCR-grade water. Plasmid standard curves were prepared for mcrA from Methanosarcina mazei (ATCC 43340), and for 16S rRNA genes, plasmid with 16S rRNA gene insert from soil bacterium Clostridium thermocellum was used. Although primer sets used to target mcrA or 16S rRNA genes are specific to the respective gene fragments, target specificity of the primers were also confirmed by assessing the presence of a single district peak for melting curves (fluorescence vs. temperature) of each target gene. The mcrA gene standard curve had an efficiency of 101.6%, r2 of 0.99, and slope of −3.29. The highest diluted standard had a cycle of quantification of 30.2 and no-template controls of 31.4. The 16S rRNA gene standard curve had an efficiency of 100.1%, r2 of 0.998, and slope of −3.32. The highest diluted standard had a cycle of quantification of 27.0 and no-template controls of 28.9. StepOne software v2.3 (Bio-Rad Laboratories, Inc., Hercules, CA) was used to calculate sample copy numbers.
Data Analysis
To compare treatments based on their global warming potential, GHG emissions were converted to 100-yr CO2-equivalent (CO2-eq) values and summed. Conversion values for the global warming potentials of CH4 and N2O were 34 and 298, respectively (IPCC, 2014). The contribution of indirect N2O emissions from NH3 volatilization were calculated using the IPCC emission factor of 0.01 (Dong et al., 2006).
Given that PA inoculum could reduce the need for acidification following every other emptying event, to compare use of PA inoculum and NA inoculum it is necessary to compare estimated total emissions over two storage periods. The total PA inoculum over two storage periods was calculated using the following:
where Total CH4 is the total production over two storage periods, Acidified manure CH4 is the production from one storage period where all manure was acidified (reported by Sokolov et al., 2019), and PA inoculum CH4 is the total CH4 production from the PA inoculum treatment.
The NA inoculum for two storage periods was calculated by doubling the total CH4 production from the NA inoculum treatment. Lastly, the control for two storage periods was calculated by doubling the total CH4 production from the controls. Note that this assumes both storage periods to have the same temperatures. Therefore, the two storage periods do not represent spring/summer and fall/winter, as emissions would be dramatically different during cold weather storage.
For each treatment the methane conversion factors (MCF) was calculated following IPCC methods (Dong et al., 2006). The calculation used the average VS of FM (disregarding VS of the inoculum) and maximum potential CH4 production (Bo) of 0.24 m3 CH4 kg−1 VS. Cumulative N2O and NH3-N emissions for each tank were scaled by TN and TAN in FM and then averaged for each treatment.
Treatment effects were assessed using repeated measures, mixed linear model analysis using PROC Mixed in SAS software (SAS Institute Inc., Cary, NC) using the Kenward-Roger fixed effects method on total biweekly CH4, N2O, and NH3 emissions. The CH4 data was skewed and therefore log transformed to conform to normality. The spatial Gaussian covariance structure was chosen based on best fit statistics. Significance was considered when p < 0.05. Treatment effects on mcrA and 16S rRNA gene and transcript copy numbers over all dates were assessed using a general linear model using PROC GLM in SAS software, which uses ordinary least squares with Sidak adjustment to control familywise error. Effect size was calculated using partial eta2 (ηp2). Significant results were followed up with a post hoc Sidak groupings comparison using a significance of p < 0.05.
Results
Manure Characteristics
Average ambient air temperature during the study (Jun 1–Oct 31, 2018; 160 d) was 15.1°C (with an average relative humidity of 77%) as recorded by the closest Environment Canada climate station. The 30-years normal for this location, Jun–Oct, is 14.7 ± 0.2°C (Mean ± SD). The temperature inside the tank chambers (10 cm above the manure surface) was 17.6 ± 0.8°C, which was, on average, 2.6°C warmer than the ambient air (Figure 1). The average manure temperature in the tanks was 13.7 ± 0.1°C at 150 cm depth and 17.6 ± 0.1°C at 80 cm depth. The manure temperature peaked at week 12 (d 68, Aug 14) at 80 cm (20.9°C) and week 15 (d 91, Sep 6) at 150 cm (15.6°C). The CH4 production followed a similar pattern, peaking a week earlier (d 61, Aug 7). Following the peak, the 80 cm temperature quickly fell. By the end of the study the temperature at 80 and 150 cm were both on average 14.3°C (~122 days, Oct 7).
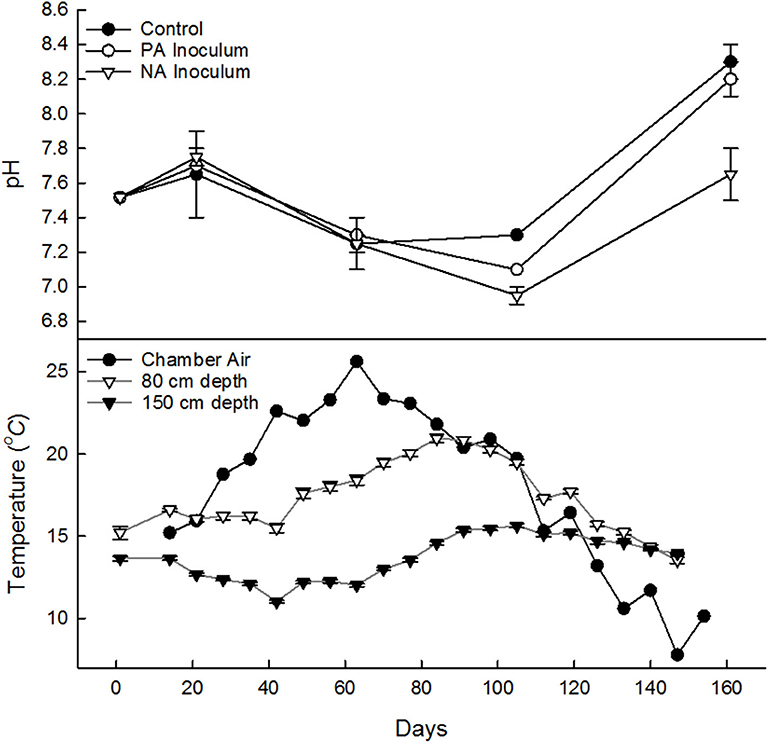
Figure 1. Manure pH (top) in control (•), previously acidified (PA) inoculum (°), and newly acidified (NA) inoculum treatments (∇), samples from on May 29 from fresh manure and stored manure on June 15, July 27, Sept 8, and Oct 2018 (7, 49, 92, and 155 days). Weekly average temperature (bottom) averaged across all tanks, of chamber air 10 cm (•) above manure and of manure at 80 cm (∇) and 150 cm (▾) depth. Error bars denote standard deviation.
The manure pH had no clear treatment differences until days 85 into the study (Figure 1). The control was expected to have the highest pH, but was on average the lowest on Jun 15, 2 weeks after the start of the study. The pH dropped throughout storage until Sept when it increased. By Sept 8, the control tanks had the highest pH and the NA inoculum tanks had the lowest. This trend continued in Oct as well (Figure 1).
The TS, VS, and TN were all highest in the FM and fell markedly by Jun 15 (Table 2). This is most likely due to settling of solids which occurs rapidly following storage tank filling, and issues with unrepresentative sampling of the manure depth (Sokolov et al., 2019). The control had consistently the least VS, TS, and TN (Table 2). This may be due to faster degradation of organic matter and loss of TN to the atmosphere, although given the small differences, it may also be due to natural variability in manure (Sokolov et al., 2019).
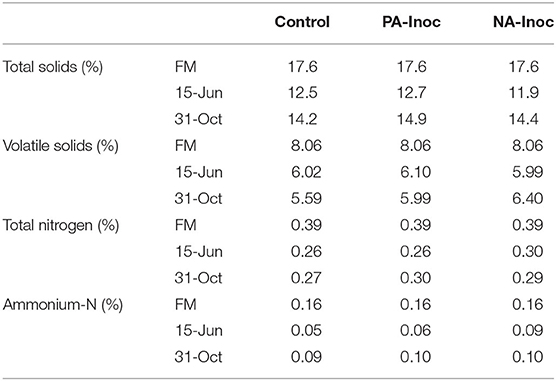
Table 2. Manure total solids (%), volatile solids (%), total nitrogen (%), and ammonium-nitrogen (%) sampled from fresh manure (FM) during tank filling (May 29, 2018), and stored manure on 7 days (Jun 15, 2018), and 155 days (Nov 11, 2018).
Greenhouse Gas Emissions
Methane
Results of the mixed linear model show a significant CH4 fixed effect due to treatment (p < 0.0001), time (p < 0.0001), and a combined effect of treatment and time (p < 0.0001). The average CH4 emissions were 36.1, 22.3, and 8.2 g m−2 d−1 from the control (80% FM and 20% inoculum), PA inoculum (80% FM and 20% previously acidified inoculum), and NA (80% FM and 20% acidified inoculum) storages, respectively (Table 3). All treatments had similar lag phases of ~40 d, although even during this time the control produced 31% more CH4 than the NA inoculum tanks and 27% more than the PA inoculum tanks (Figure 2). The rate of growth following the lag was much higher in the control storage tanks. In fact, between day 40 (Jul 17) and day 110 (Sep 25) the largest treatment differences were recorded. At this time, NA inoculum tanks produced 82% less CH4, while the PA inoculum tanks produced 47% less CH4 compared to the control. After 110 d, fluxes were similar to the control and PA inoculum tanks (<25% difference). The NA inoculum tanks continued to produce less (56–80%) CH4 than the control throughout the end of the study.
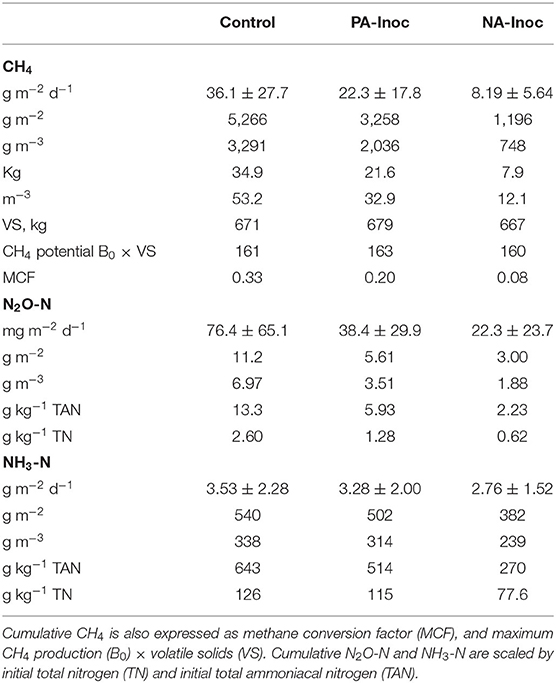
Table 3. Total (g m−2; g m−3; kg; m3) and daily mean (g m−2 d−1) methane (CH4), nitrous oxide (N2O-N), and ammonia (NH3-N) for manure with untreated inoculum (control), previously acidified inoculum (PA-Inoc), and newly acidified inoculum (NA-Inoc) in each block for the entire study period Jun 8–Nov 11, 2019 (155 days).
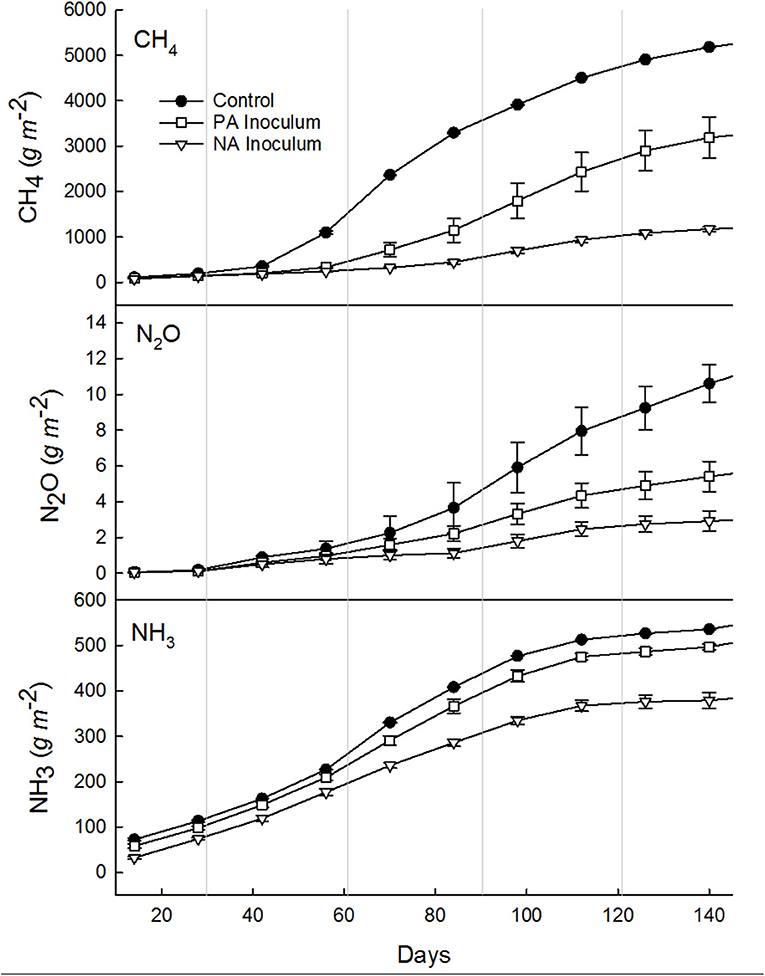
Figure 2. Cumulative methane (CH4), nitrous oxide (N2O), and ammonia (NH3) emissions summed every 14 days over the entire study period (Jun 8–Oct 31; 145 days), from manure with untreated inoculum (control, •), manure with previously acidified (PA, □) inoculum, and manure with newly acidified (NA, ∇) inoculum. Vertical gray lines denote the end of a month, starting with June and ending with Nov. Error bars show standard deviation (note some error bars are too small to see).
The total CH4 production was 5.27, 3.26, and 1.20 kg m−2 from control, PA inoculum, and NA inoculum tanks, respectively (Table 3). The PA inoculum (38%; p < 0.0001) and NA inoculum (77%; p < 0.0001) treatments produced significantly less CH4 compared to the control treatment. The NA inoculum treatment produced significantly less CH4 (63%; p < 0.0001) than the PA inoculum. These treatment differences were the same on a VS basis.
The MCF values were 0.33, 0.20, and 0.08 for control, PA inoculum, and NA inoculum tanks, respectively (Table 3). Given that the average temperature inside the chambers was 17.6°C, the IPCC default MCF would be 0.32–0.35, which aligns with our control results (Dong et al., 2006). The PA inoculum and NA inoculum were both markedly different than the IPCC value.
Nitrous Oxide
Results of the mixed linear model show a significant N2O fixed effect due to treatment (p < 0.0001), time (p < 0.0001), and a combined effect of treatment and time (p = 0.0141). The daily average N2O emissions were 76.4, 38.4, and 22.3 mg m−2 d−1 from control, PA inoculum, and NA inoculum, respectively (Table 3). After interpolation, the total N2O production was 11.2, 5.6, and 3.0 g m−2 from control, PA inoculum, and NA inoculum, respectively (Figure 2). This represented a significant (p = 0.0015) 50% reduction using PA inoculum and a significant (p < 0.0001) 73% reduction using NA inoculum, compared to the control. The NA inoculum produced 47% as much N2O than the PA inoculum tanks (p = 0.1091). The treatment differences increased slightly (<10%) when scaled by TAN and TN in the manure.
Ammonia
Results of the mixed linear model show a significant NH3 fixed effect due to treatment (p <0.0001), time (p <0.0001), and a combined effect of treatment and time (p = 0.0351). The average NH3 emissions were 3.53, 3.28, and 2.76 g m−2 d−1 from control, PA inoculum, and NA inoculum, respectively (Table 3). The total NH3 emissions over the entire study (160 days) were 540, 502, and 382 g m−2 from control, PA inoculum, and NA inoculum, respectively (Figure 2). This represented a significant (p = 0.0001) 7% reduction using PA inoculum and a significant (p <0.0001) 29% reduction using NA inoculum, compared to the control. The difference in NH3 volatilization between PA and NA inoculums was 25% (p = 0.1326), which is likely due to the similar manure pH.
CO2-Equivalent Emissions
On a CO2-eq basis, the total GHGs were 94–97% comprised of CH4 emissions, due to the anaerobic conditions within the manure storages (Table 4). Clear treatment difference was observed, where PA inoculum reduced total GHGs by 38% and NA inoculum reduced total GHGs by 77%, compared to control. All sources of GHG were reduced due to PA and NA inoculums, although CH4 was the most important in reducing total GHGs.
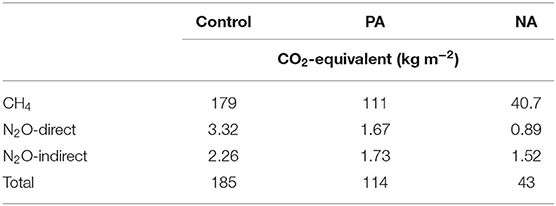
Table 4. Total greenhouse gas emissions presented on a CO2-equivalent basis (kg m−2) for methane (CH4), nitrous oxide (N2O), and indirect N2O from ammonia (NH3) over the entire 145-d monitoring period from the control, previously acidified (PA) inoculum, and newly acidified (NA) inoculum treatments.
Methanogens and Bacteria
The results of the 2-way ANOVA on copies of mcrA, mcrA transcript, 16S rRNA, and 16S rRNA transcript are shown in Supplementary Table 1. There were significant treatment effects on mcrA (p <0.0001) and 16S rRNA (p <0.0126) but not in mcrA or 16S rRNA transcript.
The FM had higher copies per gram of dry manure of mcrA transcript and bacterial 16S rRNA genes and transcript than untreated inoculum (30–45%; percentages are calculated on values prior to log transformations) sampled prior to the start of the study (Table 5). An exception was mcrA gene in untreated, control inoculum which had 64% more copies per gram of dry manure of than FM. These results differed from Habtewold et al. (2018) who reported more (11–458%) copies of genes and transcripts of both mcrA and bacterial 16S in inoculum compared to FM. At the start of the trial, previously acidified inoculum had lower mcrA copies of genes and transcript (88%) and lower 16S rRNA genes and transcripts (90%) compared to the untreated inoculum. Given that both inoculums were stored for 1-year under the same conditions, the difference in abundance are likely due to acidification with H2SO4 1-year prior.
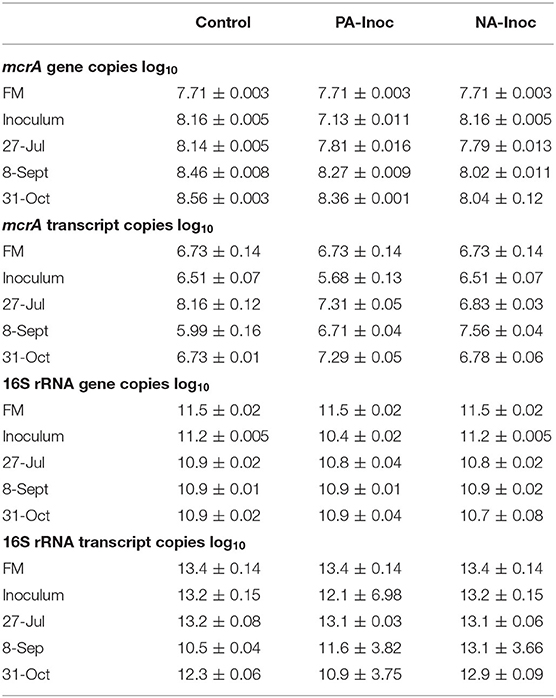
Table 5. Copies (log10) of mcrA and 16S rRNA gene and transcript from fresh manure (FM) and inoculum sampled on tank filling day (May 29, 2018), and from composite samples of stored manure on Jul 27, Sept 8, and Oct 31, 2018 from control (FM), newly acidified inoculum (NA-Inoc), and previously acidified inoculum (PA-Inoc) treatments.
Averaged over the entire study period, the control had significantly more mcrA gene copies compared to PA inoculum (39%) and NA inoculum tanks (65%, p < 0.05; Table 5). The PA inoculum tanks have significantly more mcrA gene copies than NA inoculum tanks (43%, p < 0.05).
The mcrA transcript copies were variable over time, although the most marked difference between treatments was Jul 27 (d 42) when the NA inoculum and PA inoculum were 95 and 85% less than the control copies, respectively. This corresponds with the initial increase in CH4 emissions. The average CH4 emissions during the sampling week were 43.0, 7.70, and 4.12 g m−2 d−1 from control, NA inoculum, and PA inoculum treatments, respectively.
On Sept 8 (85 days) the NA inoculum treatment had the highest copies mcrA transcript, with the control and PA inoculum having 97 and 86% fewer copies, respectively (Table 5). This corresponds to CH4 emissions during the sampling week of 43.4, 55.5, and 21.4 g m−2 d−1 from control, NA inoculum, and PA inoculum, respectively.
Lastly, on Oct 31 (108 days) the PA inoculum had the highest copies of mcrA transcript, with control and NA Inoculum having 81 and 86% fewer copies, respectively (Table 5). This corresponds to CH4 emissions during the sampling week of 30.0, 34.2, and 11.0 g m−2 d−1 from control, NA inoculum, and PA inoculum, respectively.
The 16S rRNA gene copies varied less over time and between treatments (Table 5). The 16S rRNA transcript copies in the control treatment increased and decreased following the same pattern as the mcrA transcript copies. This pattern was not observed in the NA and PA inoculum, suggesting that the methanogen and bacterial communities had differing influences.
Discussion
Storages with NA inoculum reduced total GHGs by 77%, while PA inoculum reduced emissions by 38%, compared to the control. Sokolov et al. (2019) acidified manure with no inoculum at rates of 1.4 and 2.4 L 70% H2SO4 m−3 and reported 85 and 88% reductions in total GHGs, respectively. Our results were slightly lower, which is likely due to the lower rate of acid and the presence of an inoculum. In a lab study, Sokolov et al. (2020) stored FM with previously acidified (2.4 L 70% H2SO4 m−3; 6-months old) inoculum and newly acidified inoculum at (0.17 L 98% H2SO4) 17, 20, and 23°C and reported average CH4 reductions of 82 and 63%, respectively, across all temperatures. The PA inoculum in the lab study was more effective, with 82% reductions compared to the 38% reduction in this study. This difference may be due to the lab scale or age of the inoculum. The NA inoculum in the lab study had a much lower rate of H2SO4, (0.16 vs. 0.79 L pure H2SO4 m−3 total manure) which explains the lower (63%) reduction of CH4.
All contributing GHGs were reduced using NA and PA inoculum. This is important to note, as often mitigating practices reduce one GHG in exchange for increasing another. Although there were clear GHG reduction treatment differences, the pH did not have corresponding differences. In fact, the pH was nearly identical among treatments until day 92 (Sept 7), thereafter the acidification treatments showed lower pH. Sokolov et al. (2019) also reported variable pH values in storage tanks following acidification, although the pH stabilized 35 days into the trial. Others have only observed increases in pH throughout storage due to natural processes re-establishing a neutral pH following acidification (Petersen et al., 2012; Shin et al., 2019). However, this might be due to better mixing of acid in initial short-term storage. The CH4 reductions could be due to sulfide (derived from sulfuric acid) reactions inhibiting methanogenesis, rather than pH changes alone (Petersen et al., 2012). Previous research has suggested that sulfate reducing bacteria outcompete methanogens for substrate due to a higher affinity (lower Ks) for H2 and acetate (Kristjansson and Schonheit, 1983). Future research should examine the mechanism of methanogenesis inhibition by sulfide reactions at different pH levels, corresponding hydrogen sulfide (H2S) production, and resulting total GHG emission reduction from liquid dairy manure.
The NA inoculum treatments reduced total GHGs and total CH4 by 77%. Both the control and the NA inoculum received the same untreated inoculum and FM, although NA inoculum received 1.2 L 70% H2SO4 m−3 (total manure in storage) into the inoculum prior to FM addition. This is similar to Sokolov et al. (2019) who reported an average 88% reduction of CH4 from acidifying FM using 1.4–2.4 mL 70% H2SO4 L−1 manure. Results of real-time qPCR suggest that the reduction is due to disruption in methanogen activity, which is expressed by lower mcrA transcript. On the sampling closest to peak emissions (Jul 27), the mcrA gene and transcript were lower in the NA inoculum tanks compared to the control. These reductions could be explained by the reduced activity of methanogens which was evidenced from the relatively lower abundance of mcrA genes and transcripts in the NA inoculum tanks compared to the control. A study by Habtewold et al. (2018) also found inhibition of methanogen abundance and activity following slurry acidification.
The PA inoculum treatments reduced total GHG and total CH4 by 38% using no acid in this storage period and only inoculum that was acidified 1-year prior. Results of the real-time qPCR suggest that the reduction is due to reduced methanogen activity in the inoculum. The previously acidified inoculum had markedly lower mcrA gene and transcript compared to the untreated inoculum at the start of the trial. The same results are observed during the following sampling event on Jul 27, which was during the time of peak emissions (40–110 days). This suggests that the reduced methanogen activity, expressed as mcrA transcript, in the PA inoculum led to lower methanogen activity later in the storage. This was also suggested by Sokolov et al. (2020), who reported that using PA inoculum had similar CH4 production as FM with no inoculum in a laboratory incubation study. They reported similar CH4 reductions of 49% using PA inoculum and 55% using no inoculum at 23°C. Ngwabie et al. (2016) similarly reported 36% reductions in CH4 from manure with no inoculum compared to manure with 20% inoculum (163 days storage).
Given that PA inoculum can reduce the need for acidification to every other filling, it is important to compare estimated total GHG emissions from PA inoculum and NA inoculum over two storage periods. Acidifying all manure in the first storage period and using the PA inoculum in the second period reduced an estimated total GHG emissions by 62%, compared to the control. Using NA inoculum over two storage periods reduced total GHG emissions by 77%, compared to the control. The amount of acid using PA inoculum compared to NA inoculum was nearly identical in both treatments (1.1 vs. 1.2 L m−3 year−1), although acidifying once accompanied a 38% decrease in GHG. Given that the cost of acid would be nearly the same, the best management practice would be to acidify each year. However, other factors are important to consider, such as the cost of the acidification process (acid delivery, equipment rental, labor, etc.) which is currently unclear and may be prohibitive to farmers. Additionally, removal of manure in the fall with PA inoculum accompanying winter storage may not reduce emissions further, as winter conditions cause very low GHGs regardless of inoculum and acid presence. However, spring emptying with PA inoculum accompanying summer storage could reduce the frequency of acidification and reduce GHG emissions by 62%. Additional research is necessary before we can conclusively state which is the most cost effective.
Manure pH appears to reach neutrality by the end of the storage period, therefore, it should not directly affect the soil pH following application. However, others have reported differences in nutrient composition in soil amended with acidified manure. Following soil application, delayed ammonium loss due to nitrification of ~20 days has been observed, suggesting more N availability to plants (Fangueiro et al., 2010, 2013, 2015). Petersen et al. (2013) reported higher P availability in soil with acidified manure, while Roboredo et al. (2012) reported an increase in inorganic P in the labile fraction (Roboredo et al., 2012; Petersen et al., 2013; Fangueiro et al., 2015). Lastly, Eriksen et al. (2008) found that H2SO4 in pig slurry increased the S fertilizer value, reducing the need for additional mineral fertilizer for crops (Eriksen et al., 2008). Although the current research appears to be positive, more research is necessary to fully understand the effects of applying acidified manure onto crop lands. It is important to note that most research has utilized higher rates of acidification, therefore changes to dairy manure with our NA inoculum or PA inoculum acid rates may be much lower.
Conclusion
Acidification of manure inoculum (1.1 L 70% H2SO4 m−3 total manure in storage) markedly reduced GHG emissions (77%) compared to the control (FM and untreated inoculum). This suggested that acidifying only the inoculum provided a positive treatment effect, while reducing the need to continuously acidify FM. CH4 reduction (77%) using NA inoculum was attributed to disruption of methanogen activity due to significant treatment effects on mcrA gene and transcript. Using PA inoculum had a moderate reduction on GHG emissions (38%) and somewhat larger when considered over 2 years (62%). This means that cost of acid and the acidification process can be reduced by acidifying every other storage period while still reducing GHGs. The CH4 reductions (38%) using PA inoculum was attributed to disruption of methanogenesis in the inoculum, hence removing the inoculating ability of the residual manure. Over two storage periods, the amount of H2SO4 was nearly identical between PA and NA inoculum treatments, however PA inoculum allowed for fewer acidification events, while still retaining good GHG reductions. This may allow farmers to reduce expenses associated with acidification while still mitigating GHGs, although more research is needed to validate its applicability at the farm scale.
Data Availability Statement
The datasets presented in the article may be requested by contacting Ym9zYTQ0MDBAbXlsYXVyaWVyLmNh or Um9iZXJ0LkdvcmRvbkB1d2luZHNvci5jYQ==.
Author Contributions
VS was the graduate student who is the primary author and project lead. AV was a co-supervisor contributing intellectually and financially to overall project, particularly for GHG emission aspects. JH helped create microbial analysis methods and assist with methanogen and bacterial quantification. KD contributed intellectually and financially to particularly to methanogen and bacterial quantification. JT contributed intellectually, lab space and equipment for the methanogen and bacterial quantification. CW-R contributed intellectually and with manuscript editing, particularly with the GHG emissions aspects. JV contributed intellectually helping with statistical analysis and manuscript editing. Lastly, RG was the major funding holder for this project, graduate co-supervisor contributing intellectually and financially, particularly with the GHG emission aspects. All authors contributed to the article and approved the submitted version.
Funding
This research was supported by Agriculture and Agri-Food Canada (2495), Natural Sciences and Engineering Research Council, and Wilfrid Laurier University.
Conflict of Interest
The authors declare that the research was conducted in the absence of any commercial or financial relationships that could be construed as a potential conflict of interest.
Supplementary Material
The Supplementary Material for this article can be found online at: https://www.frontiersin.org/articles/10.3389/fsufs.2020.568648/full#supplementary-material
References
Clesceri, L. S., Greenber, A. E., and Eaton, A. D. (1998). Standard methods for the examination of water and waste water. 20th ed. Washington, DC: American Public Health Association, American Water Works association, Water Environment Federation.
Dong, H., Mangino, J., McAllister, T., Hatfield, J. L., Johnson, D., Lassey, K., et al. (2006). “Chapter 10 Emissions from livestock and manure management,” in 2006 IPCC guidelines for national greenhouse gas inventories (IPCC), 10.1-10.87. Available online at: https://www.ipcc-nggip.iges.or.jp/public/2006gl/vol4.html
Eriksen, J., Sørensen, P., and Elsgaard, L. (2008). The fate of sulfate in acidified pig slurry during storage and following application to cropped soil. J. Environ. Qual. 37, 280–286. doi: 10.2134/jeq2007.0317
Evans, P. N., Boyd, J. A., Leu, A. O., Woodcroft, B. J., Parks, D. H., Hugenholtz, P., et al. (2019). An evolving view of methane metabolism in the Archaea. Nat. Rev. Microbiol. 17, 219–232. doi: 10.1038/s41579-018-0136-7
Fangueiro, D., Hjorth, M., and Gioelli, F. (2015). Acidification of animal slurry– a review. J. Environ. Manage. 149, 46–56. doi: 10.1016/j.jenvman.2014.10.001
Fangueiro, D., Ribeiro, H., Coutinho, J., Cardenas, L., Trindade, H., Cunha-Queda, C., et al. (2010). Nitrogen mineralization and CO2 and N2O emissions in a sandy soil amended with original or acidified pig slurries or with the relative fractions. Biol. Fertil. Soils 46, 383–391. doi: 10.1007/s00374-010-0444-1
Fangueiro, D., Surgy, S., Coutinho, J., and Vasconcelos, E. (2013). Impact of cattle slurry acidification on carbon and nitrogen dynamics during storage and after soil incorporation. J. Plant Nutr. Soil Sci. 176, 540–550. doi: 10.1002/jpln.201200117
Habtewold, J., Gordon, R., Sokolov, V., VanderZaag, A., Wagner-Riddle, C., and Dunfield, K. (2018). Reduction in methane emissions from acidified dairy slurry is related to inhibition of methanosarcina species. Front. Microbiol. 9:2806. doi: 10.3389/fmicb.2018.02806
Hofer, S. (2003). Determination of Ammonia (Salicylate) in 2 M KCl Soil Extracts by Flow Injection Analysis. Loveland, Colorado: Lachat Instruments.
IPCC (2014). Climate Change 2014: Synthesis Report. Contribution of Working Groups I, II and III to the Fifth Assessment Report of the Intergovernmental Panel on Climate Change. Geneva: IPCC.
Jayasundara, S., Ranga Niroshan Appuhamy, J. A. D., Kebreab, E., and Wagner-Riddle, C. (2016). Methane and nitrous oxide emissions from Canadian dairy farms and mitigation options: an updated review. Can. J. Anim. Sci. 96, 306–331. doi: 10.1139/cjas-2015-0111
Kavanagh, I., Burchill, W., Healy, M. G., Fenton, O., Krol, D. J., and Lanigan, G. J. (2019). Mitigation of ammonia and greenhouse gas emissions from stored cattle slurry using acidifiers and chemical amendments. J. Clean. Prod. 237:117822. doi: 10.1016/j.jclepro.2019.117822
Kristjansson, J. K., and Schonheit, P. (1983). Why do sulfate-reducing bacteria outcompete methanogenic bacteria for substrates? Oecologia 60, 264–266. doi: 10.1007/BF00379530
Le Riche, E. L., VanderZaag, A. C., Wood, J. D., Wagner-Riddle, C., Dunfield, K., Ngwabie, N. M., et al. (2016). Greenhouse gas emissions from stored dairy slurry from multiple farms. J. Environ. Qual. 45:1822. doi: 10.2134/jeq2016.04.0122
Ngwabie, N. M., Gordon, R. J., VanderZaag, A., Dunfield, K., Sissoko, A., and Wagner-Riddle, C. (2016). The extent of manure removal from storages and its impact on gaseous emissions. J. Environ. Qual. 45, 2023–2029. doi: 10.2134/jeq2016.01.0004
Petersen, J., Lemming, C., Rubæk, G. H., and Sørensen, P. (2013). Side-Band Injection of Acidified Cattle Slurry as Starter P-Fertilization for Maize Seedlings. RAMIRAN 2013 15th Int. Conf. Versailles Fr. 3-5 June 2013 Proc. Available online at: https://www.cabdirect.org/cabdirect/abstract/20163006158 (accessed August 19, 2020).
Petersen, S. O., Andersen, A. J., and Eriksen, J. (2012). Effects of cattle slurry acidification on ammonia and methane evolution during storage. J. Environ. Qual. 41:88. doi: 10.2134/jeq2011.0184
Roboredo, M., Fangueiro, D., Lage, S., and Coutinho, J. (2012). Phosphorus dynamics in soils amended with acidified pig slurry and derived solid fraction. Geoderma 189–190, 328–333. doi: 10.1016/j.geoderma.2012.06.030
Shin, S.-R., Im, S., Mostafa, A., Lee, M.-K., Yun, Y.-M., Oh, S.-E., et al. (2019). Effects of pig slurry acidification on methane emissions during storage and subsequent biogas production. Water Res. 152, 234–240. doi: 10.1016/j.watres.2019.01.005
Sokolov, V. K., VanderZaag, A., Habtewold, J., Dunfield, K., Wagner-Riddle, C., Venkiteswaran, J. J., et al. (2019). Greenhouse Gas Mitigation through Dairy Manure Acidification. J. Environ. Q. 48, 1435–1443. doi: 10.2134/jeq2018.10.0355
Sokolov, V. K., VanderZaag, A., Habtewold, J., Dunfield, K., Wagner-Riddle, C., Venkiteswaran, J. J., et al. (2020). Dairy manure acidification reduces CH4 emissions over short and long-term. Environ. Technol. 27, 1–8. doi: 10.1080/09593330.2020.1714744
Sommer, S. G., Clough, T. J., Balaine, N., Hafner, S. D., and Cameron, K. C. (2017). Transformation of organic matter and the emissions of methane and ammonia during storage of liquid manure as affected by acidification. J. Environ. Q. 46, 514–521. doi: 10.2134/jeq2016.10.0409
Keywords: manure management, methanogens, methane, inoculum, acidification
Citation: Sokolov V, VanderZaag A, Habtewold J, Dunfield K, Tambong JT, Wagner-Riddle C, Venkiteswaran JJ and Gordon R (2020) Acidification of Residual Manure in Liquid Dairy Manure Storages and Its Effect on Greenhouse Gas Emissions. Front. Sustain. Food Syst. 4:568648. doi: 10.3389/fsufs.2020.568648
Received: 01 June 2020; Accepted: 03 September 2020;
Published: 07 October 2020.
Edited by:
Dietmar Schwarz, Leibniz Institute of Vegetable and Ornamental Crops, GermanyReviewed by:
Jacobo Arango, International Center for Tropical Agriculture (CIAT), ColombiaGlaciela Kaschuk, Federal University of Paraná, Brazil
Copyright © 2020 Sokolov, Habtewold, Dunfield, Wagner-Riddle, Venkiteswaran, and Gordon. The following authors (VanderZaag and Tambong) carried out this work in the course of their employment with Agriculture and Agri-Food Canada, therefore, copyright interest is owned by Her Majesty the Queen in Right of Canada, as represented by the Minister of Agriculture.
*Correspondence: Vera Sokolov, Ym9zYTQ0MDBAbXlsYXVyaWVyLmNh