 Tonmoy Ghosh1,2
 Sandhya Mishra1,2*
- 1Applied Phycology and Biotechnology Division, CSIR – Central Salt and Marine Chemicals Research Institute, Bhavnagar, India
- 2Academy of Scientific and Innovative Research (AcSIR), Ghaziabad, India
Being a naturally produced colorant with fluorescent properties, C-phycoerythrin (CPE) has important food industry applications. However, optimization of extraction and its stability under storage is an aspect which needs further attention. In this study, optimization of CPE extraction from Lyngbya sp. CCNM 2053 was undertaken using response surface methodology (RSM). Preliminary screening suggested a phosphate buffered system with freeze thaw for cell disruption as the most suitable method. 22.40 ± 1.31 mg g−1 CPE and 52.76 ± 0.07 mg g−1 total proteins were extracted using phosphate buffer while freeze thaw method yielded 19.87 ± 0.43 mg g−1 CPE and 58.92 ± 3.49 mg g−1 total proteins. RSM was used to optimize phosphate buffer pH (5.5–8), molarity (0.1–1 M) and number of freeze thaw cycles (2–7). Interaction between buffer molarity and number of freeze thaw cycles was most significant for modeling the responses. Extraction of CPE was highest with pH 8 and low molarity buffers. The predicted values from the equations agreed well with the experimental values, proving the robustness of the model. The stability of the extract was also evaluated at different temperatures, light exposure times and pH values. Results indicated that light exposure should be kept to a minimum while the stability was affected by extreme temperatures and pH. CPE was comparatively stable in a pH and temperature range of 3–8 and 4–40°C respectively.
Introduction
C-phycoerythrin (CPE) is a water soluble, light harvesting accessory pigment found in some strains of cyanobacteria and is responsible for absorption of wavelengths inaccessible to chlorophyll. In addition to its role as a light harvesting protein, it is widely studied for its applications as a natural food colorant, anti-oxidant and anti-hyperglycemic agent, fluorescent tag, and small ion sensor (Sekar and Chandramohan, 2007; Ghosh et al., 2016, 2018, 2020; Ghosh and Mishra, 2020).
Due to its many practical applications, the extraction and purification procedures are generally multi-step and elaborate, to ensure quality and purity (Mishra et al., 2011; Ghosh et al., 2015). Although phycoerythrin, with its bright fluorescence, is widely regarded as a potential food colorant, most of the sources are limited to red seaweeds (Dufossé et al., 2005; Sekar and Chandramohan, 2007). A part of the reason is the lack of cyanobacterial sources; however, the other part is the problem of cyanotoxins produced by many members of the cyanobacteria family (van Apeldoorn et al., 2007; Bláha et al., 2009). Purification and stability of CPE is, thus, an area which requires detailed studies. Extraction of CPE normally involves cell disruption through one of the many available techniques like repeatedly freezing and thawing the biomass, high pressure homogenization, ultrasonication or enzymatic digestion (Reis et al., 1998; Sun et al., 2009; Mishra et al., 2011; Dumay et al., 2013). A proper extraction protocol should extract the maximum CPE with minimal contamination. However, there is a lack of consensus among the procedures. For instance, enzymatic digestion, although useful for seaweeds owing to their cell walls, might be unnecessary for cyanobacteria.
Stability of the extracted CPE is another factor for its acceptance in the food industry. Natural origin molecules are often seen as very environment susceptible and unstable, thus bringing down their shelf lives. There are a few studies reporting the stability of phycoerythrin from red algae and cyanobacteria (Mishra et al., 2010; Senthilkumar et al., 2013a; Munier et al., 2014; Anwer et al., 2016; Patel et al., 2018). However, barring one study, all of them used purified forms of phycoerythrin for their studies.
This study is an attempt to simplify and standardize the conditions for CPE extraction through a 2-step approach. A preliminary screening of buffers and cell disruption methods was carried out for obtaining maximum CPE with minimum total proteins. The chosen buffer and disruption method were further optimized using response surface methodology to obtain mathematical relationships for CPE and total protein extraction. The relationships were experimentally verified using a given set of conditions. Further, the crude extract obtained was investigated for its stability at different pH, light exposure durations, and temperatures. We believe that the results can shed more light on the acceptability of CPE as a food ingredient in the near future.
Materials and Methods
Microorganism, Culture Conditions, and Harvesting
Lyngbya sp. (CCNM 2053) was used from our laboratory's microalgal culture collection. It was cultured in a 500 ml shake flask culture containing 250 ml ASN III at 25 ± 2°C in a light intensity of 60 μmol m−2 s−1 and a photoperiod of 12:12 light: dark period. After 20 days, the filamentous biomass was skimmed off using a simple mesh filter and used as such. The moisture content was determined by drying a known amount of wet biomass at 110°C till constant weight. All the salts and chemicals were of analytical grade (HiMedia Chemicals, Mumbai, India) and were used without further purification.
Total Protein and CPE Estimation
The UV–visible spectral scans of the samples were recorded using a Cary 50 Bio UV–spectrophotometer (Agilent Inc., USA) in a range of 350–800 nm using a 1 cm pathlength quartz cuvette. The C-phycocyanin (CPC), allophycocyanin (APC) and CPE contents were determined using the equations given below (Bennett and Bogorad, 1973):
The purity ratio was calculated from the A562/A280 ratio.
The total protein was determined by a modified Bradford method (Bradford, 1976). Briefly, 100 μl of the protein sample was mixed with 100 μl of the respective buffer. One milliliter of Bradford reagent was added to this mixture and the absorbance of the sample was read at 595 nm. Bovine serum albumin (BSA) was used as a standard while the yields were calculated on a dry mass basis in all cases.
Experimental Design and Evaluation
The optimization of the extraction conditions was performed in two sequential steps. The efficiency of extraction under various different buffers and cell breakage methods were first analyzed in a preliminary screening. The buffer and cell disruption method with the maximum yields of CPE were further optimized through response surface methodology.
Preliminary Screening of Extraction Buffer
A preliminary screening of the various buffers methods was first investigated based on reported methods. We screened phosphate, tris chloride and piperazine-N,N′ bis (2-ethanesulphonic acid) (PIPES) buffers in comparison with de-ionized water (DW, MilliQ water purification system, Merck Millipore, USA). The total protein and CPE content were determined as detailed in section Total Protein and CPE Estimation.
Screening for Cell Disruption Method
Ultrasonication, freeze thaw and manual crushing of the biomass were carried out in phosphate buffer (0.1 M, pH value 7) to select the best suited method for cellular disintegration. A power input of 90 W at 100 Vrms and 0.9 Arms was used to sonicate the biomass using 10 s pulses followed by a rest period of 5 min. The biomass was kept on ice during the process to minimize protein denaturation. Freeze thaw process was carried out by freezing the biomass in the respective buffer at −70°C followed by a thaw cycle at 27°C. Manual crushing of the wet biomass suspended in an appropriate buffer was done using a pestle–mortar.
Design for Response Surface Methodology
The optimized buffer and cell disruption method was further evaluated using response surface methodology (RSM) for maximizing CPE extraction (Design-Expert 8, Stat-Ease Inc., USA). We used a central composite design (CCD, 3 factor−3 level) with pH (A), molarity (B) and number of freeze thaw cycles (C) as independent variables to achieve maximum extraction (Table S1, Electronic Supplementary Information, ESI). The experiment consisted of 20 experimental runs at 3 coded levels (−1, 0 and +1) with all the points being run in triplicate as per the design to minimize error. The responses (Y) were evaluated using a quadratic model equation:
where β0 represents the intercept, βi is the linear effect coefficient, βii is the quadratic effect coefficient and βij is the interaction effect coefficient, xi and xj are the independent variables and ε is the error.
Model Validation
The optimized model was evaluated for its prediction accuracy by setting up an extraction system with known inputs while the predicted value of CPE and total proteins were calculated from their respective model equations.
Stability of the Crude CPE Extract
Stability Under Different pH Values
The stability of the CPE crude extract was investigated within a pH range of 2–12 using different buffers. The spectral scans were recorded from 350 to 800 nm.
Stability Under Different Light Exposure Duration
The stability of the crude extract was studied after exposure of the samples to a light intensity of 120 μmol m−2 s−1 using cool white fluorescent lamps. The samples were exposed for up to 2 days and the spectral scans were recorded in the 350–800 nm range at appropriate intervals.
Stability Under Different Temperatures
The thermal stability of the crude extract was studied in a temperature range of 4–100°C after 2 h of exposure. To study the long-term stability, the extract was stored at different temperatures (−60, 4 and 10°C) for up to a week with the spectral readings being collected at appropriate intervals. Samples at 4 and 10°C were kept in refrigerators (Samsung, South Korea), while the samples at 20 and 30°C were kept in an incubator shaker (Jeio Tech Co. Ltd., South Korea). Samples at −64°C were kept in a deep freezer (Eppendorf, Germany) while for heating the samples at 40, 50, 60, and 100°C, we used a heating block (Bionic Scientific, India).
Statistical Analysis
All the values have been presented as mean ± SD of 3 triplicate values. Fisher LSD test was used for the statistical analysis for the screening of buffer and cell disruption methods using InfoStat v2013d (Di Rienzo et al., 2011). The difference was considered significant at p < 0.05. The analysis of variance (ANOVA, partial sum of squares type III) and statistical analysis for the optimization data were done using Design-Expert v8.
Results
Effect of Buffer Choice on Extraction of Total Protein and CPE
We chose to study the effect of three different buffers on the extractability of CPE from a cyanobacterium, Lyngbya sp. (CCNM 2053) while deionized water (DW) was taken as the control. The pH values of all the 3 buffers was adjusted to 7.0 to mirror the pH of deionized water while the ionic strength of each was 0.1 M. Phosphate buffer was the ideal solvent for extracting CPE (22.40 ± 1.31 mg g−1) (Figure 1) followed by PIPES as the second-best alternative (19.24 ± 0.46 mg g−1). However, the main difference is the amount of total proteins PIPES extracts out of the cells (63.54 ± 0.4 mg g−1) compared to phosphate (52.76 ± 0.07 mg g−1). DW also is a good candidate for CPE; however, it extracts the highest amount of other proteins from the cells. The probable reason is the absence of salts which can lead to osmolysis. On the other hand, tris chloride has the second highest amount of total proteins with the lowest CPE, thus making it ineffective for our purposes.
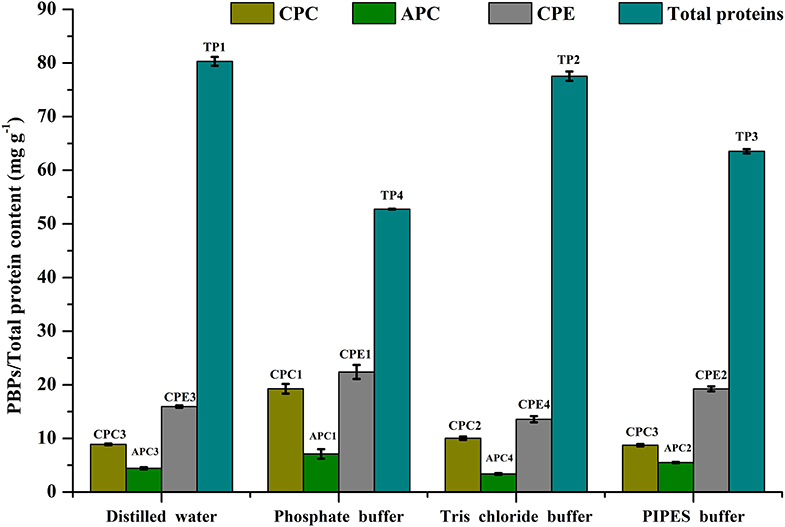
Figure 1. Screening of different buffers for CPE and total protein extraction. pH of all buffers adjusted to 7. Significance of each extracted analyte denoted by its initials followed by significance number. A different number denotes statistical significance (p < 0.05, n = 3). TP, Total proteins.
Alternate buffers like tris chloride have also been reported in literature for the extraction of phycobiliproteins. Soni et al. (2010) have utilized tris chloride for the extraction of CPE for crystallization studies. Mubarak Ali (2013) has reported yields of 85.84 ± 0.63 mg g−1 CPE and 45.51 ± 1.21 mg g−1 CPC using tris chloride. Good's buffers are another series of buffering salts that have been designed specifically for biological systems (Good et al., 1966). We used PIPES as a buffer system through which we have achieved a good extraction ratio for CPE. Although these buffers were developed as an alternate to phosphate or acetate buffers for routine biological work, little work has been reported on phycobiliproteins till date.
Another important observation was that the CPE purities in the crude extract were the highest when phosphate buffer was used as an extractant, which is an advantage during their downstream purification and processing. The CPE content was 42.46% of the total protein content. The next best buffer in this criterion was PIPES with CPE content of 30.28% of the total protein. The non-selective extraction of all soluble proteins in tris chloride and DW affected the purity of CPE to a great extent. A higher yield led us to choose phosphate buffer for further optimization studies.
Effect of Cell Disruption Method on Total Protein and CPE
Cell disruption is an essential parameter for extraction of metabolites. There are different methods that have been followed for maximizing cellular disruption leading to a higher product yield. We have chosen 3 different methods—ultrasonication, freeze thaw, and grinding—to compare their effects on CPE recovery from intact cells. Phosphate buffer (0.1 M, pH 7) was used for all the methods. The maximum recoveries as well as the highest purity of CPE were obtained through the freeze thaw method. The total protein recovery was also the highest in this method (Figure 2). The CPE content was 19.87 ± 0.43 mg g−1 while the protein content was 58.92 ± 3.49 mg g−1. On a weight basis, 33.72% of the total protein content was CPE. The corresponding purity ratio was 1.92.
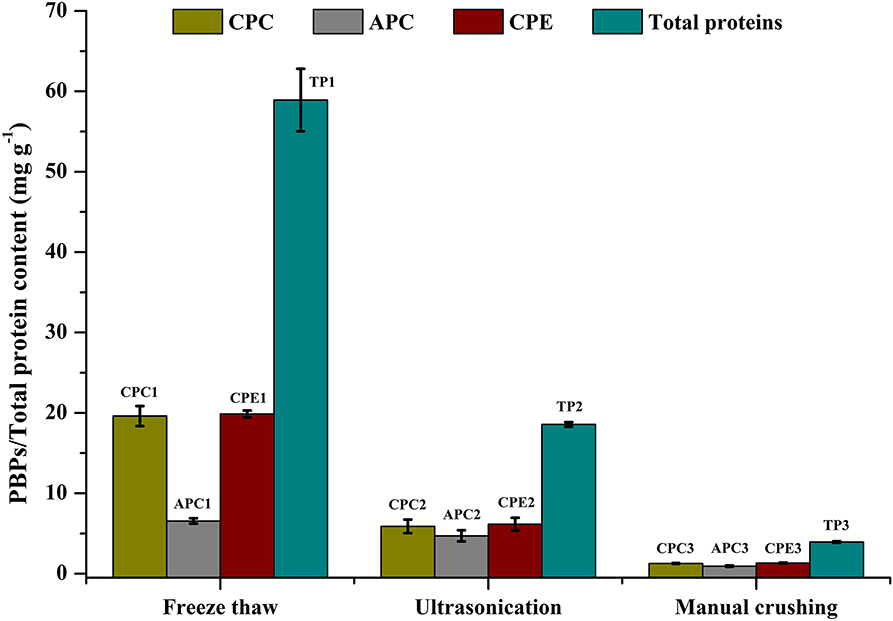
Figure 2. Screening of different cell disruption methods for CPE and total protein extraction. Significance of each extracted analyte denoted by its initials followed by significance number. A different number denotes statistical significance (p < 0.05, n = 3). TP, Total proteins.
We were able to achieve yield of 6.16 ± 0.79 mg g−1 CPE using a 25 kHz sonicator (Figure 2). 33.17% (w/w) of the total protein content was CPE with a purity ratio of 0.58. The purity ratio was very low compared to the freeze thaw method, which points out denaturation during the process. Manual crushing of the wet biomass in an appropriate buffer was carried out using a pestle-mortar. We were able to extract 1.33 ± 0.05 mg g−1 CPE (Figure 2). On a weight basis, 33.76% of the total protein content was CPE. The total protein yield was 3.94 ± 0.10 mg g−1 while the purity ratio of CPE was 0.34. The low purity ratios underline the non-selective extraction of soluble proteins from the cells. Comparing all the three methods, higher purities and high yields led us to choose the freeze thaw method of cell disruption for further optimization.
Optimization of CPE and Total Protein Yields Using Response Surface Methodology
The actual experimental runs as designed by the software and the corresponding responses have been presented in Table 1 while ANOVA and significance of the models have been presented in Table S2 (ESI). The coded levels were selected on the basis of the screening experiments. Based on the preliminary findings, freeze thaw method in potassium phosphate buffer (0.1 M, pH 7) had yielded the maximum CPE content as well as the highest purities. Optimization of the pH (A), molar strength of the buffering system (B) and the number of freeze thaw cycles (C) was carried out to accurately predict the behavior of the system. The predicted responses reasonably agreed with the experimental values, emphasizing the reasonable accuracy while using a quadratic model. The positive terms in each equation denote a synergistic and the negative terms denote an antagonistic effect of the variables on the respective responses.
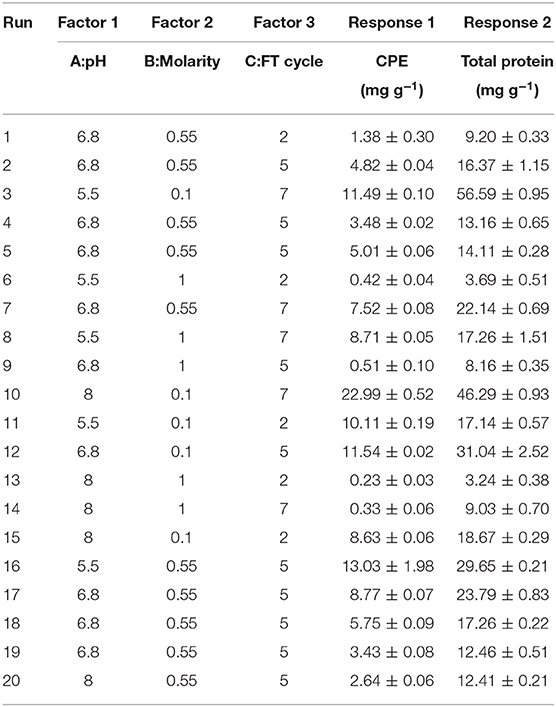
Table 1. Experimental design and responses for optimizing CPE and total protein extraction.
Extraction of CPE
The extraction of CPE was modeled using the following quadratic equation:
The three-dimensional plot has been shown in Figure 3 while the ANOVA has been presented in Table S2 (ESI). The adjusted R2 value (0.8975) agrees with the predicted R2 (0.8794) while the model equation explains 89.75% of the variations in CPE content. The adequate precision ratio value of 28.16 is able to ignore the noise generated effectively. We observed higher CPE contents when buffers of low molarity were used for extraction. We were interested in the relationship between pH and buffer molarity on CPE extraction, whether any conditions could give us higher yields. We observed that low molarity buffers with the pH 8 resulted in more CPE. It is quite understandable if the extraction efficiency increases with the number of times a batch of biomass is frozen and thawed repeatedly; however, the low salt concentration in the buffers tended to increase the “salting in” effect. The maximum CPE was observed with 0.1 M, pH 8 buffer and 7 freeze thaw cycles (22.99 ± 0.52 mg g−1) (Table 1). It was interesting to note that, individually, pH was more influential (p-value 0.0019) compared to when it was analyzed as part of an interaction with other factors (Table S2, ESI). It signifies the role that it plays in the stability of CPE in the crude extract. On the other hand, freeze thaw cycles and molarity, taken together, had more significance in CPE extraction (p-value < 0.0001), which supports our argument of “salting in” in low molarity buffers with more freeze thaw cycles per biomass batch.
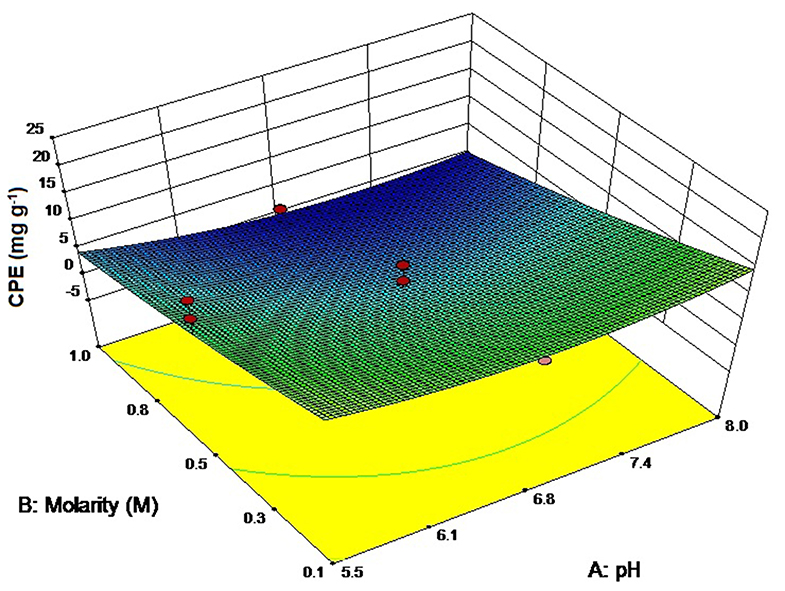
Figure 3. Three-dimensional plot of interaction between pH and buffer molarity for CPE extraction.
Extraction of Total Proteins
The total protein content was modeled using the following quadratic equation:
The ANOVA values have been presented in Table S2 (ESI) while the three-dimensional graph has been shown in Figure 4. The adjusted R2 (0.93) agreed with the predicted R2-value (0.9211) while the signal—to—noise ratio was 36.88, sufficient for the model to ignore the noise generated. The model was capable of explaining 93% of the variation in total protein content. The highest protein yields have been found with 0.1 M buffer and 7 freeze thaw cycles (56.59 ± 0.95 mg g−1, Table 1) that again supports the “salting in” hypothesis as proposed with the extraction of CPE. Soni et al. (2008) have reported total protein values of 4.3 mg g−1 from Phormidium fragile using the freeze thaw extraction method. In comparison, we were able to achieve protein yields as high as 56.59 ± 0.95 mg g−1 when the cell mass was freeze thawed in 0.1 M phosphate buffer 7 times. Compared to CPE, pH and molarity together had a lesser role to play here (p-value 0.9890), presumably because we were interested in all the proteins instead of a specific one. However, the combination of buffer molarity and number of freeze thaw cycles again had a significant role to play in the extraction process (p-value < 0.0001) (Table S2, ESI).
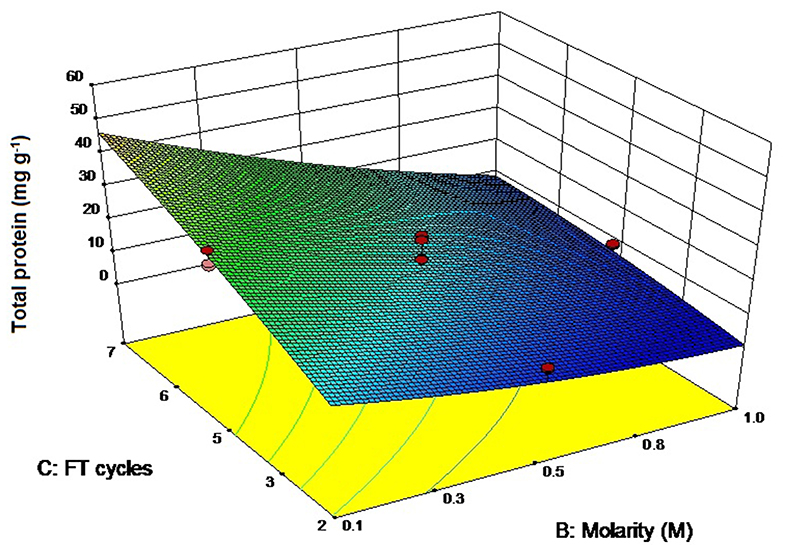
Figure 4. Three-dimensional plot of interaction between freeze thaw cycles and buffer molarity for total protein extraction.
Verification of Optimized Models for Extraction of CPE and Total Proteins
The optimized equations were used to predict the CPE and total protein content using 0.1 M phosphate buffer (pH value 6.8) and 5 cycles of freeze thaw for validation of the model. The values have been presented in Table S3 (ESI). The observed values agreed with the predicted values for all responses, which signify the robustness of the model and the relevance of prediction equations.
Stability of the Crude CPE Extract
Stability in Different pH Values
CPE was found to be pre-dominantly stable under slightly acidic conditions (Figures 5A,B). Under a pH range of 3–8, there was not any appreciable difference in the color of CPE extract (data not shown). The spectral differences were also minimal (Figure 5A). However, after being stored at pH 9 and upwards, there was a marked difference between the control and the stored samples with significant decrease in absorbance of the chromophore while there was almost complete denaturation under pH 11 and 12. If we look at the trace intensity plot (Figure 5B), we can see that the region of stability extends from pH 3–8 while the values at pH 9 and 10 could also be treated being fairly stable. However, the source organism of this CPE is not an alkaliphilic, nor does it come from a region of elevated pH ranges or fluctuations. Hence, its metabolites cannot be safely considered as stable for prolonged durations under extreme pH values.
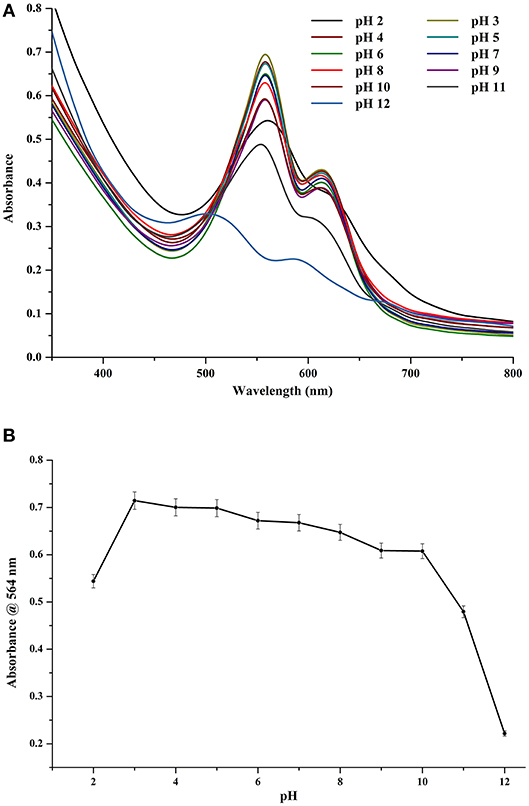
Figure 5. (A) Effect of different pH on crude CPE extract. (B) Trace absorbance intensities at 564 nm for CPE extract at different pH.
Stability Under Different Light Exposure Durations
Light played a major role in the stability of chromophore and, consequently, that of CPE. At an exposure of 120 μmol photons m−2 s−1, even a time period of 1 h had a detrimental effect on the stability of the crude extract. However, increasing the exposure time further did not have very significant effect on the stability of the chromophore (Figures 6A,B). After 12 h of continuous exposure, CPE began to show signs of denaturation (Figure 6A). The denaturation profile was noticeable when the control was compared with the sample exposed to 48 h of light. If we look at the trace intensities (Figure 6B), there is a sharp decrease in the absorbance profile after an exposure of 1 h, while there is a significant difference between the intensities after 1 and 8 h of exposure. The intensity stabilizes to an extent after 6 h of exposure, after which the color of the tube became visibly faint compared to the control (data not shown).
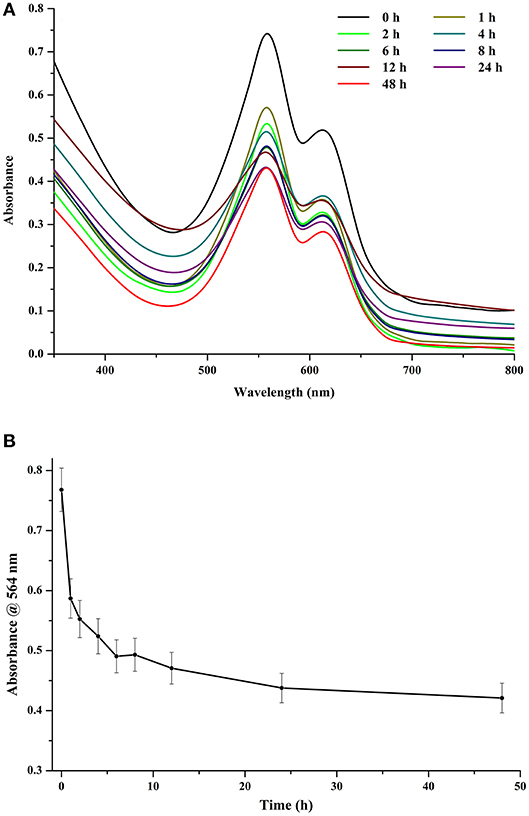
Figure 6. (A) Effect of different light exposure durations on crude CPE extract. (B) Trace absorbance intensities at 564 nm for CPE extract for different light exposure durations (light intensity 120 μmol photons m−2 s−1).
Stability of the Crude Extract Under Different Temperatures
The thermal and storage stability of the CPE extract was investigated in different temperatures in the dark (Figures 7A,B). For the 2-h data, the extract was comparatively stable till 30°C; thereafter, it began to show signs of degradation (Figure 7A). At 100°C, it was almost completely denatured with visible loss of color and negligible fluorescence (data not shown). If we look at the trace intensities of CPE during the thermal stability test (Figure 7B), there was a sharp decrease in the absorbance after 40°C, which suggests the denaturation of the pigment.
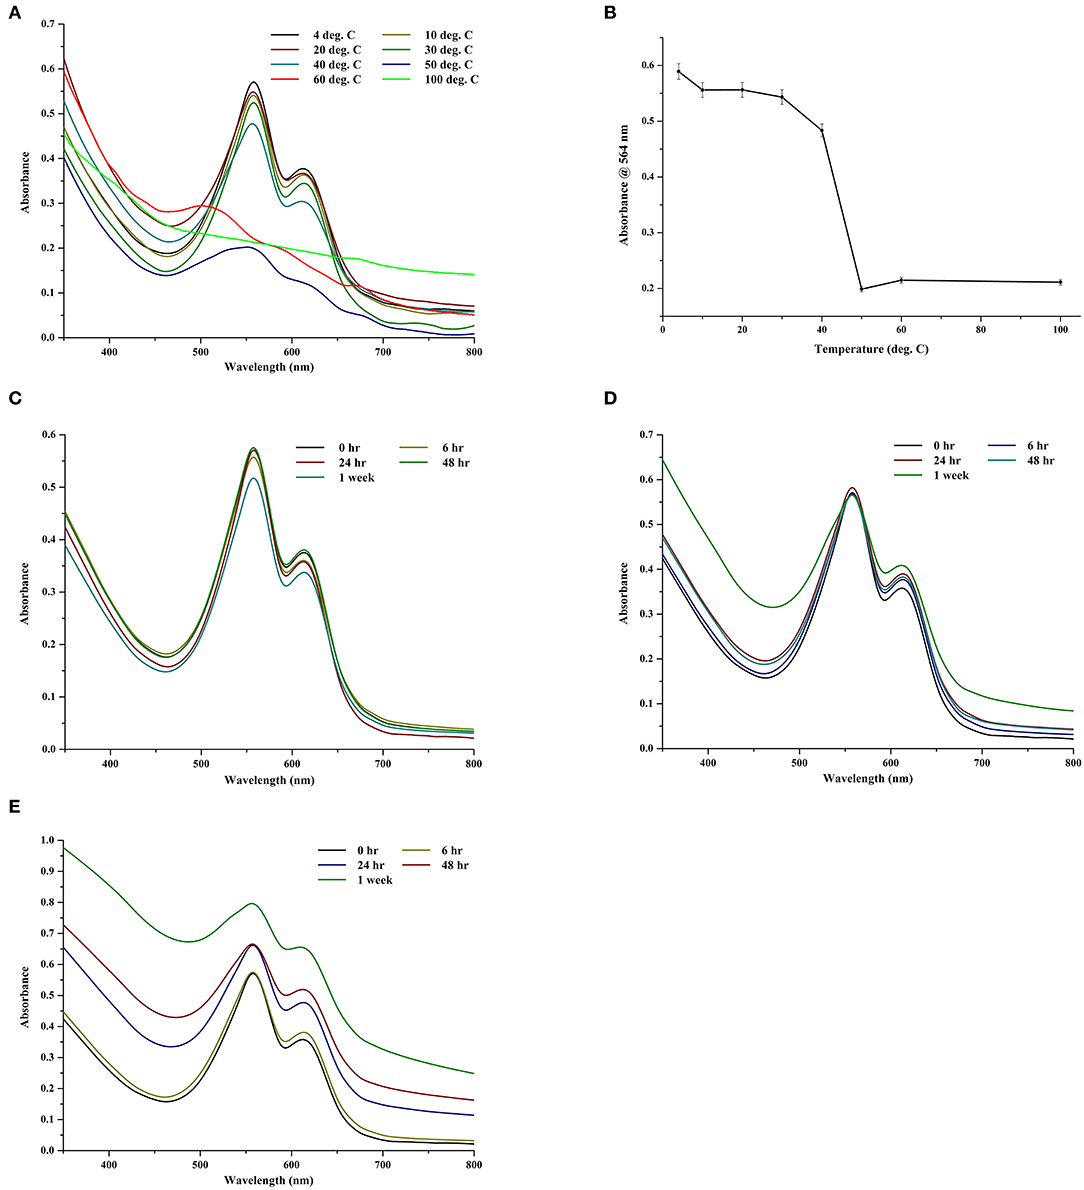
Figure 7. (A) Effect of different temperatures on crude CPE extract. (B) Trace absorbance intensities at 564 nm for CPE extract kept at different temperatures for 2 h. (C) Effect of storage at −64°C on crude CPE extract. (D) Effect of storage at 4°C on crude CPE extract. (E) Effect of storage at 10°C on crude CPE extract.
To study the effect of storage, the extract was stored in dark at −64, 4, and 10°C for 1 week and the spectra were collected at appropriate intervals. Predictably, the extracts at −64°C showed negligible loss of color (Figure 7C). At 4°C, the chromophore was stable after a week but the protein backbone of CPE began to show signs of deterioration (Figure 7D). However, the long term (1 week) storage at 10°C had the maximum deterioration on the extract (Figure 7E) wherein both the chromophore and the protein backbone began to degrade. There was a visible loss of color along with a smell of rotting, possible due to the decomposition of sulfur in the amino acids.
Discussion
Choice of Buffer and Cell Disruption Methods Influence CPE Extraction
The extraction of CPE is a complex model with various factors playing a role. The downstream processing of the crude extract and the steps involved in it depends solely on the nature and amount of contamination. The presence of salts has an effect on the solubility of proteins (Arakawa and Timasheff, 1982); small concentrations of salts (<1 M) may actually increase the solubility of proteins as a result of the “salting in” mechanism (Timasheff and Arakawa, 1988). In other words, dilute buffers have better protein extraction abilities. As it is favorable to have as low levels of contaminating proteins as possible, phosphate buffer was the choice since it had the maximum CPE : total protein ratio (w/w).
Two main buffer types have been reported for the extraction of CPE: tris chloride and phosphate buffers. However, there are wide variations between the ionic strengths utilized for their preparation (Soni et al., 2010; Mishra et al., 2011; Parmar et al., 2011; Senthilkumar et al., 2013b; Munier et al., 2014; Sonani et al., 2014; Patel et al., 2018). Both these buffers have been used for seaweeds as well as cyanobacterial extraction procedures and have been effective. However, there is a lack of knowledge about other buffer and/or de-ionized water for the extraction of CPE. There are very few reports on Goods' buffers or de-ionized water as a solvent to extract phycobiliproteins. Peterson and colleagues have used a 0.03 M 4-(2-hydroxyethyl)-1-piperazineethanesulfonic acid (HEPES)/PIPES combination buffer for the isolation of phycobiliproteins from heterocysts or intact cells of Anabaena variabilis (Peterson et al., 1981) while another study has used water for extracting CPE and CPC (Mubarak Ali, 2013). The choice of buffer is dictated mostly by the availability and economics of the chemicals and their ease of use. While de-ionized water is the simplest extractant available, it also solubilizes the non-targeted proteins, through osmolysis, which contaminate the extract. Phosphate salts of sodium and potassium are one of the most easily available and thus, are widely used for making the buffers.
Cell disruption system is another area which needs a comparative study for proper conclusions. Enzymatic hydrolysis, ultrasonic cavitation, repeated freeze–thaw and manual crushing are some of the methods utilized for extraction of phycobiliproteins. Enzymatic hydrolysis is especially useful for those organisms which have a tough cell covering and/or outer sheath to protect the cells. For instance, it specifically dissolves the cell wall components in seaweeds and has been reported in a few studies (Reis et al., 1998; Santiago-Santos et al., 2004; Dumay et al., 2013) with reported yields ranging from 0.5 to 150 mg g−1. However, purified enzymes are not traditionally required for cyanobacterial cultures since their cells are devoid of any specialized protection.
Repeated freezing at sub-zero temperatures followed by instant thawing is intended to shock and rupture the fragile cell walls and is considered to be one of the gentler techniques from the point of view of the proteins, since there is no heat generation involved. As such, it is one of the most common methods used for phycobiliprotein extraction (Soni et al., 2010; Mishra et al., 2011; Parmar et al., 2011; Ghosh et al., 2016, 2018, 2020; Patel et al., 2018; Ghosh and Mishra, 2020) with recoveries ranging from ~29 to 102 mg g−1 of cell dry weight in the crude extract.
Ultrasonication is a cell breakage method which uses ultrasonic sound waves to achieve acoustic cavitation—the rapid formation, growth and collapse of air bubbles in a liquid medium. It is a rapid method for cellular disruption. The rapid formation and collapse of bubbles can lead to a considerable release of heat energy, a factor that may contribute to denaturation. Johnson et al. (2014) have reported total PBP yields ranging from 19 to 42 mg g−1 dry mass basis using sonication as a cell disruption method while (Safi et al., 2014) have reported total water-soluble protein yields between 8.5 ± 0.0 and 67.0 ± 0.9% in 5 different micro and macroalgae when they utilized sonication as a method for cell breakage. Sun et al. (2009) have also utilized ultrasonic cell disruption for R-phycoerythrin extraction from Heterosiphonia japonica at a power of 350 W for 10 min keeping the temperature constant at 0°C.
Manual crushing of biomass with or without using an abrasive is also reported in some studies (Gómez-Lojero et al., 1997; Munier et al., 2014). Due to generation of heat from the crushing process, the CPE extracted runs the risk of being denatured even before it is completely extracted into the buffer. Although 33.76% of the extracted protein using this method comprised of CPE, the low recoveries and purity ratio was a major reason for not selecting this particular method.
Due to the lower levels of contamination, phosphate buffer [42.46% (w/w) CPE in total extracted proteins] and freeze–thaw [33.72% CPE (w/w) in total extracted proteins] method were chosen for further experiments.
Optimization of the Extraction Conditions Using Statistical Optimization
Statistical optimization of the extraction conditions involved optimization of three processes: pH (A), buffer molarity (B) and number of freeze thaw cycles (C). The solid:liquid ratio (SLR) was kept constant at 0.125 ml mg−1 and the buffer volume was adjusted according to the dry weight in each tube. To take advantage of the salting—in effect, low molarity buffers were prepared which were able to achieve more extraction compared to higher molarity ones. The number of cycles also played a role in the extraction process; however, increasing the number of cycles would also increase the total protein content. Keeping this in mind, the trick was to moderate the freeze thaw cycles with low molarity buffer (pH 8).
The amount of total proteins was also less in pH 8 buffers, compared to pH 6.8 and 5.5, which makes purification of the crude extract easier and also avoids unwanted contamination. Since this process is being optimized for a food ingredient, it is necessary to reduce unwanted molecules in the extraction process. The purity ratio (3.84) was also better in pH 8 buffer. If we could choose one condition, it would be to use pH 8 low molarity buffers for maximal CPE extraction, with minimal contaminating proteins.
During the verification of the model, the experimental and theoretical values agreed with each other, which indicates the model suitability and efficacy.
Stability of CPE Crude Extract
The stability of the crude extract was determined on the basis of absorbance readings for the CPE samples. The extract was stable under the experimental conditions, with no unwanted odors and colors. The color stability of CPE depends on the chromophore, while the structural stability is significantly dependent on the protein backbone.
The results from the pH experiments suggest that CPE extract is stable for short durations, within a pH range of 3–8 range (Figure 5A), which is beneficial for the beverage industry. Many of the beverages and drinks have an acidic pH, so a colorant stable under such conditions is highly desirable. The light exposure duration experiments suggest there is decrease in the stability of CPE extract after 1 h of exposure, which can be seen in the absorbance spectra (Figure 6A). The stability of the extract to temperatures as high as 40°C for 2 h is advantageous since it protects CPE from short duration fluctuations in temperature. Above 40°C, there was considerable degradation in CPE stability (Figure 7B). The storage of CPE extract under different temperatures showed stability at −64°C (Figure 7C) which was expected since it reduces the water activity of the protein to a minimum. Long duration storage at 10°C was found to be unfeasible since CPE showed signs of degradation within 24 h of storage with peak broadening and appearance of a shoulder peak (Figure 7E). The shoulder increased in prominence with time till it was clearly noticeable after a week. Sub-zero temperatures are, obviously, ideal for long-term storage; it is necessary to avoid repeated freezing and thawing of the samples and not to break the cold chain.
A comparative study performed by a research group has shown the stability of phycoerythrin from 2 species of seaweeds. It concluded that phycoerythrin from Porphyridium cruentum and Grateloupia turuturu was stable up to 40°C, in a pH range of 4–10 and could withstand up to 8 h exposure to a light intensity of ~34 μmol m−2 s−1 (Munier et al., 2014). Moreover, the sensitivity of these pigments is said to increase in dilute solutions. A study has reported the stability of phycoerythrin from Palmaria palmata up to 60°C and also within a pH range of 3.5–9.5 (Galland-Irmouli et al., 2000). In comparison, our extract also gave similar results and could be a strong contender for the food color market in the near future.
Conclusion
This study establishes an optimized protocol for the extraction of CPE for the food industry and also studies the stability of the crude pigment under different physiological conditions, such as pH, temperature and light exposure. Preliminary screening involving different buffers and extraction method suggested phosphate buffered system with repeated freeze thaw to be the ideal approach for a high yield of CPE with lesser contaminants. Further in the optimization process, 0.1 M phosphate buffer (pH 8) with 7 freeze thaw cycles was observed to be ideal for wholesome extraction of CPE. However, the number of freeze thaw cycles had a significant impact on its extraction due to the varying extents of cell breakage. More the number of cycles, more was the amount of total proteins extracted in to the buffer along with CPE. The crude extract was also studied with regards to stability whereby it was found that CPE extract is stable up to 40°C for 2 h and could endure prolonged storage at 4°C. It was also found stable within a pH range of 3–8. Although still in the preliminary stages, such a colorant would be immensely beneficial for the food industry.
Data Availability Statement
All datasets presented in this study are included in the article/Supplementary Material.
Author Contributions
TG was responsible for conducting the experiments, data collection and analysis and writing the manuscript. SM provided critical guidance during the study and manuscript preparation. All authors contributed to the article and approved the submitted version.
Funding
TG acknowledges the Council of Scientific and Industrial Research (CSIR), New Delhi for financial assistance in the form of senior research fellowship (SRF). SM acknowledges the Department of Science and Technology (DST) and the Council of Scientific and Industrial Research (CSIR), New Delhi for projects GAP 2006 and OLP 0084.
Conflict of Interest
The authors declare that the research was conducted in the absence of any commercial or financial relationships that could be construed as a potential conflict of interest.
Acknowledgments
This manuscript has been assigned CSIR—CSMCRI registration number 161/2015. The technical help and support from Mr. Pradeep Parmar, Senior Technical Officer, AESDCIF, CSMCRI Bhavnagar is gratefully acknowledged. TG would like to acknowledge AcSIR for Ph. D. registration.
Supplementary Material
The Supplementary Material for this article can be found online at: https://www.frontiersin.org/articles/10.3389/fsufs.2020.00102/full#supplementary-material
References
Anwer, K., Rahman, S., Sonani, R. R., Khan, F. I., Islam, A., Madamwar, D., et al. (2016). Probing pH sensitivity of αC-phycoerythrin and its natural truncant: a comparative study. Int. J. Biol. Macromol. 86, 18–27. doi: 10.1016/j.ijbiomac.2016.01.046
Arakawa, T., and Timasheff, S. N. (1982). Preferential interactions of proteins with salts in concentrated solutions. Biochemistry 21, 6545–6552. doi: 10.1021/bi00268a034
Bennett, A., and Bogorad, L. (1973). Complementary chromatic adaptation in a filamentous blue-green alga. J. Cell Biol. 58, 419–435. doi: 10.1083/jcb.58.2.419
Bláha, L., Babica, P., and Maršálek, B. (2009). Toxins produced in cyanobacterial water blooms–toxicity and risks. Interdiscip. Toxicol. 2, 36–41. doi: 10.2478/v10102-009-0006-2
Bradford, M. M. (1976). A rapid and sensitive method for the quantitation of microgram quantities of protein utilizing the principle of protein-dye binding. Anal. Biochem. 72, 248–254. doi: 10.1016/0003-2697(76)90527-3
Di Rienzo, J. A., Casanoves, F., Balzarini, M., Gonzalez, L., Tablada, M., and Robledo, C. W. (2011). InfoStat. Available online at: https://scholar.google.com/citations?user=yumGXjoAAAAJ&hl=en
Dufossé, L., Galaup, P., Yaron, A., Arad, S. M., Blanc, P., Chidambara Murthy, K. N., et al. (2005). Microorganisms and microalgae as sources of pigments for food use: a scientific oddity or an industrial reality? Trends Food Sci. Technol. 16, 389–406. doi: 10.1016/j.tifs.2005.02.006
Dumay, J., Clément, N., Morançais, M., and Fleurence, J. (2013). Optimization of hydrolysis conditions of Palmaria palmata to enhance R-phycoerythrin extraction. Bioresour. Technol. 131, 21–27. doi: 10.1016/j.biortech.2012.12.146
Galland-Irmouli, A. V., Pons, L., Luçon, M., Villaume, C., Mrabet, N. T., Guéant, J. L., et al. (2000). One-step purification of R-phycoerythrin from the red macroalga Palmaria palmata using preparative polyacrylamide gel electrophoresis. J. Chromatogr. B Biomed. Sci. Appl. 739, 117–123. doi: 10.1016/S0378-4347(99)00433-8
Ghosh, T., Bhayani, K., Paliwal, C., Maurya, R., Chokshi, K., Pancha, I., et al. (2016). Cyanobacterial pigments as natural anti-hyperglycemic agents: an in vitro study. Front. Mar. Sci. 3:146. doi: 10.3389/fmars.2016.00146
Ghosh, T., Chatterjee, S., Bhayani, K., and Mishra, S. (2020). A natural cyanobacterial protein C-phycoerythrin as an Hg2+ selective fluorescence probe in aqueous systems. New J. Chem. 44, 6601–6609. doi: 10.1039/D0NJ01059F
Ghosh, T., and Mishra, S. (2020). A natural cyanobacterial protein C-phycoerythrin as an HS– selective optical probe in aqueous systems. Spectrochim. Acta Part A Mol. Biomol. Spectrosc. 239, 118469–118477. doi: 10.1016/j.saa.2020.118469
Ghosh, T., Paliwal, C., Maurya, R., and Mishra, S. (2015). “Microalgal rainbow colours for nutraceutical and pharmaceutical applications,” in Plant Biology and Biotechnology: Vol. I: Plant Diversity, Organization, Function and Improvement, eds B. Bahadur, M. V. Rajam, L. Sahijram, and K. V. Krishnamurthy (New Delhi: Springer), 777–791.
Ghosh, T., Vyas, A., Bhayani, K., and Mishra, S. (2018). C-phycoerythrin as a colorimetric and fluorometric probe for the sensitive, selective and quantitative detection of Cu2+ in aqueous samples. J. Fluoresc. 28, 671–680. doi: 10.1007/s10895-018-2229-0
Gómez-Lojero, C., Pérez-Gómez, B., Prado-Flores, G., Krogmann, D. W., Cárabez-Trejo, A., and Peña-Diaz, A. (1997). The phycobilisomes of the cyanobacterium Arthrospira (Spirulina) maxima. Int. J. Biochem. Cell Biol. 29, 1191–1205. doi: 10.1016/S1357-2725(97)00043-5
Good, N. E., Winget, G. D., Winter, W., Connolly, T. N., Izawa, S., and Singh, R. M. M. (1966). Hydrogen ion buffers for biological research. Biochemistry 5, 467–477. doi: 10.1021/bi00866a011
Johnson, E. M., Kumar, K., and Das, D. (2014). Physicochemical parameters optimization, and purification of phycobiliproteins from the isolated Nostoc sp. Bioresour. Technol. 166, 541–547. doi: 10.1016/j.biortech.2014.05.097
Mishra, S. K., Shrivastav, A., and Mishra, S. (2011). Preparation of highly purified C-phycoerythrin from marine cyanobacterium Pseudanabaena sp. Protein Expr. Purif. 80, 234–238. doi: 10.1016/j.pep.2011.06.016
Mishra, S. K., Shrivastav, A., Pancha, I., Jain, D., and Mishra, S. (2010). Effect of preservatives for food grade C-phycoerythrin, isolated from marine cyanobacteria Pseudanabaena sp. Int. J. Biol. Macromol. 47, 597–602. doi: 10.1016/j.ijbiomac.2010.08.005
Mubarak Ali, D. (2013). Survey, Molecular Systematics and Nanobiotechnological Potentials of Marine Cyanobacteria and Diatom. Available online at: http://shodhganga.inflibnet.ac.in/handle/10603/9639 (accessed July 6, 2019).
Munier, M., Jubeau, S., Wijaya, A., Morançais, M., Dumay, J., Marchal, L., et al. (2014). Physicochemical factors affecting the stability of two pigments: R-phycoerythrin of Grateloupia turuturu and B-phycoerythrin of Porphyridium cruentum. Food Chem. 150, 400–407. doi: 10.1016/j.foodchem.2013.10.113
Parmar, A., Singh, N. K., Kaushal, A., and Madamwar, D. (2011). Characterization of an intact phycoerythrin and its cleaved 14 kDa functional subunit from marine cyanobacterium Phormidium sp. A27DM. Proc. Biochem. 46, 1793–1799. doi: 10.1016/j.procbio.2011.06.006
Patel, S. N., Sonani, R. R., Jakharia, K., Bhastana, B., Patel, H. M., Chaubey, M. G., et al. (2018). Antioxidant activity and associated structural attributes of Halomicronema phycoerythrin. Int. J. Biol. Macromol. 111, 359–369. doi: 10.1016/j.ijbiomac.2017.12.170
Peterson, R. B., Dolan, E., Calvert, H. E., and Ke, B. (1981). Energy transfer from phycobiliproteins to photosystem I in vegetative cells and heterocysts of Anabaena variabilis. Biochim. Biophys. Acta 634, 237–248. doi: 10.1016/0005-2728(81)90142-0
Reis, A., Mendes, A., Lobo-Fernandes, H., Empis, J. A., and Novais, J. M. (1998). Production, extraction and purification of phycobiliproteins from Nostoc sp. Bioresour. Technol. 66, 181–187. doi: 10.1016/S0960-8524(98)00064-9
Safi, C., Ursu, A. V., Laroche, C., Zebib, B., Merah, O., Pontalier, P.-Y., et al. (2014). Aqueous extraction of proteins from microalgae: effect of different cell disruption methods. Algal Res. 3, 61–65. doi: 10.1016/j.algal.2013.12.004
Santiago-Santos, M. C., Ponce-Noyola, T., Olvera-Ramirez, R., Ortega-López, J., and Cañizares-Villanueva, R. O. (2004). Extraction and purification of phycocyanin from Calothrix sp. Proc. Biochem. 39, 2047–2052. doi: 10.1016/j.procbio.2003.10.007
Sekar, S., and Chandramohan, M. (2007). Phycobiliproteins as a commodity: trends in applied research, patents and commercialization. J. Appl. Phycol. 20, 113–136. doi: 10.1007/s10811-007-9188-1
Senthilkumar, N., Kurinjimalar, C., Thangam, R., Suresh, V., Kavitha, G., Gunasekaran, P., et al. (2013a). Further studies and biological activities of macromolecular protein R-Phycoerythrin from Portieria hornemannii. Int. J. Biol. Macromol. 62, 107–116. doi: 10.1016/j.ijbiomac.2013.08.004
Senthilkumar, N., Suresh, V., Thangam, R., Kurinjimalar, C., Kavitha, G., Murugan, P., et al. (2013b). Isolation and characterization of macromolecular protein R-Phycoerythrin from Portieria hornemannii. Int. J. Biol. Macromol. 55, 150–160. doi: 10.1016/j.ijbiomac.2012.12.039
Sonani, R. R., Singh, N. K., Kumar, J., Thakar, D., and Madamwar, D. (2014). Concurrent purification and antioxidant activity of phycobiliproteins from Lyngbya sp. A09DM: an antioxidant and anti-aging potential of phycoerythrin in Caenorhabditis elegans. Proc. Biochem. 49, 1757–1766. doi: 10.1016/j.procbio.2014.06.022
Soni, B., Visavadiya, N. P., and Madamwar, D. (2008). Ameliorative action of cyanobacterial phycoerythrin on CCl4-induced toxicity in rats. Toxicology 248, 59–65. doi: 10.1016/j.tox.2008.03.008
Soni, B. R., Hasan, M. d. I., Parmar, A., Ethayathulla, A. S., Kumar, R. P., et al. (2010). Structure of the novel 14 kDa fragment of α-subunit of phycoerythrin from the starving cyanobacterium Phormidium tenue. J. Struct. Biol. 171, 247–255. doi: 10.1016/j.jsb.2010.05.008
Sun, L., Wang, S., Gong, X., Zhao, M., Fu, X., and Wang, L. (2009). Isolation, purification and characteristics of R-phycoerythrin from a marine macroalga Heterosiphonia japonica. Protein Expr. Purif. 64, 146–154. doi: 10.1016/j.pep.2008.09.013
Timasheff, S. N., and Arakawa, T. (1988). Mechanism of protein precipitation and stabilization by co-solvents. J. Cryst. Growth 90, 39–46. doi: 10.1016/0022-0248(88)90296-5
Keywords: cyanobacteria, extraction optimization, food color, phycoerythrin, stability
Citation: Ghosh T and Mishra S (2020) Studies on Extraction and Stability of C-Phycoerythrin From a Marine Cyanobacterium. Front. Sustain. Food Syst. 4:102. doi: 10.3389/fsufs.2020.00102
Received: 13 May 2020; Accepted: 11 June 2020;
Published: 21 July 2020.
Edited by:
Lourdes Morales-Oyervides, Universidad Autónoma de Coahuila, MexicoReviewed by:
Bilel Hadrich, National Engineering School of Sfax, TunisiaRoberto Benavente-Valdes, Universidad Autónoma de Coahuila, Mexico
Copyright © 2020 Ghosh and Mishra. This is an open-access article distributed under the terms of the Creative Commons Attribution License (CC BY). The use, distribution or reproduction in other forums is permitted, provided the original author(s) and the copyright owner(s) are credited and that the original publication in this journal is cited, in accordance with accepted academic practice. No use, distribution or reproduction is permitted which does not comply with these terms.
*Correspondence: Sandhya Mishra, c21pc2hyYSYjeDAwMDQwO2NzbWNyaS5yZXMuaW4=