- Department of Natural Resources and the Environment, University of New Hampshire, Durham, NH, United States
The combination of high spatial resolution and multi-date satellite imagery offers new opportunities for mapping and monitoring crop types of different agricultural field sizes. However, mapping of crop types at high spatial resolution requires high-quality crop type reference data typically collected from the ground-based surveys to create the maps and/or to assess the map accuracy. The availability of sufficient crop type reference data is limited over large geographic regions because of the time, effort, cost, and accessibility in different parts of the world. To generate large area crop type maps, any existing, but limited reference data must be spatially extended to other regions using appropriate and available non-ground-based sources. There is the potential to classify High Resolution Imagery (HRI) using a phenology-based approach as demonstrated in this paper to generate additional reference data within similar agriculture ecological zones (AEZs) based on the crop characteristics, their types, and their growing season. Therefore, the objective of this study was to evaluate if existing, limited crop type reference data could be extended using this approach. Multi-date, high spatial resolution satellite images were used to spatially extend the limited crop type reference data from one region [called the training region (TR)] to another region [called the test region (TE)] within the same AEZ using a phenology-based Decision Tree (DT) classifier for three different field sizes. The results demonstrate that this phenology-based classification approach can efficiently and effectively extend the limited crop type reference data to other regions in same AEZ for different field sizes.
Introduction
Food security is one of the major challenges that human beings are facing (Zhong et al., 2014). By 2050, the global population of 9.8 billion will demand 70% more food than is consumed today (Schwab et al., 2014). To meet this demand, cropland areas are increasing using current agriculture practices causing greenhouse gas (GHG) emissions and environmental degradation (Adams and Eswaran, 2000; Beach et al., 2008). The required knowledge to improve these current agriculture practices and model GHG variability in different agriculture systems demands the identification of different crop types (Ramankutty et al., 2008; Peña-Barragán et al., 2011; Gong et al., 2013). Therefore, acquiring crop type information over large geographic regions is extremely relevant for decision making and policy actions (Yang et al., 2011; Foerster et al., 2012).
Remote sensing technology provides reliable and cost-effective imagery and tools for crop type mapping over space and time, repeatedly, and consistently at various spectral, spatial and temporal resolutions (Ulabay et al., 1982; Congalton et al., 1998; Castillejo-González et al., 2009; Vinciková et al., 2010; Rodriguez-Galiano et al., 2012; Ustuner et al., 2014; Zhou et al., 2014; Htitiou et al., 2019). Satellite imagery such as that available from Landsat (Oetter et al., 2000), SPOT (Murakami et al., 2001), Indian Remote Sensing satellite data (Panigrahy and Sharma, 1997), ASTER (Peña-Barragán et al., 2011), and MODIS (Teluguntla et al., 2017) have been used to identify different crop types in the past.
With the development of high spatial resolution sensors such as RapidEye (2008), GeoEye-1 (2008), World View-2 (2009), and Sentinel-2 (2015), crop type identification has increased in accuracy and detail (De Wit and Clevers, 2004; Palchowdhuri et al., 2018). Multi-date, High-spatial Resolution Imagery (HRI) is being used to generate crop type maps of different regions around the world (e.g., Castillejo-González et al., 2009; Conrad et al., 2014; Gumma et al., 2016; Lebourgeois et al., 2017; Teluguntla et al., 2017). However, the potential of using single vs. multi-dates of imagery still needs further evaluation to generate effective crop type maps especially for different agriculture field sizes.
Crop type mapping at high spatial resolution requires high-quality crop type reference data typically collected from ground-based surveys as input to create the maps and/or as an independent data set to assess the map accuracy. A well-distributed, consistent, and sufficient amount of crop type reference data over large areas substantially reduces the mapping cost and improves the accuracy of the crop type maps. However, the availability of sufficient crop type reference data from ground-based methods is typically severely limited over large geographic regions because of the time, effort, cost, and accessibility in most parts of the world (South et al., 2004). Therefore, whatever limited reference data that does exist must be spatially extended by using non-ground-based sources in order to effectively generate and/or assess large area crop type maps.
A possible non-ground-based source that could be used to extend the limited crop type reference data to every region is through the classification of HRI. Previously, classification of HRI has been used to extend the crop type information to multiple years (Zhong et al., 2014). The potential exists to use such a classification approach to extend the limited crop type reference data within a single year to other similar regions (Botkin et al., 1984). This extension method could save labor, cost, and time by substituting for traditional field surveys typically required to collect the crop type reference data over large regions (Tatsumi et al., 2015).
Regional intra-class variation exists in a single agriculture crop type due to farmer's decisions to plant crops at different dates in different regions (Wardlow et al., 2007). These variations remain consistent within similar agriculture ecological zones (AEZs) and field size landscapes (e.g., large, medium, and small) due to similar agriculture and ecological conditions (Serra and Pons, 2008; Simonneaux et al., 2008). Therefore, the limited crop type reference data has the potential to be effectively extended by identifying the crop types in similar regions based on their spectral characteristics at specific growing stage/time (i.e., phenology).
The identification of different agriculture crops based on their spectral characteristics is usually performed by classifying multi-date HRI (Castillejo-González et al., 2009; Yang et al., 2011; Conrad et al., 2014; Lebourgeois et al., 2017). Recently, the classification of HRI using conventional pixel-based classification methodology has been replaced with an Object-Based Image Analysis (OBIA) approach to develop more accurate crop type maps (Castillejo-González et al., 2009; Belgiu and Csillik, 2018). OBIA includes the classification of objects into different crop types based on their spectral, spatial, and texture features using different phenology-based classifier approaches such as a Rule-Based Classifier (RBC), Decision Tree (DT) (Peña-Barragán et al., 2011), Random Forest (RF) (Tatsumi et al., 2015; Belgiu and Csillik, 2018), and/or Support Vector Machine (SVM) (Peña et al., 2014; Neetu Ray, 2019). However, the three approaches (e.g., DT, RBC, and RF) that are increasingly used for the classification of remote sensing data (Berhane et al., 2018). The DT method is an efficient inductive machine learning technique (Kuhn and Johnson, 2013). The non-parametric decision tree classifier is robust to nonlinear interactions between variables and capable of handling the regional intra-class variation of a single agriculture crop type that exists at multiple places. Decision tree classifier is simple in understanding, visualizing, and interpreting (Neetu Ray, 2019). The RBC approach creates a series of “if-then” rules to effectively classify landscapes, and can similarly couple different types of data in the process (Hansen et al., 1996; Friedl and Brodley, 1997). This approach is similar to the DT approach, but generally has fewer rules and contains contextual information within the ruleset, hence it is simpler to understand than the complex bifurcating DTs. The spatial context and association information can be easily integrated into the RBC constructs an ensemble of decision trees which is capable of generalizing the data more effectively than decision tree classifier. The RF approach is a relatively novel classification technique based on ensemble machine learning and has been increasingly used as a classifier. The RF approach can be used for both classifications and regressions, as well as determining variable importance (Belgiu and Dragut, 2016). The random forest algorithm has the potential to incorporate multiple spectral and texture variables to discriminate different crop types and improve the classification performance (Lawrence et al., 2006; Oliveira et al., 2012; Pelletier et al., 2016). Therefore, these phenology-based classifiers (e.g., RBC, RF, and, DT) could be used as effective algorithms to create crop/no-crop and crop type maps from multi-dates of satellite imagery and identify the agriculture crops over similar regions.
A well-distributed and consistent crop type reference data set must be collected either from ground-based or non-ground-based sources to create and/or assess crop type maps. The basic pre-requisites for collecting crop type reference data that must be carefully considered include: (1) the classification scheme and (2) the sampling strategy (Congalton, 1991). A mutually exclusive and totally exhaustive classification scheme is necessary to define and, if necessary, translate (or cross-walk) the reference crop type labels to classify the HRI and generate the extended crop type reference data. The choice of an appropriate sampling strategy is needed to collect sufficient and efficient reference data for the classification and assessment of the crop type maps (Congalton, 1991; Congalton and Green, 2009, 2019). A stratified random sample combined with a sufficient number of samples for each class has been effectively used by Yadav and Congalton (2018) to perform an assessment of crop extent maps with varying map class proportions. This stratified sampling approach with sufficient samples in each map class is appropriate to generate a valid crop type reference data set in order to conduct an effective accuracy assessment of crop type maps of both the dominant and rare agriculture crop types.
The evaluation of the extension of crop type reference data methods proposed in this study was conducted in the United States (US) where high-quality crop type reference data [e.g., Cropland Data Layer (CDL)] already exists (Yadav, 2019). This existing reference data (CDL) provided an effective comparison with the reference data generated in this study. Without such a ready source for comparison, this study would not have been possible. After testing these methods and comparing their results with the CDL reference data in the US, this approach can be effectively employed in the future to generate consistent and large area crop type reference data for rest of the world where existing crop type reference data are limited. Therefore, the objectives of this study are to spatially extend the crop type reference data from TRaining (TR) to TEst (TE) regions based on the investigation of one, two, and three dates of high spatial resolution imagery (HRI) and to assess the results of this extension approach using the CDL reference data of the US.
Materials and Methods
This section provides a description of the materials and methods used to extend the crop type reference data using classification of multi-dates of HRI, respectively. It consists of the following sub-sections: (1) study area and the cropping schedule of different crop types, (2) datasets, and (3) methodology.
Study Area and the Cropping Schedule of Different Crop Types
The study areas used in this research includes three pairs (i.e., total six) of ~6 km by 6 km regions selected randomly within three different AEZs (AEZ 6, 10, and 11) and agriculture field sizes (large, medium, and small) (Figure 1) in the United States (US). The AEZs were defined based on the length of the agricultural crop growing period days using the GAEZ (Global Agro-Ecological Zones) layer (Fischer et al., 2012). The length of AEZ 6, 10, and 11 are 120–149, 240–269, and 270–299 growing period days, respectively. Likewise, the agriculture field sizes were derived from the IIASA (International Institute for Applied System Analysis) field size layer by grouping the field sizes from 10-40 ha into three classes: (1) large (35–40 ha), (2) medium (22–35 ha), and (3) small (10–22 ha) (Fritz et al., 2015). Each study area pair includes a region used for TRaining (TR) and the other to TEst (TE).
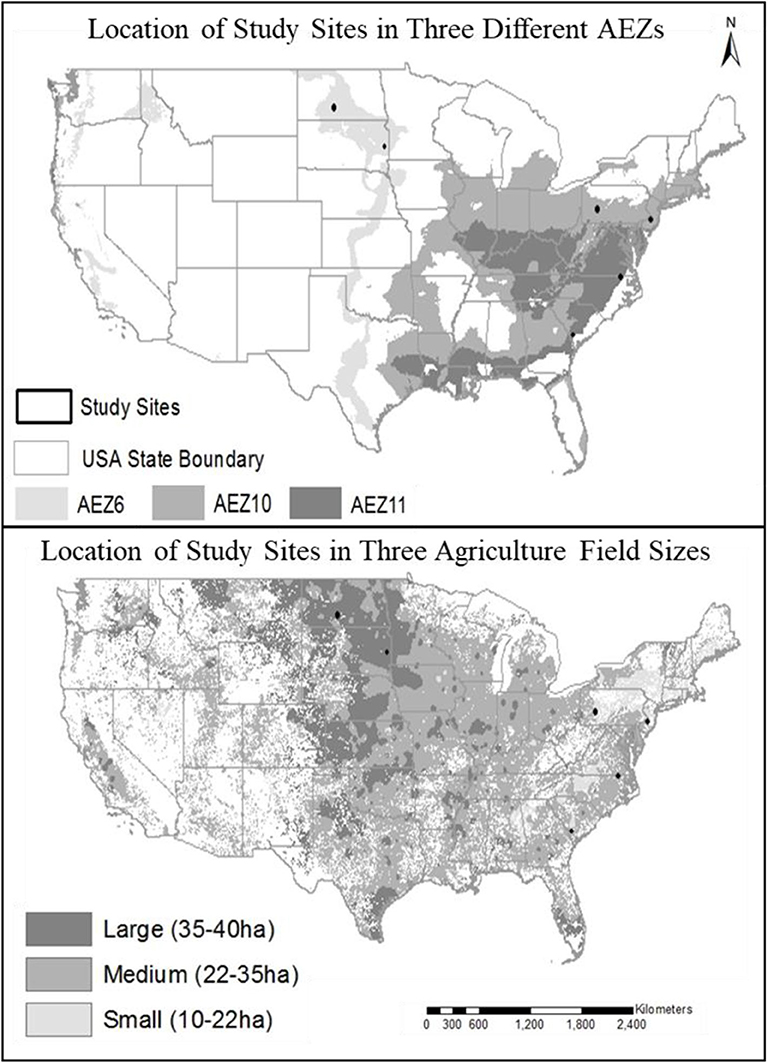
Figure 1. The location of three pairs of TRaining (TR) and TEst (TE) regions selected each in three AEZs and three agriculture field sizes.
Figure 1 shows the location of the three pairs of TR and TE regions (total six regions); one pair in each separate AEZ (e.g., AEZ 6, 10, and 11) and for one of the three field sizes (e.g., small, medium, and large). The pairs of large, medium, and small field size TR and TE regions are located in North Dakota/South Dakota, North Carolina/South Carolina, and New Jersey/Pennsylvania in the US, respectively.
Different agriculture crops with specific seasonality or cropping schedule are grown in the selected study regions. The cropping schedule of different crop types was derived by grouping the growing months into early (e), mid (m), and late (l) stages for the spring (sp), summer (su), fall (f), and winter (w) seasons based on their planting and harvesting events (USDA, 2010). First, the cropping schedule of agriculture crops of the TR and TE regions was used to analyze their growing pattern within the same ecological and field sizes. Second, it was also used to select the first, second, and third image date for the classification of crop types for each of the six selected regions. The first image date was selected according to the cropping calendar of dominant crops with maximum spectral variation and subsequently combined with the second and third image dates for the identification of different crop types. Careful consideration of these constraints: seasonality, cropping schedule, harvesting, growing period days, etc. is critical to this study. Random selection of study areas for training and testing was done within a specific AES which controlled these constraints.
Datasets
Three different datasets were used to perform the extension and evaluation of the results. The first dataset was the World View-2 (WV-2) satellite imagery which was selected with <10% cloud cover, same field size (i.e., large, medium, and small), and same ecological region for the year 2015 (Figure 2). The World View-2 satellite imagery has eight multi-spectral bands [i.e., coastal-blue, blue, green, yellow, red, red-edge, Near Infra-Red (NIR) 1, and NIR 2] at a spatial resolution of 0.6 m. The multi-spectral bands along with the derived following nine vegetation indices were used for the classification of agriculture crops of the six regions: (1) Difference Vegetation Index (DVI) (ERDAS, 2015), (2) Green Normalized Difference Vegetation Index (GNDVI) (Gitelson and Merzlyak, 1996), (3) Improved Modified Chlorophyll Absorption Ratio Index (MCARI) (Daughtry, 2000), (4) Modified Soil Adjusted Vegetation Index (MSAVI) (Erdas Imagine, 2015) (5) Modified Red Edge Simple Ratio Index (MSR) (Chen, 1996), (6) Normalized Difference Vegetation Index (NDVI) (Rouse et al., 1973), (7) Soil and Atmospherically Resistant Vegetation Index (SARVI) (Kaufman and Tanre, 1992), (8) Soil Adjusted Vegetation Index (SAVI) (Panda et al., 2010), and (9) Enhanced Vegetation Index (EVI) (Huete et al., 1997).
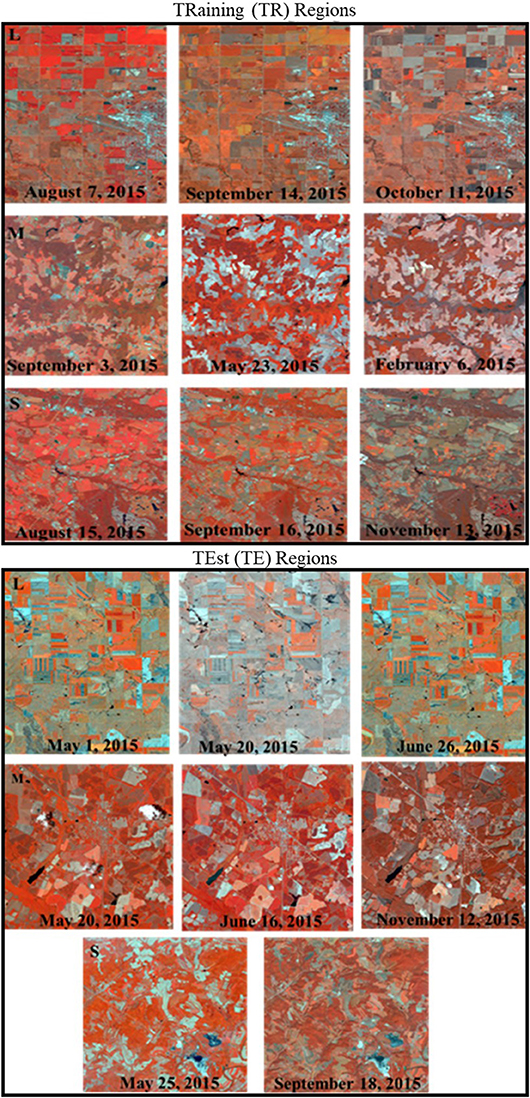
Figure 2. The World View-2 images used to investigate the use of multi-dates of imagery for extending the crop type reference data from the TRaining (TR) to TEst (TE) regions in large (L), medium (M), and small (S) field sizes.
The second dataset was the Cropland Data Layer (CDL) (USDA, NASS) which was used for comparison (i.e., as the reference data) to evaluate the results achieved by the extension approach developed in this study. Without these data for comparison, this study would have been far more difficult to conduct. CDL is generated annually for all the states at 30 m spatial resolution beginning in 2009 (USDA-NASS USDA, 2010) using Landsat imagery and ground-based information. Therefore, CDL could be used to assess the extended crop type maps (2015) for the six TR and TE regions. The CDL dataset was also used to provide information about the major crop types of each TR and TE study region. It was observed that corn and soybean were mostly growing in the large field size TR and small field size TR and TE regions in the season from April/May to November/December. In addition to corn, wheat and alfalfa were the dominant crops of the large field size TE region growing from April to September. The agriculture crops such as corn, soybean, and cotton were the dominant crops of medium field size TR and TE regions growing from April to December.
A common hierarchical classification scheme was used to cross-walk or translate the CDL labels into map labels for the image classification and reference data generation. This classification scheme consists of three hierarchical levels. The first classification level labeled the imagery as crop, fallow, or no-crop. The first level classes were re-grouped at the second level into two classes: cropland which included fallow and no-crop. At the third level, the cropland class was classified into different crop types (e.g., corn, wheat, cotton, etc.) for each of the six regions.
Methodology
The objective of extending the limited crop type reference data was accomplished using two main methods. First, the extension of the crop type reference data was performed from the TR to the TE region using an object-based image analysis (OBIA) of multiple dates of HRI to classify first as crop /no-crop, and then into agriculture crop types for the six regions. Second, an accuracy assessment was performed to evaluate the extension approach by comparing the phenology approach classification results to the CDL data used as correct in this study. The following flow chart shows the overall methodology that was followed to spatially extend the CDL 2015 crop type reference data of the TR regions to TE regions within the same AEZ and field by investigating the use of one, two, and three dates of satellite imagery (Figure 3).
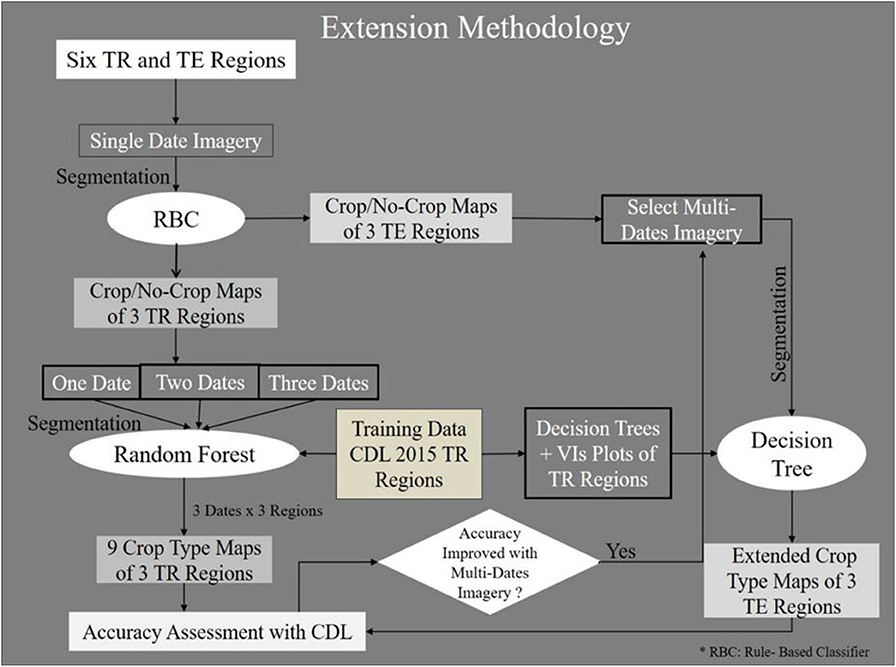
Figure 3. The overall methodology flow chart showing the extension of the limited crop type reference data for the six regions.
Extension of Crop Type Reference Data From the TR Regions to the TE Regions
To extend the available, limited crop type reference data using satellite image classification of the TR to the TE regions, first the benefits of using one, two, or three dates of satellite imagery were investigated. Multiple dates of satellite imagery for each of the six regions (3 TR and 3 TE regions) were created by mosaicking nine 2 km by 2 km World View-2 scenes for each region. Consequently, a single region was comprised of nine World View-2 scenes, two dates had 18 scenes, and three dates had 27 scenes. The first image date tested was selected using the cropping calendar for the major crop types to take maximum advantage of where high spectral variation might exist between the crop, fallow, and no-crop fields (Figure 2). This first image date was subsequently combined with a second and third date of imagery selected using the cropping calendar to further separate different crop types to produce crop type maps for the three TR regions for each of the three field sizes. The crop type maps of the three TE regions were then generated based on the results of this TR analysis using the best multiple dates of satellite imagery.
The extension of crop type reference data from the TR regions to TE regions was conducted using the following five steps:
First, the crop/no-crop maps of the six regions were produced using the hierarchical classification scheme (described in the section Datasets) and an Object-Based Image Analysis (OBIA) of the first date of satellite imagery. The imagery of each region was segmented into homogeneous groups of pixels (i.e., objects) based on the spectral, spatial, and texture characteristics using the Multi-Resolution Segmentation (MRS) method in the Trimble eCognition 9.3 software. The segmentation was performed by defining the scale, color, and shape parameters using a bottom-up merging approach. Scales of 100, 70, and 60 were used for large, medium, and small agriculture field sizes, respectively which provided an appropriate segmentation of the field boundaries. The color and shape parameters were defined as 0.5 and 0.3, respectively, for the three different field sizes, providing more weight to the spectral features of the objects while merging them into homogeneous groups. The segmentation parameters were selected iteratively to achieve an appropriate/accurate overlay of the homogeneous segmented polygons over the agriculture field boundaries for the large, medium, and small field size TR and TE regions. The homogeneous objects were then classified into crop (cropland and fallow) and no-crop using the Rule-Based Classifier (RBC) based on their mean spectral response and texture values for each of the six regions.
Second, the crop types of the three TR regions were classified into crop classes according to the hierarchical classification scheme. The crop type classification was performed using the Random Forest (RF) classification algorithm for one, two, and three dates of satellite imagery using both the original imagery as well as the Vegetation Indices (VIs) described in the section Datasets. A total of 50 samples per map class (crop type) were collected from the 2015 CDL of the TR regions for training the RF algorithm and assessing the crop type maps (Olofsson et al., 2014). These samples were divided into independent training and assessment samples based on a 40–60% split rule. A stratified random sample with 20 training samples for each crop type class was used in the RF classifier to create the crop type maps leaving 30 independent samples for each crop type to perform the accuracy assessment.
Third, the results of the multi-date image analysis of the TR regions, as described above, was used to select the best imagery for each of the three TE regions. The same training samples used in the RF classification algorithm for the TR regions were used for training the DT algorithm and creating the crop type maps of the TE regions. However, since the training samples of the TR regions are spatially located on the TR imagery, the actual training sample locations could not be directly used for the TE regions. Instead, the statistics derived from the 20 training samples for each class of the three TR regions were used to derive unique spectral and texture thresholds for the different crop types and applied to a decision tree (DT) algorithm to classify the TE regions. The RF algorithm could not be used to classify the TE regions as this, and many other algorithms, require spatially locating training areas on the imagery. However, a DT algorithm could be and was used with the training statistics acquired for the TE regions.
Fourth, the thresholds of spectral and texture characteristics (i.e., training statistics for the TE regions) were derived for the different crop types using the combination of the following two steps: (1) Decision Tree (DT) modeling on the TR regions and (2) plotting the relationship of vegetation indices for different crop types of the TR regions. The DT modeling created models from the pool of all the spectral and texture features acquired from each TR region using the recursive partitioning platform in the statistical software JMP 8 (SAS Institute Inc., Cary, NC, USA). This binary recursive algorithm splits the training data for each of the three TR regions and builds Decision Trees (DTs) by choosing the features and corresponding values that best fit the partial response in every split. The algorithm examined a very large number of possible splits and determined the most significant ones using the largest likelihood-ratio chi-square (χ2) statistic. A cross-validation method was applied to define and evaluate each of the models in which samples were randomly separated into 40% for model training and 60% for model validation. This procedure was repeated ten times to generate results using random combinations of training and validation sets (Friedl and Brodley, 1997). The best DTs were chosen for each of the three TR regions by selecting the optimal model which provided the smallest error rate when run on the independent dataset (Mingers, 1989). In addition, the relationship between the Vegetation Indices (VIs) (e.g., NDVI, MSR, DVI, GNDVI, MCARI, SARVI, and EVI) were also plotted to determine the most useful and important indices. Consequently, the best DTs and plots of VIs were used to determine the threshold values of spectral and texture characteristics for the different crop types.
Finally, the threshold values of spectral and texture characteristics derived from the training samples of the TR regions were used in the DT classification algorithm to produce the crop type maps for the three TE regions. The crop type maps of the TE regions were assessed using 30 assessment samples for each crop type collected from 2015 CDL of the TE regions.
Accuracy Assessment
The results of the extension of the crop type reference data for the six regions were evaluated individually by comparison with the CDL reference data in the form of error matrices. The CDL reference data for the assessment were always collected independently of the training data. The reference dataset consists of 30 samples collected from the 2015 CDL data for each crop type to assess the crop type maps of the three TR and three TE regions. In addition to the crop type maps, the crop/no-crop maps of the three TR and three TE regions were also assessed using the reference dataset collected from the 2015 CDL data. The crop/no-crop reference dataset consists of the crop samples which were subsequently derived by combining the crop type samples used in the assessment of crop type maps while the no-crop samples were collected proportional to their area for each of the TR and TE regions.
Finally, the CDL data were used to assess the crop/no-crop maps, and the crop type maps of the three TR and three TE regions in the form of object-based error matrices presenting the accuracy measures (i.e., overall, user's, and producer's accuracy).
Results
The results of this study are presented in the following two sub-sections: (1) the extension of crop type reference data from the TR regions to the TE regions, and (2) the assessment of the reference data using error matrices generated for the crop/no-crop and crop type maps of the six regions.
Extension of Crop Type Reference Data From the TR Regions to TE Regions Based on the Investigation of One, Two, and Three Dates of Imagery for the TR Regions
The crop/no-crop maps of the six regions (3 TR and 3 TE regions) were first generated from the classification of the most appropriate World View-2 satellite imagery using a rule-based classifier and an object-based image analysis. Figure 4 presents the crop/no-crop maps of 3 TR and 3 TE regions for the large, medium, and small field sizes.
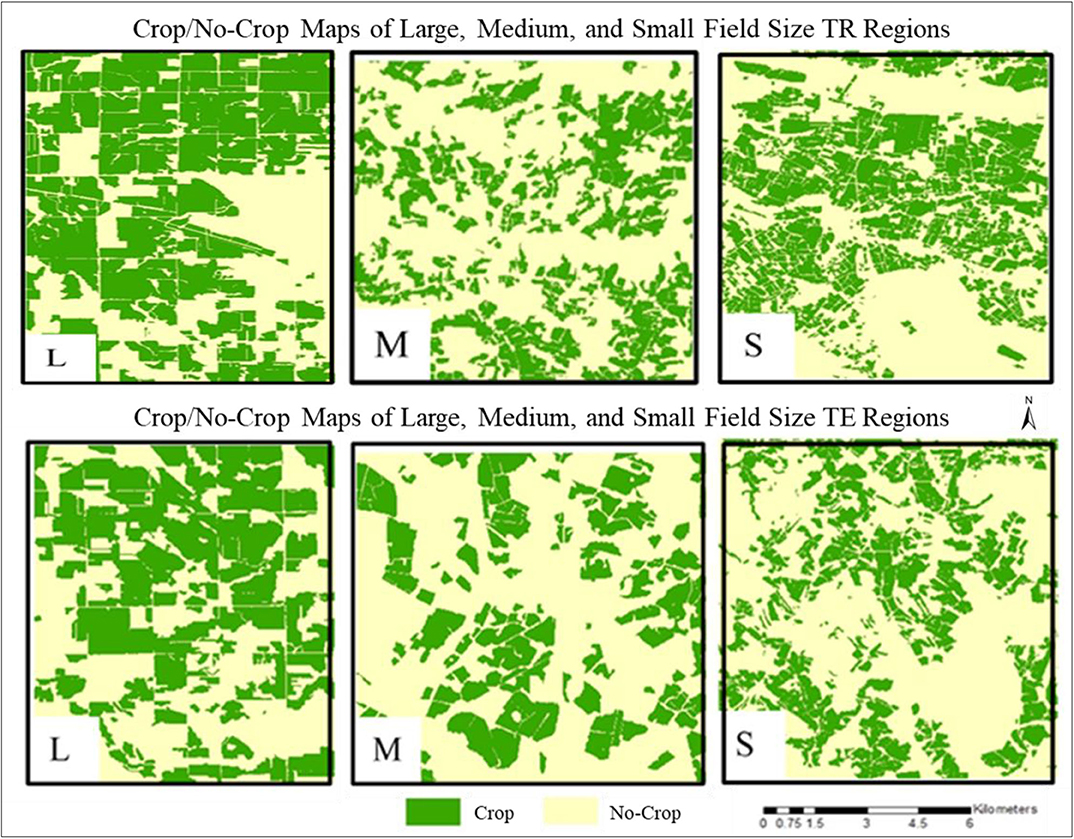
Figure 4. The crop/no-crop maps of the three TR and three TE regions in large (L), medium (M), and small (S) field sizes.
The crop/no-crop maps of the six regions were subsequently classified into the crop types using the phenology-based classification algorithm and training data collected from the 2015 CDL of the TR regions. The crop type maps for the TR regions were produced from the investigation of one, two, and three dates of satellite imagery and training data from the CDL of these regions. However, the crop type maps of the TE regions were developed from the multi-dates of satellite imagery and training data derived from the TR regions using a Decision Trees (DT) approach since the goal was to extend the classification into similar regions without collecting training data in those regions.
Figure 5 presents the Decision Trees (DTs) that were used to derive the thresholds of the spectral and textural features for different crop types in the TR regions using the hierarchical recursive partitioning algorithm in JMP software. Figure 6 present the plots of the Vegetation Indices (VI's) for the different agriculture crops for the three TR regions, respectively.
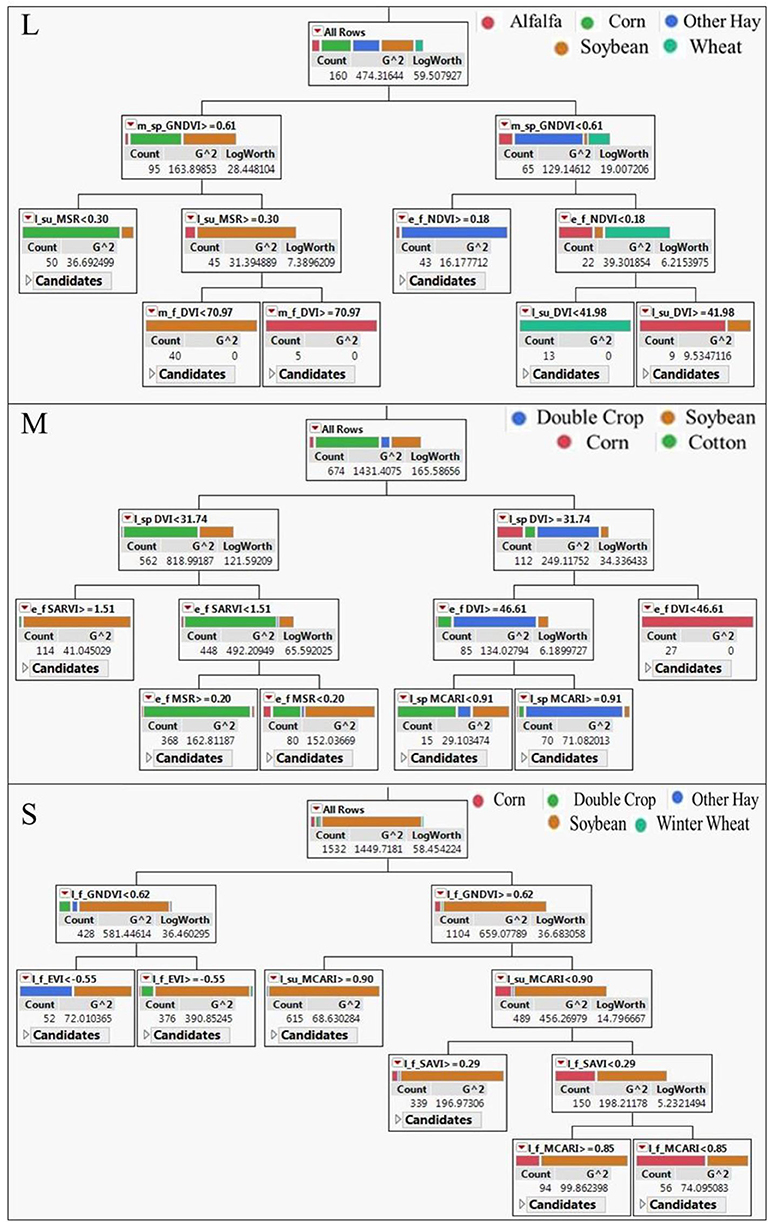
Figure 5. The Decision Trees (DTs) built from the CDL 2015 reference data of the three TR regions for large (L), medium (M), and small (S) field sizes.
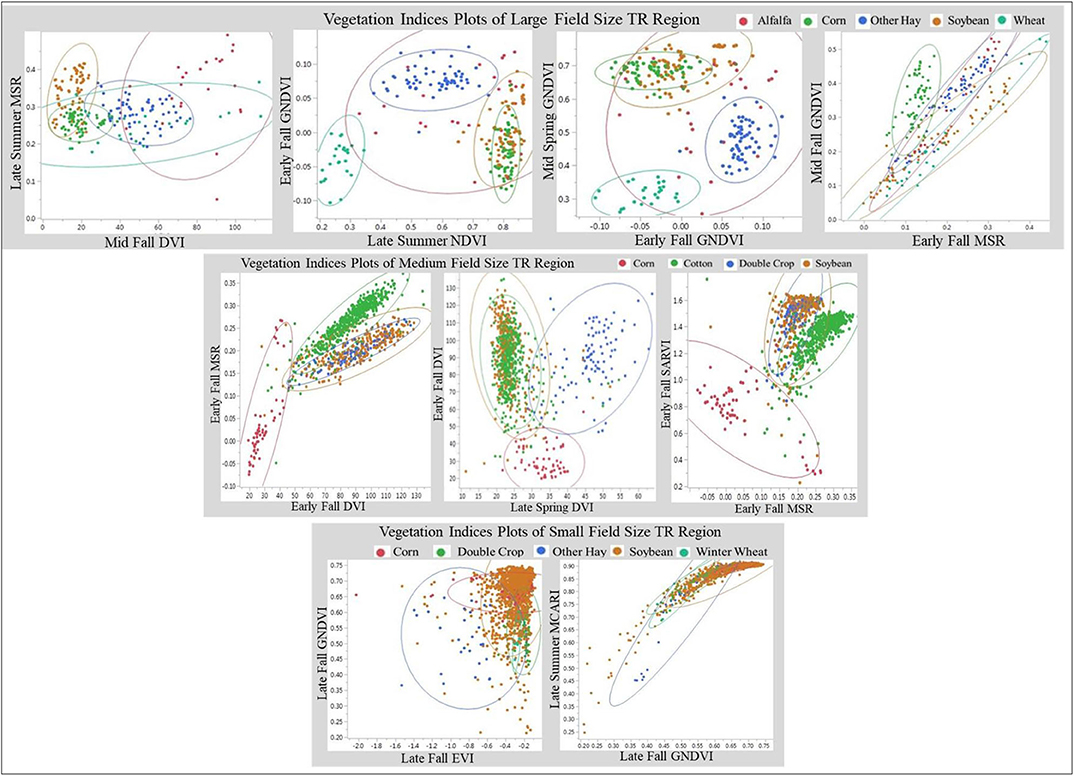
Figure 6. The relationship between vegetation indices of different seasons for large, medium, and small agriculture field size TR regions.
A total of 20 samples for each map class were collected for training the classification algorithm to create the crop type maps of the TR and, by extension, the training statistics used in the TE regions. Table 1 summarizes the training data collected from the 2015 CDL and their derived statistics of the TR regions to classify the crop types of the six regions for each of the field sizes and AEZs.
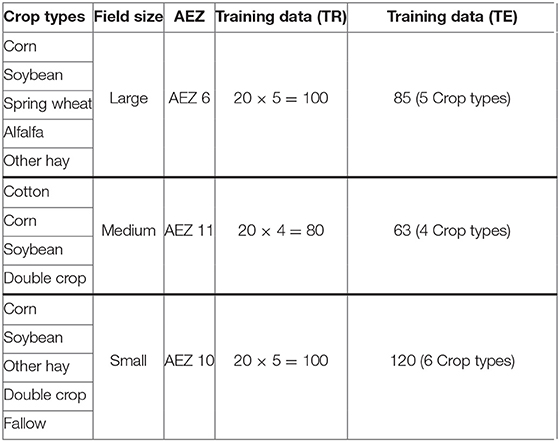
Table 1. The training data collected from the 2015 CDL of the TR regions to classify the crop type maps of the TR and TE regions.
The crop type maps of the six regions were produced using the training data described in Table 1. Figure 7 presents the three sets of crop type maps each for the three TR regions in the large, medium, and small field sizes classified using one, two, and three dates of imagery, respectively. Figure 8 presents the crop type maps for the three TE regions developed from the classification of multi-dates of satellite imagery using the DT algorithm and training samples derived from the DT and VIs of the TR regions.
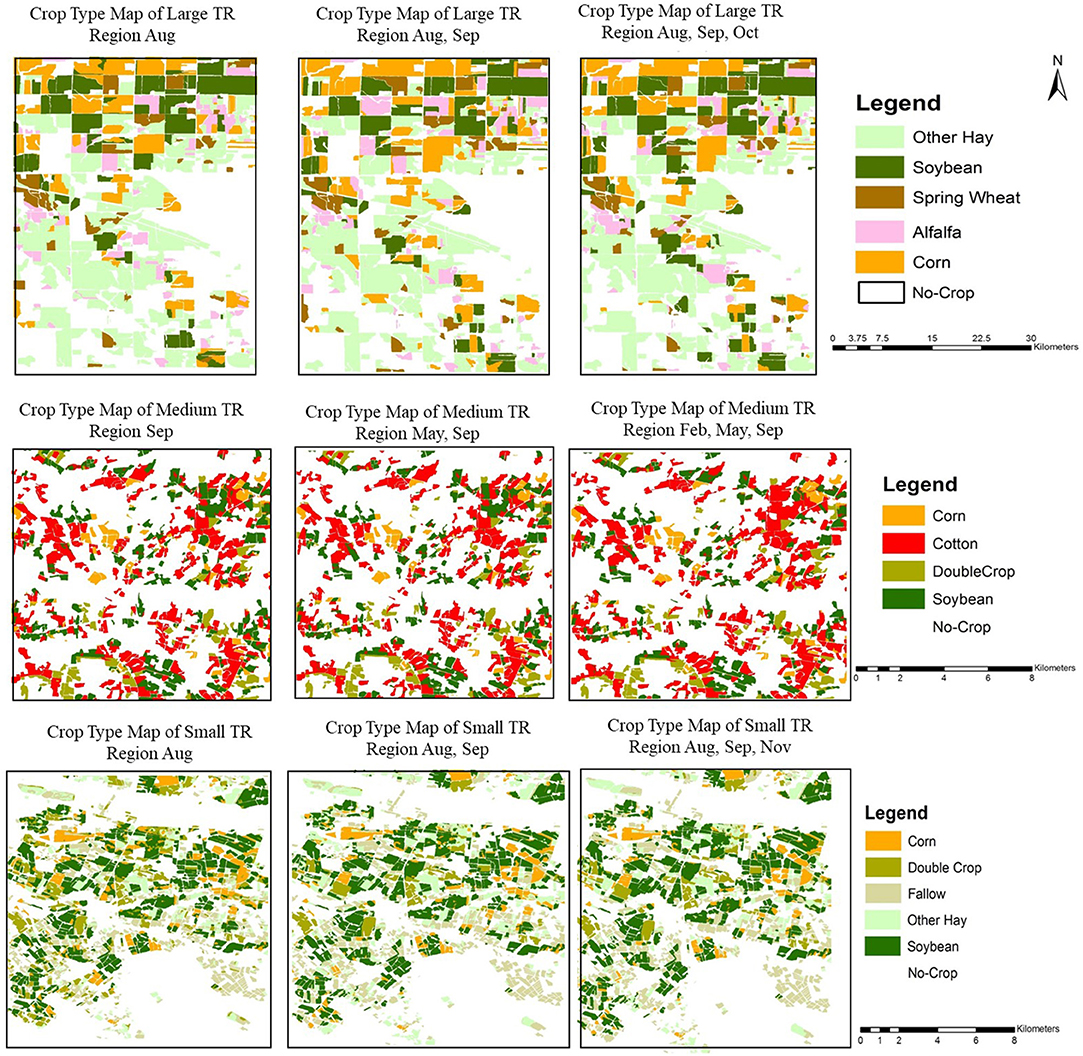
Figure 7. Crop type maps of three TR regions produced from one, two, and three dates of satellite imagery in the large, medium, and small field sizes.
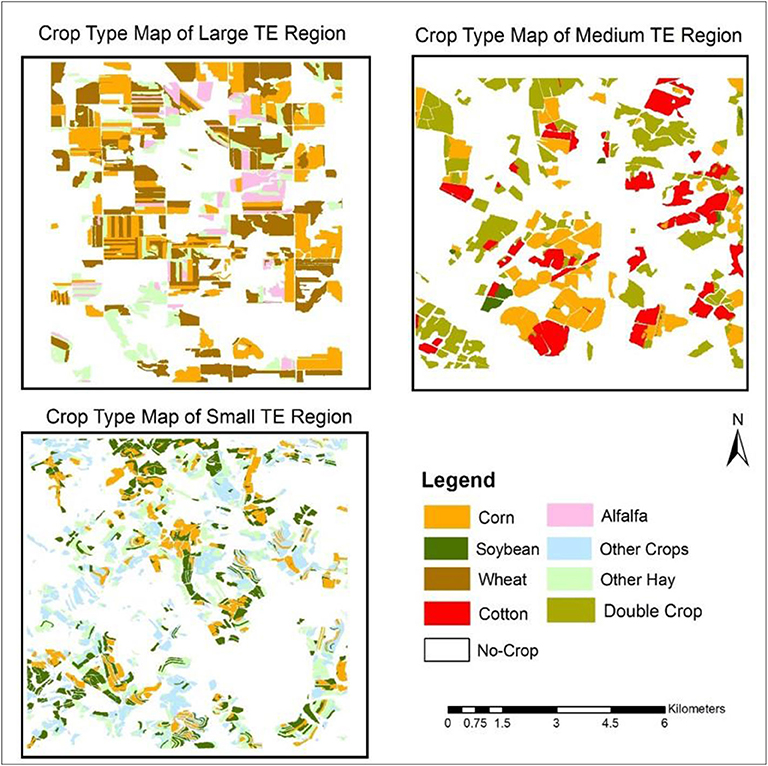
Figure 8. The crop type maps of the three TE regions produced from the classification of multi-dates of satellite imagery in large, medium, and small field sizes.
Accuracy Assessment
The results of the accuracy assessment include the reference data collected to assess the crop/no-crop and crop type maps of the six regions and the accuracy measures generated for the crop/no-crop and crop type maps of the six regions. Table 2 presents the assessment reference data collected from the CDL of the US to assess the crop/no-crop, and crop type maps of the six regions.
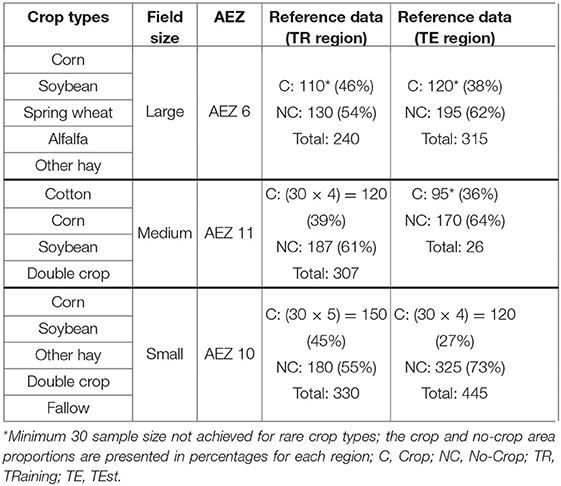
Table 2. The reference data used to assess the crop/no-crop and crop type maps of the three TR and three TE regions.
The accuracy assessment was performed to assess both the crop/no-crop and the crop type maps of the six regions through the use of error matrices and calculations of the overall, user's, and producer's accuracies for the large, medium, and small field sizes. Table 3 presents the error matrices of the crop/no-crop maps of the TR and TE regions for large, medium, and small field sizes. The overall accuracy of the crop/no-crop maps of the three TR regions in the large, medium, and small field sizes are 89.6, 91.9, and 94.2%, respectively. The overall accuracy of the crop/no-crop map of the three TE regions in the large, medium, and small field sizes are 97.8, 96.2, and 97.9%, respectively. Table 4 presents the overall accuracy of 73.8, 90.2, and 83.3%, respectively for the crop type maps of the three TR regions developed from one, two, and three dates of satellite imagery.
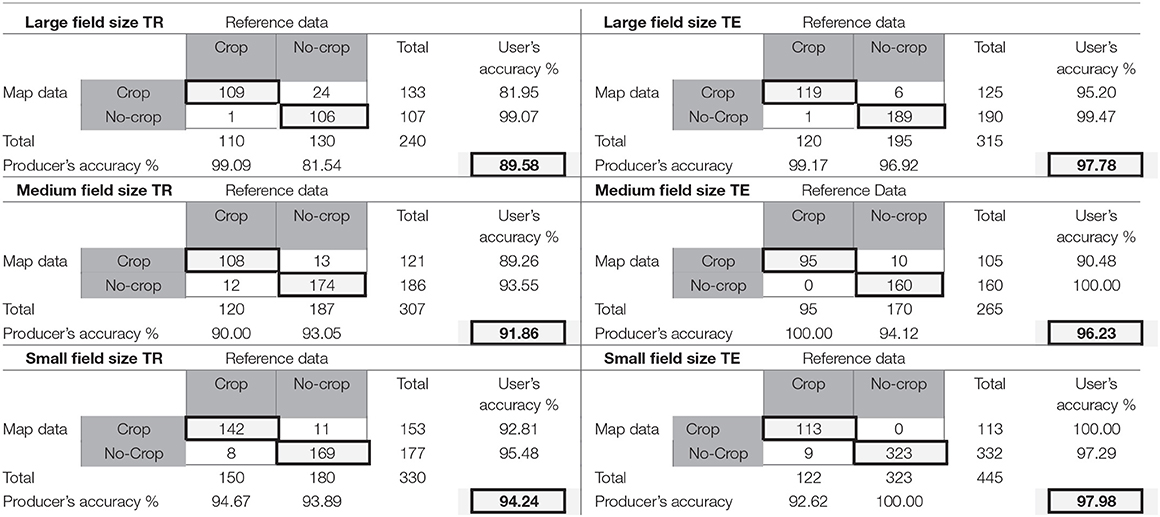
Table 3. The error matrices of the crop / no-crop maps of TR and TE regions for the large, medium, and small field sizes.

Table 4. The overall accuracy of the crop type maps of the three TR regions developed from one, two, and three dates of satellite imagery.
Table 5 presents the evaluation of the crop type maps of the three TE regions developed from the extended 2015 CDL reference data of the TR regions and multi-dates of satellite imagery in large, medium, and small field sizes, respectively. The overall accuracy of the extended crop type maps for large, medium, and small fields sizes are 93.7, 93.2, and 84.5%, respectively.
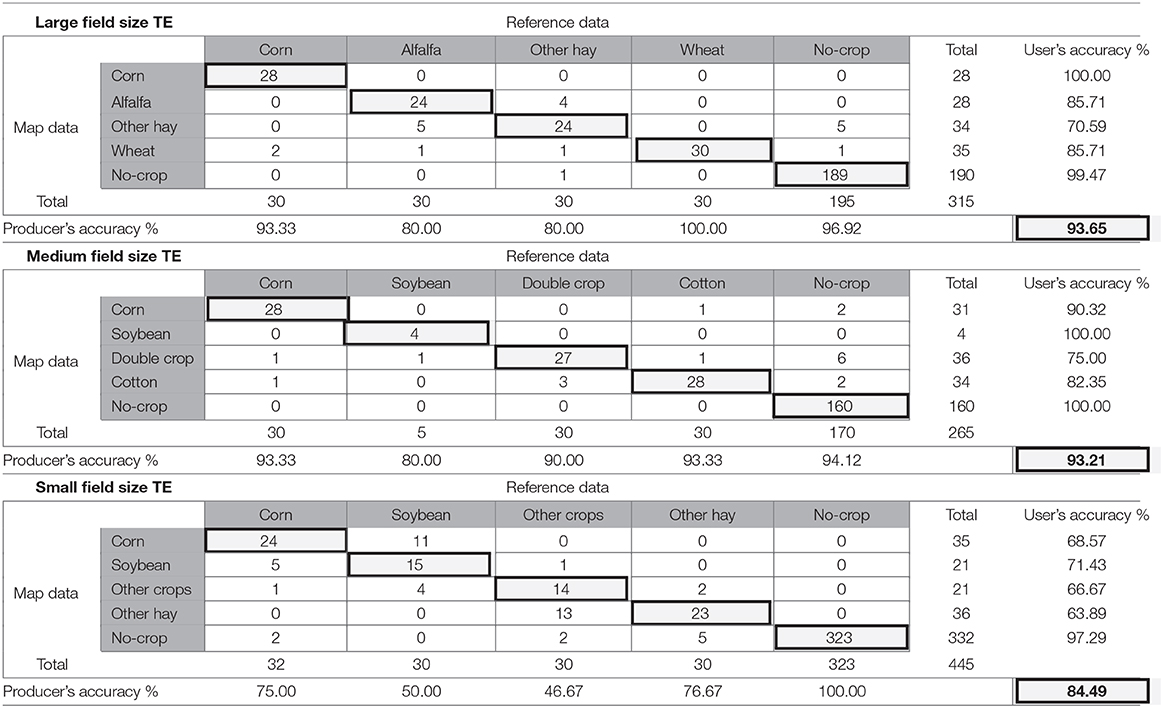
Table 5. The error matrices of crop type maps generated from multi-dates of World View-2 imagery for the large, medium, and small agriculture field sizes TE regions.
Discussion
The goal of this research was to evaluate our ability to extend existing, but limited reference data used for assessing thematic map accuracy. The limited crop type reference data was extended using multi-date satellite imagery and a phonology-based classification approach. The classification of multi-date satellite imagery requires sufficient reference data to create and/or assess the crop type maps for large geographic regions. To generate/extend accurate crop type maps and sufficient reference data, the potential of a multi-date satellite imagery, phenology-based, classification must be explored, and evaluated for different field sizes.
Identification of Crops to Investigate the Benefits of Multi-Dates of Imagery for the Extension of Crop Type Reference Data
The crop/no-crop maps of the six regions were developed from the most appropriate, single date imagery using a spectral and textural rule-based classification algorithm (Figure 4). Using these crop/no-crop maps, the crop type maps were subsequently developed by evaluating one, two, and three dates of imagery using the random forest (RF) classifier because of its robustness to the spectral variations of similar crop types (Figure 7). The non-parametric RF approach was effectively used over DT because of its robustness to normal distribution departures for determining important variables to classify all the WV-2 multi-spectral bands along with nine indices, spatial context, and texture information. Figure 7 presents nine crop type maps generated from the single, two, and three date satellite imagery for each of the three TR regions with different field sizes. The crop type maps developed from one, two, and three dates of imagery demonstrate the benefits of using more than one date satellite imagery for crop type mapping by providing more spectral variations for the growing season of different crop types and therefore, increased accuracy. Figure 9 shows multiple dates of satellite imagery and the crop type map developed from a combination of three dates of imagery for a medium field size TR region. The first single date of imagery acquired in September provides unique spectral characteristics for discriminating different types of crops including both harvested and standing crops (e.g., corn and soybean) (Figure 9). However, the additional dates of satellite imagery acquired in May and February provide more spectral and textural variations among the crop types (e.g., cotton and double crop). Consequently, the crop type map developed from the three dates of satellite imagery clearly shows the benefits of using multi dates of imagery for effective crop type mapping in different field size regions.
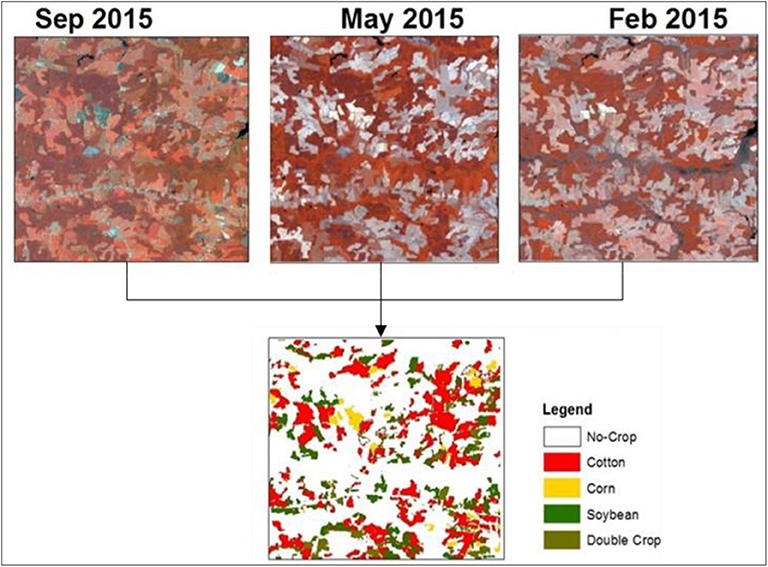
Figure 9. The crop type map developed from the multi dates of World View-2 imagery showing the unique spectral characteristics for the different crop types of the medium field size TR region.
In addition to providing additional spectral characteristics for mapping different crop types of a region, the multiple dates of satellite imagery help to identify the discrepancies and errors (e.g., omission or commission) that existed in crop type reference data. For example, the satellite imagery acquired in the month of November for the small fields size TR region shows unique spectral characteristics as dark red patches in the right lower corner (Figure 10). The agriculture fields with unique spectral characteristics were expected to be some seasonal crop (e.g., cranberry growing in the month of November) and labeled as fallow land on the CDL reference data of the year 2015 (Figure 10). Comparing the CDL reference data of the year 2014 and 2017 showed that these fields were labeled as cranberry. Therefore, the crop type mapping using multi-date satellite imagery acquired in August, September, and November were effective for identifying the omission errors in the reference data that existed due to limited field surveys conducted in different parts of the US.
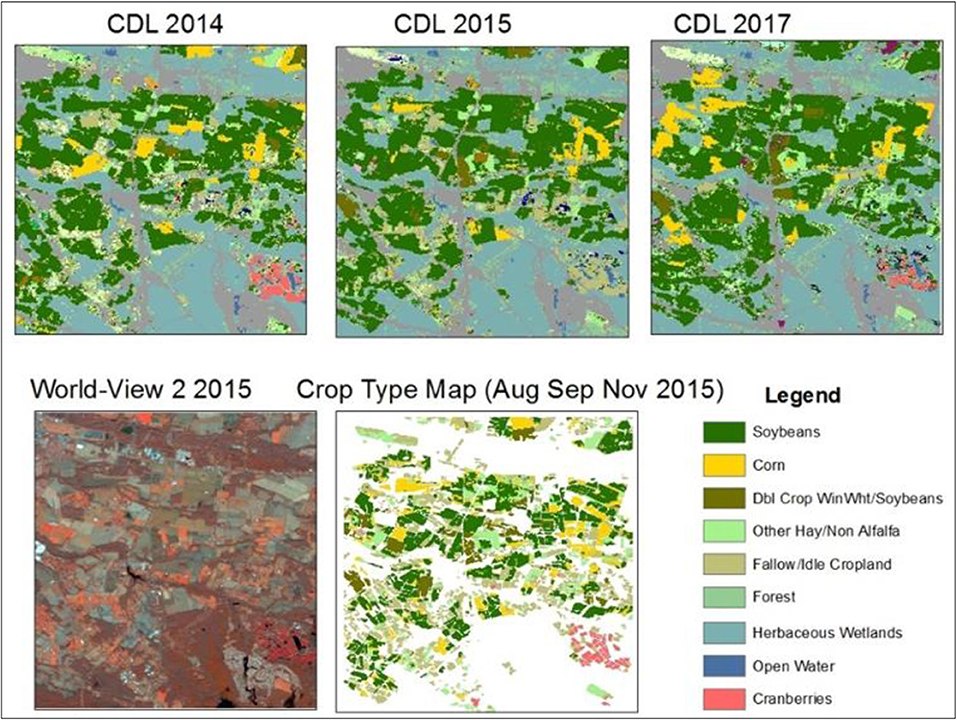
Figure 10. The comparison of CDL reference data of the small field size TR region with the satellite imagery.
The use of three dates of satellite imagery demonstrated advantages over the single and two dates to perform effective crop type mapping for each of the field sizes for the TR regions due to: (1) spectral and textural variations and (2) capability to identify the errors that existed in the reference data (Ehrlich et al., 1994; Panigrahy and Sharma, 1997; Simonneaux et al., 2008). Based on this multi-date analysis in the TR regions, the best three dates of satellite imagery were selected to perform the classification of crop types for two (large and medium field size) of the TE regions. Unfortunately, the small field size TE region had only two viable dates of imagery and therefore, only those dates were used for the small field TE region analysis.
The extension of limited crop type reference data involves the identification of crop types for collecting additional reference data from the classification of the best multi-dates of HRI for the TE regions. The identification of crop types becomes complex due to their diverse spectral characteristics in different regions. The decision trees (Figure 5) and the relationship of vegetation indices (VI's) (Figure 6) derived from each of the TR regions were used to identify the crop types for each of the large, medium, and small field sizes in the TE regions. For the TE regions, DT classifier approach was used instead of RF because it is insensitive to noisy relationships between spectral band values and class labels. It makes no assumption regarding normality of input variables (i.e., spectral, spatial, or contextual) and accommodate the threshold values of each tree node that branches further to create a terminal node representing a class label (i.e., crop type).
The crop types of the large field size TR region (Alfalfa, Corn, Other Hay, Soybean, and Wheat) were discriminated by means of a sequence of four VIs (NDVI, DVI, MSR, and GNDVI) (Figure 6). Soybean was characterized by high green vegetation vigor in late summer and low in mid fall. Other Hay was characterized by high vegetation vigor in the late summer and early fall. Wheat was characterized by low vegetation vigor in early fall. Corn was characterized by high vegetation in mid spring. The positive slope in MSR and GNDVI distribution in Alfalfa can be interpreted as increase in the vegetation vigor in early and mid-fall. No texture feature offered a consistent solution for the discrimination between the crops, but several VIs based on NIR bands were useful in the identification of crops. The mid-spring and early fall were selected for this initial step to classify the wheat, other hay, and corn crops in the TE scenes of the large agriculture field sizes (Figure 6).
The crop types of the medium field size TR region (Corn, Cotton, Soybean, and Double Crop) were discriminated by means of a sequence of three VIs (DVI, MSR, and SARVI) (Figure 6). In early fall, the positive slope in DVI and MSR distribution in corn can be interpreted as an increase in the vegetation vigor. A negative slope in MSR and SARVI distribution can be interpreted as decrease in vegetation. Corn was characterized by low vegetation vigor in late spring and early fall. However, in all the acquired scenes, the corn was characterized by low vegetation vigor. Double crop including soybean and winter wheat was characterized by a positive slope in DVI distribution showing an increase in the vegetation vigor in late spring and early fall. Soybean was characterized by high vegetation vigor in early fall and a negative slope in DVI distribution was identified as a decrease from early fall to late spring. Cotton was characterized by high vegetation vigor in DVI, MSR, and SARVI distribution in early fall.
The crop types of the small field size TR region (Corn, Other Hay, Soybean, Winter Wheat, and Double Crop) were discriminated by means of a sequence of three VIs (DVI, MSR, and EVI) (Figure 6). Corn was characterized by high green vegetation vigor in the distribution of GNDVI and EVI in late fall. Other Hay was identified in the zone enclosed by GNDVI values greater than 0.3 in the late fall. Soybean was characterized by high vegetation vigor in GNDVI, EVI, and MCARI distribution in late summer and late fall. The positive slope in GNDVI distribution in soybean can be interpreted as an increase in the vegetation vigor in late fall. No texture feature offered a consistent solution for the discrimination between the crop types, but several VIs based on NIR bands were useful for the indentation of crops.
Potential Benefits of Classification With Multi-Dates of Satellite Imagery and Extension of Crop Type Reference Data From the TR to TE Regions
The evaluation and assessment of the extension approach for collecting additional crop type reference data tested in the US are crucial to the effective application for the rest of the world in the future. Accuracy assessment was performed separately to evaluate the benefits of using multi-dates of satellite imagery and extension. The benefits of using multi-dates of satellite imagery were established by assessing the crop type maps of the TR region developed from one, two, and three dates of satellite imagery in the form of error matrices presenting the overall, producer's, and user's accuracy. Table 4 clearly demonstrates that higher overall accuracy of the crop type maps results developed from multi-date satellite imagery for the large (73.8%), medium (90.2%), and small (83.3%) field size regions than for using only one or two image dates. The benefits of using multiple dates of satellite imagery resulted in more spectral and texture features for the discrimination of the different crop types.
One would expect that the accuracy of the large field area would have the highest accuracy since it is easier to correctly label crop types that occur in large, homogeneous areas. Our results, however, show that the maps generated from three dates of imagery in medium field size regions are more accurate than large and small field sizes. The reasons for these contrary results are as follows: First, each study site was randomly selected from the AEZ. As a result, some study sites were spatially more homogeneous than others resulting in a simpler and therefore, better classification. Looking at the random study site selected for the large field size (Figure 2) shows that this area has an inclusion of urban or developed classes on the right part of the image. Some of these areas are then easily confused with the fallow class causing a lowering of the accuracy as shown in Table 4. It is this variability in the non-cropland classes that reduced the accuracy of this area. Presence of an artifact such as this urban/developed area does not occur in the small or medium field size areas and therefore, their classifications were simpler and their accuracies higher. Second, in the medium field size region, forest and agriculture are the dominant land cover classes (as seen in Figure 2) whose objects were easily discriminated based on the texture features. There was no inclusion of an urban/developed class to cause spectral confusion. Thirdly, the presence of fallow land in the small field size region created spectral confusion in the classification of the agriculture crops and achieved lower accuracy as compared to the medium field size region. Therefore, it is observed that the accuracy results of crop type classification using multi-date satellite imagery depends not only on the size of the agriculture fields, but also depends on the discrimination between cropland and non-cropland, dominance, and choice of different agriculture crop types, and date of the imagery used in the classification process. However, it is key to remember here that this test was meant only to show that multiple dates of imagery improve the classification accuracy. This result proves true for all field sizes. Finally, it is very important to note that the error matrices shown in Table 5 for the test study sites do conform to the pattern that is expected where the large field size area has the highest accuracy. Careful examination of Figure 2 shows that the urban/developed artifact that caused a reduction in accuracy reported in Table 4 is not present in the randomly selected image used for the large field size test area.
The extension approach of collecting additional crop type reference data was evaluated by the assessment of crop type maps of three TE regions (see Figure 8) developed from multi-dates of satellite imagery and the training crop type reference data extended from three TR regions representing each field size. These maps were assessed using the reference data collected from the CDL map of the year 2015 (Table 2). The error matrices generated for the crop type maps of the TE region in Table 5 shows that: (1) the crop type reference data of more common agriculture crops was extended with high quality and reliability for all three field sizes, (2) rare crop types were spatially extended with high accuracy (80–90%) in the large and medium field sizes, and (3) the extended crop type reference data has lower accuracy (60–70%) and reliability in the small field sizes as compared to the large and medium field sizes for the same crops. The extension approach derives statistical spectral information of different agriculture crops for training the crop type classification at another location of limited reference data. The statistical training data might not be good as ground collected data; the extension approach will help to supplement the limited crop type reference data to a great extent. The statistical information of agriculture crops can be modified according to any expected or observed natural change and human activities. For the selected study regions within a specific AEZ, we carefully considered the constraints including the cropping schedule of a specific agriculture crop, the ecology, and the field size. Failure to consider these constraints would render the method ineffective. However, this project has shown that, if carefully evaluated, imagery from one region can be used to extend the reference data to surrounding similar area within the same AEZ (constraints). It is also critical to evaluate the replicability of this approach in other parts of the world. Therefore, while implementing the proposed extension approach, the cropping pattern of different regions needs to be analyzed with respect to climate and human activities. Finally, however, our approach has demonstrated that if the constraints are evaluated adequately, the limited reference data can be effectively and efficiently extended using a phenology-based classification approach to similar areas.
Conclusions
In this research, we have presented an innovative approach to extend the crop type reference data within similar regions representing different agriculture field sizes in the US where high-quality crop type reference data (e.g., CDL) already exists. The results demonstrate that the phenology-based classification approach can efficiently extend the limited crop type reference data to every region within the same AEZ and for different field sizes. The most attractive feature of this extension approach is that it reduces the need to collect additional field reference data at multiple locations, greatly lowering the cost and time involved in the mapping of crop types for large areas. This approach is especially important for the regions where reference data are often too scarce to routinely apply the supervised classification methods to effectively map different agriculture crops. Variables related to phenology and spectral features at specific phenological stages were utilized as measurements that reflect the nature of crop types and remain stable over time and space within similar ecological conditions and cropping patterns. Therefore, a phenology-based, robust classification algorithm was developed to identify the crop types based on the prior knowledge on their cropping calendar and spectral properties. Resultant crop type maps demonstrated the potential and capability of extending limited crop type reference data using phenology-based algorithms for discriminating agriculture crops at multiple places in similar regions.
The success of this initial application in the United States using the non-ground-based sources of crop type information is encouraging, given the potential of extending the algorithm to other crop types and other remotely sensed data. To identify more crop types in other areas, expert knowledge on local agricultural practices, crop growth modeling, and crop spectral monitoring and simulation (Jacquemoud et al., 2009) are the main factors to consider when defining classification rules. For regions with variable crop types growing throughout the year, the extended automated approach may improve the classification of all the available crop types from a single year by incorporating images from multiple dates. Because the automated algorithm is not image-specific, it is scalable to utilize these datasets with minimal revisions. We are confident that the phenology-based classification approach has great potential as a methodology for generating additional crop type reference data for creating and assessing the crop type maps.
Data Availability Statement
All datasets generated for this study are included in the article/supplementary material.
Author Contributions
RC and KY conceived the idea for this paper. The collection of reference data and classification of crop type maps was done by KY. Tables and figures that resulted from the extension approach were generated by KY along with the first draft of the writing. The final paper was edited by RC and KY. The final edits were compiled by KY who converted the paper to the final format for this journal. All authors contributed to the article and approved the submitted version.
Funding
The research was funded by NASA MEaSUREs (Making Earth System Data Records for Use in Research Environments). The United States Geological Survey (USGS) provided supplemental funding as well as numerous other direct and indirect support through its Land Change Science (LCS), Land Remote Sensing (LRS) programs, and Climate and Land Use Change Mission Area. The NASA MEaSUREs project Grant No. NNH13AV82I, the USGS Sales Order number: 29039. Partial funding was provided by the New Hampshire Agricultural Experiment Station. This is Scientific Contribution Number 2728. This work was supported by the USDA National Institute of Food and Agriculture McIntire Stennis Project #NH00077-M (Accession #1002519).
Conflict of Interest
The authors declare that the research was conducted in the absence of any commercial or financial relationships that could be construed as a potential conflict of interest.
Acknowledgments
The authors would like to thank the entire GFSAD30 NASA MEaSUREs team under the direction of Dr. Prasad Thenkabail. We are especially grateful to Dr. James C. Tilton, an engineer at NASA GSFC, who helped in providing High Resolution imagery (HRI) of the selected study regions from the National Geospatial Intelligence Agency and Digital Globe as a part of the NASA MEaSUREs project. A partial version of this manuscript is available as part of Dr. Yadav's doctoral dissertation (cited in this paper) as per the author's university policies. This dissertation is available through open access in the Scholar's Repository at the University of New Hampshire.
References
Adams, C. R., and Eswaran, H. (2000). “Global land resources in the context of food and environmental security,” in Advances in Land Resources Management for the 20th Century, Soil Conservation Society of India, ed S. P. Gawande (New Delhi), 655.
Beach, R. H., DeAngelo, B. J., Rose, S., Li, C., Salas, W., and Del Grosso, S. J. (2008). Mitigation potential and costs for global agricultural greenhouse gas emissions. Agric. Econ. 38, 109–115. doi: 10.1111/j.1574-0862.2008.00286.x
Belgiu, M., and Csillik, O. (2018). Sentinel-2 cropland mapping using pixel-based and object-based time-weighted dynamic time warping analysis. Remote Sens. Environ. 204, 509–523. doi: 10.1016/j.rse.2017.10.005
Belgiu, M., and Dragut, L. (2016). Random forest in remote sensing: a review of applications and future directions. ISPRS J. Photogramm. Remote Sens. 114, 24–31. doi: 10.1016/j.isprsjprs.2016.01.011
Berhane, T. M., Lane, C. R., Wu, Q., Autrey, B. C., Anenkhonov, O. A., Chepinoga, V. V., et al. (2018). Decision-tree, rule-based, and random forest classification of high-resolution multispectral imagery for wetland mapping and inventory. Remote Sens. 10:580. doi: 10.3390/rs10040580
Botkin, D. B., Estes, J. E., MacDonald, R. M., and Wilson, M. V. (1984). Studying the earth's vegetation from space. Bioscience 34, 508–514. doi: 10.2307/1309693
Castillejo-González, I. L., López-Granados, F., García-Ferrer, A., Peña-Barragán, J. M., Jurado-Expósito, M., and de la Orden, M. S. (2009). Object- and pixel-based analysis for mapping crops and their agro-environmental associated measures using quickbird imagery. Comput. Electron. Agric. 68, 207–215. doi: 10.1016/j.compag.2009.06.004
Chen, J. M. (1996). Evaluation of vegetation indices and a modified simple ratio for boreal applications. Can. J. Remote Sens. 22, 229–242. doi: 10.4095/218303
Congalton, R. G. (1991). A review of assessing the accuracy of classifications of remotely sensed data. Remote Sens. Environ. 37, 35–46. doi: 10.1016/0034-4257(91)90048-B
Congalton, R. G., Balogh, M., Bell, C., Green, K., Milliken, J. A., and Ottman, R. (1998). Mapping and monitoring agricultural crops and other land cover in the lower colorado river basin. Photogramm. Eng. Remote Sensing. 64, 1107–1113.
Congalton, R. G., and Green, K. (2009). Assessing the Accuracy of Remotely Sensed Data-Principles and Practices, 2nd Edn. Boca Raton, FL: CRC Press.
Congalton, R. G., and Green, K. (2019). Assessing the Accuracy of Remotely Sensed Data: Principles and Practices, 3rd Edn. Boca Raton, FL: CRC Press.
Conrad, C., Dech, S., Dubovyk, O., Fritsch, S., Klein, D., Löw, F., et al. (2014). Derivation of temporal windows for accurate crop discrimination in heterogeneous croplands of Uzbekistan using multi temporal rapideye images. Comput. Electron. Agric. 103, 63–74. doi: 10.1016/j.compag.2014.02.003
Daughtry, C. (2000). Estimating corn leaf chlorophyll concentration from leaf and canopy reflectance. Remote Sens. Environ. 74, 229–239. doi: 10.1016/S0034-4257(00)00113-9
De Wit, A. J. W., and Clevers, J. G. P. W. (2004). Efficiency and accuracy of per-field classification for operational crop mapping. Int. J. Remote Sens. 25, 4091–4112. doi: 10.1080/01431160310001619580
Ehrlich, D., Estes, J. E., Scepan, J., and McGwire, K. C. (1994). Crop area monitoring within an advanced agricultural information system. Geocarto Int. 9, 31–42. doi: 10.1080/10106049409354468
Fischer, G., Nachtergaele, F. O., Prieler, S., Teixeira, E., Toth, G., van Velthuizen, H., et al. (2012). Global Agro-Ecological Zones (GAEZ): Model Documentation, Food and Agriculture Organization (FAO). Rome: International Institute for Applied Systems Analysis (IIASA).
Foerster, S., Kaden, K., Foerster, M., and Itzerott, S. (2012). Crop type mapping using spectral-temporal profiles and phenological information. Comput. Electron. Agric. 89, 30–40. doi: 10.1016/j.compag.2012.07.015
Friedl, M. A., and Brodley, C. E. (1997). Decision tree classification of land cover from remotely sensed data. Remote Sens. Environ. 61, 399–409. doi: 10.1016/S0034-4257(97)00049-7
Fritz, S., See, L., McCallum, I., You, L., Bun, A., Moltchanova, E., et al. (2015). Mapping global cropland and field size. Glob. Change Biol. 21, 1980–1992. doi: 10.1111/gcb.12838
Gitelson, A., and Merzlyak, M. N. (1996). Signature analysis of leaf reflectance spectra: algorithm development for remote sensing of chlorophyll. J. Plant Physiol. 148, 494–500. doi: 10.1016/S0176-1617(96)80284-7
Gong, P., Wang, J., Yu, L., Zhao, Y., Zhao, Y., Liang, L., et al. (2013). Finer resolution observation and monitoring of global land cover: first mapping results with landsat TM and ETM+ data. Int. J. Remote Sens. 34, 2607–2654. doi: 10.1080/01431161.2012.748992
Gumma, M. K., Thenkabail, P. S., Teluguntla, P., Rao, M. N., Mohammed, I. A., and Whitbread, A. M. (2016). Mapping rice-fallow cropland areas for short-season grain legumes intensification in South Asia using MODIS 250 m time-series data. Int. J. Digit. Earth 9, 981–1003. doi: 10.1080/17538947.2016.1168489
Hansen, M., Dubayah, R., and DeFries, R. (1996). Classification trees: an alternative to traditional land cover classifiers. Int. J. Remote Sens. 17, 1075–1081. doi: 10.1080/01431169608949069
Htitiou, A., Boudhar, A., Lebrini, Y., Hadria, R., Lionboui, H., Elmansouri, L., et al. (2019). The performance of random forest classification based on phenological metrics derived from sentinel-2 and landsat 8 to map crop cover in an irrigated semi-arid region. Remote Sens. Earth Syst. Sci. 2, 208–224. doi: 10.1007/s41976-019-00023-9
Huete, A. R., Liu, H. Q., Batchily, K. J., and van W. L. (1997). A comparison of vegetation indices over a Global set of TM images for EO -MODIS. Remote Sens. Environ. 59, 440–451. doi: 10.1016/S0034-4257(96)00112-5
Jacquemoud, S., Verhoef, W., Baret, F., Bacour, C., Zarco-Tejada, P. J., Asner, G. P., et al. (2009). PROSPECT + SAIL models: a review of use for vegetation characterization. Remote Sens. Environ. 113, S56–66. doi: 10.1016/j.rse.2008.01.026
Kaufman, Y., and Tanre, D. (1992). Atmospherically resistant vegetation index (ARVI) for EOS-MODIS. Geosci. Remote Sens. 30, 261–270. doi: 10.1109/36.134076
Kuhn, M., and Johnson, K. (2013). “Classification trees and rule-based models,” in Applied Predictive Modeling (New York, NY: Springer), 369–413. doi: 10.1007/978-1-4614-6849-3_14
Lawrence, R. L., Wood, S. D., and Sheley, R. L. (2006). Mapping invasive plants using hyperspectral imagery and breiman cutler classifications (random Forest). Remote Sens. Environ. 100, 356–362. doi: 10.1016/j.rse.2005.10.014
Lebourgeois, V., Dupuy, S., Vintrou, E., Ameline, M., Butler, S., and Bégué, A. (2017). A combined random forest and OBIA classification scheme for mapping smallholder agriculture at different nomenclature levels using multisource data (simulated sentinel-2 time series, VHRS and DEM). Remote Sens. 9:259. doi: 10.3390/rs9030259
Mingers, J. (1989). An empirical comparison of selection measures for decision tree induction. Mach. Learn. 3, 319–342. doi: 10.1007/BF00116837
Murakami, T., Ogawa, S., Ishitsuka, N., Kumagai, K., and Saito, G. (2001). Crop discrimination with multitemporal SPOT/HRV data in the Saga Plains, Japan. Int. J. Remote Sens. 22, 1335–1348. doi: 10.1080/01431160151144378
Neetu and Ray S. S. (2019). “Exploring machine learning classification algorithms for crop classification using sentinel 2 data,” in Int. Arch. Photogramm. Remote Sens. Spatial Inf. Sci. (Balkema: CRC Press), 573–578. doi: 10.5194/isprs-archives-XLII-3-W6-573-2019
Oetter, D. R., Cohen, W. B., Berterretche, M., Maiersperger, T. K., and Kennedy, R. E. (2000). Land cover mapping in an agricultural setting using multi seasonal thematic mapper data. Remote Sens. Environ. 76, 139–155. doi: 10.1016/S0034-4257(00)00202-9
Oliveira, J. C., Formaggio, A. R., Epiphanio, J. C. N., and Luiz, A. J. B. (2012). Index for the evaluation of segmentation (IAVAS): an application to agriculture mapping science. Remote Sens. 40, 155–169. doi: 10.2747/0749-3878.40.3.155
Olofsson, P., Foody, G. M., Herold, M., Stehman, S. V., Woodcock, C. E., and Wulder, M. A. (2014). Good practices for estimating area and assessing accuracy of land change. Remote Sens. Environ. 148, 42–57. doi: 10.1016/j.rse.2014.02.015
Palchowdhuri, Y., Valcarce-Diñeiro, R., King, P., and Sanabria-Soto, M. (2018). Classification of multi-temporal spectral indices for crop type mapping: a case study in Coalville, UK. J. Agric. Sci. 156, 24–36. doi: 10.1017/S0021859617000879
Panda, S. S., Ames, D. P., and Panigrahi, S. (2010). Application of vegetation indices for agricultural crop yield prediction using neural network techniques. Remote Sen. 2, 673–696. doi: 10.3390/rs2030673
Panigrahy, S., and Sharma, S. A. (1997). Mapping of crop rotation using multidate Indian remote sensing satellite digital data. ISPRS J. Photogramm. Remote Sens. 52, 85–91. doi: 10.1016/S0924-2716(97)83003-1
Pelletier, C., Valero, S., Inglada, J., Champion, N., and Dedieua, G. (2016). Assessing the robustness of random forests to map land cover with high resolution satellite image time series over large areas. Remote Sens. Environ. 187, 156–168. doi: 10.1016/j.rse.2016.10.010
Peña, J., Gutiérrez, P., Hervás-Martínez, C., Six, J., Plant, R., and López-Granados, F. (2014). Object-based image classification of summer crops with machine learning methods. Remote Sens. 6, 5019–5041. doi: 10.3390/rs6065019
Peña-Barragán, J. M., Ngugi, M. K., Plant, R., and Six, J. (2011). Object-based crop identification using multiple vegetation indices, textural features and crop phenology. Remote Sens. Environ. 15, 1301–1316. doi: 10.1016/j.rse.2011.01.009
Ramankutty, N., Evan, A. T., Monfreda, C., and Foley, J. A. (2008). Farming the planet: 1. Geographic distribution of global agricultural lands in the year 2000. Global Biogeochem. Cycles. 22, 1–19. doi: 10.1029/2007GB002952
Rodriguez-Galiano, V. F., Chica-Olmo, M., Abarca-Hernandez, F., Atkinson, P. M., and Jeganathan, C. (2012). Random forest classification of Mediterranean land cover using multi-seasonal imagery and multi-seasonal texture. Remote Sens. Environ. 121, 93–107. doi: 10.1016/j.rse.2011.12.003
Rouse, J. W., Hass, R. H., Schell, J. A., and Deering, D. W. (1973). “Monitoring vegetation systems in the great plains with ERTS,” in Third Earth Resources Technology Satellite Symposium (Washington, DC: NASA), 1, 309–317.
Schwab, K., Sala-i-Martín, X., Brende, B., Blanke, J., Bilbao-Osorio, B., Browne, C., et al. (2014). The Global Competitiveness Report, World Economic Forum Reports 2014. Geneva: World Economic Forum.
Serra, P., and Pons, X. (2008). Monitoring farmers' decisions on Mediterranean irrigated crops using satellite image time series. Int. J. Remote Sens. 29, 2293–2316. doi: 10.1080/01431160701408444
Simonneaux, V., Duchemin, B., Helson, D., Er-Raki, S., Olioso, A., and Chehbouni, A. G. (2008). The use of high-resolution image time series for crop classification and evapotranspiration estimate over an irrigated area in central Morocco. Int. J. Remote Sens. 29, 95–116. doi: 10.1080/01431160701250390
South, S., Qi, J., and Lusch, D. P. (2004). Optimal classification methods for mapping agricultural tillage practices. Remote Sens. Environ. 91, 90–97. doi: 10.1016/j.rse.2004.03.001
Tatsumi, K., Yamashiki, Y., Canales Torres, M. A., and Taipe, C. L. R. (2015). Crop classification of upland fields using Random forest of time-series Landsat 7 ETM+ data. Comput. Electron. Agric. 115, 171–179. doi: 10.1016/j.compag.2015.05.001
Teluguntla, P., Thenkabail, P. S., Xiong, J., Gumma, M. K., Congalton, R. G., Oliphant, A., et al. (2017). Spectral matching techniques (SMTs) and automated cropland classification algorithms (ACCAs) for mapping croplands of Australia using MODIS 250-m time-series (2000–2015) data. Int. J. Digit. Earth. 10, 944–977. doi: 10.1080/17538947.2016.1267269
Ulabay, F. T., Li, R. Y., and Shanmugan, K. (1982). Crop classification using airborne radar and landsat data. IEEE Trans. Geosci. Remote Sens. 20, 42–51. doi: 10.1109/TGRS.1982.4307519
USDA-NASS and USDA (2010). Field crops usual planting and harvesting dates. Natl. Agric. Stat. Serv. Agriculture Handbook Number 628, 1–51.
Ustuner, M., Sanli, F. B., Abdikan, S., Esetlili, M. T., and Kurucu, Y. (2014). Crop typeclassification using vegetation indices of rapid eye imagery. Int. Arch. Photogramm. Remote Sens. Spat. Inf. Sci.- ISPRS Arch. 40, 195–198. doi: 10.5194/isprsarchives-XL-7-195-2014
Vinciková, H., Hais, M., Brom, J., Procházka, J., and Pecharová, E. (2010). Use of remote sensing methods in studying agricultural landscapes – a review. J. Landsc. Stud. 3, 53–63.
Wardlow, B. D., Egbert, S. L., and Kastens, J. H. (2007). Analysis of time-series MODIS 250m vegetation index data for crop classification in the U.S. central great plains. Remote Sens. Environ. 108, 290–310. doi: 10.1016/j.rse.2006.11.021
Yadav, K. (2019). Accuracies, Errors, and Uncertainties of Global Cropland Products. (Dissertation), University of New Hampshire, Durham, NH (USA).
Yadav, K., and Congalton, R. G. (2018). Issues with large area thematic accuracy assessment for mapping cropland extent: a tale of three continents. Remote Sens. 10:53. doi: 10.3390/rs10010053
Yang, C., Everitt, J. H., and Murden, D. (2011). Evaluating high resolution SPOT 5 satellite imagery for crop identification. Comput. Electron. Agric. 75, 347–354. doi: 10.1016/j.compag.2010.12.012
Zhong, L., Gong, P., and Biging, G. S. (2014). Efficient corn and soybean mapping with temporal extendability: a multi-year experiment using landsat imagery. Remote Sens. Environ. 140, 1–13. doi: 10.1016/j.rse.2013.08.023
Keywords: crop mapping, reference data, high resolution imagery (HRI), agriculture ecological zones (AEZs), phenology-based classification, decision tree (DT) classifier
Citation: Yadav K and Congalton RG (2020) Extending Crop Type Reference Data Using a Phenology-Based Approach. Front. Sustain. Food Syst. 4:99. doi: 10.3389/fsufs.2020.00099
Received: 23 September 2019; Accepted: 09 June 2020;
Published: 25 September 2020.
Edited by:
Molly E. Brown, University of Maryland, College Park, United StatesReviewed by:
Min Feng, Institute of Tibetan Plateau Research (CAS), ChinaWenzhong Shi, Hong Kong Polytechnic University, Hong Kong
Copyright © 2020 Yadav and Congalton. This is an open-access article distributed under the terms of the Creative Commons Attribution License (CC BY). The use, distribution or reproduction in other forums is permitted, provided the original author(s) and the copyright owner(s) are credited and that the original publication in this journal is cited, in accordance with accepted academic practice. No use, distribution or reproduction is permitted which does not comply with these terms.
*Correspondence: Kamini Yadav, a3lhZGF2QG5tc3UuZWR1
 Kamini Yadav
 Russell G. Congalton