 Takeshi Doi
 Gen Sakurai
 Toshichika Iizumi
- 1Application Laboratory, Research Institute for Value-Added-Information Generation (VAiG), Japan Agency for Marine-Earth Science and Technology, Yokosuka, Japan
- 2Institute for Agro-Environmental Sciences, National Agriculture and Food Research Organization, Tsukuba, Japan
The purpose of this study was to evaluate the prediction accuracy of a newly developed crop yield prediction system, composed of a dynamical seasonal climate prediction model (SINTEX-F2) and an eco-physiological process-based crop growth model (PRYSBI2). We explored the 3-months lead prediction accuracy of year-to-year variations in yield of four major crops (maize, rice, wheat, and soybean) in global regions and evaluated for which crops and in which areas the system performs well. The results indicated the system is more accurate for wheat relative to the other crops. Also, we found that different strategies would be useful in improving the system, depending on the crop. For winter wheat and rice, we need to improve the temperature predictions, particularly over the mid-latitudes, whereas improving rainfall predictions was more important for maize. For spring wheat and soybeans, the crop growth simulation itself should be improved. Although this study is only a first step, we believe that additional efforts to improve the system by understanding and incorporating processes of climate and crop growth will potentially provide useful prediction information to big stakeholders like global agribusiness companies and countries for improving food security in regions where crop yield is vulnerable to extreme climate shocks and where food markets are isolated from international trade.
Introduction
Food production is highly sensitive to seasonal climate variability throughout the world (Iizumi et al., 2013b, 2014a, 2018b; Yuan and Yamagata, 2015; Oettli et al., 2018). Therefore, seasonal climate predictions linked to a crop simulation model can provide potentially useful information for stakeholders to reduce risks related to crop failure (Hansen and Indeje, 2004; Crane et al., 2010; Hayashi et al., 2018; Rodriguez et al., 2018). For example, an early warning of an abnormal seasonal climate-induced crop failure could serve as useful information for better management of national food balance by imports, insurance systems, and stabilization of commodity markets (FAO, 2016). The recent development of improved numerical seasonal climate prediction technologies has enhanced the possibility of predicting crop yields several months prior to harvest, but there is still room for improvement.
One possible approach to improving the prediction system is to better understand processes for abnormal climate events and their impacts on crop growth. Simple statistical methods are not suitable for this purpose because they implicitly link output (crop yields) and input (climate prediction) using available data (e.g., Lobell and Asseng, 2017). Therefore, developing hybrid systems of dynamical seasonal prediction systems and process-based crop growth models is a necessary step for potentially improving seasonal predictions of crop yields. Previous studies have evaluated the prediction accuracy and usefulness of dynamical seasonal prediction systems linked with process-based crop growth models. Brown et al. (2018) showed the benefits of using a climate model to predict wheat yield in the Australian cropping zone. Rodriguez et al. (2018), focusing on sorghum yield in Australia, showed that a dynamical seasonal prediction system linked with a crop simulation model can be used to inform optimum crop designs to increase farmers' profits and reduce risks. However, there still has not been sufficient discussion about which crops and areas have a high predictive ability on a global scale.
Our aim was to develop a scheme for forecasting worldwide crop yield variations based on seasonal climate predictions. We developed a hybrid system of a dynamical seasonal prediction model and an eco-physiological process-based crop growth model for four major crops (maize, rice, wheat, and soybean) and investigated its prediction accuracy in global regions. We chose these four crops because together they account for about two-thirds of the world's food calories and are crucial as agricultural commodities in international trade.
Materials and Methods
Seasonal Climate Prediction System
The SINTEX-F2 seasonal prediction system (Doi et al., 2016) was used. It is based on the fully coupled ocean-atmosphere-land-sea–ice SINTEX-F2 climate model (Masson et al., 2012; Sasaki et al., 2013) and is an upgraded high-resolution version of the earlier SINTEX-F1 system (Luo et al., 2005). The atmospheric component has a horizontal resolution of 1.125° (T106). System details and an overview are given in Doi et al. (2016). This system has been used to make accurate predictions of El Niño/Southern Oscillation (ENSO), the Indian Ocean Dipole (IOD), and associated seasonal climate variations (Doi et al., 2016, 2017; Ratnam et al., 2017, 2018, 2019). In consideration of uncertainties of both initial conditions and model physics, the system has six ensemble members. Here, we used retrospective forecast experiments with a 3-months lead period beginning on the first day of every month in 2000–2010.
Eco-Physiological Process-Based Crop-Growth Simulation Model
PRYSBI2, an eco-physiological process-based crop growth simulation model, was used. It can successfully describe the response of crop growth and yield to abnormal weather and climate in global regions at a large scale, taking soybean as the example (Sakurai et al., 2014; Müller et al., 2017). The model is sufficiently complex to describe important factors, such as the enzyme kinetics in photosynthesis, to simulate yield response to abnormal weather and climate conditions. However, it is simplified as much as possible to enable us to do the huge number of calculations (see the Supplementary Material) needed because we used a Bayesian statistical approach with a Markov-Chain Monte Carlo (MCMC) method based on field observations and statistical yield data to estimate the parameters of the process-based model. The horizontal resolution was 1.125° (T106) to match the outputs of the climate prediction system.
The original model is a global gridded crop model (Müller et al., 2017) in which the representative value of crop yields of a target area is estimated. Our crop model simulates representative crop yield in each 1.125° grid cell using daily meteorological data. The sowing date of Sacks et al. (2010) is used, and the harvest date is determined by accumulated temperature from sowing date (Sakurai et al., 2014). The parameter value relevant to harvesting day is also estimated using the data of Sacks et al. (2010) for each grid cell. More details and an in-depth overview of the original model are presented in Sakurai et al. (2014) and Okada et al. (2015). A description of the updated model used in this study is available in the Supplementary Material.
Reforecast Experiment
For the retrospective forecast (re-forecast) experiments, the daily outputs from the SINTEX-F2 seasonal prediction system (shortwave radiation, precipitation, relative humidity, wind speed, and daily average, maximum, and minimum temperature) were used as the climate inputs to the crop model after bias correction. In the bias correction, the daily climatology for 365 days for the period 2000–2010 was computed using a global retrospective meteorological forcing dataset (Iizumi et al., 2013a) with a spatial resolution of 1.125°. The daily climatology for the same 11-years period was then derived using the SINTEX-F2 outputs, and the climate-model data were adjusted to have the same climatology as the forcing dataset. The day-to-day deviation in a climatic variable relative to the climate-model climatology was maintained, although the systematic error in the climate-model climatology was removed. This procedure was conducted for each crop, 1.125° grid cell, and six climate-model ensemble member. We also used the retrospective meteorological forcing dataset (Iizumi et al., 2013a) to estimate past crop yields to evaluate the upper limitation of the prediction accuracy of the crop model itself.
Prediction Accuracy Metrics
Country-level yield data from the Statistical Division of the UN Food and Agriculture Organization (FAOSTAT) (see www.fao.org/faostat/en/#home) were used for verification of global average yield in 2000–2010. Global average yield data were calculated from country-level yield and harvested area data. We also used grid-cell crop yield datasets in the years of 2000–2006 by Iizumi et al. (2014b), which are 1.125° grid-scale yield data estimated using satellite data (NOAA/AVHRR), and country-level yield data by FAO (Iizumi et al., 2013b). Although data in the grid-scale dataset are estimates and not ground truth, they have been shown to be in good agreement with actual yield data when the dataset was compared to other yield datasets solely based on national and subnational yield statistics (Iizumi et al., 2018a).
The six-member ensemble mean of the yield and climate simulations was used to calculate anomaly correlation coefficients (ACCs) as a deterministic accuracy score. ACCs were calculated as follows.
where ei indicates simulated yield values at time i and oi indicates observed yield values at time i. and indicate the trends of simulated and observed yield values, respectively. The trend lines of the yield values are estimated using the local regression (LOESS, span = 0.7, degree = 1) available in the R statistical package (R Development Core Team, 2016). For the general calculation of ACC in the field on climate science, the average values of eiand oi would be used instead of and . Moreover, the differences between the simulated (or observed) value and the average would not be divided by or . However, we used the above equations because: (1) crop yield data have time trends that can be attributed to non-climatic factors and; (2) crop yield variability tends to change according to the average yield (Hawkins et al., 2013). Although this derivation of ACC is slightly different from that generally used, the derived value has the same characteristic—it increases as the prediction improves, with an upper limit of 1. When calculating the predicted global average yield, we calculated the average yield weighted by harvested area (Monfreda et al., 2008) for each crop.
We also calculated the root-mean-square error (RMSE) as follows.
Although the RMSE formula is different from the classic formula, the derived value has the same characteristic—it decreases as the prediction improves.
Comparison of the Error Contributions
We conducted crop-growth simulations forced by the bias-corrected re-analysis meteorological forcing dataset (Iizumi et al., 2014a) to compare the errors generated by the re-analysis with those simulated with the seasonal climate prediction. By calculating the difference in the RMSE between the crop yield predictions of the two analyses, we roughly estimated the degree of the contribution of the error of the seasonal climate prediction to the RMSE of the crop yield prediction for each grid cell.
Results
Prediction Accuracy for Global Average
Figure 1 shows the time series of year-to-year variations of historical global mean yield of four major crops. Maize yield had the largest year-to-year variation in 2003–2004 (Figure 1A). Unfortunately, the prediction system cannot capture it, and the ACC is not statistically significant for maize. Because the ensemble spread of the prediction is much larger relative to the standard deviation of the year-to-year variation, the uncertainty is large. On the other hand, the historical rice yield was rather stable and did not have large year-to-year variations (Figure 1B). The prediction system is not accurate in predicting these small variations in the annual global mean rice yield (ACC = 0.10), and the uncertainty is large. The predictions for wheat are relatively better than those for the other crops (Figures 1C,D). As shown in the relatively small ensemble spreads for winter/spring wheat, the uncertainties are relatively small. The ACC values are 0.54 for winter wheat and 0.38 for spring wheat. The former value is statistically significant at 85% and very close to the 90% significant level, although the latter value is not significant at 90% because of the small sample size (n = 10). Soybean prediction is the most challenging of the four crops. The ACC score of the global mean yield is even negative, and the ensemble spread is the largest among the crops considered here (Figure 1E).
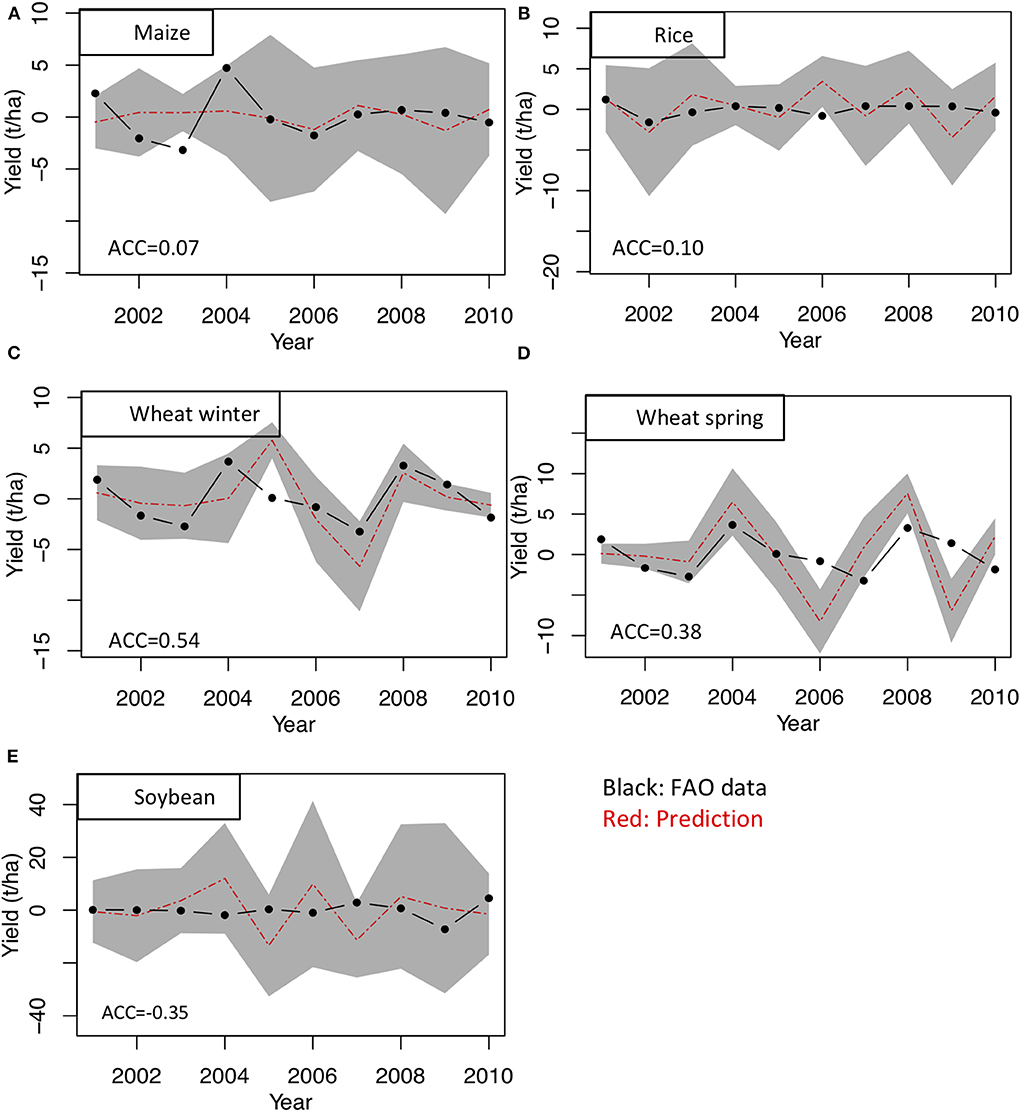
Figure 1. Time series of year-to-year variations of global mean yield of (A) maize, (B) rice, (C) winter wheat, (D) spring wheat, and (E) soybean. FAO data are from the Statistical Division of the UN Food and Agriculture Organization (FAOSTAT). Winter and spring wheat use the same data. The predicted values show a 3-months lead prediction. The shaded areas show the 95% confidence intervals estimated from a six-ensemble spread. The ACC accuracy score is shown at the bottom left corner of each panel.
Horizontal Distribution of Prediction Accuracy
Horizontal distributions of the ACC scores are shown in Figure 2. Note that an ACC value of >0.669 is necessary to conclude that our yield prediction is accurate when the sample size is 7 (5% significance level, one-sided). For maize, the prediction system is accurate over some parts of the United States (U.S.), Europe, northeastern China, and Indonesia, although the horizontal distribution is patchy over the South American continent and Southern Africa (Figure 2A). The values are very low over eastern Australia. Rice prediction shows higher ACC values over some parts of northeastern Brazil, Europe, and northeastern China (Figure 2B). On the other hand, it is quite low over southern Brazil, West Africa, South Africa, Thailand, and Indonesia. The relatively better prediction of globally averaged wheat (section Prediction Accuracy for Global Average) is due mainly to the high scores in the eastern U.S., southern Africa, and western Russia (Figure 2C). For spring wheat, accurate predictions are seen in some parts of western/eastern Australia, western U.S., Turkey, and Central Russia (Figure 2D). Soybean accuracy scores are very low (negative) over the major soybean-producing regions, including the U.S., China, Brazil, and Argentina, although the scores are higher over some parts of India and northeastern China (Figure 2E).
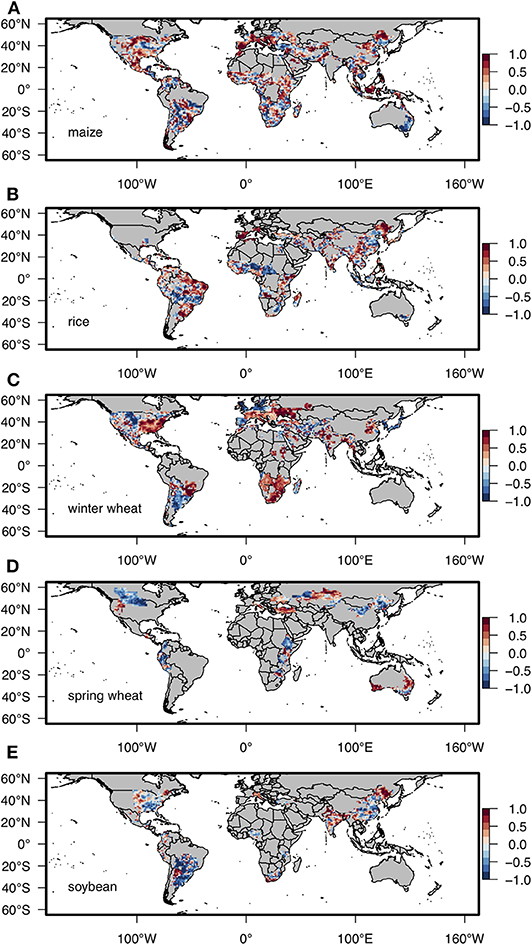
Figure 2. Horizontal distributions of ACC accuracy scores for a 3-months lead prediction of year-to-year variations in yields of (A) maize, (B) rice, (C) winter wheat, (D) spring wheat, and (E) soybean. Gray indicates non-growing areas for the respective crops.
We evaluated the statistical significance of ACCs by conducting 3,000 bootstrapping sampling in which ACCs were calculated with the observation values and randomly selected predicted values for each grid to estimate the percentage of the global harvested area with accurate prediction by chance (the number of grids with accurate prediction per number of grids). For each bootstrapping sampling, the number of grids with accurate prediction was defined as those that have a significant (p < 0.05) correlation coefficient (ACC > 0.729 if n = 6, ACC = 0.669 if n = 7). In the bootstrap analysis, the average (±SD) rates of grids that have significant ACCs by chance were 5.7% (±0.4%), 5.6% (±0.4%), 7.2% (±0.5%), 5.0% (±0.6%), and 5.9% (±0.6%) for maize, rice, winter wheat, spring wheat, and soybean, respectively. For our prediction system, the corresponding rates were 18, 20, 21, 15, and 15%, respectively. All of the rates obtained using our prediction system therefore largely exceed the rates calculated under the random assumption, which means that the prediction system may have potential benefits.
Contribution to the Errors
Figure 3 shows the difference between the RMSE of the seasonal climate prediction and that of the crop model for each grid. The positive values (classes A [0.0–0.5 t/ha], B [0.5–1.0 t/ha], and C [1.0–1.5 t/ha]) indicate that parts of the prediction errors are explained by prediction errors of the seasonal climate prediction. For maize, rice, and winter wheat, many class B and C grids were observed. These results indicate that, for these crops and grids, the hybrid prediction system would be improved by elaborating both the seasonal climate prediction and the crop growth prediction. On the other hand, in soybean and spring wheat, the classification of most of the grids as class X (negative) or A indicated that the prediction errors would be caused mainly by inaccuracy in the crop model.
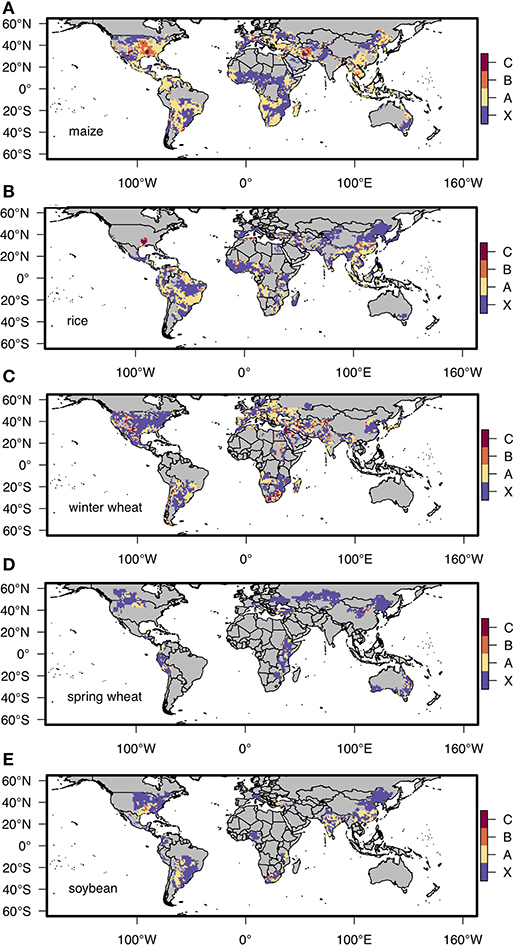
Figure 3. Horizontal distributions of the degree of the contribution of the error due to the seasonal climate prediction to the RMSE (i.e., the difference between the RMSE of the seasonal climate prediction and that of the crop model for each grid) of the predicted yields for (A) maize, (B) rice, (C) winter wheat, (D) spring wheat, and (E) soybean. Class X indicates grids where the RMSE of the predicted yields can be explained by the crop model error. Classes A, B, and C indicate grids where some of the RMSE of the predicted yields can be explained by the prediction error of the seasonal climate prediction. X: < 0.0, A: 0.0–0.5, B: 0.5–1.0, and C: 1.0–1.5 (t/ha). Gray indicates non-growing areas for the respective crops.
Figure S1 is same as Figure 2, but for the estimation forced by the atmospheric re-analysis data. Therefore, the errors are mainly attributable to the crop model. We can find that there is room of improvement for maize in eastern China, central North America, and central Asia and for winter wheat in central Asia by improving seasonal climate prediction. We also added horizontal maps of the RMSE for the estimation forced by the atmospheric re-analysis data (Figure S2) and by the seasonal climate prediction (Figure S3). The result suggests that the prediction error of the crop yields are attributable to the prediction errors of the seasonal climate prediction particularly in central North America (for maize), Eastern Asia (for maize and rice) and central Asia (for maize and winter wheat). However, for spring wheat and soybean, the greater part of the prediction error of the crop yields are attributable to the error of the crop model.
Discussion
Consistency With Previous Works
The results indicate that the prediction accuracy is high for wheat relative to the other crops. The results are partly consistent with previous studies (Iizumi et al., 2013b, 2014a; Yuan and Yamagata, 2015), which also showed that wheat yield can be reliably predicted using simple regression methods based on the outputs of the SINTEX-F1 prediction system (Luo et al., 2005). Particularly, Yuan and Yamagata (2015) showed that the potential source of seasonal predictability of Australian wheat is due to the tropical Indo-Pacific climate modes, such as IOD, ENSO, and ENSO-Modoki. The high prediction accuracies of those climate variations and their associated teleconnection patterns by the SINTEX-F2 system (Doi et al., 2016) partly contribute to the successful prediction of Australian wheat yield, as shown in Figure 2D.
Improvement
The results suggest that the crop yield prediction errors are attributable to the prediction errors of the seasonal climate prediction for maize, rice, and winter wheat. This tendency was remarkable for maize, particularly the improvement of seasonal climate prediction in the central U.S. and Iran. It was also important in the southern U.S. for rice and southern Africa for winter wheat. Production of maize is sensitive to water stress, while production of wheat and rice is sensitive to temperature stress (Iizumi et al., 2013b). Temperature prediction by the SINTEX-F2 system is generally more accurate relative to rainfall prediction (Figure S4), which is a common attribute of dynamical seasonal climate prediction systems (e.g., the North American Multi-Model Ensemble: NMME; Kirtman et al., 2014). This feature can partly explain why the prediction error of maize yield is mostly due to the seasonal climate prediction errors, relative to those of rice and winter wheat. Low prediction accuracy of rice yield in Eastern Asia may be due to the difficulty of prediction of boreal spring-summer temperature there (Figures S4A,C), while low prediction skill of winter wheat in central Asia may be related to the difficulty of prediction of boreal winter temperature there (Figure S4G).
As shown in Figure 1C, an extreme failure of the global average crop yield for wheat was experienced in 2007. This is successfully predicted 3 months ahead by our system. Figure 4A shows the country-level yield of wheat in 2007. Although the prediction is relatively better over the U.S., Russia, and India, predicted wheat yield in China is underestimated and that in Canada is overestimated (Figure 4B). This is also seen by the grid-level yield (Figure S5). The error in Canada is due mainly to the crop model itself because the crop model forced by the bias-corrected re-analysis dataset still has a similar error (Figure 4C). In contrast, the error in China is due mainly to seasonal climate prediction error (Figures 4B–D). From the latter half of 2006 through 2007, we experienced the growth and decay of El Niño and the positive Indian Ocean Dipole event, which may remotely influence the East Asia climate, including China (e.g., Behera et al., 2008). The seasonal prediction system needs to be improved to capture those teleconnections. We have been developing the SINTEX-F2 system to improve its prediction accuracy by updating the initialization scheme and increasing the ensemble size (Doi et al., 2017, 2019, 2020; Morioka et al., 2019).
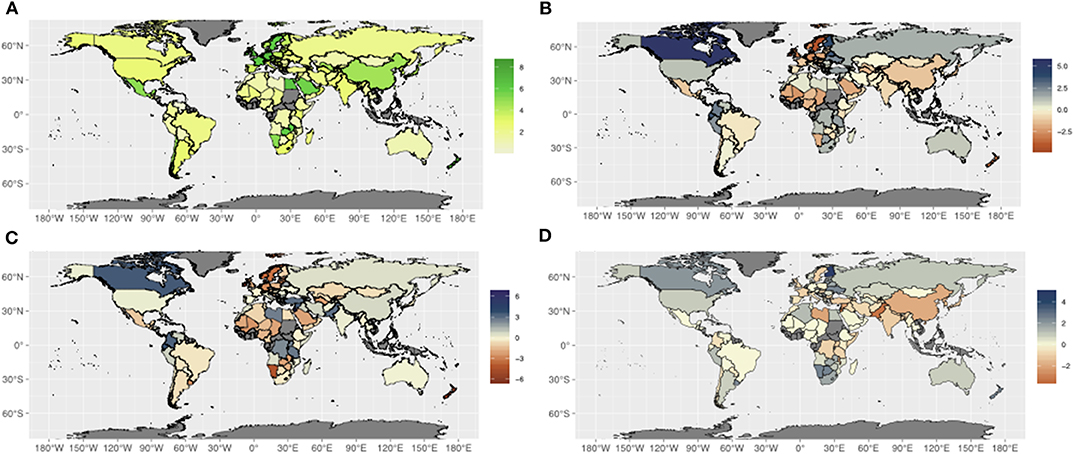
Figure 4. Country-level yield of wheat in 2007 (t/ha): (A) FAOSTAT data, (B) error of the predicted yields, (C) error explained by crop model error, and (D) error explained by the seasonal prediction error.
For spring wheat and soybean, most of the crop yield prediction error can be attributed to crop model error (Figures 3D,E). Although identification of specific reasons for the crop model error is beyond the scope of this study, poor estimation of crop phenology may be in part responsible. Although daylength is not considered in our crop model, it is known that both temperature and daylength influence crop phenology (Yan and Wallace, 1998), and the influence of daylength on crop phenology differs among crops and cultivars (Major, 1980). For example, whereas soybean phenology is influenced largely by daylength (Major, 1974), maize phenology can be modeled using thermal time (Gilmore and Rogers, 1958; Tollenaar et al., 1979; Plett, 1992). Nutrient stress tolerances are also different among crops, which might affect the difference in the prediction accuracy among the crops. For example, soybean is a crop that establishes a symbiotic relationship with a nitrogen-fixing bacterium and has high nitrogen stress tolerance. For the accurate estimation of the crop yield, it would be needed to consider nitrogen dynamics, the possible input of the nitrogen, and the difference of the response to the nitrogen input for each crop. In this study, soil water content and drought stress were calculated with the Soil & Water Assessment Tool (Neitsch et al., 2005). However, nitrogen dynamics was not included in our model (but included in the original model) because of avoiding the artificial effect on the estimation of the yield. It is possible that this simplification increased the error of the crop model in this study. Moreover, soil characteristics in each area were considered by using the ISLSCP II soil data (Scholes and Brown de Colstoun, 2011) but not in each crop in this study, although the soil characteristics may differ among the crops even in the same area. This simplification might also affect the prediction error in this study. Detailed analysis of these types of differences in the prediction accuracy of the crop model is an important future task. We will try to include this factor in future versions of the model.
Limitations
The prediction system in this study is accurate for some crops over some areas. However, a discussion based on statistical significance is still challenging because this study used data from a relatively short time period, i.e., 7 years (2000–2006) for the grid-wise assessment and 11 years (2000–2010) for the global average. Although statistical significance is not always the best basis for making conclusions (Amrhein et al., 2019; Wasserstein et al., 2019), a longer time period is required for a more reliable assessment of yield prediction accuracy. For that, we may need more streamline yield data corrections and reduce the computational cost of the hybrid system of dynamical climate prediction and eco-physiological crop-growth simulation.
Some other limitations also need to be addressed in future studies. The current crop model was calibrated using yield data for 1981–2006 (Supplementary Material), and the data used for the accuracy assessment are included in this dataset. The bias-correction procedure does not divide climate data into calibration and independent subsets. The use of a more reasonable experimental setup, such as the “leave-one-out” cross validation technique, is necessary. In addition, calibration of the crop model with a Bayesian approach is currently computationally expensive and not feasible at the present time.
Global mean yield may not be a good metric when evaluating predictions of seasonal yield variability because crop durations (planting to harvesting) vary by geographic location. For example, maize is harvested from October to November in the U.S., whereas first- and second-season maize in Brazil is harvested from February to June and from June to September, respectively (U.S. Department of Agriculture, 1994). In the most of the countries in Central America and the Caribbean (such as Mexico) and African countries (such as Nigeria), second season maize is also planted (U.S. Department of Agriculture, 2020). Particularly in Brazil, the production of the second season maize is substantially increasing in recent years (van Benthem, 2013). In contrast, seasonal climate forecasts for the coming 3 months are issued at a single point in time (e.g., 1 January), and crops in some regions would be harvested within the 3-months period, but crops in other regions would not. For this reason, global mean yield can be computed in the re-forecast experiments, but it never appears in the operational forecast mode. Country mean yield forecasts are most likely better for use in the assessment of operational yield prediction service.
The computational cost of the model might be a serious limitation for some researchers in third-world countries, who would be some of the most benefited from such modeling. We are thinking to share our outputs in future. Also, we may reduce the horizontal resolutions and/or focus on some target regions from the worldwide calculation to reduce the computational cost.
Future Potential
The results indicated that the prediction accuracy of the system varies according to area and crop species. This indicates that an important direction of future study would be not only elaborating the prediction models but also searching for combinations of areas and crops that are appropriate for seasonal prediction. Further studies need to summarize the advantages and disadvantages of using statistical and process-based crop models in seasonal yield prediction and make careful comparisons based on coordinated reforecast experiments. One of the notable advantages with the process-based prediction system in this study is that it can provide prediction results supported by reasons. As an additional improvement, we need to carefully compare the processes to understand the system's predictive potential by focusing on particular regions and years. This type of information will provide clues on how to improve and optimize the system. This research approach is not possible by using only a simple statistical method, as shown in previous studies (Iizumi et al., 2013b, 2014a; Yuan and Yamagata, 2015). Although this study is only a first step, we believe that further efforts to improve the system by more deeply understanding climate and crop growth processes can provide useful prediction information to society. Although a global prediction system is still challenging, the accurate information could be beneficial for agro-businesses (for example, a bank that issues credits worldwide for agriculture) and for improving food security in regions where crop yield is vulnerable to climate shocks and food markets are isolated from international trade. In addition, a process-based prediction system may provide information to country-level institutions responsible for agriculture, which in turn could inform farmers, to prevent possible yield losses, for example, choice of sowing date based on seasonal prediction. Such a research stream is also already underway (Sakurai et al., 2018).
Conclusions
This study presented a newly developed system combining an eco-physiological process-based crop model and a dynamical seasonal climate model to predict worldwide yields for four major crops and evaluated the system's results. The 3-months lead predictions of year-to-year variation in the wheat yield were more accurate relative to those of maize, rice, and soybean. Maize yield is difficult to predict because of its huge intrinsic variability. Conversely, small variations in rice yield also make it difficult to predict. Soybean yield is the most difficult to predict. For winter wheat and rice, temperature predictions need to be improved, particularly over the mid-latitudes, whereas for maize, rainfall predictions should be improved. For spring wheat and soybeans, the crop growth simulation itself needs to be improved. However, we don't completely buy that low prediction scores in maize, rice and winter wheat are just because errors of seasonal climate prediction. It may be also due to intrinsic genetic variation in those crops and other biological and management factors. We also believe that further efforts to improve the system can contribute to provide a possible tool to concern food security under future climate change because process-based models allow representing future climate and management conditions not sampled in the historical record and new locations to which cultivation may shift (Franke et al., 2019).
Data Availability Statement
The datasets generated for this study are available on request to the corresponding author.
Author Contributions
TD conducted the seasonal climate reforecast experiments. GS conducted the crop simulation. TI conducted the bias correction. All authors contributed to the article and approved the submitted version.
Funding
This study was supported by the Environment Research and Technology Development Fund (2-1801) of the Ministry of the Environment, Japan.
Conflict of Interest
The authors declare that the research was conducted in the absence of any commercial or financial relationships that could be construed as a potential conflict of interest.
Acknowledgments
We thank Drs. Motoki Nishimori, Hirofumi Sakuma, and Toshio Yamagata for helpful comments and suggestions. The SINTEX-F2 seasonal climate prediction system was run by the Earth Simulator at JAMSTEC (see http://www.jamstec.go.jp/es/en/index.html for a system overview). We are grateful to Drs. Wataru Sasaki, Jing-Jia Luo, and Sebastian Masson, and our European colleagues from INGV/CMCC, L'OCEAN, and MPI for their contributions to developing the prototype of the seasonal prediction system.
Supplementary Material
The Supplementary Material for this article can be found online at: https://www.frontiersin.org/articles/10.3389/fsufs.2020.00084/full#supplementary-material
References
Amrhein, V., Greenland, S., and Mcshane, B. (2019). Retire statistical significance. Nature 567, 305–307. doi: 10.1038/d41586-019-00857-9
Behera, S. K., Luo, J. J., and Yamagata, T. (2008). Unusual IOD event of 2007. Geophys. Res. Lett. 35, 1–5. doi: 10.1029/2008GL034122
Brown, J. N., Hochman, Z., Holzworth, D., and Horan, H. (2018). Seasonal climate forecasts provide more definitive and accurate crop yield predictions. Agric. For. Meteorol. 260–261, 247–254. doi: 10.1016/j.agrformet.2018.06.001
Crane, T. A., Roncoli, C., Paz, J., Breuer, N., Broad, K., Ingram, K. T., et al. (2010). Forecast skill and farmers' skills: seasonal climate forecasts and agricultural risk management in the southeastern United States. Weather. Clim. Soc. 2, 44–59. doi: 10.1175/2009WCAS1006.1
Doi, T., Behera, S. K., and Yamagata, T. (2016). Improved seasonal prediction using the SINTEX-F2 coupled model. J. Adv. Model. Earth Syst. 8, 1847–1867. doi: 10.1002/2016MS000744
Doi, T., Behera, S. K., and Yamagata, T. (2019). Merits of a 108-member ensemble system in ENSO and IOD predictions. J. Clim. 32, 957–972. doi: 10.1175/JCLI-D-18-0193.1
Doi, T., Behera, S. K., and Yamagata, T. (2020). Predictability of the super IOD event in 2019 and its link with El niño modoki. Geophys. Res. Lett. 47:e2019GL086713. doi: 10.1029/2019GL086713
Doi, T., Storto, A., Behera, S. K., Navarra, A., and Yamagata, T. (2017). Improved prediction of the Indian ocean dipole mode by use of subsurface ocean observations. J. Clim. 30, 7953–7970. doi: 10.1175/JCLI-D-16-0915.1
FAO (2016). 2015–2016 El Niño Early Action and Response for Agriculture, Food Security and Nutrition. Rome: FAO. Available online at: http://www.fao.org/3/a-i6049e.pdf
Franke, J., Müller, C., Elliott, J., Ruane, A., Jagermeyr, J., Balkovic, J., et al. (2019). The GGCMI phase II experiment: global gridded crop model simulations under uniform changes in CO2, temperature, water, and nitrogen levels (protocol version 1.0). Geosci. Model Dev. 13, 2315–2336. doi: 10.5194/gmd-13-2315-2020
Gilmore, E. C. Jr., and Rogers, J. S. (1958). Heat units as a method of measuring maturity in corn. Agron. J. 50, 611–615. doi: 10.2134/agronj1958.00021962005000100014x
Hansen, J. W., and Indeje, M. (2004). Linking dynamic seasonal climate forecasts with crop simulation for maize yield prediction in semi-arid Kenya. Agric. For. Meteorol. 125, 143–157. doi: 10.1016/j.agrformet.2004.02.006
Hawkins, E., Fricker, T. E., Challinor, A. J., Ferro, C. A. T., Ho, C. K., and Osborne, T. M. (2013). Increasing influence of heat stress on French maize yields from the 1960s to the 2030s. Glob. Chang. Biol. 19, 937–947. doi: 10.1111/gcb.12069
Hayashi, K., Llorca, L., Rustini, S., Setyanto, P., and Zaini, Z. (2018). Reducing vulnerability of rainfed agriculture through seasonal climate predictions: a case study on the rainfed rice production in southeast Asia. Agric. Syst. 162, 66–76. doi: 10.1016/j.agsy.2018.01.007
Iizumi, T., Kotoku, M., Kim, W., West, P. C., Gerber, J. S., and Brown, M. E. (2018a). Uncertainties of potentials and recent changes in global yields of major crops resulting from census- and satellite-based yield datasets at multiple resolutions. PLoS ONE 13:e203809. doi: 10.1371/journal.pone.0203809
Iizumi, T., Luo, J. J., Challinor, A. J., Sakurai, G., Yokozawa, M., Sakuma, H., et al. (2014a). impacts of El niño southern oscillation on the global yields of major crops. Nat. Commun. 5, 1–7. doi: 10.1038/ncomms4712
Iizumi, T., Okada, M., and Yokozawza, M. (2013a). A meteorological forcing data set for global crop modeling: development, evaluation, and intercomparison. J. Geophys. Res. Atmos. 119, 363–384. doi: 10.1002/2013JD020130
Iizumi, T., Sakuma, H., Yokozawa, M., Luo, J. J., Challinor, A. J., Brown, M. E., et al. (2013b). Prediction of seasonal climate-induced variations in global food production. Nat. Clim. Chang. 3, 904–908. doi: 10.1038/nclimate1945
Iizumi, T., Shin, Y., Kim, W., Kim, M., and Choi, J. (2018b). Global crop yield forecasting using seasonal climate information from a multi-model ensemble. Clim. Serv. 11, 13–23. doi: 10.1016/j.cliser.2018.06.003
Iizumi, T., Yokozawa, M., Sakurai, G., Travasso, M. I., Romanenkov, V., Oettli, P., et al. (2014b). Historical changes in global yields : major cereal and legume crops from 1982 to 2006. Glob. Ecol. Biogeogr. 23, 346–357. doi: 10.1111/geb.12120
Kirtman, B. P., Min, D., Infanti, J. M., Kinter, J. L., Paolino, D. A., Zhang, Q., et al. (2014). The North American multimodel ensemble: phase-1 seasonal-to-interannual prediction; phase-2 toward developing intraseasonal prediction. Bull. Am. Meteorol. Soc. 95, 585–601. doi: 10.1175/BAMS-D-12-00050.1
Lobell, D. B., and Asseng, S. (2017). Comparing estimates of climate change impacts from process-based and statistical crop models. Environ. Res. Lett. 12:015001. doi: 10.1088/1748-9326/aa518a
Luo, J. J., Masson, S., Behera, S., Shingu, S., and Yamagata, T. (2005). Seasonal climate predictability in a coupled OAGCM using a different approach for ensemble forecasts. J. Clim. 18, 4474–4497. doi: 10.1175/JCLI3526.1
Major, D. (1974). Effects of daylength and temperature on soybean development. Crop Sci. 15, 174–179. doi: 10.2135/cropsci1975.0011183X001500020009x
Major, D. (1980). Photoperiod response characteristics controlling flowering of nine crop species. Can. J. Plant Sci. 60, 777–784. doi: 10.4141/cjps80-115
Masson, S., Terray, P., Madec, G., Luo, J. J., Yamagata, T., and Takahashi, K. (2012). Impact of intra-daily SST variability on ENSO characteristics in a coupled model. Clim. Dyn. 39, 681–707. doi: 10.1007/s00382-011-1247-2
Monfreda, C., Ramankutty, N., and Foley, J. A. (2008). Farming the planet: 2. Geographic distribution of crop areas, yields, physiological types, and net primary production in the year 2000. Glob. Biogeochem. Cycles. 22:GB1022. doi: 10.1029/2007GB002947
Morioka, Y., Doi, T., Iovino, D., Masina, S., and Behera, S. K. (2019). Role of sea-ice initialization in climate predictability over the weddell sea. Sci. Rep. 9:2457. doi: 10.1038/s41598-019-39421-w
Müller, C., Elliott, J., Chryssanthacopoulos, J., Arneth, A., Balkovič, J., Ciais, P., et al. (2017). Global gridded crop model evaluation: benchmarking, skills, deficiencies and implications. Geosci. Model Dev. 10, 1403–1422. doi: 10.5194/gmd-10-1403-2017
Neitsch, S. L., Arnold, J. G., Kiniry, J. R., Williams, J. R., and King, K. W. (2005). Soil and Water Assessment Tool Theoretical Documentation (Version 2005). Temple, TX: United States Department of Agriculture.
Oettli, P., Behera, S. K., and Yamagata, T. (2018). Climate based predictability of oil palm tree yield in Malaysia. Sci. Rep. 8:2271. doi: 10.1038/s41598-018-20298-0
Okada, M., Iizumi, T., Sakurai, G., Hanasaki, N., Sakai, T., Okamoto, K., et al. (2015). Modeling irrigation-based climate change adaptation in agriculture: model development and evaluation in Northeast China. J. Adv. Model. Earth Syst. 7, 1409–1424. doi: 10.1002/2014MS000402
Plett, S. (1992). Comparison of seasonal thermal units for measurement of corn maturity in a Prairie environment. Can. J. Plant Sci. 72, 1157–1162. doi: 10.4141/cjps92-141
R Development Core Team (2016). R: A Language and Environment for Statistical Computing. Vienna: R Foundation of Statistical Computing.
Ratnam, J. V., Doi, T., and Behera, S. K. (2017). Dynamical downscaling of SINTEX-F2v CGCM seasonal retrospective austral summer forecasts over Australia. J. Clim. 30, 3219–3235. doi: 10.1175/JCLI-D-16-0585.1
Ratnam, J. V., Doi, T., and Behera, S. K. (2019). Improving austral summer precipitation forecasts of SINTEX-F2 coupled ocean-atmosphere general circulation model over southern Africa by simple bias correction techniques. Atmos. Sci. Lett. 20, 1–8. doi: 10.1002/asl.885
Ratnam, J. V., Doi, T., Landman, W. A., and Behera, S. K. (2018). Seasonal forecasting of onset of summer rains over South Africa. J. Appl. Meteorol. Climatol. 57, 2697–2711. doi: 10.1175/JAMC-D-18-0067.1
Rodriguez, D., De Voil, P., Hudson, D., Brown, J. N., Hayman, P., Marrou, H., et al. (2018). Predicting optimum crop designs using crop models and seasonal climate forecasts. Sci. Rep. 8:2231. doi: 10.1038/s41598-018-20628-2
Sacks, W. J., Deryng, D., Foley, J. A., and Ramankutty, N. (2010). Crop planting dates: An analysis of global patterns. Glob. Ecol. Biogeogr. 19, 607–620. doi: 10.1111/j.1466-8238.2010.00551.x
Sakurai, G., Doi, T., Okada, M., Nishimori, M., and Yokozawa, M. (2018). “Potential benefits of changing the planting date to account for seasonal climate forecasts,” in 20th EGU General Assembly, EGU2018, Proceedings from the conference Vienna. p.15786.
Sakurai, G., Iizumi, T., Nishimori, M., and Yokozawa, M. (2014). How much has the increase in atmospheric CO2 directly affected past soybean production? Sci. Rep. 4:4978. doi: 10.1038/srep04978
Sasaki, W., Richards, K. J., and Luo, J. J. (2013). Impact of vertical mixing induced by small vertical scale structures above and within the equatorial thermocline on the tropical Pacific in a CGCM. Clim. Dyn. 41, 443–453. doi: 10.1007/s00382-012-1593-8
Scholes, R. J., and Brown de Colstoun, E. (2011). “ISLSCP II global gridded soil characteristics,” in ISLSCP Initiative II Collection, eds F. G. Hall, G. Collatz, B. Meeson, S. Los, E. Brown de Colstoun, and D. Landis (Oak Ridge, TN: Oak Ridge National Laboratory Distributed Active Archive Center). doi: 10.3334/ORNLDAAC/1004
Tollenaar, M., Daynard, T., and Hunter, R. (1979). Effect of temperature on rate of leaf appearance and flowring date in maize. Crop Sci. 19, 363–366. doi: 10.2135/cropsci1979.0011183X001900030022x
U.S. Department of Agriculture (1994). Major World Crop Areas and Climatic 692 Profiles. Available online at: http://www.usda.gov/oce/weather/pubs/Other/MWCACP (accessed August 9, 2018).
U.S. Department of Agriculture (2020). Crop Calendar Charts. Available online at: https://ipad.fas.usda.gov/ogamaps/cropcalendar.aspx (accessed April 25, 2020).
van Benthem, L. (2013). Soybean and maize production in Brazil (M.Sc. thesis), Wageningen University & Research Center Department of Business Economics, Netherlands.
Wasserstein, R. L., Schirm, A. L., and Lazar, N. A. (2019). Moving to a world beyond “p < 0.05”. Am. Stat. 73, 1–19. doi: 10.1080/00031305.2019.1583913
Yan, W., and Wallace, D. H. (1998). Simulation and prediction of plant phenology for five crops based on photoperiod temperature interaction. Ann. Bot. 81, 705–716. doi: 10.1006/anbo.1998.0625
Keywords: seasonal prediction, crop yields, process-based prediction, dynamical seasonal climate prediction, eco-physiological crop-growth simulation
Citation: Doi T, Sakurai G and Iizumi T (2020) Seasonal Predictability of Four Major Crop Yields Worldwide by a Hybrid System of Dynamical Climate Prediction and Eco-Physiological Crop-Growth Simulation. Front. Sustain. Food Syst. 4:84. doi: 10.3389/fsufs.2020.00084
Received: 20 December 2019; Accepted: 12 May 2020;
Published: 16 June 2020.
Edited by:
Mariana Benítez, National Autonomous University of Mexico, MexicoReviewed by:
Ilias Travlos, Agricultural University of Athens, GreeceYanus Andrés Dechnik-Vázquez, Federal Electricity Company of México, Mexico
Copyright © 2020 Doi, Sakurai and Iizumi. This is an open-access article distributed under the terms of the Creative Commons Attribution License (CC BY). The use, distribution or reproduction in other forums is permitted, provided the original author(s) and the copyright owner(s) are credited and that the original publication in this journal is cited, in accordance with accepted academic practice. No use, distribution or reproduction is permitted which does not comply with these terms.
*Correspondence: Takeshi Doi, dGFrZXNoaS5kb2kmI3gwMDA0MDtqYW1zdGVjLmdvLmpw
†These authors have contributed equally to this work