 Ambica Paliwal
 Meha Jain
94% of researchers rate our articles as excellent or good
Learn more about the work of our research integrity team to safeguard the quality of each article we publish.
Find out more
ORIGINAL RESEARCH article
Front. Sustain. Food Syst. , 11 March 2020
Sec. Land, Livelihoods and Food Security
Volume 4 - 2020 | https://doi.org/10.3389/fsufs.2020.00025
This article is part of the Research Topic Democratizing Earth Observations-Based Science to Improve Agriculture, Food Security and Resilience, from Village to Globe: Volume I View all 8 articles
Despite recent advances in remote sensing, one of the major constraints that still remains is collecting the ground data needed to calibrate and validate remote sensing algorithms at large spatial and temporal scales. This is particularly challenging when mapping continuous variables such as yield, where calibration data often do not exist at the field-scale and are difficult to obtain through visual interpretation of high-resolution imagery. While crop cut estimates of crop yield are widely used to calibrate satellite yield estimation models, these data are time and cost intensive to collect. In this study, we examine the ability of self-reported yield estimates, which are much faster and easier to collect at large scales, to train satellite yield estimation models. We assess the accuracy of self-reported yield data and identify whether it is possible to increase self-reported accuracy by providing more information to farmers about the study design and potential benefits. Our results showed that farmers' self-reported crop yields were not accurate, and that self-reported crop yields led to inaccurate satellite yield estimation models when used for calibration. We also found that providing more information to farmers about the study design and benefits of satellite yield estimation did not improve self-reported accuracy. These results suggest that even though self-reported yield estimates may be a faster and lower cost way to collect field-level yield estimates, they likely are not an adequate data source to train satellite yield prediction models and should be used with caution.
There is a long history in remote sensing of mapping agricultural characteristics. For example, at regional and global scales, satellite data have been used to map the extent of croplands (Waldner et al., 2016), crop management practices (Bégu et al., 2018), biomass and yield (Lobell et al., 2015; Jain et al., 2016), crop phenology (Duncan et al., 2015), and crop stress (Kannan et al., 2017; Paliwal et al., 2019). Recent advancements in remote sensing, including cloud computing, the increased use of machine learning, and finer spatial, temporal, and spectral resolution data have only increased what is possible to map over the last decade (Ma et al., 2019). However, despite all of these advancements, one of the major constraints that still remains is collecting the ground data needed to calibrate and validate remote sensing algorithms at large spatial and temporal scales (Pe'eri et al., 2013). This is particularly challenging for continuous variables, such as yield and biomass, which typically require on-the-ground estimation compared to categorical variables, which can sometimes be identified remotely through visual inspection of higher-resolution imagery, such as Google Earth (Azzari et al., 2017). Identifying ways to easily collect such ground data could further revolutionize the ability to use satellite data to map agricultural characteristics at large spatial and temporal scales.
In particular, mapping crop yield using satellite data has historically been a data-intensive process. Using satellite data to map yields has been particularly challenging in smallholder systems, where farm sizes are typically <2 ha (Lowder et al., 2016) and management practices are heterogeneous across neighboring fields (Jain et al., 2013). In these systems, it is also challenging to obtain reliable agricultural data from existing data sources to calibrate and validate remote sensing algorithms. Previous studies have used a wide range of calibration data to estimate yield in smallholder systems, including crop model simulations (Burke and Lobell, 2017; Jain et al., 2017; Jin et al., 2019) and field-level crop cut data (Jain et al., 2016). In particular, the gold standard for yield estimation is collecting crop cut data, where portions of the crop are harvested at the end of the growing season, and the grains are removed and weighed in field (CSO, 2007). Such data have been shown to result in the highest yield prediction accuracies when used for calibration of remote sensing products at the field scale in smallholder systems (Jain et al., 2016, 2019). Yet, collecting such crop cut data is very time and resource intensive, constraining the scale at which remote sensing models that are trained using these data can be applied.
An alternative field-level dataset that could be used to train remote sensing algorithms is self-reported yield data. Such data are much faster and easier to collect than crop cut yield data, and still provide the real-world, field-level yield data needed to train satellite yield prediction algorithms. However, there are concerns regarding the reliability of self-reported data (Baumeister et al., 2007), with previous studies finding that farmers' estimations of yield are highly subjective and can be misleading (Carletto et al., 2015). This is because farmers may over- or under-estimate their yields due to intentional and unintentional reasons, including recall bias, a tendency to average productivity over several seasons or fields, and the desire to influence perceived status within a given community (Gourlay et al., 2019; Wahab, 2019). Several studies have used self-reported data to calibrate satellite yield estimation models, and these studies have found that such data led to reduced yield prediction accuracies compared to other types of calibration datasets, including crop cut data (Wahab, 2019).
Identifying ways to increase self-reported accuracy could be extremely beneficial for collecting high-quality, low cost ground data that could be used to calibrate and validate remote sensing algorithms at large spatial and temporal scales. Previous studies have suggested that involving farmers as stakeholders in the research process may be one way to increase self-reported accuracies (Beza et al., 2017). The use of citizen science is one such example where involving farmers has been shown to successfully improve the accuracies of self-reported data (van Etten et al., 2019). In this study, we assess whether providing farmers with more information about the study design and potential study benefits may lead to improved self-reported accuracies. Doing so may help increase the accuracy of self-reported yield data, which may then be used to develop more accurate remote sensing yield estimation models. It is important to note that our intervention only examined the impact of sharing more information about study design with farmers at the end of the growing season, and our results may not apply to other modes of information sharing. We conducted this study in a smallholder wheat farming system with small field sizes (< 0.3 ha) in northeastern India. Specifically, our study aims to answer the following questions:
1. Does increasing the amount of information provided to farmers about the study design and benefits increase self-reported accuracy?
2. How accurate are the self-report yield data from farmers, and what are the drivers of self-reported accuracy?
3. How well can self-reported data be used to calibrate remote sensing models that estimate yield?
The study was conducted in Arrah district, Bihar, India (25.47°N, 84.52°E) in 2015 (Figure 1). Specifically, we focused on an 8 × 16 km2 region where we had access to high-resolution SkySat Imagery from the company Planet (https://www.planet.com/), and we collected ground data from 10 villages distributed across the study area. This region is dominated by smallholder farms (<0.3 ha), which encompass over 80% of the land area (Jain et al., 2016). The primary cropping seasons in this region are the monsoon (kharif) season when most farmers plant rice, and the winter (rabi) season when most farmers plant wheat. Our study focused on the winter cropping season, which spans early November to mid-April (Jain et al., 2016). While most farmers harvest wheat in early to mid-April, sowing dates vary widely across the study region, with some farmers planting as early as mid-November and other farmers planting as late as early January. Previous work has shown that sowing date is strongly associated with wheat yields across this region, with later sowing dates associated with reduced yields due to the negative impacts of end of season heat stress on grain filling (Ortiz-Monasterio et al., 1994; Asseng et al., 2015; Jain et al., 2016).
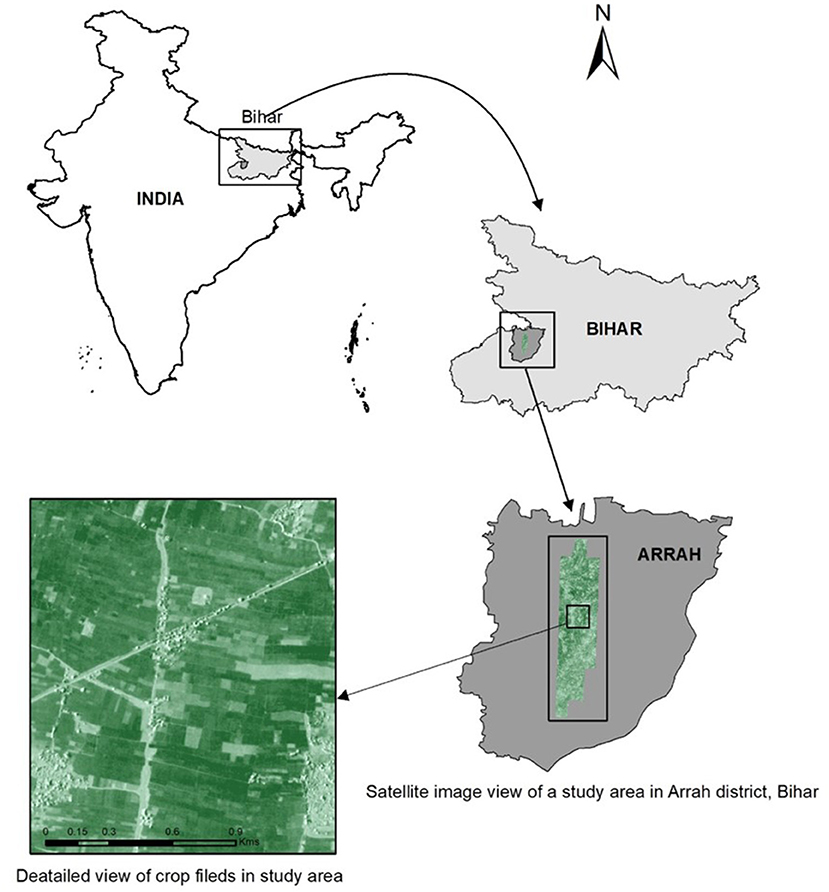
Figure 1. Study area, a region in Arrah district in Bihar, India.
We conducted social surveys with 115 farmers across the study region. To identify these farmers, we selected 115 households at random throughout the study area, and interviewed the head of farming for each household. These farmers were interviewed at two time points, once in February 2015 and once in April 2015. In the first survey, we asked farmers about their wheat management practices, including wheat variety, wheat sowing date, and irrigation access for each of the agricultural plots in which they planted wheat during the 2014–15 winter growing season. To collect self-reported yield information, we conducted an additional survey after wheat was harvested at the end of April 2015. All farmers were interviewed within 3 weeks of harvesting their wheat crop. In this post-harvest survey, we specifically asked farmers questions only about the largest plot in which they planted wheat in 2014–15. We also traveled with each farmer to this field and collected GPS points at the center of the field and at the four corners of the field. All surveys were conducted using paper forms and field enumerators. Consent was obtained following an approved IRB protocol (eProtocol 30648, Stanford University). The specific variables that were collected during both social surveys are detailed in Table S1.
To identify whether providing additional information to farmers improved self-reported accuracies, we conducted an experiment during our April 2015 survey. Farmers were divided into two groups, group 1 (n = 53) and group 2 (n = 62), and each group was provided different levels of information about the study design and potential benefits of the study. To group 1, we provided detailed information about our study objectives, described how the self-reported yield data would be used in conjunction with satellite imagery to map yields, and discussed the benefits of accurate satellite yield models to farmers in the region. We also showed farmers in this group a picture of what can be seen using the high-resolution SkySat imagery. However, to group 2, we provided a simpler study description that did not discuss in detail how satellite yield estimation is done, did not include a picture of what can be seen using high-resolution SkySat data, and provided less detail about the potential benefits of our study. We read the respective paragraph (Table S2) to each farmer depending on whether he/she belonged in group 1 or group 2 at the start of the survey, and then we asked farmers from both groups the same set of questions. Our main variable of interest was self-reported yield, and we asked farmers to report the yield of the specific field that we visited in the unit with which they were most comfortable. Farmers reported yield in local weight units (quintal, mand, or kg) and local area units (katha, bhiga, or acre). We converted all self-reported estimates to consistent units across farmers, kilograms/hectare (kg/ha), using known conversion values for local weight and area units.
Since we were interested in identifying whether providing more information to farmers resulted in improved self-reported accuracies, we required a dataset that represented the “true” yield for each of the farmer's fields. To represent true yield, we obtained a yield map that was produced using SkySat satellite data in a previous study (Jain et al., 2016). This yield map was calibrated using crop cut yield data (detailed in section crop cut data), and the yield map obtained an R2 of 0.33 when validated using crop cut data. While this accuracy may seem moderate, it is in line with other studies that have estimated field-level yields of complex smallholder farming systems (Burke and Lobell, 2017; Jain et al., 2019). An overview of methods used to produce this satellite yield map is provided below, and more details can be found in Jain et al. (2016).
Satellite yield estimates from Jain et al. (2016) were produced using a total of six cloud free images of SkySat satellite imagery acquired on February 18, March 11, March 22, March 23, March 28, and April 6 in 2015. SkySat satellites collect optical multi-spectral imagery at 2-m resolution, and include the blue (0.450–0.515 nm), green (0.515–0.595 nm), red (0.605–0.695 nm), and near infra-red (0.740–0.900 nm) bands. One scene, the March 11 image, was manually geo-referenced using point locations from Google Earth imagery in ArcGIS software. Automated image to image registration from ENVI Software was then used to geo-reference all other images. For each image date, Jain et al. (2016) calculated the green chlorophyll vegetation index (GCVI; Equation 1), as previous studies have shown that GCVI has a linear relationship with wheat leaf area index (Nguy-Robertson et al., 2014). The correlation between GCVI across all dates was then examined, and the March 23 image was removed from all analyses since it was highly correlated with the March 22 image (R > 0.95).
Jain et al. (2016) then used crop cut data (detailed in section crop cut data) to train satellite yield estimation models using a linear regression (Equation 2). This was done by extracting the mean GCVI value for each image date for each field polygon for which they had crop cut data, and the authors then applied the beta coefficients from this model to every pixel in the SkySat imagery to obtain yield estimates for the entire study region. GCVI1 through GCVI5 represent each individual GCVI image date. More details about satellite image preprocessing and yield estimation can be found in Jain et al. (2016).
For this study, we also had access to the crop cut data that were used to calibrate and validate the satellite yield estimation model described in section satellite data from Jain et al. (2016). Specifically, crop cut data were collected from 64 farmers during April 2015, in the same year of our social survey. Unfortunately, these 64 farmers were different from the 115 farmers for which we collected self-reported data, and therefore we were unable to compare crop cut yield estimates with self-reported yield estimates directly. To collect crop cut data, the field team visited each farmer's field at the time of crop harvest and selected three 2 × 1 m2 subplots at random from each farmer's field. Within each of these subplots, the team harvested the crop, removed the grain, and then weighed the grain in field to estimate yields. In addition, they collected five GPS points for each of these fields: one at the center of the field and four in each corner of the field. These GPS points were then used to create polygons that spatially linked the crop cut information with the satellite data. The field team also asked these 64 farmers to complete a short social survey at the time of harvest, which included information about sowing date and wheat variety. More details about the crop cut data can be found in Jain et al. (2016).
We conducted several different analyses to answer the three main questions outlined in this study, which we detail below.
To answer our first question, we compared self-reported yield estimates for each of the 115 fields considered in our study with satellite yield estimates produced using crop cut data from Jain et al. (2016). In order to do this, we first georeferenced each of the 115 fields using the GPS data that we collected for each plot (detailed in section social survey data). Georeferencing was done by overlaying all GPS points on the March 11 SkySat image in ArcGIS. We then examined GPS points collected for each individual field one at a time, and drew a polygon around the visible field boundaries of the field that overlapped most of the GPS points. If the GPS points did not clearly overlap with one field, we did not draw a field polygon for this field. In total, we were able to create polygons for 101 fields out of the 115 fields originally surveyed (50 fields were for group 1, and 51 fields were for group 2). For each of these polygons, we extracted the mean yield estimated by satellite data using the raster package in R project software. Before doing any additional analyses, we also removed any self-reported yield estimates that were unrealistic. Specifically, we removed any self-reported yield values that were <1,000 kg/ha and >6,000 kg/ha, since these were the minimum and maximum yield values that we observed in our crop cut dataset for the region, which is considered the gold standard of yield estimation. This reduced our sample size to 74 fields (33 fields were in group 1, and 41 fields were in group 2. We conducted the power analysis to check the accuracy of our sample size using the pwr package in R project software. When using a “medium” effect sizes (0.5) as defined in previous study (Cohen, 1992), we found that the power of our experiment is 99% after removing extreme self-reported yield values (33 fields in group 1, and 41 fields in group 2). However, with a “small” effect size (0.2), we found the power our experiment is 41%. These 74 data points were used for all subsequent analyses in the paper.
We obtained a measure of self-reported accuracy, which we termed “self-report discrepancy,” by subtracting the self-reported yield from the mean satellite yield for each polygon. To test whether this accuracy value differed based on the amount of information given to farmers about the study design, we conducted a t test with self-reported accuracy as our dependent variable and group (group 1 vs. group 2) as the independent variable (Table S4—Summary statistics).
Next, we summarized overall self-reported accuracy across all farmers using our metric of self-reported accuracy described in section Identifying whether providing information improves self-reported accuracy. We also assessed the accuracy of self-reported yield estimates by identifying whether these estimates could capture the known relationship between sowing date and wheat yields. Specifically, we were interested in identifying whether there was a significant and negative relationship between sowing date and self-reported yield. To quantify whether this relationship exists, we used a linear regression model (Equation 3) and assessed model fit using R2 and whether the beta coefficient on sowing date (β1) was significant and negative.
As a comparison, we also assessed whether this known relationship between sowing date and wheat yield could be detected using crop cut estimates of yield for the 64 fields for which we had crop cut data. To do this, we also used Equation 3, but replaced self-reported yield with crop cut yield as the dependent variable.
Finally, to understand which factors may be significantly associated with self-reported accuracy, we ran a multiple linear regression. We were interested in identifying which socio-economic, management, and yield variables may be associated with whether a farmer is more likely to under or over-report yields on his/her field. For this analysis, we used Equation 4.
Details about each of the independent variables considered in this model can be found in Table S3.
To assess how well self-reported data could be used to calibrate satellite yield estimation models, we estimated wheat yields using SkySat imagery and using self-reported data for calibration. Specifically we used the same Skysat imagery that was used to develop the satellite yield estimation models in Jain et al. (2016; details provided in section Satellite data). We ran a linear regression model where we regressed self-reported yields (kg/ha) on GCVI for each image date (Equation 5), where GCVI1 to GCVI5 represent the GCVI value for each field and each satellite image date.
The beta coefficients from this linear model were then applied to each pixel in our SkySat imagery to estimate yield across the entire study region.
We conducted two analyses to validate the satellite yield estimation model that was calibrated using self-reported data. First, for the 64 crop cut polygons, we compared our satellite estimated yield with crop cut yield since crop cuts are considered to be the gold standard for estimating yields in field. Second, we assessed whether satellite yield estimates were able to capture the known relationship between later sowing date and lower wheat yields for the 74 fields from our self-reported survey, and the 64 fields from the crop cut survey. As a comparison, we also assessed whether we could detect this known relationship using the satellite yield estimates produced in Jain et al. (2016), which were calibrated using crop cut yield data. To do this analysis, we used a linear regression model (Equation 3, with satellite estimated yield replacing self-reported yield as the dependent variable) and assessed model fit using R2 and whether the beta coefficient on sowing date (β1) was significant and negative.
We found that providing detailed information about the study design and benefits did not significantly impact self-reported accuracy. The t-test result showed that there was no significant difference in self-reported accuracy based on whether farmers were in group 1 or group 2 (p = 0.51).
Since there was no difference in self-reported accuracy between farmers who were in group 1 vs. group 2, we used data from all farmers together for all subsequent analyses. When assessing the self-reported accuracy of yield across all farmers, our results show that 73% of farmers in the region under-reported their yields (Figure 2). On average we found that farmers under-reported their yields by −568 kg/ha. We also compared average self-reported yields in our study region with those of crop cuts to see whether we similarly found underreporting of yields using crop cuts instead of satellite data for yield comparison. We find that the average yield for self-reported data is 2,082 and 2,713 kg/ha for crop cut data in study region.
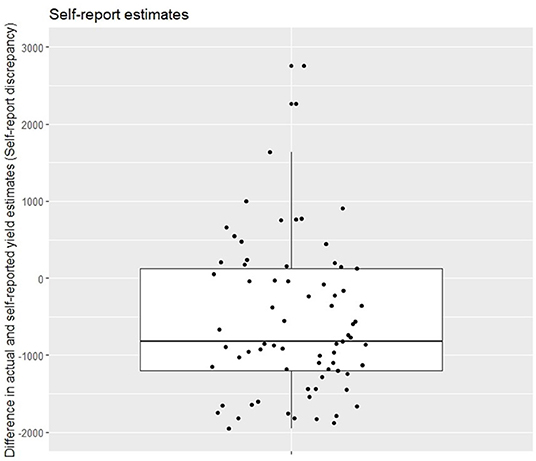
Figure 2. Boxplot showing the accuracy of self-reported yield data when compared to satellite yield estimates of yield for the same field. Bolded line represents the median value, edges of the box represents the 25 and 75% percentile, and the whiskers represent +/– 1.5 of the interquartile range.
We next examined whether self-reported yield data were able to capture the known relationship between late sowing and reduced wheat yields (Figure 3). We find that the self-reported yield estimates were unable to capture this relationship (Figure 3A), however the crop cut yield estimates were able to capture this relationship (Figure 3B). This is represented by a very low R2 when using self-reported yield estimates (R2 = 0.003) and an insignificant beta coefficient on sowing date in our linear regression (p = 0.8). Crop cut estimates of yield, on the other hand, had a higher R2 value (R2 = 0.31) and a significant beta coefficient (p = 0.0003).
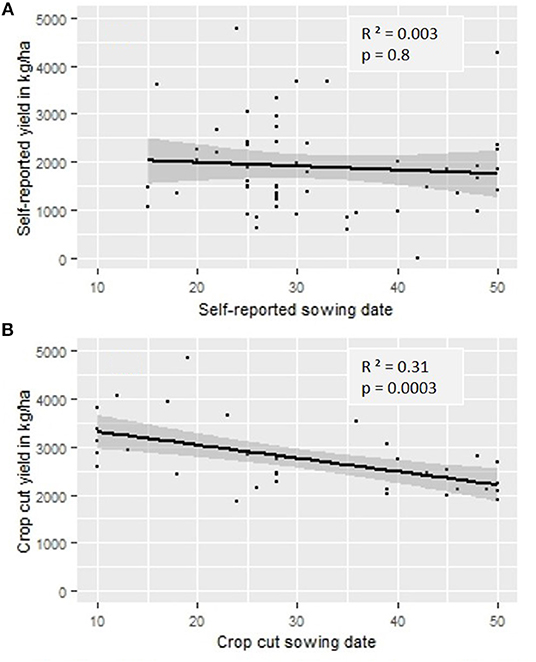
Figure 3. Relationship between sowing date and self-reported yield (A) and crop cut yield (B). R2 and p values from linear regressions are also reported. The gray band around each regression line represents the standard error.
Finally we assessed which socio-economic, management, and biophysical variables influence self-reported accuracy. Among all the factors that we considered in our regression analysis (Table S3), plot yield [as measured using the satellite yield estimates from Jain et al. (2016)] was the only factor that showed a significant relationship with self-reported accuracy (p = 0.000005; Table 1). Specifically, we found that self-reported accuracy was negatively associated with higher plot yields. This suggests that farmers who had higher yields were more likely to under-report their yields in our social survey.
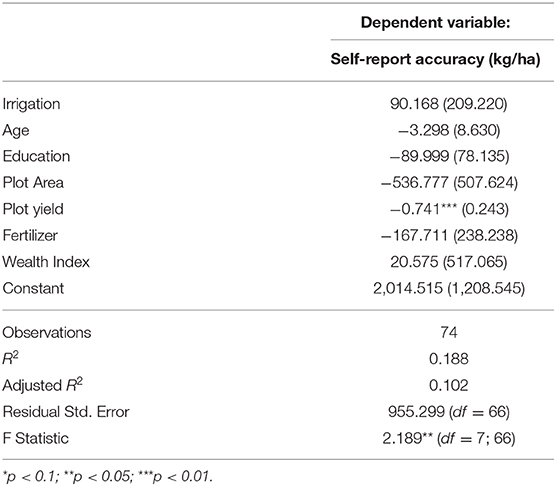
Table 1. Multiple linear regression results for the socio-economic, management, and biophysical variables associated with self-report accuracy (kg/ha).
To assess the accuracy of our satellite yield estimation model that was calibrated using self-report data, we compared satellite yield estimates with crop cut yield estimates for the 64 fields for which we had crop cut data. We found a weak and insignificant relationship between these two variables (R2 = 0.05, p = 0.15; Figure 4). This suggests that our satellite yield estimates were unable to capture the variation in true field-level yields as estimated using crop cut data.
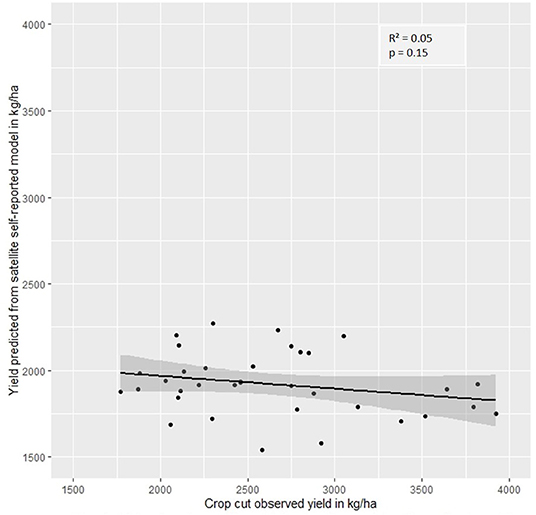
Figure 4. Predicted yields using the satellite yield estimation model calibrated using self-reported data vs. crop cut observed yields. The R2 and p values from a linear regression are reported. The gray band around the regression line represents standard error.
We also assessed whether our satellite yield estimates calibrated using self-reported data were able to capture the known relationship between late sowing and lower wheat yields for the 74 fields for which we collected self-reported data, and for the 64 fields for which we collected crop cut data. As a comparison, we conducted this same set of analyses using satellite yield estimates from Jain et al. (2016), which were calibrated using crop cut data. We found that we were able to detect the expected negative relationship between sowing date and yield when using satellite yield estimates calibrated using crop cut data (Figures 5A,C). However, we obtained an unexpected positive relationship between sowing date and yield when using satellite yield estimates calibrated using self-reported data (Figures 5B,D).
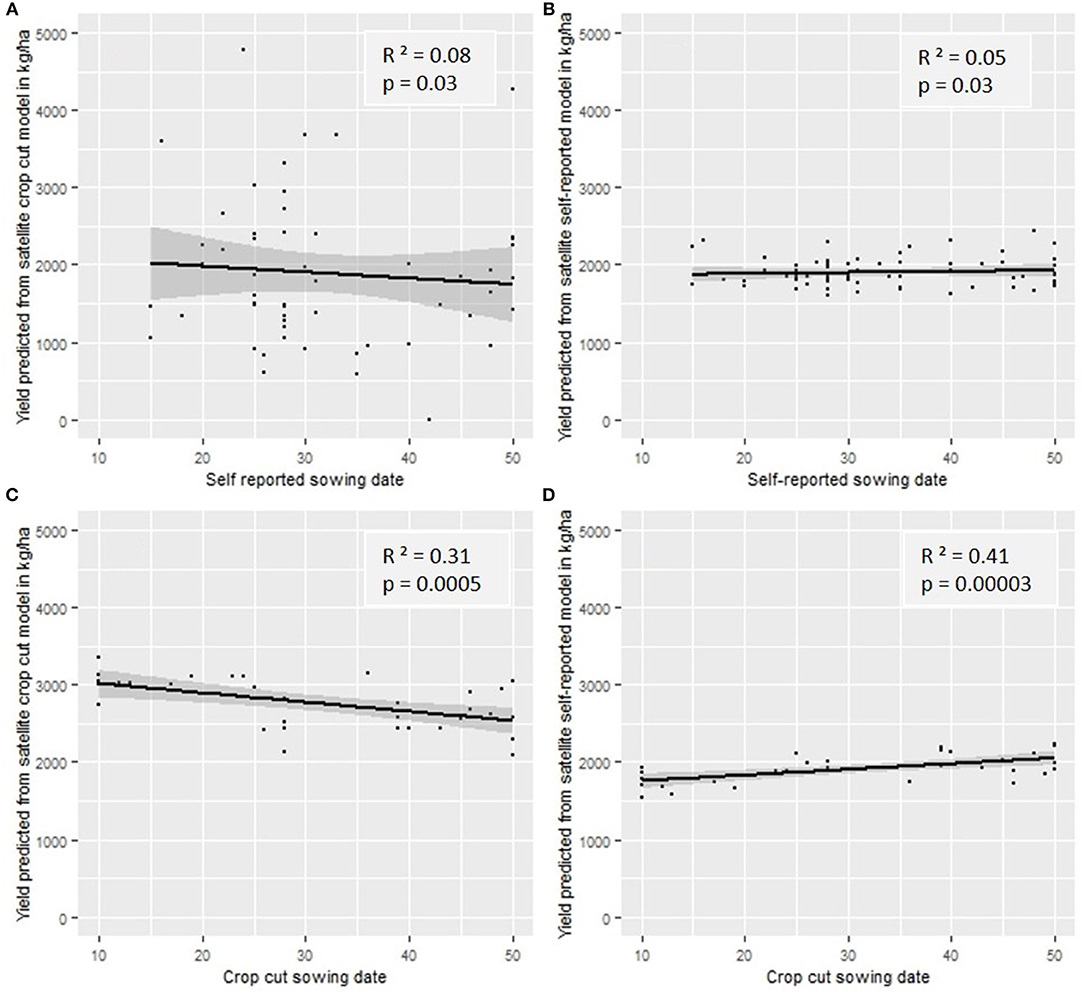
Figure 5. Sowing date vs. yield for self-reported calibrated and crop cut calibrated yield estimation models. We present four panels: sowing date vs. yield predicted from satellite data calibrated using crop cut data (A,C), and sowing date vs. yield predicted from satellite data calibrated using self-reported data (B,D). The R2 and p values from each linear regression are reported along with standard error (represented by the gray band around each regression line).
In this study, we examined the accuracy of self-reported yield estimates and whether there are ways to increase self-reported accuracy in order to improve satellite yield estimation models that are calibrated using such data. This research question is critical given that one of the main constraints to mapping yield using satellite data is obtaining appropriate calibration data that is sufficiently low cost to collect across large spatial and temporal scales. Our results showed that farmers' self-reported yields were not accurate, and that self-reported yields led to inaccurate satellite yield estimation models when used for calibration. We also found that providing more information to farmers about the study design and benefits of satellite yield estimation did not improve self-reported accuracy. These results suggest that even though self-reported yield data can be collected with ease compared to typical calibration datasets, such as crop cut yield estimates, using self-reported data to calibrate remote sensing algorithms should be done with caution.
Overall, we found that the majority of farmers (73%) under-reported their yield, with an under-reporting of −568 kg/ha on average. In addition, we found that self-reported yields are likely inaccurate as they were unable to detect the known relationship between later sowing and lower wheat yields (Erenstein and Laxmi, 2008). Previous studies in sub-Saharan Africa have similarly found that farmers' self-reported yields are inaccurate (Lobell et al., 2018; Gourlay et al., 2019; Wahab, 2019), though several of these studies found that farmers over-reported their yields by up to 200% (Lobell et al., 2018; Gourlay et al., 2019). There are several unintentional and intentional reasons why self-reported yields in our study may be inaccurate. Unintentional reasons include that farmers often report yields in local weight (quintal, mand) and area (katha, bhiga) units, and errors may arise from the conversion of non-standard units to standard units during reporting (Fermont and Benson, 2011). In addition, recall bias could contribute to inaccurate self-reported estimates as human memory is subject to memory constraints (Gourlay et al., 2019). However, we do not believe that recall bias likely played a large role in our study given that all farmers were interviewed shortly after harvesting their crop (within 3 weeks). Finally, farmers in our study region often have multiple plots of land, and it may be challenging for farmers to report the specific yield of an individual plot since harvesting is usually done across all fields around the same time. Intentional reasons could include that farmers perceive that yield is a proxy for profit, and farmers may not report crop outputs that have been used as payments (Wahab, 2019). Alternatively, it is possible that farmers may under-report yield if they expect to receive compensation or benefits for having low yielding fields. Unfortunately, it is not possible for us to disentangle the relative importance of these potential causes of error, and future work should examine which of these potential sources may be the main drivers of inaccurate self-reported yields. It is important to note that our assessment that self-reported yields are inaccurate is based on comparison with satellite yield estimates, which also have their own source of error. Future work should compare self-reported data with crop cut data, the gold standard for yield estimation, from the same field.
Our study also suggests that using self-reported yield data to calibrate satellite yield estimation models leads to inaccurate satellite yield estimates. We found that these satellite yield estimates had a low R2 (0.05) and a non-significant relationship with observed crop cut yields. Furthermore, the relationship between sowing date and wheat yield was the opposite of what was expected, with later sowing dates associated with higher yields. These findings are corroborated by those of previous studies (e.g., Jain et al., 2016), which found that satellite yield estimation is less accurate when using self-reported yield estimates as calibration as opposed to other types of calibration data, including crop cuts and crop model simulations. One potential reason for this unexpected positive relationship is because farmers who had higher yields were more likely to under-report their yields, and these farmers were also the ones who were more likely to sow their wheat earlier. Thus, it is possible that higher under-reporting of yields for those farmers who sow wheat earlier may have led to the counterintuitive positive relationship between sowing date and yield. We believe that this positive relationship is inaccurate because we were able to capture the known association between later sowing and lower wheat yields when using crop cut yields or satellite yield estimates that were calibrated using crop cut yields. These results suggest that even though self-reported yield estimates may be a faster and lower cost way to collect field-level yield estimates, they are likely not an adequate data source to train accurate satellite yield prediction models. We, however, test the ability of self-reported data to serve as calibration data by examining satellite yield prediction accuracy at the field scale. Yet it is possible that self-reported yield data may be adequate to train satellite yield prediction models at coarser scales; for example, if one were interested in estimating yield variation using satellite data at the village or block level, it is possible that village or block-level differences in self-reported data would be accurate enough to train such models. Future work should examine whether self-reported data may be adequate for training satellite prediction models at coarser than field scales.
Though previous studies have suggested that providing more information to participants may increase self-reported accuracy, we did not find that to be the case in our study. Instead, we found that self-reported accuracy was statistically similar regardless of whether or not farmers received detailed information about how their data would be used for satellite yield estimation and about potential study benefits. These findings support a previous study where authors did not find a significant difference in the accuracy of self-reported responses when study design explanations were framed differently (Jerit et al., 2016). It is important to note, however, that our intervention was limited. Our sample size was relatively small and we only engaged farmers in our study design at the end of our study. It is possible that alternative methods of farmer involvement that occur over longer time periods, such as crowd sourcing and citizen science, may increase farmer engagement and improve self-reported accuracy (Beza et al., 2017; van Etten et al., 2019). For example, previous studies have shown that farmers in smallholder systems can be motivated to participate as citizen scientists throughout a research project by providing benefits to the farmers, including information sharing, agronomic advice, capacity building, and new seed varieties (Beza et al., 2017). Future work should examine whether such efforts to increase farmer engagement in data collection improve self-reported accuracies.
While we found that self-reported data were inaccurate for the purposes of this study, which was to calibrate satellite yield estimation models, it is important to note that we do not question the authenticity of self-reported data in general. Self-reported yield data have been widely used in qualitative and quantitative research to examine the drivers of yield variation across farmers, and this research has produced important and accurate results (Fermont and Benson, 2011; Jain et al., 2015; Sapkota et al., 2016). In these studies, yield information is often collected as an average value across multiple plots, as opposed to the method used in our study which was to estimate the exact yield for a single field. It is possible that these differences in methodology result in the increased inaccuracy in self-reported data found in our study. However, when creating remote sensing algorithms to map yield at the field scale, it is critical to use field-level yield data for calibration. Thus, it is important for future work to identify ways to increase the accuracy of self-reported yield estimates at the plot-level.
In conclusion, we found that our self-reported yield estimates were inaccurate and that providing more information to farmers did not increase self-reported accuracies. In addition, our results highlight that field-level self-reported yield estimates lead to inaccurate satellite yield estimation when used for calibration. This is unfortunate given that self-reported yield estimates are relatively easy and low cost to collect, particularly in comparison to other typically used calibration datasets, such as crop cuts. We acknowledge that the information intervention that we implemented in this study was limited, and encourage future work to identify if alternative modes of farmer engagement, including crowd sourcing and citizen science, may lead to improved self-reported accuracy and satellite yield estimation at large spatial and temporal scales. Furthermore, future work should examine the generalizability of the impact of information sharing on self-reported accuracies by conducting similar studies in other farming systems across the globe.
The datasets generated for this study are available on request to the corresponding author.
MJ designed the study. AP conducted all analyses and wrote the first draft of the manuscript. AP and MJ edited the manuscript.
This study was supported by National Science Foundation SEES Postdoctoral Fellowship (Award No. 1415436 to MJ).
The authors declare that the research was conducted in the absence of any commercial or financial relationships that could be construed as a potential conflict of interest.
We would like to thank the CIMMYT-CSISA team that helped collect the field data used in this work, Amir Jina, Christina Seybolt, and Anja Tolonen for helpful discussions and feedback on the social survey design, and the National Science Foundation SEES Postdoctoral Fellowship (Award No. 1415436 to MJ) for funding this work.
The Supplementary Material for this article can be found online at: https://www.frontiersin.org/articles/10.3389/fsufs.2020.00025/full#supplementary-material
Asseng, S., Ewert, F., Martre, P., Rötter, R. P., Lobell, D. B., Cammarano, D., et al. (2015). Rising temperatures reduce global wheat production. Nat. Climate Change 5, 143–147. doi: 10.1038/nclimate2470
Azzari, G., Jain, M., and Lobell, D. B. (2017). Towards fine resolution global maps of crop yields: testing multiple methods and satellites in three countries. Remote Sens. Environ. 202, 129–141. doi: 10.1016/j.rse.2017.04.014
Baumeister, R. F., Vohs, K. D., and Funder, D. C. (2007). Psychology as the science of self-reports and finger movements: whatever happened to actual behavior? Perspect. Psychol. Sci. 2, 396–403. doi: 10.1111/j.1745-6916.2007.00051.x
Bégu,é, A., Arvor, D., Bellon, B., Betbeder, J., De Abelleyra, D., and Ferraz, P. D., et al. (2018). Remote sensing and cropping practices: a review. Remote Sens. 10:99. doi: 10.3390/rs10010099
Beza, E., Steinke, J., van Etten, J., Reidsma, P., Fadda, C., Mittra, S., et al. (2017). What are the prospects for citizen science in agriculture? Evidence from three continents on motivation and mobile telephone use of resource-poor farmers. PLoS ONE 12:e0175700. doi: 10.1371/journal.pone.0175700
Burke, M., and Lobell, D. B. (2017). Satellite-based assessment of yield variation and its determinants in smallholder African systems. Proc. Natl. Acad. Sci. U.S.A. 114, 2189–2194. doi: 10.1073/pnas.1616919114
Carletto, C., Jolliffe, D., and Banerjee, R. (2015). From tragedy to renaissance: improving agricultural data for better policies. J. Dev. Stud. 51, 133–148. doi: 10.1080/00220388.2014.968140
CSO (2007). Manual on Area and Crop Production Statistics. ed. C.S. Organization. New Delhi: CSO-M-AG-01 ed.
Duncan, J., Dash, J., and Atkinson, P. (2015). The potential of satellite-observed crop phenology to enhance yield gap assessments in smallholder landscapes. Front. Environ. Sci. 3:56. doi: 10.3389/fenvs.2015.00056
Erenstein, O., and Laxmi, V. (2008). Zero tillage impacts in India's rice–wheat systems: a review. Soil Tillage Res. 100, 1–14. doi: 10.1016/j.still.2008.05.001
Fermont, A., and Benson, T. (2011). Estimating Yield of Food Crops Grown by Smallholder Farmers: A Review in the Uganda Context. IFPRI Discussion Papers No. 1097. Washington, DC: International Food Policy Research Institute (IFPRI).
Gourlay, S., Kilic, T., and Lobell, D. B. (2019). A new spin on an old debate: errors in farmer-reported production and their implications for inverse scale - productivity relationship in Uganda. J. Dev. Economics 141:102376. doi: 10.1016/j.jdeveco.2019.102376
Jain, M., Balwinder, S., Rao, P., Srivastava, A. K., Poonia, S., Blesh, J., et al. (2019). The impact of agricultural interventions can be doubled by using satellite data. Nat. Sustain. 2, 931–934. doi: 10.1038/s41893-019-0396-x
Jain, M., Mondal, P., DeFries, R. S., Small, C., and Galford, G. L. (2013). Mapping cropping intensity of smallholder farms: a comparison of methods using multiple sensors. Remote Sens. Environ. 134, 210–223. doi: 10.1016/j.rse.2013.02.029
Jain, M., Naeem, S., Orlove, B., Modi, V., and DeFries, R. S. (2015). Understanding the causes and consequences of differential decision-making in adaptation research: adapting to a delayed monsoon onset in Gujarat, India. Glob. Environ. Change 31, 98–109. doi: 10.1016/j.gloenvcha.2014.12.008
Jain, M., Singh, B., Srivastava, A. A. K., Malik, R. K., McDonald, A. J., and Lobell, D. B. (2017). Using satellite data to identify the causes of and potential solutions for yield gaps in India's Wheat Belt. Environ. Res. Lett. 12:094011. doi: 10.1088/1748-9326/aa8228
Jain, M., Srivastava, A. K., Balwinder-Singh, J., McDonald, R. K., Royal, A., et al. (2016). Mapping smallholder wheat yields and sowing dates using micro-satellite data. Remote Sens. 8:860. doi: 10.3390/rs8100860
Jerit, J., Barabas, J., Pollock, W., Banducci, S., Stevens, D., and Schoonvelde, M. (2016). Manipulated vs. measured: using an experimental benchmark to investigate the performance of self-reported media exposure. Commun. Methods Measures 10, 99–114. doi: 10.1080/19312458.2016.1150444
Jin, Z., Azzari, G., You, C., Di Tommaso, S., Aston, S., Burke, M., et al. (2019). Smallholder maize area and yield mapping at national scales with Google Earth Engine. Remote Sens. Environ. 228, 115–128. doi: 10.1016/j.rse.2019.04.016
Kannan, E., Paliwal, A., and Sparks, A. (2017). “Chapter 3 - Spatial and Temporal Patterns of Rice Production and Productivity,” in The Future Rice Strategy for India, eds. S. Mohanty, P. G. Chengappa, Mruthyunjaya, J. K. Ladha, S. Baruah, E. Kannan, and A.V. Manjunatha (London: Academic Press), 39–68. doi: 10.1016/B978-0-12-805374-4.00003-8
Lobell, D. B., Azzari, G., Burke, M., Gourlay, S., Jin, Z., Kilic, T., et al. (2018) Eyes in the Sky, Boots on the Ground: Assessing Satellite- Ground-based Approaches to Crop Yield Measurement and Analysis in Uganda (English). Policy Research Working Paper No. WPS 8374. Washington, DC: World Bank Group. Available online at: http://documents.worldbank.org/curated/en/556261522069698373/Eyes-in-the-sky-boots-on-the-ground-assessing-satellite-and-ground-based-approaches-to-crop-yield-measurement-and-analysis-in-Uganda
Lobell, D. B., Thau, D., Seifert, C., Engle, E., and Little, B. (2015). A scalable satellite-based crop yield mapper. Remote Sens. Environ. 164, 324–333. doi: 10.1016/j.rse.2015.04.021
Lowder, S. K., Skoet, J., and Raney, T. (2016). The number, size, and distribution of farms, smallholder farms, and family farms worldwide. World Dev. 87, 16–29. doi: 10.1016/j.worlddev.2015.10.041
Ma, L., Liu, Y., Zhang, X., Ye, Y., Yin, G., and Johnson, B. A. (2019). Deep learning in remote sensing applications: a meta-analysis and review. ISPRS J. Photogrammetr. Remote Sens. 152, 166–177. doi: 10.1016/j.isprsjprs.2019.04.015
Nguy-Robertson, A. L., Peng, Y., Gitelson, A. A., Arkebauer, T. J., Pimstein, A., Herrmann, I., et al. (2014). Estimating green LAI in four crops: potential of determining optimal spectral bands for a universal algorithm. Agricult. Forest Meteorol. 192–193, 140–148. doi: 10.1016/j.agrformet.2014.03.004
Ortiz-Monasterio, R., J. I., Dhillon, S. S., and Fischer, R. A. (1994). Date of sowing effects on grain yield and yield components of irrigated spring wheat cultivars and relationships with radiation and temperature in Ludhiana, India. Field Crops Res. 37, 169–184. doi: 10.1016/0378-4290(94)90096-5
Paliwal, A., Laborte, A., Nelson, A., and Singh, R. K. (2019). Salinity stress detection in rice crops using time series MODIS VI data. Int. J. Remote Sens. 40, 8186–8202. doi: 10.1080/01431161.2018.1513667
Pe'eri, S., McLeod, A., Lavoie, P., Ackerman, S., Gardner, J., and Parrish, C. (2013). Field calibration and validation of remote-sensing surveys. Int. J. Remote Sens. 34, 6423–6436. doi: 10.1080/01431161.2013.800655
Sapkota, T. B., Jat, M. L., Jat, R. K., Kapoor, P., and Stirling, C. (2016). “Yield Estimation of Food and Non-food Crops in Smallholder Production Systems,” in Methods for Measuring Greenhouse Gas Balances and Evaluating Mitigation Options in Smallholder Agriculture, eds T. S. Rosenstock, M. C. Rufino, K. Butterbach-Bahl, L. Wollenberg, and M. Richards (Cham: Springer International Publishing), 163–174. doi: 10.1007/978-3-319-29794-1_8
van Etten, J., de Sousa, K., Aguilar, A., Barrios, M., Coto, A., Dell'Acqua, M., et al. (2019). Crop variety management for climate adaptation supported by citizen science. Proc. Natl. Acad. Sci. U.S.A. 116, 4194–4199. doi: 10.1073/pnas.1813720116
Wahab, I. (2019). In-season plot area loss and implications for yield estimation in smallholder rainfed farming systems at the village level in Sub-Saharan Africa. Geo J. 144, 45–56. doi: 10.1007/s10708-019-10039-9
Keywords: crop yield, self-reported, smallholder system, high-resolution satellite, agriculture
Citation: Paliwal A and Jain M (2020) The Accuracy of Self-Reported Crop Yield Estimates and Their Ability to Train Remote Sensing Algorithms. Front. Sustain. Food Syst. 4:25. doi: 10.3389/fsufs.2020.00025
Received: 28 November 2019; Accepted: 24 February 2020;
Published: 11 March 2020.
Edited by:
Molly E. Brown, University of Maryland, United StatesReviewed by:
Markus Enenkel, Harvard University, United StatesCopyright © 2020 Paliwal and Jain. This is an open-access article distributed under the terms of the Creative Commons Attribution License (CC BY). The use, distribution or reproduction in other forums is permitted, provided the original author(s) and the copyright owner(s) are credited and that the original publication in this journal is cited, in accordance with accepted academic practice. No use, distribution or reproduction is permitted which does not comply with these terms.
*Correspondence: Ambica Paliwal, YW1iaWNhQHVtaWNoLmVkdQ==
Disclaimer: All claims expressed in this article are solely those of the authors and do not necessarily represent those of their affiliated organizations, or those of the publisher, the editors and the reviewers. Any product that may be evaluated in this article or claim that may be made by its manufacturer is not guaranteed or endorsed by the publisher.
Research integrity at Frontiers
Learn more about the work of our research integrity team to safeguard the quality of each article we publish.