Corrigendum: Using a Crop Modeling Framework for Precision Cost-Benefit Analysis of Variable Seeding and Nitrogen Application Rates
 Gabriel McNunn
 Emily Heaton
 Sotirios Archontoulis
 Mark Licht
 Andy VanLoocke
- Department of Agronomy, Iowa State University, Ames, IA, United States
A key goal of precision agriculture is to achieve the maximum crop yield while minimizing inputs and loses from cropping systems. The challenge for precision agriculture is that these factors interact with one another on a subfield scale. Seeding density and nitrogen (N) fertilizer application rates are two of the most important inputs influencing agronomic, economic and environmental outcomes in cropping systems including yield, return on investment (ROI), and nitrate (NO3−) leaching. Here a cropping system model framework is used to predict site-specific subfield optimum seeding density and (N) fertilizer application rates based on publicly available data sources. The framework is used estimate differences in yield, ROI, NO3− leaching, and N2O emissions corresponding with economic optimum (maximum ROI) and agronomic optimum (maximum yield) inputs. The framework couples the process-based APSIM cropping system model with the SSURGO soils database, Daymet weather data service, land grant university estimates of crop production costs and commodity price estimates, and the R statistics software. Framework performance was evaluated using multiple years of precision yield monitor data obtained from a conventionally managed continuous maize (Zea mays L.) cropping system field located in north central Iowa on which varying N-fertilizer rates were applied. Subfield model estimates of crop yield were sensitive to initial conditions related to historical management of the field and had an r2 = 0.65 and a root mean square error of 1645.0 kg ha−1. A site-specific application of the framework comparing economic optimum seeding density and N-fertilizer rates with agronomic optimum values estimated an average ROI benefit of 7.2% as well as an average NO3− leaching and N2O emissions reductions of 2.5 and 7.6 kg ha−1, respectively. However, in a minority of cases NO3− leaching was greater at the economic optimum, indicating that managing to maximize ROI rather than yield may not always reduce environmental impacts. Our results suggest that managing cropping systems for the economic optimum is plausible using publicly available data with our framework and will likely lead to improved environmental outcomes.
Introduction
Optimizing the use of input resources in agricultural land management is critical to maintaining sustainable and profitable cropping systems. However, farm fields are characterized by subfield variability linked to soil properties, topography, competition with pests and weeds, as well as other factors that directly or indirectly influence plant health. This spatial variability leads to over- and under-fertilization in different parts of the field when using uniform seeding densities and nitrogen (N) fertilizer rates. Areas where N-fertilizer is applied in excess of crop demand are often correlated with higher susceptibility to nitrate (NO3−) leaching, nitrous oxide (N2O) emissions, and other environmental losses, while under-fertilized areas may result in limited crop productivity, lost opportunity for profit, and decreased economic return (Link et al., 2006; Basso et al., 2016). Variable rate technology (VRT) provides a mechanism for varying the allocation of input resources. In maize (Zea mays L.) cropping systems seed density and N-fertilizer are two of the most important decision criteria influencing yield, profitability, and nutrient losses to the environment (Licht et al., 2017; Morris et al., 2018). Yet, making informed subfield seeding and N-fertilizer decisions that maximize return on investment (ROI) and minimize environmental impacts is often difficult without an abundance of site-specific data spanning multiple years and weather conditions (Morris et al., 2018). Consequently, modest increases in ROI are reported from the use of VRT and adoption has remained relatively limited (28% of US maize hectares) compared to other precision agriculture technologies such as yield monitors and GPS guidance systems (70 and 54% of US maize hectares, respectively, Schimmelpfennig, 2016).
A number of approaches have been used to predict economically optimal N-fertilizer application rates (EONR) including yield goal assessments, pre-plant and pre-sidedress soil NO3− tests, crop canopy sensing, and maximum return to N calculators based on regionally specific empirical N-fertilizer rate trials (Sawyer and Nafziger, 2005; Puntel et al., 2016, 2019; for a review see Morris et al., 2018). Additionally, studies have also attempted to quantify optimum site-specific seed densities (Licht et al., 2017), which may represent a more economically impactful management change in many cropping systems compared to changes in nutrient applications. Variable rate zones defining different application rates have been generated using precision agriculture data sources including yield monitor maps (Adamchuk et al., 2004; Basso et al., 2016; Maestrini and Basso, 2018), remotely sensed data (Hong et al., 2006; Basso et al., 2016; Gao et al., 2018; Jin et al., 2019), gridded soil sampling (Fleming et al., 2000), digital soil maps (Bobryk et al., 2016), topography (Long et al., 2015; Walters et al., 2017), and real-time optical sensors (Raun et al., 2002; Tremblay et al., 2009; Kitchen et al., 2010; Stefanini et al., 2018).
However, large uncertainty and financial risk exists with the prediction of EONR and economic optimum seed rate (EOSR) across multiple years, particularly at field-to-subfield spatial scales (Licht et al., 2017; Puntel et al., 2018). Uncontrollable factors impacting N-cycle dynamics and crop uptake, including temperature and precipitation event timing and intensity, make accurate EONR and EOSR difficult. Additionally, crop yields are not linearly related to seeding densities due to inter-plant interactions and competition which has been demonstrated to decrease yields beyond certain plant population (i.e., plants m−2) rates (Woli et al., 2014). This warrants a systems-based approach for determining economically optimum seeding densities and N-fertilizer rates that are capable of predicting crop yields, N-dynamics, and environmental losses based on the complex interaction between crops, weather conditions, soil properties, and land management practices (Banger et al., 2017).
Simulation models have previously been used to predict spatially-explicit nutrient losses (Paz et al., 1999; Holland and Schepers, 2010; Solie et al., 2012) as well as EONR and EOSR. Commercial tools offering prescription management recommendations and in-season N-fertilizer recommendations such as Adapt-N (http://www.adapt-n.com), Encirca (https://www.pioneer.com/home/site/us/encirca/), and Climate FieldView (https://climate.com) incorporate real-time data as well as local soil and crop management factors. However, these models and tools are typically conceived for in-season N-management decisions during crop growth based on historical and predicted weather data. Such tools have been demonstrated to improve resource use-efficiency and yield (Sela et al., 2016), but rely on non-publicly available data and algorithms.
The goal of this study was to develop an automated predictive framework for estimating site-specific, subfield-scale economic optimum combinations of seeding densities and N-fertilizer rates using publicly available, spatially-explicit data and models. The Agricultural Production Systems sIMulator (APSIM; Holzworth et al., 2014) crop model was coupled with the SSURGO soils database, Daymet weather data service, and public financial data to create a spatially explicit modeling framework for estimating yield and ROI responses based on varying combinations of seeding densities and N-fertilizer rates for a given cropping system field. Outputs of the APSIM analyses for all seeding and N-fertilizer combinations are then aggregated and processed using the R statistical package to identify the agronomic and economic optimum input combinations as well as corresponding differences in environmental outcomes such as NO3− leaching and soil N2O emissions. Therefore, the framework may be used in making more informed subfield seeding and N-management decisions by weighting corresponding economic outcomes with potential environmental risks. The specific objectives of this study were to: (1) Evaluate the accuracy of the model simulations at a subfield spatial scale; (2) Evaluate modeled subfield ROI responses to variable management conditions based on experimental observations; and (3) Quantify differences in ROI, NO3− leaching, and soil N2O emissions between agronomic and economic optimum inputs. Similar frameworks linking public soils and weather data with environmental models (including APSIM) have been implemented (Zhang et al., 2010; Brandes et al., 2018; Jin et al., 2019) and found support for individual precision management options in terms of economic and environmental factors. The novel component of our analysis is that we developed a system for guiding subfield management decisions based on multiple economic cost drivers (seed and N-fertilizer inputs) that directly influence potential yield (Al-Kaisi and Yin, 2003) and interact with subsequent environmental performance and profitability.
Methods
Integrated Modeling Approach
The model framework couples APSIM (Holzworth et al., 2014) with the SSURGO soils database and Daymet weather data service to simulate subfield soil-specific, cropping system processes for a user defined field (Figure 1; Table 1). Historical crop production cost estimates and commodity prices obtained from Iowa State University Extension and Outreach Ag Decision Maker Historical Costs of Crop Production (Johanns and Plastina, 2019) were added to the framework for converting predicted yields to profit and ROI. Based on a geospatial field boundary, the framework identifies all subfield SSURGO soils within the field, retrieves daily historical weather data, and executes APSIM to simulate multiple seeding density and N-fertilizer rate combinations. Output from APSIM is then aggregated to a centralized database and processed using an R script to identify both the economic and agronomic optimum (defined as the maximum ROI and yield, respectively) combinations of input resources for all subfield soil types.
FIGURE 1
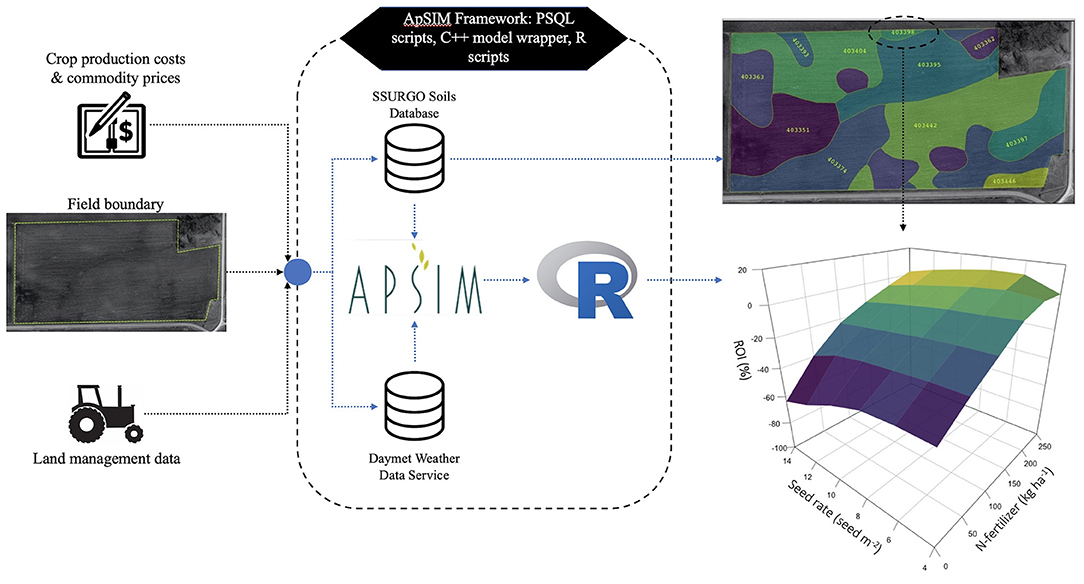
Figure 1. Data flow through the model framework, which automates the parameterization of the APSIM model for all SSURGO soils within a specified cropping system field boundary and estimates economic and environmental responses to varying management combinations for each soil.
TABLE 1
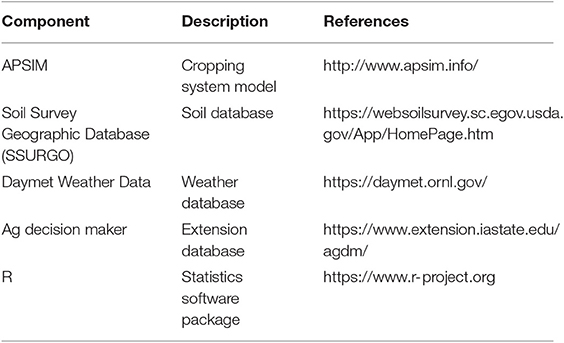
Table 1. Framework components and data sources.
APSIM Cropping Systems Model
The APSIM model is composed of several modules that enable the simulation of agricultural systems based on plant, animal, soil, climate, and management interactions. In this case, the framework incorporated APSIM version 7.7 modules for maize growth, soil water dynamics, soil and surface organic matter dynamics, and crop management rules (Holzworth et al., 2014). The maize crop growth module simulates maize growth and development of different cultivars on a daily time-step based on temperature, precipitation, solar radiation, water and nitrogen availability, soil properties, and land management practices. The model separates crop phenology into several phases, the duration of each dependent on daily temperature, water availability, N stress, and carbon (C) availability. Daily biomass increases are calculated as the minimum of two model estimates representing light-limited and water-limited productivity conditions, respectively. Daily biomass gain predicted by the model is partitioned into root, stem, leaf, and grain components depending on the plant stage of growth. In addition to the impact of N-fertilizer application rates on plant N availability within the soil profile, seeding density, and depth influence simulated leaf area index and subsequent biomass production and grain yield. APSIM has previously been used and validated in several studies similar to our cropping system to estimate crop productivity responses to varying levels of N-fertilizer rates (Puntel et al., 2016, 2018; Martinez-Feria et al., 2018).
Model Inputs and Data Sources
The SSURGO soils database contains geospatially explicit soil types and corresponding physical soil properties across U.S. territories. To identify soils within a specific field, the field boundary is intersected with the SSURGO map unit polygon data layer stored in a PostgreSQL (www.postgresql.org) database with Post-GIS (www.postgis.net) extension. Vertical horizons data corresponding with the dominant component of each identified SSURGO soil map unit is used to define the initial soil condition within the APSIM model. The process requires several parameters to be derived from the available SSURGO soil properties (Table 2).
TABLE 2
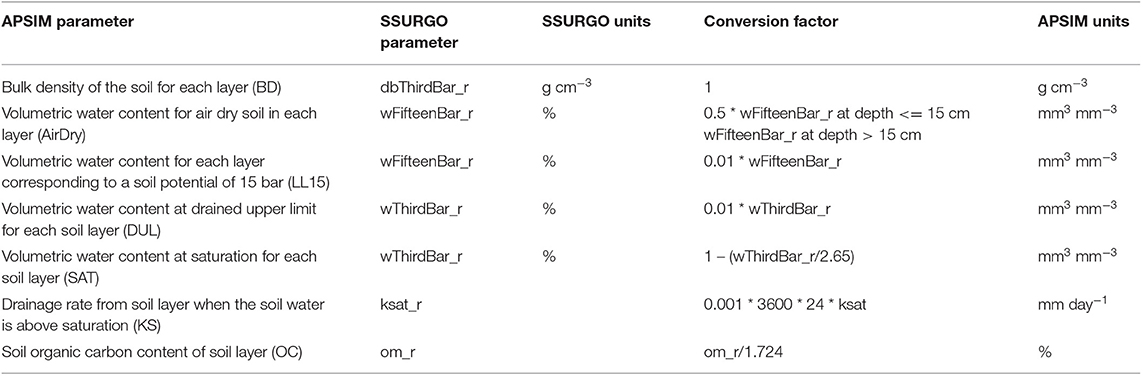
Table 2. Derivation of APSIM soil properties from available SSURGO soil attribute data.
Daily maximum and minimum temperature, precipitation, and solar radiation estimates are obtained from the Daymet weather data service (Thornton et al., 2018) based on the geospatial coordinates of the field centroid and the specific years of the analysis (Figure S1). Weather attribute values from the incoming data stream from Daymet are converted to the appropriate units and used to generate the daily weather input file (.met), native to APSIM. To analyze cropping system fields where financial data is unavailable, modeled and measured yield values are converted to a profit and ROI basis using annual crop production cost estimates and commodity prices generated by Iowa State University Extension and Outreach (Plastina, 2018; Johanns, 2019). These costs represent typical input costs and grain prices specific to Iowa (Table 3). Similarly, alternative financial data from other land grant universities could be added to the framework to increase the scope of the tool beyond Iowa.
TABLE 3
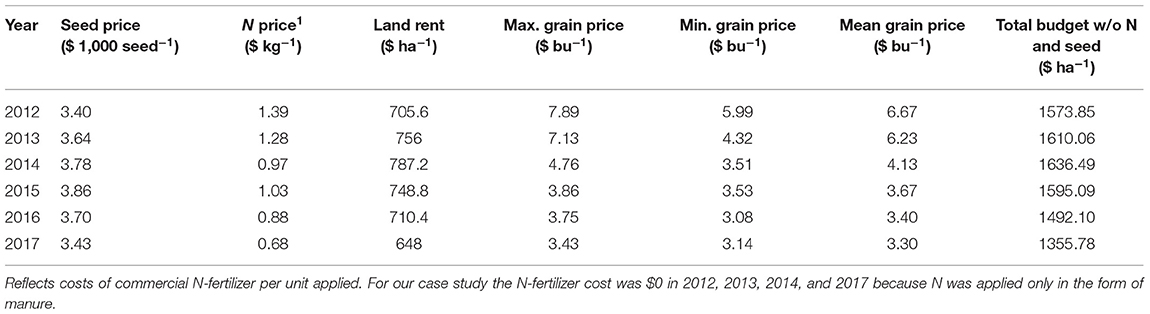
Table 3. Annual crop production cost estimates and maize grain price.
Subfield Analysis of Continuous Maize System
To evaluate the ability of the framework to differentiate subfield differences in crop productivity and corresponding ROI, it was applied to model a continuous maize field located in Butler County, Iowa, U.S. (Table S1). Subfield simulations were created by executing APSIM for each of the identified SSURGO soil types such that field scale management was repeated for each polygon. The simulation spanned the 2012–2017 growing seasons during which manure was the primary source of N, excluding commercial N-fertilizer applied during an N-treatment study in 2015 and 2016. From 2012 to 2014, land management operations included a fall manure application with a total target N-application rate of approximately 224.5 kg ha−1, and an early spring urea ammonium nitrate (UAN) fertilizer application equivalent to 28.1 kg ha−1 of N. Prior to planting, a cultivator tillage pass was typically used to condition the seed bed for planting. Additionally, a tillage pass with a chisel plow was used to incorporate a portion of the surface residue remaining in the field following maize harvests. During the 2015 and 2016 seasons N-management practices were altered and commercial N-fertilizer was applied. Following the 2014 harvest, a fall anhydrous ammonia application equivalent to 252.6 kg ha−1 of N was applied using a 12-row knife applicator. Similar to the previous years, a uniform spring UAN application of 28.1 kg ha−1 was then applied in the spring of 2015. After the 2015 harvest, a uniform fall manure application (168.4 kg ha−1 of N) was applied followed by a spring 2016 UAN application of 112.3 kg ha−1 of N. Crop production cost estimates for each year of the analysis were adjusted to represent the annual seeding density, manure, and N-fertilizer application rates. Manure amendments were modeled using manure storage pit analysis values obtained from Sawyer and Mallarino (2008) for C to N ratio and C to Phosphorus (P) ratio values required by the APSIM model. Use of the maximum grain price documented for each modeled year was based on the assumption that the grain would be stored on site and sold at an economically advantageous time. For years in which manure was applied, associated manure application costs were obtained from organic maize production budgets, and N-fertilizer costs were adjusted accordingly. Modeled yield estimates corresponding with each subfield soil type were compared with multiple years (2012–2017) of precision yield monitor data averaged to each unique soil boundary.
Evaluating Simulated Subfield Yield Response to Variable Inputs
The framework was used to model multiple combinations of input resources against the various soil types identified within the continuous maize system field. In addition to uniform field rates, varying seeding densities and N-fertilizer rates were simulated in an effort to find the agronomic and economic optimum combination of input resources. Seeding density varied from 1 to 15 seeds m−2 and N-fertilizer rates were varied based on a percentage of the field-scale application rate during 2015 and 2016. N-application rates ranging from 0 to 150% of the field-scale N-fertilizer rates were modeled for the Fall 2014 and Spring 2016 applications. In addition to estimating the economic benefit, model outputs were used to estimate and soil N2O emissions and NO3− leaching (below 2 m; which exceeds the expected maize rooting depth; Ordóñez et al., 2018) associated with the economically optimum management rates compared to the agronomically optimum rates. Simulated 2015 and 2016 yields and ROI were compared with observations obtained from six subfield zones (97.5 m × 36.6 m) within the field (Figure 2). Each zone was divided into eight strips on which randomized N-fertilizer treatments were applied during the fall of 2014 and spring of 2016 including 0, 50, 100, and 125% of field-scale application rates (224.5 and 112.3 kg ha−1, respectively). Zones were identified using mean yield monitor data from 2013 and 2014. Data from 2012 was excluded from the zone classification process due to drought conditions that resulted in abnormally low crop productivity.
FIGURE 2
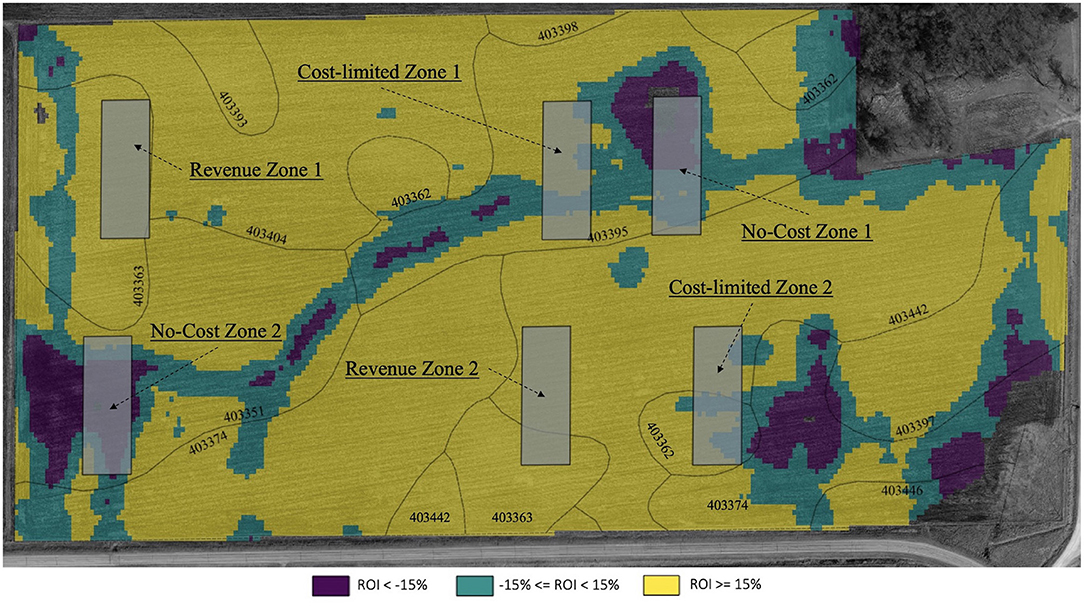
Figure 2. Average 2013 and 2014 ROI map of field used to identify spatial economic zones in which N-fertilizer rate trials were performed in 2015 and 2016. SSURGO soil mapunit polygons are overlayed and labeled with unique Mukey identifier (e.g., 403442). Each soil polygon was modeled independently to determine an optimum management for that area. Boundaries defining the identified economic zones (gray areas) include two “no-cost” zones defined by an average ROI of −15.0% or less; two “cost-limited” zones with a mean annual ROI between −15.0 and 15.0%; and two “revenue” zones with a mean annual ROI >15.0% (Google imagery 2017, DigitalGlobe).
Each of the zones were divided into eight equal (12.2 m × 36.6 m) strips on which one of four N-fertilizer treatments were applied (one replication per treatment). To prevent disrupting normal field operations, plot positions were constrained to be in line with one another. This allowed the N-treatments to be applied during normal field operational passes using a two-rate applicator system, in which one rate was set to the field-scale baseline and the other to the specific plot treatment rate. The secondary application rate was switched on and off by the operator at the boundaries of each N-treatment strip.
Yield monitor data from 2015 and 2016 was geospatially intersected with the zone and sub-zone plot boundaries to estimate the mean observed yield and ROI associated with each N-treatment. The model results for each plot were derived by using the area-weighted average results corresponding with the different soil types intersecting each plot.
Results
Objective 1: Evaluation of Subfield Model Results Against Observations
Linearly regressing simulated yield predictions against spatially-averaged yield monitor observations corresponding with all soil types resulted in an r2 = 0.48 and a root mean square error of 2171.8 kg ha−1, or 27.1% ROI (Figure 3; Table 4; Table S2). The largest modeling errors were associated with overestimates that occurred for limited-area soils located near the field borders including Mukey 403446 (Yield RMSE 4524.0 kg ha−1, area = 0.5 ha), Mukey 403397 (Yield RMSE 2468.1 kg ha−1; area = 1.9 ha), and Mukey 403398 (Yield RMSE 1917.2 kg ha−1; area = 0.2 ha; Table S3). Excluding these soils from the results (4% of the field area) improved model fit (r2 = 0.65; Figure 3) and reduced yield RMSE 1645.0 kg ha−1 and ROI RMSE to 21.5% (Table 4).
FIGURE 3
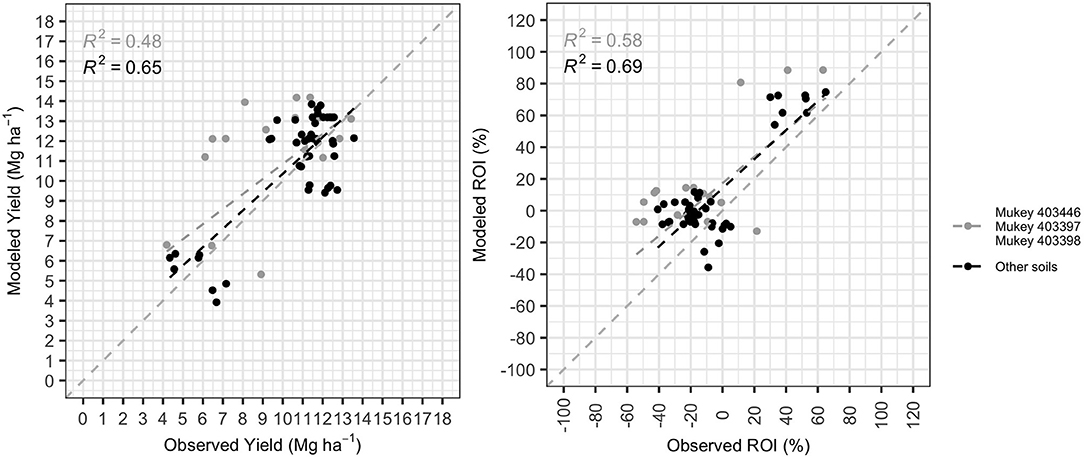
Figure 3. Modeled yield and ROI values fit to observations obtained from spatially averaged precision yield monitor data. Gray data points represent data removed from soils with small areal extent located near the field boundary.
TABLE 4
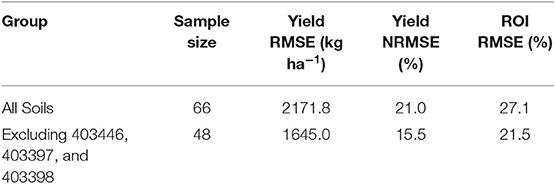
Table 4. Mean annual yield and ROI error estimates generated by the APSIM model framework based on spatially averaged precision yield monitor data.
Low yields observed in the southwest corner of the field (Mukey 403351) were reportedly caused by topographical effects and a broken drainage tile, which over several years had limited infiltration and increased susceptibility to ponding and soil compaction (Figure 2; Table S4, personal communication with land manager). Interannual variation in simulated yield and ROI due to varying weather conditions, crop production costs, and maize prices were found to be consistent with observations (Figure 4). Low yields and corresponding ROI estimates observed in 2012 due to drought conditions were reflected in modeled outputs as well as the relatively high yields and economic return observed in 2013. However, the range of model estimates associated with 2015–2017 was found to be consistently high.
FIGURE 4
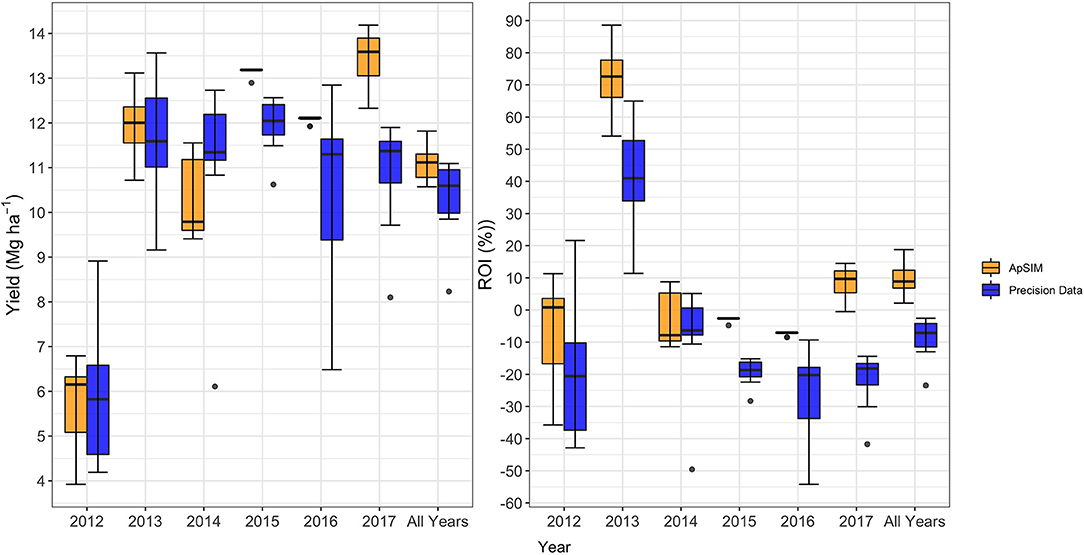
Figure 4. Distribution of annual modeled and observed yield monitor data for each year of analysis. Filled boxes represent the interquartile range (IQR), end caps represent maximum and minimum and dots are outliers defined as >1.5 times the IQR.
Objective 2: Evaluation of Simulated Subfield ROI Response to Variable Management
Model results were compared with corresponding experimental plot yields obtained from spatially averaged yield monitor data (Figure 2). Model outputs associated with the two highest N treatments tended to over-estimate observed crop productivity and corresponding ROI (Figure 5). Overall, the plot based yields had an RMSE of 2490.6 kg ha−1 (12.1% ROI) and 3075.2 kg ha−1 (15.4% ROI) in 2015 and 2016, respectively (Table S5). However, similar to observations, simulated 2015 yields showed little response to N-fertilizer applications beyond the 50% of the field application rate. Contrastingly, modeled 2016 yields responded positively to increases in the early Spring N-fertilizer application (Figure 6). Observations in 2016 showed the highest N application rate (125% of field-scale N application) resulted in lower yields than the 50 and 100% field-scale treatments indicating the secondary spring application, following the fall manure application in 2015, may not have been necessary to maximize yield. Consequently, the highest N treatment resulted in lower observed economic return when compared with the 50 and 100% application rates, particularly in 2015 (Figures 5, 6).
FIGURE 5

Figure 5. Scatter plot of simulated and spatially averaged yield monitor data corresponding with each experimental N-treatment plot located in the northcentral Iowa field.
FIGURE 6
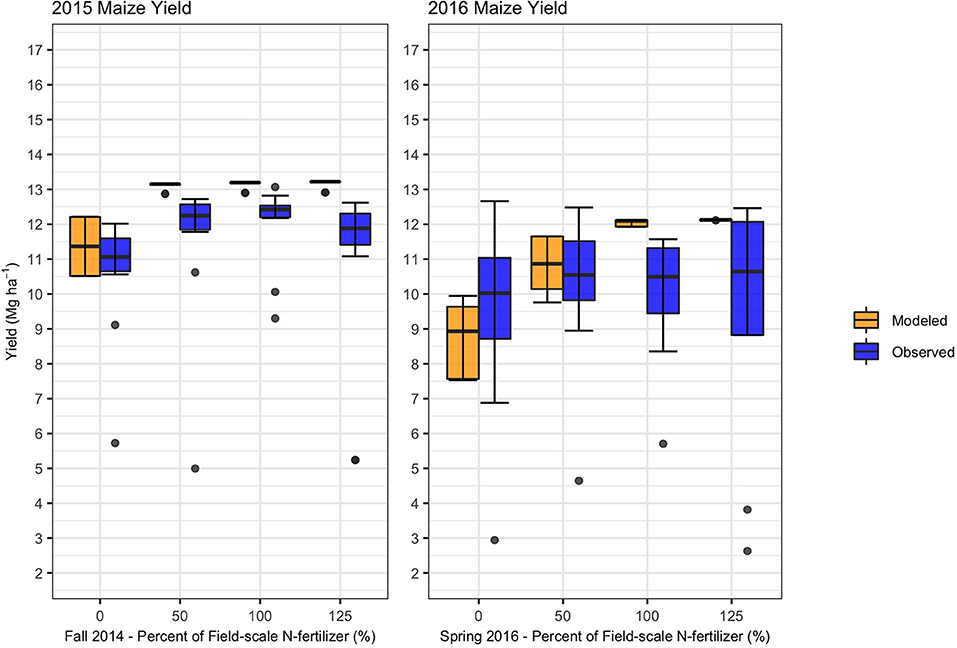
Figure 6. Modeled and observed yield data associated with the four N-fertilizer treatments corresponding with 0, 50, 100, and 125% of the field-scale N-fertilizer rate applied during the fall of 2014 and the spring of 2016. Two replicates of each N-treatment were applied in randomized adjacent plots within the six zones located in an Iowa field (see Figure 2).
Simulated yield and ROI were found to have a positive response to increasing N application rates during the spring of 2016. The modeled outputs showed the yield and ROI to be more proportional to the incremental increases between N-treatments. Variance associated with the predicted yield and ROI values was found to decrease as N fertilizer rates increased to a maximum. The decreased variance across the maximum simulated N treatment plots indicated the increasing N-fertilizer rates were adequate to overcome any insufficient source of initial plant available N that is based on soil type.
The largest modeling errors were found to correspond with N treatment simulations representing plots located in areas with historically low productivity and economic return. Yield in “No-cost” zones were found to have an RMSE of 4313.6 kg ha−1 (21.3% ROI) compared to 1449.6 kg ha−1 (7.1% ROI) and 1667.6 kg ha−1 (8.4%) associated with “Expense-limited” and “Revenue” zones, respectively (Figure 7; Table S6).
FIGURE 7
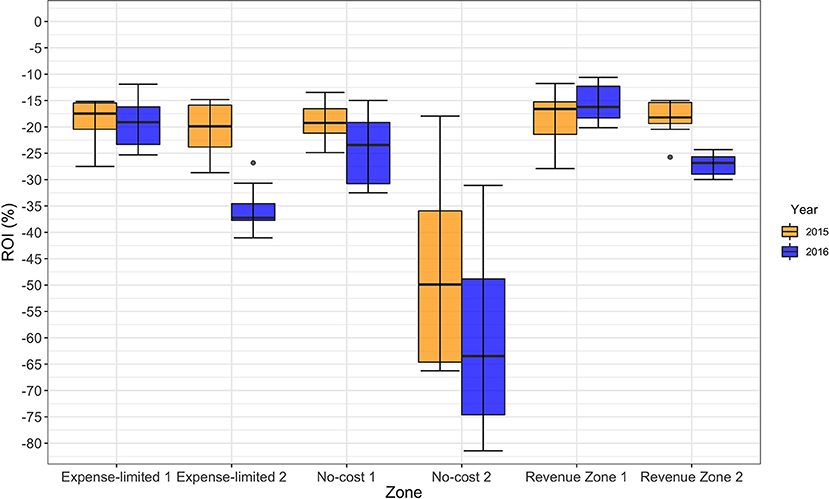
Figure 7. Range of ROI values within each experimental zone during 2015 and 2016. No-cost zones were found to have the greatest range of variability resulting from the alternative N-treatments within each zone. Revenue zones were found to have the least variability compared to the No-cost and Cost-limited zones.
Objective 3: Simulated Environmental and Economic Impacts Associated With Variable Rate Seeding and N Fertilizer
Multiple seeding and N-fertilizer rate combinations were simulated across all subfield soils within the North-central Iowa field during 2015 and 2016 to identify combinations of seed and N-fertilizer inputs predicted to result in agronomic and economic optimums. A total of 4774 APSIM simulations were processed to estimate yield and ROI responses across a management decision space of 1–15 seeds per square meter and 0–150% of the field-scale N-fertilizer rate. Simulations showed a range of variability in maize yield and ROI estimates across the different soil types and years (data not shown). Modeled yield and ROI response surfaces were generated, and agronomic and economic optimums were identified from the different combinations of seeding density and N-fertilizer rates (e.g., Figure 8).
FIGURE 8
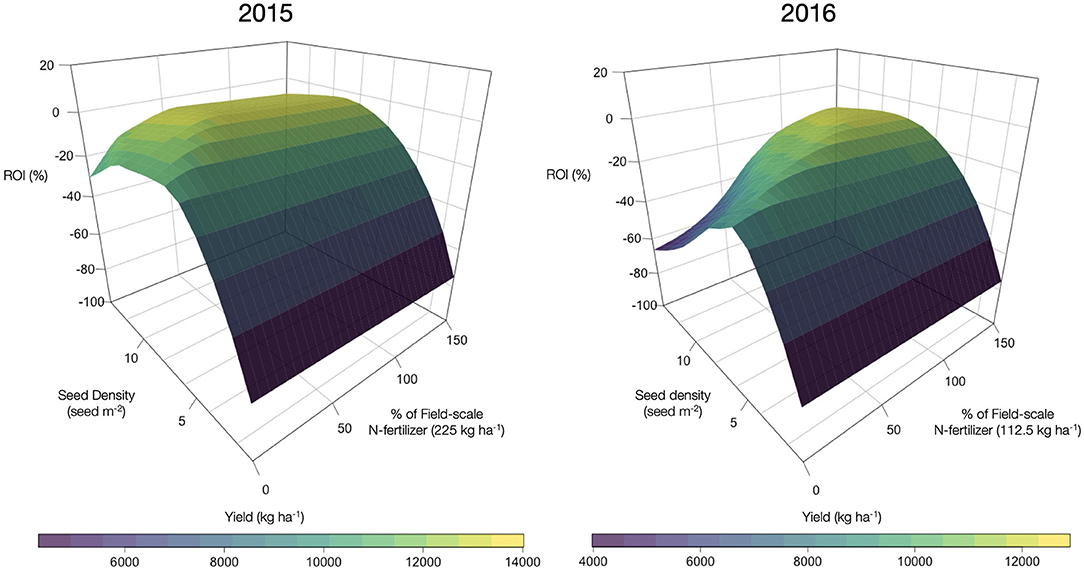
Figure 8. An example of modeled yield and ROI response to variable seeding density and N-fertilizer rate combinations applied in 2015 and 2016. Data associated with the area-dominant subfield soil type within the North-central Iowa field is shown (Mukey 403374; 5.5 ha; see Figure 2).
Modeled annual crop productivity estimates for 2015 and 2016 ranged from 2812.4 to 14055.2 kg ha−1 across all plots, seeding densities, and N-fertilizer rate combinations. The range of yields corresponded with a minimum ROI of −75.3% and a maximum of 1.6% (data not shown). Initial soil conditions set using SSURGO data were found to directly influence the magnitude of the simulated maize yields, particularly at lower N-fertilizer rates (0 and 50% of field-scale). Due to relatively high input costs and low commodity prices during 2015 and 2016, a majority of modeled yield values were estimated to result in an ROI below break-even (0% ROI).
In 2015, maximum yield estimates consistently corresponded with the highest seeding density (15 seed m−2) and N-application rate (150% of field-scale rate; 336.8 kg ha−1) for all soil types (data not shown). The economic optimum seeding density (EOSD) was also consistent across a majority of soils ranging from 8 to 9 seeds m−2 (Figure 9). Economic optimum N-fertilizer rates (EONR) in 2015 showed increased variability across the field ranging from 110 to 180 kg ha−1. Although the EONR varied across the field, the maximum predicted ROI potential associated with the different soils was found to be relatively consistent, varying by 4.1%. Similar to 2015, maximum crop yields in 2016 corresponded with the greatest N-fertilizer rate (150% of field-scale rate; 168.4 kg ha−1) considered within the decision space for the spring application. However, the agronomic optimum seeding rates in 2016 were more variable than 2015, ranging from 9 to 14 seeds m−2. This indicated higher seeding rate scenarios were likely N-limited at the 150% field-scale application rate. As in 2015, the predicted 2016 EOSD was consistent (8–9 seed m−2) and showed little variation from EOSD predictions from the previous year. N-fertilizer rates were again shown to be the main regulating input for maximizing ROI across the field.
FIGURE 9
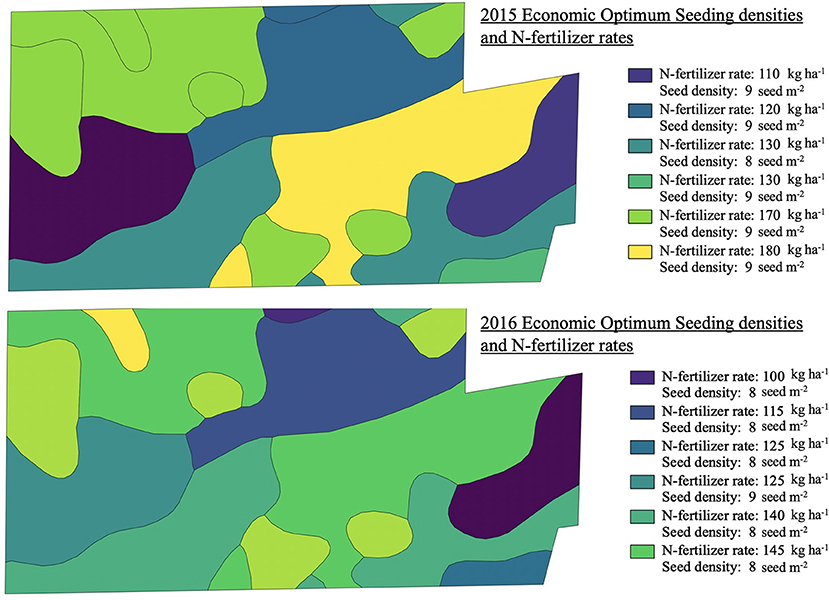
Figure 9. Estimated economic optimum seeding density (EOSD) and economic optimum N-fertilizer rates (EONR) for 2015 and 2016. Management zones defined by one or more soil types sharing the same optimal combination of inputs are shown.
ROI, NO3− leaching, and N2O emissions differences between the agronomic and economic optimum seeding density and N-fertilizer rate scenarios were calculated to determine the range of economic and environmental outcomes that separate maximum economic return and maximum yield potential. Yield differences between the economic and agronomic maximums associated with each subfield soil polygon ranged from 423.1 to 830.5 kg ha−1 in 2015 and from 99.5 to 897.1 kg ha−1 in 2016. The yield differences corresponded with ROI gains ranging from 10.0 to 12.1% in 2015 and 0.3 to 8.0% in 2016, respectively (Figure 10). The yield and ROI differences between the agronomic and economic optimums were found to be driven by both changes in seeding density as well as N inputs. In cases where seeding density was the main factor separating the agronomic and economic optimum management scenarios, the shift in ROI was minor. These relatively small shifts in ROI from changes in seeding density were primarily the result of a reduced yield impact compared to the simulated changes in N-fertilizer. Additionally, the relative cost savings from the reduced seed density were minimal compared to the cost of N. An average reduction of 5 seeds m−2 in 2015 equated to reduced input cost of $44.40 ha−1. In terms of N, a reduction of 43.0 kg ha−1 would be needed to achieve an equivalent cost reduction, however, proportionally larger differences in N-fertilizer rate were estimated. An average N-fertilizer difference of 157.3 kg ha−1 was predicted to separate economic and agronomic optimum managements in 2015 ($161.99 ha−1 in cost savings based on the average N-price in 2015), followed by an estimated 19.5 kg ha−1 ($20.13 ha−1) difference in N-fertilizer in 2016. The economic optimum combination of inputs was found to have an average decrease NO3− leaching across all soils with an average reduction of 3.7 and 1.4 kg ha−1 in 2015 and 2016, respectively (Figure 11). In addition to NO3− leaching, N2O emissions showed a relative decrease when comparing the seeding and N-fertilizer rates associated with maximum yield to those associated with maximum ROI. In 2015, differences between the optimum management scenarios accounted for an average change in N2O emissions of 14.8 kg ha−1. In 2016, the N2O emissions difference between economic and agronomic optimum scenarios was 0.5 kg ha−1 (Figure 11).
FIGURE 10
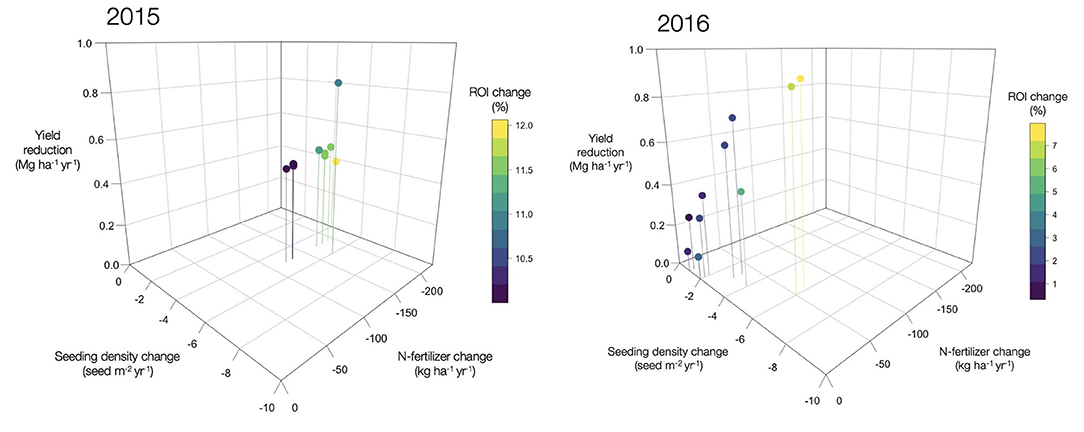
Figure 10. Yield and ROI changes associated with a shift from agronomic optimum inputs to economic optimum inputs. Data points represent changes corresponding with each subfield soil types during 2015 and 2016 (Table S7).
FIGURE 11
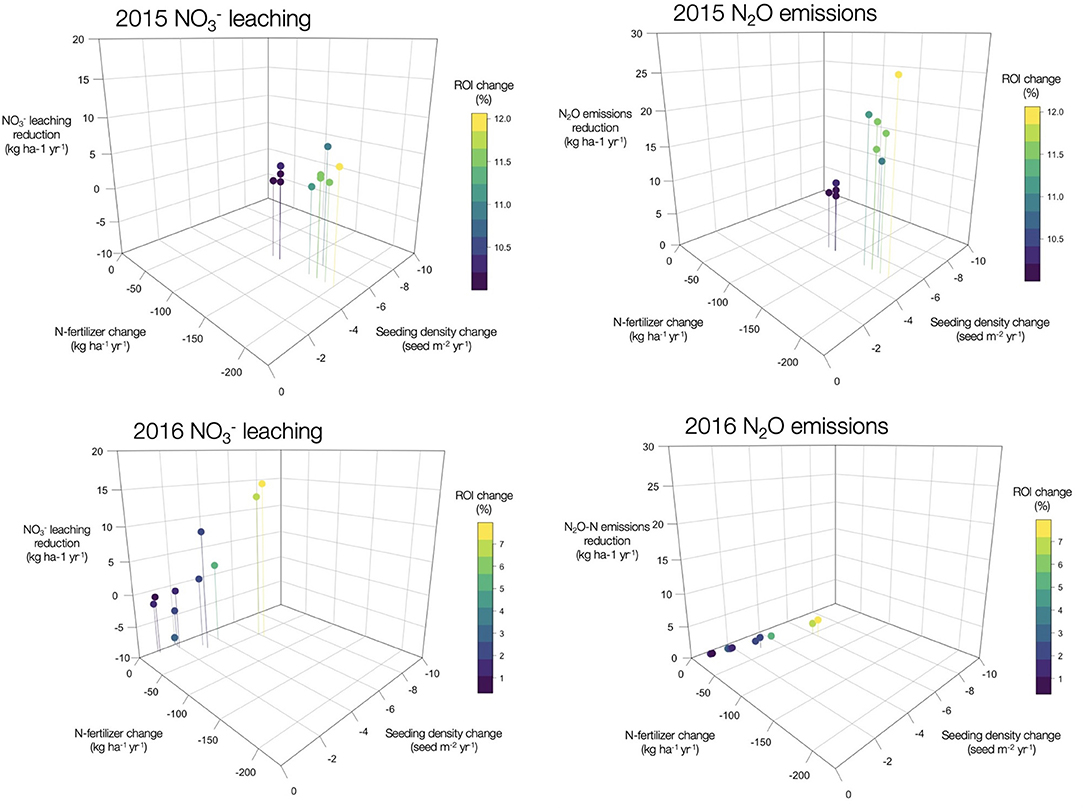
Figure 11. NO3− leaching and N2O emission changes associated with a shift from managing for maximum yield (agronomic optimum inputs) to managing for maximum ROI (economic optimum inputs). Data points represent changes corresponding with each subfield soil type during 2015 and 2016 (Table S7).
Discussion
Optimizing the use of input resources within cropping systems is critical to improving sustainability and increasing economic returns from farm fields. However, predicting how to best allocate input resources such as seed and N-fertilizer to maximize ROI is difficult due to many dynamic factors influencing crop productivity and variability within the cropping systems (Scharf et al., 2005; Jaynes et al., 2011; Dhital and Ruan, 2016). As a result, subfield seeding density and N-fertilizer application guidance is needed prior to upcoming cropping seasons. However, pre-season methods of determining the EONR and EOSD, such as a yield-goal approach, rely heavily on historical data and often involve estimates of interdependent factors (Sela et al., 2017). Regional MRTN tools that incorporate N-fertilizer prices and use empirical data to predict yield response to variable N-fertilizer rates provide field-scale approximations of optimums, but do not provide site-specific subfield recommendations or adjust for year-to-year variability (Sawyer et al., 2006).
Cropping system models such as APSIM are capable of predicting such site-specific subfield yield responses, however determining how these models can best be applied to provide land managers with actionable information to use within their existing management operations is difficult. The framework presented here was developed to determine if a cropping system model, coupled with publicly available data sources, could be used as a decision support tool for estimating site-specific subfield economic optimum seeding density and N-fertilizer rates. Ultimately to be adopted, the framework will need to be practical to use, requiring further development of a user-friendly interface that may need to be catered to specific regions. This study was focused on maize grown in the Midwest U.S., a region where the adoption of precision agriculture has spread rapidly (Schimmelpfennig, 2016), and hence a logical initial focus for framework development. However, the SSURGO and Daymet data sources provide coverage across the conterminous U.S. allowing the framework to be applied to a variety of cropping system locations with varying weather and soil conditions. Extending beyond our study region, there are analogous tools such as Yield Prophet (Hochman et al., 2009; McCown et al., 2009) which have been successfully implemented in wheat, barley, canola, and oat cropping systems in Australia. Additionally, alternative data sources which provide alternate global weather and soil characteristics could be integrated with the framework to further extend its use in different regions (e.g., the European Centre for Medium-Range Weather Forecasts Reanalysis (ERA) products and the European Soil Database). Similar geographical focus was given in Jin et al. (2019), which used an APSIM framework to estimate regional economic optimum nitrogen fertilizer rates based on subfield management zone simulations across many Midwest fields.
The framework was applied to determine subfield EONR and EOSD combinations for a Butler, County, Iowa, U.S. cropping system field in continuous maize and demonstrated the ability of the tool to capture subfield variability of yield and ROI across multiple years (2012–2017) and weather conditions (Figures 2, 3). The initial demonstration of the framework required making some assumptions about the farming operations (e.g., selling grain at peak annual price) that could be incorporated into the user interface as customizable settings. Results of the Butler County field analysis showed fair agreement with annual subfield soil-based observations obtained from area-averaged yield monitor data for the 2012–2017 growing seasons. The greatest sources of modeling error corresponded with several small-area soils along the field boundary (Figure 2). Yields and ROI associated with these soils were all over-estimated compared to the observations derived from yield monitor data. Plant stresses from non-simulated factors (e.g., standing water and soil compaction) could explain model over estimation in these areas. However, due to the small size (4% of field area) and the proximity of the soils to the field boundary the increased error might be expected. Furthermore, yield monitor measurements may be artificially low near field borders (Luck and Fulton, 2004). Excluding the identified soils improved model fit to observations associated with the remaining 96% of the field area (r2 = 0.48 to r2 = 0.65) and reduced yield RMSE from 2171.8 to 1645.0 kg ha−1.
Normalizing the RMSE by the mean observed yield resulted in a relative RMSE (RRMSE) of 15.5% (Table S2), which was similar in magnitude to a previous study examining the ability of the APSIM cropping system model to capture yield response to variable N-fertilizer rates in an Iowa maize system (Puntel et al., 2016). The RRMSE between 15 and 30% represents moderate model performance based on Yang et al. (2014). However, it is important to note the framework simulation approach was characterized by a high degree of difficulty as it runs a continuous simulation between 2012 and 2017, avoiding re-initialization of the soil data to capture year-on-year impacts on N-cycle dynamics (Constantin et al., 2011; Basso and Ritchie, 2015) related to the variable weather conditions and prior management practices. Such a modeling approach may propagate and accumulate error associated with a particular year during the full simulation period (Salo et al., 2016; Puntel et al., 2018). Based on this high level of difficulty and the resulting model performance, we believe the ability of the framework to capture subfield-scale patterns outside of a calibrated experimental setting indicates the framework to be a viable basis for an assessment tool when using public soils and weather data.
The model outputs corresponding with varying combinations of seeding density and N-fertilizer rates showed, in addition to increased ROI, managing for maximum economic return vs. maximum yield, likely provides an environmental co-benefit by reducing N-losses from NO3− leaching and N2O emissions. Daily outputs from the analysis showed modeled N2O emissions were driven by interannual conditions that resulted in several periods during the growing season each year in which conditions favored denitrification (data not shown). Alternatively, the daily outputs showed a majority of NO3− leaching to have occurred during the fall of 2015 into the spring of 2016. This indicated the fall manure application in 2015 was susceptible to high rates of NO3− leaching. The economic and environmental co-benefit associated with strategically targeting management practices to subfield zones supports similar findings in Muth (2014) and Brandes et al. (2016), which have noted a correlation between environmental and economic performance in cropping systems. Such a relationship presents a financial incentive for adopting the economically optimum inputs, even at the cost of potential yield. A comparison of the predicted economic and agronomic optimums performed in this analysis showed the importance of managing the balance between seeding density and reduced N-fertilizer rates. The dual benefit of increased economic return and reduced environmental impacts may be sufficiently appealing to incentivize adoption by land managers, especially relative to regulatory actions by governments (Arbuckle, 2013; Kalcic et al., 2014).
The modeled relationship between maximum yield and maximum ROI was shown to reinforce aggregated empirical findings that are used in MRTN tools such as the Corn Nitrogen Rate Calculator (CRNC) (Sawyer et al., 2006). A small yield response was observed in 2015 when the primary source of N to the field was varied (224.5 kg ha−1 in the Fall 2014) indicating that some N-stress occurred at the lower rates of 0 and 50% of the field-scale N application. The long history of manure amendment prior to the 2012 start of the analysis has likely resulted in a large stock of organic N sources within the soil profile of the North-central Iowa field. A calibration approach, such as the one used in Puntel et al. (2016), based on previous knowledge of the system including the C:N ratio of the crop residues could be used to improve the predictive capability of the framework for future years.
The accuracy and usefulness of the tool could also be improved with more information and site-specific data sources. For example, relatively low yield observations in the southwest corner of the Iowa maize field were reported by the land manager to be the result of a broken tile drain and water infiltration issues (personal communication). Such information was not captured in the simulations when using only the public data sources to drive predictions. As a result, the variable N-treatment zone (No-cost 1) located in this area was found to correspond with the greatest modeling errors [yield and ROI RMSE of 4313.6 kg ha−1 and 21.3%, respectively (Table S6)], compared to the other variable N-treatment zones. For example, expense-limited zones showed the least error with a yield RMSE of 1449.6 kg ha−1 and ROI RMSE of 7.1%. Therefore, a real world application of the framework could be improved with some familiarity with the field being analyzed beyond crop, weather, and soil conditions. Calibration of the framework using historical precision yield data and initialization of simulated soil properties including initial NO3− and concentrations would also likely improve model performance. Such calibrations could be used to account for residual N within the soil in amounts adequate to offset any N-limitations that may occur in lower N-treatment plots. However, the ability and motivation of the land manager to take the steps to obtain the necessary site-specific measurements may not be likely in some cases (Schimmelpfennig, 2016). In practice, there will be a range of potential users of the framework with varying levels of access to site-specific data and precision equipment/technology. Further calibration of the framework to provide more accurate predictions may represent a second phase in the analysis process after initially using the framework to highlight areas of the field that are not likely to respond to changes in management practices (e.g., “No-cost” zones). The second “calibrated” phase would then focus on areas of field where the model has shown to provide a yield response similar to historical observations. We envision the framework being applied in the following manner:
(1) Perform initial baseline assessment of field using historical management practices (i.e., seeding rate, N-fertilizer rates, tillage), public soils data, and public weather data.
(2) Compare predicted baseline yield values to historical precision yield data to identify areas of the field where the framework provides satisfactory agreement with observations (e.g., NRMSE ≤ 30%).
(3) Use framework to determine optimum seeding density and N-fertilizer application rates to the areas identified as satisfactory in Step 2 (standard management for remaining areas).
The result of this second phase would then be used to guide subfield management of seeding and N-fertilizer rates for the sub-field areas that have not been excluded in the “No-cost” zones. These zones should be prioritized for the enrollment of conservation programs or targets for perennial energy crops (Brandes et al., 2016). Further testing on additional independent sites will strengthen the predictive ability of the framework for supporting future application decisions.
Conclusions
Optimizing the use of input resources within cropping systems is critical to reducing nutrient losses improving sustainability, and increasing economic return from cropping system fields. However, predicting how to best allocate input resources within a field is difficult due to the spatial and temporal variability of weather, soils, and management practices within the systems. By leveraging publicly available field-to-subfield data sources, cropping system models may provide a valuable decision support tool for predicting site specific yield, ROI, and environmental impacts on which farmers could base management decisions. The developed framework provides a basis for a subfield decision support tool for estimating economically optimum seeding densities and N-fertilizer rates. An application of the framework to predict annual yield and ROI outcomes in a maize cropping system found the framework effectively captured subfield variability of the observed crop productivity. These results support that this framework could potential be used to increase both economic and environmental performance in relatively well performing zones. Our analysis also indicated that poor performing zones are unlikely to be profitable at any realistic combination of the key inputs studied, suggesting that these areas may be targets for alternative cropping systems (e.g., perennial grasses). NO3− leaching and N2O emissions differences between economic and agronomic optimum yields reinforces a correlation between maximum profitability and improved environmental performance. Further development of the integrated modeling approach to simulate perennial grasses and utilize more site-specific data may increase the accuracy and robustness of the framework. Integrating the use of additional precision agriculture data layers including as-applied nutrient applications, as-planted seeding data, gridded soil sampling, elevation data, and remote sensed layers could provide the necessary increase in spatial resolution needed to extend the process-based modeling framework as a more practical decision making resource.
Data Availability Statement
All datasets generated for this study are included in the article/Supplementary Material.
Author Contributions
GM and AV developed research idea, performed modeling study, and drafted manuscript. EH assisted with interpretation of data. SA assisted with model parameterization. ML assisted with modeling study design. All co-authors reviewed and contributed to the final manuscript.
Funding
This work was supported by Iowa Nutrient Research Center and the USDA Hatch Project IOW04414 and the C-CHANGE Presidential Interdisciplinary Research Initiative at Iowa State University.
Conflict of Interest
The authors declare that the research was conducted in the absence of any commercial or financial relationships that could be construed as a potential conflict of interest.
Acknowledgments
Acknowledgment is made to the APSIM Initiative which takes responsibility for quality assurance and a structured innovation programme for APSIM's modeling software, which is provided free for research and development use (see www.apsim.info for details).
Supplementary Material
The Supplementary Material for this article can be found online at: https://www.frontiersin.org/articles/10.3389/fsufs.2019.00108/full#supplementary-material
References
Adamchuk, V. I., Dobermann, A., and Ping, J. (2004). Precision Agriculture: Listening to the Story Told by Yield Maps. Lincoln, NE: University of Nebraska-Lincoln Extension.
Al-Kaisi, M., and Yin, X. (2003). Effects of nitrogen rate, irrigation rate, and plant population on corn yield and water use efficiency. Agron. J. 95, 1475–1482. doi: 10.2134/AGRONJ2003.1475
Arbuckle, J. G. (2013). Farmer attitudes toward proactive targeting of agricultural conservation programs. Soc. Nat. Resour. 26, 625–641. doi: 10.1080/08941920.2012.671450
Banger, K., Yuan, M., Wang, J., Nafziger, E. D., and Pittelkow, C. M. (2017). A vision for incorporating environmental effects into nitrogen management decision support tools for US maize production. Front. Plant Sci. 8:1270. doi: 10.3389/fpls.2017.01270
Basso, B., Benjamin, D., Davide, C., Andrea, P., Francesco, M., Sartori, et al. (2016). Environmental and economic benefits of variable rate nitrogen fertilization in a nitrate vulnerable zone. Sci. Total Environ. 545–546, 227–235. doi: 10.1016/j.scitotenv.2015.12.104
Basso, B., and Ritchie, J. T. (2015). “Simulating crop growth and biogeochemical fluxes in response to land management using the SALUS model,” in The Ecology of Agricultural Landscapes: Long-Term Research on The Path to Sustainability, eds S. K. Hamilton, J. E. Doll, and G. P. Robertson (New York, NY: Oxford University Press, 252–274.
Bobryk, C. W., Myers, D. B., Kitchen, N. R., Shanahan, J. F., Sudduth, K. A., Drummond, S. T., et al. (2016). Validating a digital soil map with corn yield data for precision agriculture decision support. Agron. J. 108, 957–965. doi: 10.2134/agronj2015.0381
Brandes, E., McNunn, G. S., Schulte, L. A., Bonner, I. J., Muth, D., Babcock, B. A., et al. (2016). Subfield profitability analysis reveals an economic case for cropland diversification. Environ. Res. Lett. 11:014009. doi: 10.1088/1748-9326/11/1/014009
Brandes, E., McNunn, G. S., Schulte, L. A., Muth, D. J., VanLoocke, A., and Heaton, E. A. (2018). Targeted subfield switchgrass integration could improve the farm economy, water quality, and bioenergy feedstock production. GCB Bioenergy 10, 199–212. doi: 10.1111/gcbb.12481
Constantin, J., Beaudoin, N., Laurent, F., Cohan, J. P., Duyme, F., and Mary, B. (2011). Cumulative effects of catch crops on nitrogen uptake, leaching and net mineralization. Plant Soil. 341, 137–154. doi: 10.1007/s11104-010-0630-9
Dhital, S., and Ruan, W. R. (2016). Variability in optimum nitrogen rates for maize. Agron. J. 108, 2165–2173. doi: 10.2134/agronj2016.03.0139
Fleming, K. L., Westfall, D. G., Wiens, D. W., and Brodahl, M. C. (2000). “Evaluating management zone technology and grid soil sampling for variable rate nitrogen application,” in Proceedings of the 5th International Conference on Precision Agriculture (Bloomington, MN), 16–19. doi: 10.1023/A:1011481832064
Gao, F., Anderson, M., Daughtry, C., and Johnson, D. (2018). Assessing the variability of corn and soybean yields in central Iowa using high spatiotemporal resolution multi-satellite imagery. Remote Sens. 10:1489. doi: 10.3390/rs10091489
Hochman, Z., Van Rees, H., Carberry, P. S., Hunt, J. R., McCown, R. L., Gartmann, A., et al. (2009). Re-inventing model-based decision support with Australian dryland farmers. 4. Yield Prophet helps farmers monitor and manage crops in a variable climate. Crop Pasture Sci. 60, 1057–1070. doi: 10.1071/CP09020
Holland, K. H., and Schepers, J. S. (2010). Derivation of a variable rate nitrogen application model for in-season fertilization of corn. Agron. J. 102, 1415–1424. doi: 10.2134/agronj2010.0015
Holzworth, D. P., Neil, I. H., Peter, G., Zurcher, E. J., Herrmann, N. I., Mclean, G., et al. (2014). Environmental Modelling & Software APSIM e Evolution towards a new generation of agricultural systems. Environ. Model. Softw. 62, 327–350. doi: 10.1016/j.envsoft.2014.07.009
Hong, N., White, J. G., Weisz, R., Crozier, C. R., Gumpertz, M. L., and Cassel, D. K. (2006). Remote sensing-informed variable-rate nitrogen management of wheat and corn: agronomic and groundwater outcomes. Agron. J. 98, 327–338. doi: 10.2134/agronj2005.0154
Jaynes, D. B., Kaspar, T. C., and Colvin, T. S. (2011). Economically optimal nitrogen rates of corn: management zones delineated from soil and terrain attributes. Agronomy J. 103, 1026–1035. doi: 10.2134/agronj2010.0472
Jin, Z., Archontoulis, S. V., and Lobel, D. B. (2019). How much will precision nitrogen management pay off? An evaluation of simulating thousands of corn fields over the US Corn-Belt. Field Crops Res. 240, 12–22. doi: 10.1016/j.fcr.2019.04.013
Johanns, A. (2019). Iowa Cash Corn and Soybean Prices. Ames, IA: Iowa State University Extension – Ag Decision Maker.
Johanns, A., and Plastina, A. (2019). Historical Costs of Crop Production. Ames, IA: Iowa State University Extension – Ag Decision Maker.
Kalcic, M., Prokopy, L., Frankenberger, J., and Chaubey, I. (2014). An in-depth examination of farmers perceptions of targeting conservation practices. J. Environ. Manage. 54, 795–813. doi: 10.1007/s00267-014-0342-7
Kitchen, N. R., Sudduth, K. A., Drummond, S. T., Scharf, P. C., Palm, H. L., Roberts, D. F., et al. (2010). Ground-based canopy reflectance sensing for variable-rate nitrogen corn fertilization. Agron. J. 102, 71–84. doi: 10.2134/agronj2009.0114
Licht, M. A., Lenssen, A. W., and Elmore, R. W. (2017). Corn (Zea mays L.) seeding rate optimization in Iowa, USA. Precision Agric. 18, 452–469. doi: 10.1007/s11119-016-9464-7
Link, J., Graeff, S., Batchelor, W. D., and Claupein, W. (2006). Evaluating the economic and environmental impact of environmental compensation payment policy under uniform and variable-rate nitrogen management. Agric. Syst. 91, 135–153. doi: 10.1016/j.agsy.2006.02.003
Long, D. S., Whitmus, J. D., Engel, R. E., and Brester, G. W. (2015). Net returns from terrain-based variable-rate nitrogen management on dryland spring wheat in Northern Montana. Agron. J. 107, 1055–1067. doi: 10.2134/agronj14.0331
Luck, J. D., and Fulton, J. P. (2004). Precision Agriculture: Best Management Practices for Collecting Accurate Yield Data and Avoiding Errors During Harvest. Lincoln, NE: University of Nebraska-Lincoln Extension.
Maestrini, B., and Basso, B. (2018). Predicting spatial patterns of within-field crop yield variability. Field Crops Res. 219, 106–112. doi: 10.1016/j.fcr.2018.01.028
Martinez-Feria, R. A., Castellano, M. J., Dietzel, R. N., Helmers, M. J., Liebman, M., Huber, I., et al. (2018). Linking crop- and soil-based approaches to evaluate system nitrogen-use efficiency and tradeoffs. Agric. Ecosyst. Environ. 256, 131–143. doi: 10.1016/j.agee.2018.01.002
McCown, R. L., Carberry, P. S., Hochman, Z., Dalgliesh, N. P., and Foale, M. A. (2009). Re-inventing model-based decision support with Australian dryland farmers. 1. Changing intervention concepts during 17 years of action research. Crop Pasture Sci. 60, 1017–1030. doi: 10.1071/CP08455
Morris, T. F., Murrell, T. S., Beegle, D. B., Camberato, J. J., Ferguson, R. B., Grove, J., et al. (2018). Strengths and limitations of Nitrogen rate recommendations for corn and opportunities for improvement. Agron. J. 110, 1–37. doi: 10.2134/agronj2017.02.0112
Muth, D. (2014). Profitability versus environmental performance: are they competing? J. Soil Water Conserv. 69, 203–206. doi: 10.2489/jswc.69.6.203A
Ordóñez, R. A., Castellano, M. J., Hatfield, J. L., Helmers, M. J., Licht, M. A., Liebman, M., et al. (2018). Maize and soybean root front velocity and maximum depth in Iowa, USA. Field Crops Res. 215, 122–131. doi: 10.1016/j.fcr.2017.09.003
Paz, J. O., Batchelor, W. D., Babcock, B.A, Colvin, T. S., Logsdon, S. D., Kaspar, T. C., et al. (1999). Model-based technique to determine variable rate nitrogen for corn. Agric. Syst. 61, 69–75. doi: 10.1016/S0308-521X(99)00035-9
Plastina, A. (2018). Estimated Costs of Crop Production in Iowa. Ames, IA: Iowa State University Extension – Ag Decision Maker.
Puntel, L. A., Pagani, A., and Archontoulis, S. V. (2019). Development of a nitrogen recommendation tool for corn considering static and dynamic variables. Eur. J. Agron. 105, 189–199. doi: 10.1016/j.eja.2019.01.003
Puntel, L. A., Sawyer, J. E., Barker, D. W., Dietzel, R., Poffenbarger, H., Castellano, M. J., et al. (2016). Modeling long-term corn yield response to nitrogen rate and crop rotation. Front. Plant Sci. 7, 1–18. doi: 10.3389/fpls.2016.01630
Puntel, L. A., Sawyer, J. E., Barker, D. W., Thorburn, P. J., Castellano, M. J., Moore, K. J., et al. (2018). A systems modeling approach to forecast corn economic optimum nitrogen rate. Front. Plant Sci. 9:436. doi: 10.3389/fpls.2018.00436
Raun, W. R., Solie, J. B., Johnson, G. V., Stone, M. L., Mullen, R. W., Freeman, K. W., et al. (2002). Improving nitrogen use efficiency in cereal grain production with optical sensing and variable rate application. Agron. J. 94, 815–820. doi: 10.2134/agronj2002.8150
Salo, T. J., Palosuo, T., Kersebaum, K. C., Nendel, C., Angulo, C., Ewert, F., et al. (2016). Comparing the performance of 11 crop simulation models in predicting yield response to nitrogen fertilization. J. Agric. Sci. 154, 1218–1240. doi: 10.1017/S0021859615001124
Sawyer, J., Nafziger, E., Randall, G., Bundy, L., Rehm, G., and Joern, B. (2006). Concepts and Rationale for Regional Nitrogen Guidelines for Corn. Ames, IA: Iowa State University Extension.
Sawyer, J. E., and Mallarino, A. P. (2008). Using Manure Nutrients for Crop Production. Ames, IA: Iowa State University Extension.
Sawyer, J. E., and Nafziger, E. D. (2005). “Regional approach to making nitrogen fertilizer rate decisions for corn,” in Agronomy Conference Proceedings and Presentations (Des Moines, IA), 37. doi: 10.31274/icm-180809-823
Scharf, P. C., Kitchen, N. R., Sudduth, K. A., Davis, G., Hubbard, V. C., and Lory, J. A. (2005). Field-scale variability in optimal nitrogen fertilizer rate for corn. Agron. J. 97, 452–461. doi: 10.2134/agronj2005.0452
Schimmelpfennig, D. (2016). Farm Profits and Adoption of Precision Agriculture, ERR-217. U.S. Department of Agriculture, Economic Research Service.
Sela, S., van Es, H. M., Moebius-Clune, B. N., Marjerison, R., Melkonian, J., Moebius-Clune, D., et al. (2016). Adapt-N outperforms grower-selected nitrogen rates in northeast and midwestern united states strip trials. Agron. J. 108, 1726–1734. doi: 10.2134/agronj2015.0606
Sela, S., van Es, H. M., Moebius-Clune, B. N., Marjerison, R., Moebius-Clune, D., Schindelbeck, R., et al. (2017). Dynamic model improves agronomic and environmental outcomes for maize nitrogen management over static approach. J. Environ. Qual. 46:311–319. doi: 10.2134/jeq2016.05.0182
Solie, J. B., Monroe, A. D., Raun, W. R., and Stone, M. L. (2012). Generalized algorithm for variable-rate nitrogen application in cereal grains. Agron. J. 104, 378–387. doi: 10.2134/agronj2011.0249
Stefanini, M., Larson, J. A., Lambert, D. M., Yin, X., Boyer, C. N., Scharf, P., et al. (2018). Effects of optical sensing based variable rate nitrogen management on yields, nitrogen use and profitability for cotton. Precision Agric. 20, 591–610. doi: 10.1007/s11119-018-9599-9
Thornton, M. M., Thornton, P. E., Wei, Y., Mayer, B. W., Cook, R. B., and Vose, R. S. (2018). Daymet: Annual Climate Summaries on a 1-km Grid for North America, Version 3. Oak Ridge, TN: ORNL DAAC.
Tremblay, N., Wang, Z., Ma, B. L., Belec, C., and Vigneault, P. (2009). A comparison of crop data measured by two commercial sensors for variable-rate nitrogen application. Precision Agric. 10, 145–161. doi: 10.1007/s11119-008-9080-2
Walters, C. G., Shumway, C. R., and Huggins, D. R. (2017). Impacts of terrain attributes on economics and the environment: costs of reducing potential nitrogen pollution in wheat production. Agric. Econ. 48, 143–152. doi: 10.1111/agec.12321
Woli, K. P., Burras, C. L., Abendroth, L. J., and Elmore, R. W. (2014). Optimizing corn seeding rates using a field's corn suitability rating. Agron. J. 106, 1523–1532. doi: 10.2134/agronj14.0054
Yang, J. M., Yang, J. Y., Liu, S., and Hoogenboom, G. (2014). An evaluation of the statistical methods for testing the performance of crop models with observed data. Agric. Syst. 127, 81–89. doi: 10.1016/j.agsy.2014.01.008
Keywords: economic optimum nitrogen, economic optimum seeding, nitrate leaching, APSIM, model framework
Citation: McNunn G, Heaton E, Archontoulis S, Licht M and VanLoocke A (2019) Using a Crop Modeling Framework for Precision Cost-Benefit Analysis of Variable Seeding and Nitrogen Application Rates. Front. Sustain. Food Syst. 3:108. doi: 10.3389/fsufs.2019.00108
Received: 06 August 2019; Accepted: 12 November 2019;
Published: 05 December 2019.
Edited by:
Alexis Comber, University of Leeds, United KingdomReviewed by:
Elizabeth Anne Meier, Commonwealth Scientific and Industrial Research Organisation (CSIRO), AustraliaEmma Louise Burns, Australian National University, Australia
Copyright © 2019 McNunn, Heaton, Archontoulis, Licht and VanLoocke. This is an open-access article distributed under the terms of the Creative Commons Attribution License (CC BY). The use, distribution or reproduction in other forums is permitted, provided the original author(s) and the copyright owner(s) are credited and that the original publication in this journal is cited, in accordance with accepted academic practice. No use, distribution or reproduction is permitted which does not comply with these terms.
*Correspondence: Andy VanLoocke, YW5keXZhbmxAaWFzdGF0ZS5lZHU=