 Alexis Comber1*
 Adrian L. Collins2
 David Haro-Monteagudo3,4
 Tim Hess3Yusheng Zhang2
 Andrew Smith5
 Andrew Turner6
- 1Leeds Institute for Data Analytics (LIDA) and School of Geography, University of Leeds, Leeds, United Kingdom
- 2Sustainable Agriculture Sciences Department, Rothamsted Research, Okehampton, United Kingdom
- 3Cranfield Water Science Institute, Cranfield University, Cranfield, United Kingdom
- 4Estación Experimental de Aula Dei, Zaragoza, Spain
- 5School of Natural Sciences, Bangor University, Bangor, United Kingdom
- 6School of Geography, University of Leeds, Leeds, United Kingdom
This paper describes the development and application of a novel and generic framework for parsimonious soil-water interaction models to predict the risk of agro-chemical runoff. The underpinning models represent two scales to predict runoff risk in fields and the delivery of mobilized pesticides to river channel networks. Parsimonious field and landscape scale runoff risk models were constructed using a number of pre-computed parameters in combination with live rainfall data. The precomputed parameters included spatially-distributed historical rainfall data to determine long term average soil water content and the sensitivity of land use and soil type combinations to runoff. These were combined with real-time live rainfall data, freely available through open data portals and APIs, to determine runoff risk using SCS Curve Numbers. The rainfall data was stored to provide antecedent, current and future rainfall inputs. For the landscape scale model, the delivery risk of mobilized pesticides to the river network included intrinsic landscape factors. The application of the framework is illustrated for two case studies at field and catchment scales, covering acid herbicide at field scale and metaldehyde at landscape scale. Web tools were developed and the outputs provide spatially and temporally explicit predictions of runoff and pesticide delivery risk at 1 km2 resolution. The model parsimony reflects the driving nature of rainfall and soil saturation for runoff risk and the critical influence of both surface and drain flow connectivity for the risk of mobilized pesticide being delivered to watercourses. The novelty of this research lies in the coupling of live spatially-distributed weather data with precomputed runoff and delivery risk parameters for crop and soil types and historical rainfall trends. The generic nature of the framework supports the ability to model the runoff and field-to-channel delivery risk associated with any in-field agricultural application assuming application rate data are available.
Introduction
Rainfall-induced surface and subsurface runoff mobilizes and transports the chemicals used for in-field agricultural applications (fertilizers, herbicides, and pesticides) from land to receiving freshwaters. Agriculture is therefore a significant source of water pollution, affecting drinking water quality and treatment costs. In England, for example, water companies spent £92 million in 2008–09 removing pollutants from water supplies to meet drinking water standards (National Audit Office, 2010). However, for some pollutants, such as metaldehyde, there are currently no cost-effective methods of removal, although the UK's first treatment plant has recently been constructed at significant cost to the water company in question1 Concentrations of such agrochemicals above safe limits in surface and groundwaters creates not only environmental risk, but also a risk to human health.
Agricultural applications can enter surface water via a number of pathways. Spills, spray-drift and illegal disposal are generally managed by best practice guidance and prosecution. Surface and subsurface runoff can transport agrochemicals in dissolved and particulate form, from the field to watercourses. The proportion that is removed in solution relative to that attached to mobilized soil particles depends on the intrinsic soil properties, topography/slope and the characteristics of the agrochemicals such as pesticides, including their sorption and solubility properties (Guo et al., 2000; Louchart, 2001; Newell-Price et al., 2011).
The biggest driver of surface and subsurface runoff is precipitation and the timing and characteristics of the first rainfall event after application are very important. Antecedent weather determines the wetness of the soil and therefore the degree to which the chemical is “held” by the soil. Applications made to wet soil (at field capacity or wetter), or just before heavy rainfall, are more likely to be lost in surface runoff or by-pass flow to field drains, with negative environmental and water quality impacts as they are transferred to surface or groundwater (Mitchell et al., 2005; Gao et al., 2008; Lapworth et al., 2012), although the propensity for mobilized pollution to reach watercourses also depends on additional factors affecting delivery (e.g., the status and maintenance of field drains, the topology of the landscape, distance to watercourses). Thus, water pollution risk is enhanced by poor timing of applications in relation to weather events which can result in pollutant concentrations in surface waters that exceed drinking water standards (Pretty et al., 2003).
In addition to the environmental benefits, the efficacy of any agricultural application is severely reduced if runoff washes it from the crop or the field. For the farmer, the reduced efficacy leads to risks of reduced yields (income) and/or increased costs (and thereby lower gross margins) if the treatment has to be re-applied to protect the crop. The annual cost to farmers of agricultural runoff has been estimated at £238 m (Jacobs UK Ltd, 2008) a significant part of which can be attributed to the impact of runoff losses associated with compromised pesticide and herbicide effectiveness. There are additional environmental (damage) costs and, in future, there may be financial penalties for pesticides and herbicides being washed into watercourses. Preventing agro-chemicals reaching surface and groundwaters by imparting source control measures is more cost-effective than water treatment and some initial research has identified a benefit-to-cost ratio of 65:1 for prevention over treatment (Defra, 2013).
Direct detection of the source of pesticides and herbicides carried by runoff is difficult due to the diffuse nature and temporal variability of the sources and the high cost of instrumentation (Meyer et al., 2019) and with some pollutants, the length of time taken to analyse water samples makes real-time risk mapping impractical. Consequently, modeling water pollution risk is the only practical option in most cases.
This paper describes the development of two decision tools operating over different scales of decision making. The tools provide interfaces to two parsimonious soil-water runoff models; one supporting on-farm decisions at the field scale and another supporting landscape scale management. Both include inputs and outputs at a1 km2 spatial scale, but their aims are very different and their outputs should be interpreted in very different ways. The field scale tool provides the end-user with point-based information of runoff risk derived from a model operating over each 1 km2 independently. It uses a meta-model to forecast surface runoff risk for a given land use on a given soil from recent recorded and forecast rainfall alone. It aims to support farmers and land managers to better manage pesticide applications. The catchment scale model also uses a 1 km2 scale (in part because most of the data available to support such analyses and models are at best at 1 km2 resolution). However, the inputs and outputs do not describe processes that operate independently over each 1 km2. Rather, the inputs describe landscape processes that are topologically connected such as field drain and surface flows as well as landscape connectivity between fields and watercourses. In this case, the outputs provide Tier 1 screening to identify hotspots requiring further investigation, with the aim of supporting informed on-the-ground catchment management by environmental agencies and water companies.
Background
This research is informed by two limitations arising from previous work: the difficulties of determining antecedent soil water status (and thereby the potential for soil to hold water) and the temporally static nature of many landscape scale decision support tools in this domain.
Modeling Runoff
The SCS Curve Number (CN) method (USDA SCS, 1972) is commonly used to model surface runoff depth from rainfall amount, soil surface characteristics and antecedent wetness. It is also used to predict runoff and infiltration (USDA, 2004). It is applicable to small catchments (≤ 6,500 ha) (NRCS, 2002) and has been implemented in models to estimate agrochemical transport to water (e.g., SWAT—Arnold et al., 1998; PRZM—Carsel et al., 2003; APEX—Williams et al., 2006; CREAMS—Knisel, 1980) and has been shown to be robust for a range of climates, soil types and land uses (e.g., Gassman et al., 2007). It has been found to perform better than an infiltration model in modeling runoff in an agricultural catchment in England (Kannan et al., 2007). Many CN models predict runoff depths for individual weather events using an empirical relationship between direct runoff depth, rainfall amount, soil surface characteristics and antecedent wetness (USDA, 2004). The rainfall amount at which runoff starts depends on the maximum potential retention, which in turn, depends on land use and soil type. The CN approach provides a widely used and effective method for estimating direct runoff due to rainfall. Despite its simplicity, and the availability of CNs for various land use and soil type combinations (Chow et al., 1988; Pilgrim and Cordery, 1993; USDA, 2004), operationally it can be difficult to estimate the antecedent soil moisture conditions. Although the antecedent soil water status has been estimated from 5-day antecedent rainfall (e.g., Mishra et al., 2005), this has been shown to be poorly correlated with maximum potential retention (USDA, 2004).
Decision Support Tools
User-facing decision tools started to emerge with the advent of easily programmable GISs with graphical user interfaces. These were developed to support farming compliance under newly legislated environmental directives, such as the Water Framework Directive (WFD Water Framework Directive, 2000) in Europe, and sought to minimize the externalities of agricultural activity on waterbodies. Decision tools, for use by both farmers and policy makers, were developed over a range of spatial scales: nationally, at typical scales of 1, 5, and 10 km2 and Europe-wide at scales of 10, 20 and 50 km2. Examples of UK models include those of Webb and Misselbrook (2004), Chadwick et al. (2005), Chambers et al. (1999), Davison et al. (2008), Lord and Anthony (2000) and Lord (1992) many of which are summarized in Anthony et al. (2008). At the European scale, similar models include PyCatch (Schmitz et al., 2017) and the FOOTPRINT (Functional Tools for Pesticide Risk Assessment and Management) framework which integrates pesticide use information with a physically based field scale soil water model (Jarvis et al., 2000) for drainage and leaching pathways and PRZM (Suarez, 2005) for runoff and erosion pathways. Hydrological modeling frameworks have also been used to simulate agrochemical runoff (Kannan et al., 2006; Ficklin et al., 2013; Bannwarth et al., 2014; Zhang et al., 2018). A key and unavoidable characteristic of existing landscape process-based models is that their outputs and the scales they report over are spatially and temporally incompatible with the expectations and needs of land managers. Here, a key limitation is the fact they are underpinned by highly static, spatially and temporally aggregated data by way of model inputs such as underlying soil types, drainage, land use, climate, terrain characteristics and farming practice.
Research Aims
The critical gap, common to SCN models and decision support tools, regardless of scale, is that they do not incorporate live and dynamically updated data on soil condition or rainfall. Very detailed and precise prediction models for soil water balances and associated runoff, leaching and pollution risks (e.g., Pullan et al., 2016; Morselli et al., 2018) require specific, local information that cannot be obtained from generalized GIS layers, often requiring in situ parameterisation and measurement. This is because data may not be freely available (e.g., soils data), are dis-aggregates of coarser scale data (e.g., agricultural land use) or are themselves modeled outputs (e.g., landscape connectivity data). A further key issue across scales and model types is that they commonly suffer from poor performance when evaluated using monitoring data despite being very heavily parameterized (Bieger et al., 2014; Gassmann et al., 2014; Zeiger and Hubbart, 2016). For this reason, recent research has explored the use of parsimonious tools for pesticide risk (e.g., Gaßmann et al., 2013; Steffens et al., 2015; Pullan et al., 2016).
It is against this background, that this paper describes the development of two decision tools providing real-time, spatially-explicit and temporally-dynamic field runoff and field-to-channel pesticide delivery risk information for supporting decisions regarding pesticide application (field scale) or management of surface water withdrawal for public water supply (catchment scale). These are demonstrated for two example agro-chemical applications in two differing environmental settings in the UK. The tools incorporate parsimonious field runoff and field-to-channel delivery models that combine real-time data of antecedent, current and predicted rainfall obtained from a national meteorological institute API. Both tools generate real-time predictions of current and future agro-chemical field runoff or field-to-channel delivery risk over a 5-day window. A key distinction is that the field scale tool has a focus on quantifying runoff risk, whereas the catchment scale tool focuses on quantifying the risk of delivery to the channel network—i.e., pesticide delivery risk rather than runoff risk.
Methods and New Models
Two case-study catchments were selected. The Wissey catchment in eastern England is dominated by arable cropping and has a potential risk of metaldehyde in waterbodies. Metaldehyde is used to treat slugs on oil seed rape, potatoes and horticultural crops and was responsible for 23% of failures to meet drinking water standards in the 4th quarter of 2016 in England and Wales (Defra, 2017a). Metaldehyde also topped the list of pesticides which breached the 0.1 μg/l drinking water safety limit between 2013 and 2015 (Defra, 2017b). In contrast, the Teifi catchment in mid-Wales, is dominated by grassland used for livestock. Here, acid herbicide applications for managing weeds in pastures represents a risk for drinking water quality. Field and landscape (catchment) scale models were developed for both case studies using the methods described below. For illustration in this paper, the results present the application of the field model and tool for runoff risk in the Teifi catchment in Wales, and the landscape scale model and tool for metaldehyde delivery risk in the Wissey catchment in England.
Field Scale Model
Overview
The aim of the field scale model was to provide location specific information of current and predicted future (5 day) runoff risks, at a 1 km2 grid cell scale representing the field. It sought to support on-farm decisions about agro-chemical applications and to provide forecasts of whether any surface runoff is expected at the field scale. Although a soil water balance model could be used to antecedent soil water conditions and the CN method (USDA, 2004) to assess potential field runoff in real-time, data and computational requirements are an important limitation. In addition, fully parameterized soil water balance models require a known starting condition and are prone to cumulative errors, particularly during periods of low rainfall. From an operation point of view, using a soil water balance model to estimate antecedent soil water conditions also requires the user (farmer) to collect and process rainfall data even during periods when runoff risk forecasts are not required. To overcome this, a meta-modeling approach was used to estimate antecedent soil conditions from soil type, long-term average soil water content for the day of year, recent recorded rainfall and short-term forecast rainfall. An overview of the field scale model is shown in Figure 1.
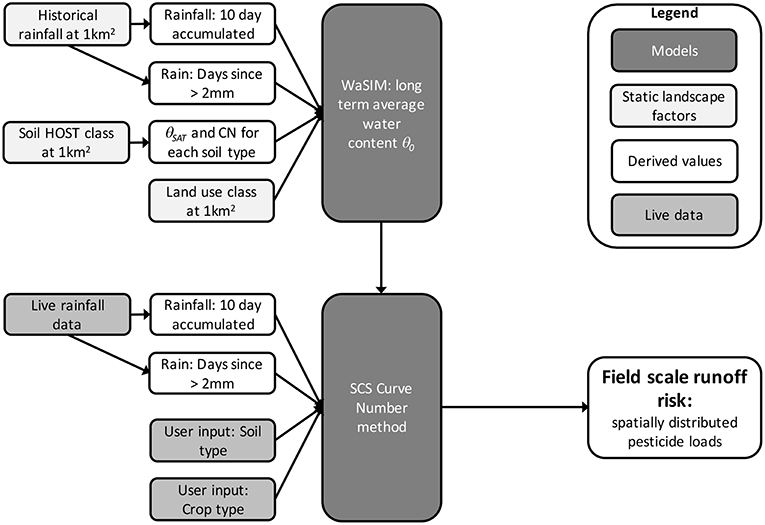
Figure 1. The field scale runoff risk model.
Data and Model
The soil water balance model, WaSim (Hess and Counsell, 2000), was used to estimate daily soil water condition (θ) using the approach described by Hess et al. (2010) and Holman et al. (2011). It used a long time-series (1961 to 2015) of daily rainfall and reference evapotranspiration data at 1 km2 resolution from the CEH CHESS dataset (Robinson et al., 2016, 2017) for each of the 28 hydrology of soil type (HOST) (Boorman et al., 1995) classes found in England and Wales, and three land cover classes.
WaSim is a daily soil water balance model that simulates changes in root zone soil water content and water table position in response to weather and water management. It estimates changes in soil water content by combining data on rainfall, crop specific evapotranspiration, soil characteristics and field drainage. It estimates daily surface runoff using a CN approach based on the soil water content using the approach of Hawkins et al. (1985) and Garen (1996).
The water content of the upper (0–0.15 m) layer (θ0) is estimated from daily effective rainfall, evapotranspiration and drainage to a lower layer. The proportion of the soil water stored above field capacity (θFC) that is released from a saturated soil increases from zero at θFC to a maximum at saturation (θSAT) following an exponential function (Raes and van Aelst, 1985) dependent on the texture of the upper soil layer. Validation of predicted field-scale runoff is difficult due to the paucity of field-scale runoff data for a sufficient range of soil, crop and climate conditions for national application. However, Holman et al. (2011) evaluated partitioning of hydrologically effective rainfall between slow and quick flow-paths in the WaSim model by upscaling to the catchment scale across all of England and Wales. For 27 out of the 29 HOST soil classes (Boorman et al., 1995) (peat soils excepted). The WaSim estimates of baseflow index (BFI) were within the 95% confidence intervals of the national-average BFI, suggesting that the model is adequately capturing the effect of soil type and wetness on runoff generation.
Using linear regression on a subset of the data (1961–2000), the daily soil water condition was modeled from the 10 previous days' accumulated rainfall (P10), the number of days since the last day with rainfall >2 mm (P2) and long-term average modeled daily soil water condition (θi) for each the day of the year, i. The resulting linear regression models were shown to fit well to the soil water conditions modeled by the soil water balance model for an independent timeseries (2001-2015), summarized in Section Model Validation and as described in Comber et al. (2018). The parameterized regression model was then used with recent and short-term forecast rainfall data to forecast runoff, R, using the CN method of Hawkins et al. (1985) and Garen (1996) as follows: for rainfall, P (mm d−1), greater than a threshold value, I (mm), direct runoff, R (mm d−1), is estimated from:
where S is the maximum retention, mm and the threshold I is defined as
Note that λ (dimensionless) is an empirical value that represents the proportion of rainfall on a soil at average antecedent conditions that can fall without generating runoff, and is typically set to 0.2.
On a particular day, S was estimated from the retention at dry antecedent conditions, S1 (mm), the relative saturation of the top 0.15 m of the soil, fs (dimensionless) and two weighting factors, W1 and W2 for retention (Hawkins et al., 1985):
The retention, Sn (mm), at dry (n = 1), average (n = 2) and wet (n = 3) antecedent conditions, is estimated from the curve number, N2 (dimensionless) at average antecedent conditions (Garen, 1996).
Model Validation
Hess et al. (2010) used a continuous water balance model, WaSim (Hess and Counsell, 2000) to model daily soil water content and estimate daily surface runoff using a CN approach. WaSim is a one-dimensional, field-scale layered soil-water balance model that operates on a daily timestep. The water content of the upper (0–0.15 m) layer, θ0 (dimensionless), is estimated from daily effective rainfall (P- R), evapotranspiration, E (mm d−1) and drainage to a lower layer, D (mm d−1). D increases with θ0 from zero at field capacity, θFC, to a maximum at saturation, θSAT, following an exponential function (Raes and van Aelst, 1985):
Where τ (d−1) is the proportion of the soil water stored above field capacity that is released from a saturated soil in 1 day and is dependent on the soil texture, and 150 (mm) is the thickness of the upper soil layer.
Three linear regression models, M1 to M3, were calibrated against θ0 for each soil and climate combination in each of the two study areas:
• M1 is a simple linear regression of θ0 against the 5-day accumulated antecedent rainfall, P5 under the expectation that for a given location and soil type, θ0 will be correlated with the antecedent rainfall;
• M2 considered the 10-day accumulated antecedent rainfall, P10, and the number of days since the last rainfall >2 mm, JP>2;
• M3 considered the 10-day accumulated antecedent rainfall, P10, the number of days since the last rainfall >2 mm, JP > 2 and also considers the long-term average value of θ0 for the day of the year, (θi). This assumed that the effect of antecedent rainfall on θ0 may vary with seasonal variation in θ0. For example, a small P10 on at a time of year when the soil is generally wet would result in wetter antecedent conditions than at a time when the soil is generally drier.
Each model is summarized in Table 1 and was calibrated against the WaSim continuous model and then used to estimate θ0.
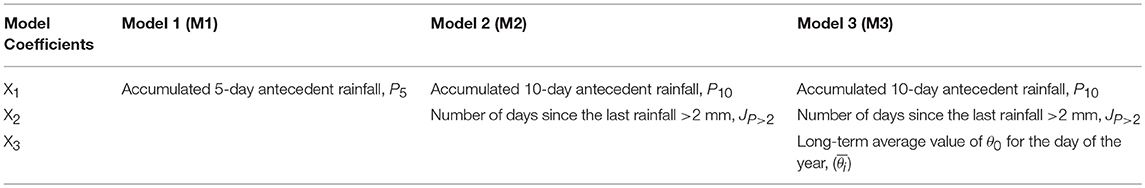
Table 1. A summary of the different models that were evaluated.
Table 2 shows the coefficient estimates of the three locally calibrated linear models to estimate antecedent soil moisture conditions, adjusted for each site and soil type. It also includes the root mean squared error (RMSE), mm d−1, between upper layer soil water content from a continuous model and the three meta-models for the calibration (1961-2000) and validation (2001-2015) periods. For the two models relying only on antecedent rainfall (M1 and M2) the intercept is the most important coefficient of the model, taking values close to the volume water fraction at field capacity. The M3 coefficients demonstrate the importance of including average soil moisture conditions and the major difference between parameters is driven by weather conditions rather than by soil type. Similarly the validation results show that M3 achieves the best results for both soil types and both climates. Moreover, the results suggest that introducing the daily average soil moisture content has an important impact on the quality of the model.
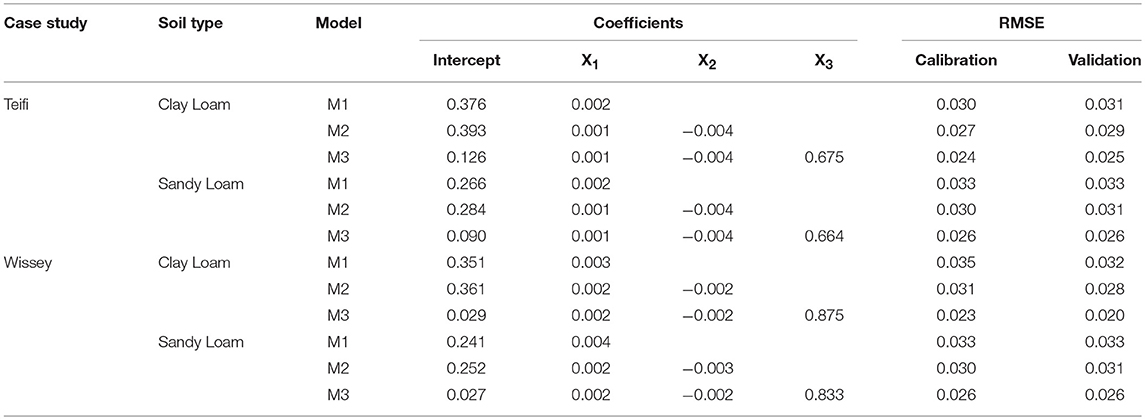
Table 2. Coefficients of the three linear models and the root mean squared error (RMSE), mm d−1, for the calibration (1961–2000) and validation (2001–2015) periods.
Landscape Scale Model
Overview
The landscape scale model provides spatially distributed information on pesticide delivery risk. The overarching aim was to identify field-to-channel delivery risk hotspots to support and inform catchment management and on-the-ground follow up by environmental agencies and water companies. It therefore identifies locations of high risk that may require further investigation. The landscape scale tool generates a spatially-distributed field-to-channel delivery risk surface to inform drinking water abstraction decisions. The output predicts the spatial pattern of mobilized pesticide loadings delivered to receiving watercourses. The parsimonious approach combines layers of intrinsic landscape scale factors, runoff and pollutant transfer, national historical daily rainfall data from the CEH Gridded Estimates of Areal Rainfall dataset (Keller et al., 2015), as well as live data of current and antecedent rainfall, as summarized in Figure 2.
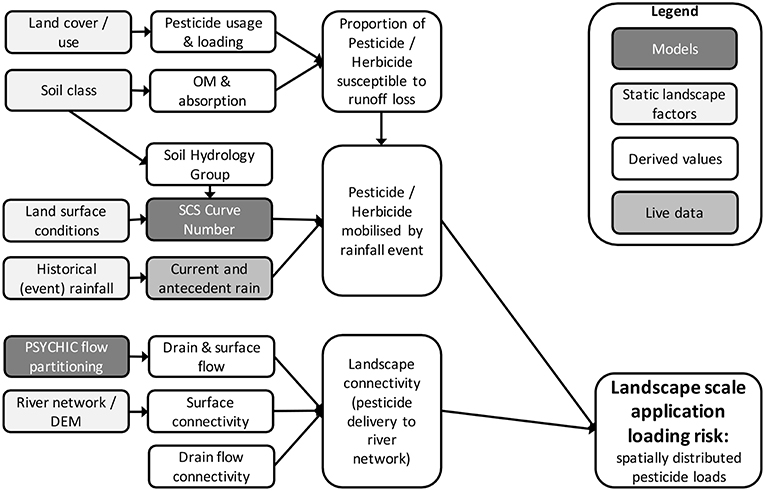
Figure 2. The parsimonious landscape scale model. OM, organic matter.
A source-mobilization-delivery-impact model of the water pollutant transfer continuum (Lemunyon and Gilbert, 1993; Haygarth et al., 2005; Zhang et al., 2017b) was adopted. In this framework, runoff following rainfall is the key mobilization force and the proportion of pesticide load available for mobilization into the runoff moving down the soil profile to field drains or downslope across the land surface is assumed to be the same as the ratio of runoff amount to event rainfall total. Pesticides are therefore partly absorbed by the soil and non-binding pesticides are mobilized in runoff. This multiplicative correction approach is similar to that used by Verro et al. (2002). The landscape model recognizes that rainfall can reach watercourses via different delivery pathways (e.g., surface runoff, drain flow) and measures of hydrological connectivity between agricultural fields and the river channel network influence the propensity for mobilized pollution (e.g., pesticides) to reach the watercourses. In the case of the latter, surface runoff connectivity is calculated using distance to river channel and the downslope average slope gradient using a high resolution digital elevation model (DEM) and channel network data layer (Prosser and Rustomji, 2000; Walling and Zhang, 2004), whereas drain flow connectivity uses farm-type specific estimates based on recent surveys of drain maintenance associated with the upkeep of the permeable backfill or drain freeboard, as well as the frequency of supportive mole plowing (Zhang et al., 2016).
Data and Model
Data at 1 km2 resolution were assembled for each case study area. The proportions of different land use including crop types in each grid cell (Comber et al., 2008) were matched with freely available data on pesticide application rates to determine pesticide loadings to farmed land. The land use data described in Comber et al. (2008) uses advanced spatial disaggregation methods to robustly allocate agricultural census data from the June Survey of Agriculture and Horticulture (JAS). JAS data are reported at coarse spatial units (such as Parish level) and the disaggregation is to finer spatial units such as 1 km2. This data underpins many tools supporting national level policy support. Garthwaite et al. (2013, 2014, 2015) describe pesticide usage on different agricultural land uses and spatially distributed pesticide loadings to agricultural land were estimated by linking the land use proportions of each 1 km2 to the reported pesticide usage for that land use.
The loadings from all applications to agricultural land are then modified to estimate the loading susceptible to runoff mobilization and delivery from field-to-channel by the soil sorption capacity for the pesticide in question, which is modeled as a function of known pesticide behavior and soil organic carbon content (% OC). Accordingly, the proportion of chemical loading susceptible to mobilization and runoff loss with rainfall, K is calculated as follows:
where Koc is a measure of the tendency of a chemical to bind to soils (an adsorption coefficient) set at 67 in the Wissey and 20 in the Teifi study catchments.
Runoff was estimated using the Mishra-Singh model (Mishra et al., 2005), a modified CN method, that accounts for event rainfall and antecedent soil moisture conditions. To estimate runoff (R, mm), event rainfall (P, mm) and the antecedent 5-day rainfall (P5,mm) are required, as well as an estimate of storage depth (S, mm), initial abstraction (Ia) and an intermediary term, M:
where λ is an empirical value which typically set to 0.2. The CN values for different soil types, land use and surface conditions are based on Hess et al. (2010) using the UK Hydrology of Soil Type (HOST) classification (Boorman et al., 1995). These were mapped into four hydrological soil groups (A, B, C, D) to reflect the minimum rate of rainfall infiltration for bare soil after prolonged wetting and the transmission rate within the soil profile, under five land use types; grass, row crops, small grains, semi-naturals and woodlands (Table 3).
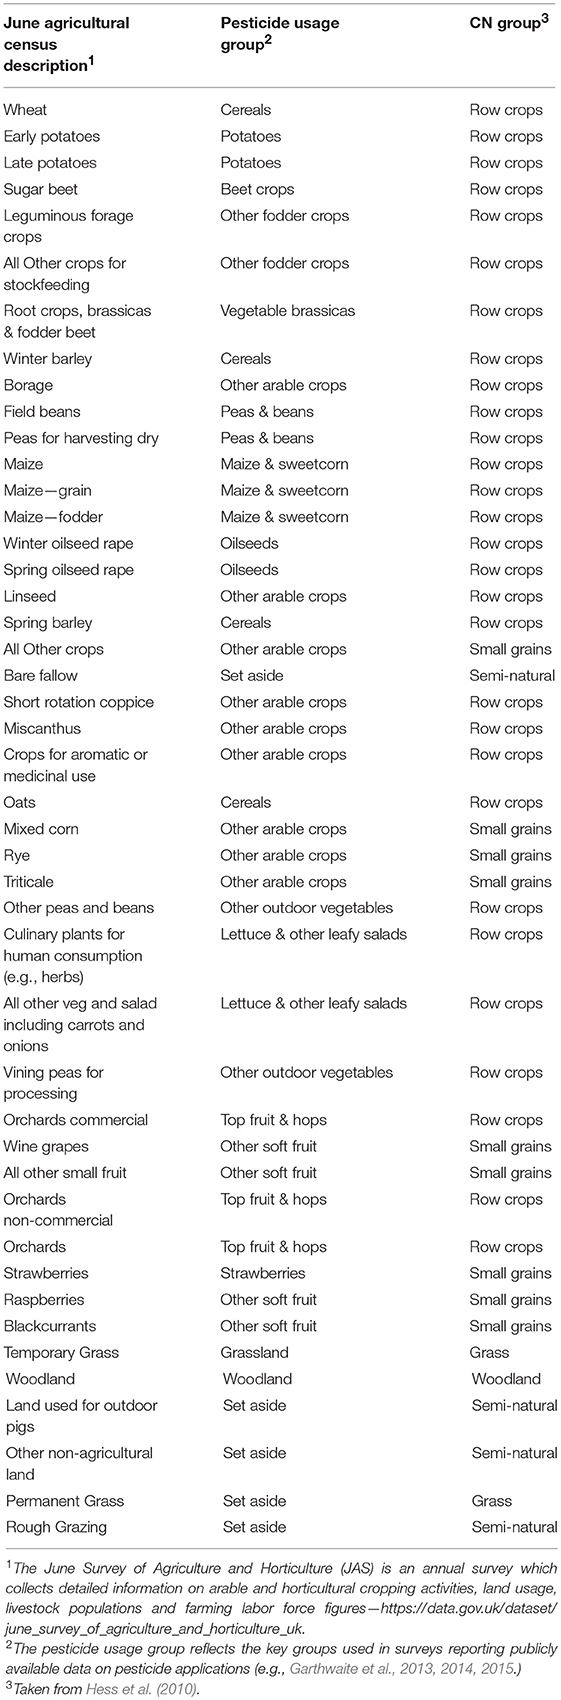
Table 3. Pesticide usage and Curve Number (CN) groups for different land use categories.
The JAS classes were linked to pesticide survey usage categories and, in turn, the CN categories in Hess et al. (2010). Hess et al. (2010) proposed appropriate CNs for each unique combination of grouped soil type and land cover, dependent upon the surface condition which is classified as either “good” or “poor”. A CN of 0 represents maximum storage, whilst a score of 100 suggests zero storage (i.e., a totally impermeable soil). The hydrological soil groups reflect the minimum rate of rainfall infiltration for bare soil after prolonged wetting and the transmission rate within the soil profile. Group A soils are characterized by low runoff potential and high infiltration rate even when wetted, with a transmission rate of >7.6 mm/hr. Group B soils have a moderate infiltration rate and are typified by moderate to well drained soils with transmission rates of 3.8–7.6 mm/hr. Group C soils have low infiltration rates and are typified by moderately fine to fine texture and a layer impeding downward water movement, yielding transmission rates of 1.3–3.8 mm/hr. Finally, group D soils have high runoff potential and very low infiltration rates, typifying clay soils with very low transmission rates of 0–1.3 mm/hr. CN values recommended by Hess et al. (2010) are presented in Table 4.
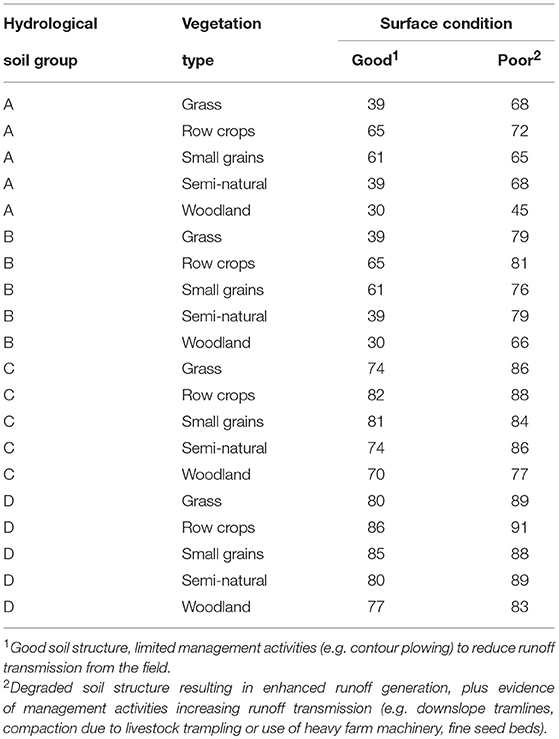
Table 4. Curve Numbers (CN) for surface runoff generation based on Hess et al. (2010).
Finally, hydrology outputs from a process-based model developed for national policy support, namely PSYCHIC (Collins et al., 2007, 2009; Collins and Anthony, 2008; Davison et al., 2008; Stromqvist et al., 2008; Comber et al., 2013; Collins and Zhang, 2016; Phosphorus and Sediment Yield CHaracterisation In Catchments), were used to derive monthly soil runoff partitioning between surface and drain flow pathways for each 1 km2. The PSYCHIC model runs use a combination of baseline climate conditions (1961 to 1990) and 2010 JAS.
Model Validation
The validation of a landscape scale model predicting 1 km2 risk surfaces, i.e., providing information to support Tier 1 screening of risk, is inherently difficult. The model reported here provides information on landscape scale risk and empirical pesticide data, collected at an appropriate resolution, simply does not exist at appropriate scales for validating the modeled patterns of spatial risk. However, previous research (e.g., Collins and Anthony, 2008; Stromqvist et al., 2008; Collins and Zhang, 2016; Collins et al., 2016; Zhang et al., 2017a,b) has evaluated the catchment and broader scale spatial patterns predicted for aggregated diffuse pollution (nutrients and sediment, not pesticides) delivery to watercourses using the underlying algorithms from PSYCHIC that are incorporated in the landscape model, using available local (i.e., original PSYCHIC model research project) or strategic monitoring data in the form of 1991-2010 PARCOM (Neal and Davies, 2003) reporting and the Harmonized Monitoring Scheme (https://data.gov.uk/dataset/b17a2efa-bdd6-4740-8030-fb87f7f2bcff/historic-uk-water-quality-sampling-harmonized-monitoring-scheme-detailed-data) at 33 stations for the period 1980-2010. Paris Commission (PARCOM) monitoring is undertaken as part of the 1992 OSPAR (Oslo–Paris) Convention which combined the 1972 Oslo Convention on dumping waste at sea and the 1974 Paris Convention on land-based sources of marine pollution. PARCOM monitoring is undertaken to report the delivery of terrestrial pollutants to the maritime area in accordance with the OSPAR Convention. The Harmonized Monitoring Scheme is a long-term water quality scheme in the UK that was initiated by the Department of the Environment in 1974.
Results
The field and catchment scale models were coded in R and interactive web tools with an Open Street Map front end were created in RMarkdown using the leaflet, flexdashboard, shiny, sp, dygraphs and reshape2 R packages. Recent and short-term forecast rainfall was recognized as a critical input for each scale in order to determine field runoff and field-to-channel delivery risk. For each study catchment, live weather data and precipitation forecasts from the Meteorological Office (the UK's national weather service) DataPoint API (The Met Office, 2018) were downloaded for each day, interpolated into a 1 km2 grid and stored in raster stack. These were used to serve the online models with antecedent, current and predicted rainfall data for each 1 km2. The online web tools are dynamic, calculating field runoff or field-to-channel delivery risk at each location from the live precipitation data and the user inputs. A zoomable OpenStreetMap layer provided the background mapping.
Field Scale Tool
The intention of the field scale tool was that it would be used by farmers and farm managers to inform their day-to-day decision making around agricultural chemical applications. The web interface asks users to enter a postcode, and then to click on an individual 1 km2 grid cell. For the purposes of the models demonstrated here, the interface in Wales assumes an Acid herbicide application decision and in the East of England a Metaldehyde application (only the Wales tool is illustrated). The runoff risk for the selected grid cell for the next 5 days is shown in text format below the map and there are a number of tabs containing additional information. A screen grab of the catchment scale tool is shown in Figure 3. Here rainfall and runoff risk are not quantified, they are simply stated if predicted to be present at the selected location for the selected time period +5 days, as described above.
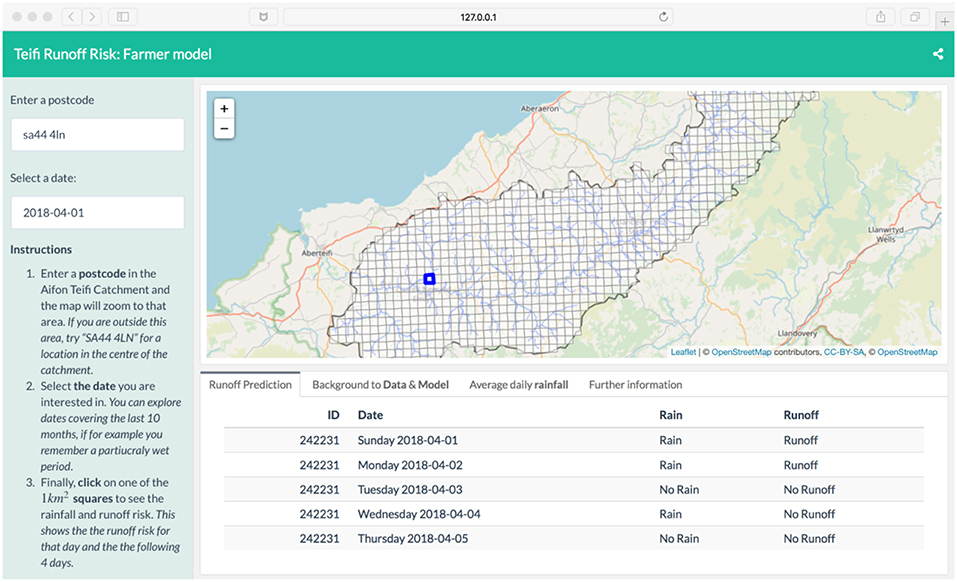
Figure 3. A screenshot of output from the Teifi catchment field scale runoff risk model at https://github.com/lexcomber/saric.
Catchment Scale Tool
The catchment scale tool was aimed at land and environmental managers with catchment / sub-catchment and watershed remits, including local water companies. Runoff and pesticide field-to-channel delivery risk is mapped and indicates locations with varying risk, given current and antecedent rainfall conditions, with the aim of supporting drinking water abstraction operations. The on-line tool asks users to indicate the agro-chemical they are interested in, the status of the soil and the date for which they require field-to-channel delivery risk estimates. For this proof of concept tool, the choices for agro-chemicals are limited to “Metaldehyde” and “Acid Herbicide,” and the choices for soil status to “Good” or “Poor.” The runoff risk is R (mm) from Equation 15 was categorized into 4 classes of risk: None when R = 0, Low when 0 < R < = 0.02, Moderate when 0.02 < R < = 0.05 and High when R > 0.05. In contrast to the field scale tool, the aim here was to provide users with landscape and catchment scale policy responsibilities with some information about the degree of pesticide delivery risk across the 1 km2 grid cells comprising the study area. The user can pick any date between current date and October 2017 with the aim of allowing users to explore known runoff events and the degree to which the tool predicted any locally observed runoff and this is supported by an interactive (dy)graph of the mean rainfall in this period for this area. When the user selects a date, the current and previous 5-day rainfall for each 1 km2 are extracted and the model is run generating a surface of predicted pesticide delivery risk. The boxplots show the rainfall for the previous 5 days and the date being queried. A screen grab of the catchment scale model application to the Wissey catchment is shown in Figure 4.
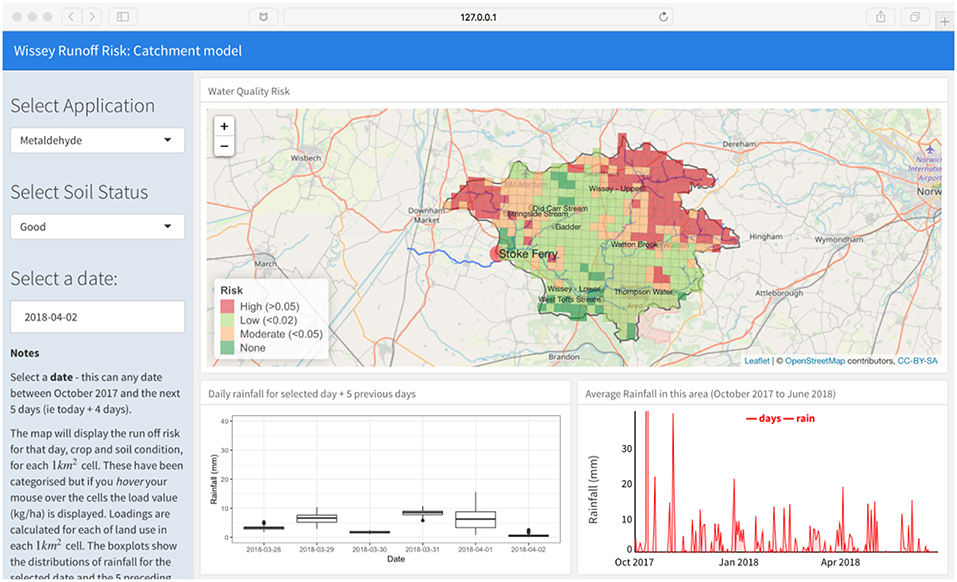
Figure 4. A screenshot of output from the Wissey catchment scale field-to-channel delivery risk model at https://github.com/lexcomber/saric.
Concluding Remarks
The effective use of agrochemicals in modern agriculture contributes to sustained crop yields and quality. However, agrochemicals are less effective when they “run off” into surface and groundwaters soon after they are applied. The risk of this happening increases when agrochemicals are applied to wet (saturated) soils and when rainfall occurs soon after application. Runoff and associated pollutant delivery from field-to-channel also has negative impacts on environmental and drinking water quality when agrochemicals are transferred to surface or groundwater.
This paper describes a novel, generic and parsimonious modeling framework that integrates dual-scale soil water interaction models with real-time weather data. It addresses a number of impediments to the use of existing runoff risk models to inform on-farm management decisions and catchment management.
i) Most soil-water interaction models have high data and input parameter requirements to generate daily time-step simulations of processes related plant and crop growth.
ii) Consequently they require in-depth knowledge about input process parameters.
iii) They frequently require data which may not be available, for example to non-academic or non-research organizations, or to farmers and commercial companies.
iv) Many of these models perform poorly when compared with observed monitoring data (e.g., Zeiger and Hubbart, 2016).
v) Finally, because of these issues, existing models are not easily integrated into tools able to quantify the real-time field runoff and field-to-channel delivery risks which are required to support more reactive and effective agrochemical management decisions on the ground.
The dynamic, real-time decision tools developed in this research do not address all of these issues (there remain difficulties in validating the detailed spatial patterns predicted by any catchment scale model, for example). However, the provision of spatially- and temporally- explicit runoff and pesticide delivery risk information using parsimonious models is novel. We have demonstrated their applicability for two spatial scales of decision making: on-farm and catchment. The individual components of the parsimonious tools are not new: field and catchment scale models of pesticide and herbicide runoff have existed for a long time. But, critically, existing tools fail to provide timely and thereby useful information to managers. There are many live and location specific weather forecasting websites, smartphone apps and tools. As yet, however, real-time forecasting and soil water models have not been linked in an accessible and user-friendly way. In most decision tools, the model data inputs are relatively static (e.g., cropping systems, soil conditions, measures of catchment scale field drainage, etc) and do not support location- and time-specific queries. The result is that the modeled soil-water interactions and pesticide persistence represent some kind of generalized overall runoff trend rather than a specific local runoff measure.
There are a number of areas of potential future work emerging from this research for the further development of this modeling framework. The field and catchment scale models are very much proofs of concept and demonstrate how parsimonious but sensitive runoff risk models could be included in such frameworks. The utility of the tools and the interfaces from the end user perspective could be enhanced and the scope of the tools could be expanded in a number of ways. In our generic approach for both field and catchment scales, the critical variables driving field runoff and field-to-channel delivery risk are those related to antecedent, current and forecast rainfall in combination with fundamental intrinsic controls. In previous models, these have been assumed under a suite of potential scenarios that the user has to choose from. However, the ability to link to spatially- and temporally- explicit data for the rainfall variables through APIs offers a new avenue for enhancing the wider application and utility of soil-water-connectivity models. The future ability to serve many different types of geo-spatial data in this way via distributed data portals will only increase, reducing the dependency on locally held data. The landscape scale tool could be expanded to include nested watershed, catchment and sub-catchment scales and any corresponding aggregation associated with instream transfer processes. A further area for development would be to account for “noise” in runoff from agricultural applications, not least of which are point pollution due to poor on farm practice (incidental spillages, etc), runoff from domestic and managed green space applications as well as pesticide spray drift. A final and critical area of further work in the context of the approaches described is the inclusion of high accuracy rainfall data. This project used publicly available rainfall data served through the UK Met Office's API and interpolated over a 1 km2 grid. Higher quality data is not provided for free. As the models inherently depend on rainfall (to parameterise the soil wetness factors through antecedent rainfall, to model current risk and determine future risk projections), the greatest influence on the quality of the model outputs is driven by this data.
In summary, the tools developed in this research provide user interfaces to stripped down, parsimonious soil-water-connectivity models that take advantage of the availability of live rainfall data. Their components reflect the importance of knowledge of past and current rainfall as drivers of field runoff and field-to-channel delivery. To this end, each model pre-computed long-term water content for different soil types and crops, was linked to a live rainfall data feed and requested a very small amount of information from users (date, soil status, crop type) from which field runoff and field-to-channel delivery risk was computed using antecedent and current rainfall. The wider applicability of this research is underpinned by the generic nature of the parsimonious modeling framework. Assuming the availability of relevant mechanistic understanding and information on application doses, the models could easily be extended to predict risks to water quality and the wider environment for any agricultural application at the farm decision scale or at the landscape management scale. Future work will develop a more strategic and commercial framework for a wider suite of parsimonious models.
Author Contributions
AC, ALC, TH, and AS conceived the ideas behind the study and guided other contributors. DH-M and YZ developed the models. AT developed the underpinning data collection. AC developed the web-based models. AC, ALC, and TH led the writing.
Conflict of Interest Statement
The authors declare that the research was conducted in the absence of any commercial or financial relationships that could be construed as a potential conflict of interest.
Acknowledgments
This research was supported by the UK Natural Environment Research Council via grant NE/P007988/1. Rothamsted Research receives strategic funding from the UK Biotechnology and Biological Sciences Research Council (BBSRC) and the contribution to this paper by ALC and YZ was also supported by grant BBS/E/C/000I0330 (Soil to Nutrition).
Footnotes
References
Anthony, S., Duethman, D., Gooday, R., Harris, D., Newell-Price, P., Chadwick, D., et al. (2008). Quantitative Assessment of Scenarios for Managing Trade-Off Between Economics, Environment and Media. Report No. Defra WQ0106 (Module 6). Defra, ADAS, North Wyke Research.
Arnold, J. G., Srinivasan, R., Muttiah, R. S., and Williams, J. R. (1998). Large area hydrologic modeling and assessment part I: model development 1. J. Am. Water Resour. Assoc. 34, 73–89. doi: 10.1111/j.1752-1688.1998.tb05961.x
Bannwarth, M. A., Sangchan, W., Hugenschmidt, C., Lamers, M., Ingwersen, J., Ziegler, A. D., et al. (2014). Pesticide transport simulation in a tropical catchment by SWAT. Environ. Pollut. 191, 70–79. doi: 10.1016/j.envpol.2014.04.011
Bieger, K., Hörmann, G., and Fohrer, N. (2014). Simulation of streamflow and sediment with the soil and water assessment tool in a data scarce catchment in the three Gorges region, China. J. Environ. Wual. 43, 37–45. doi: 10.2134/jeq2011.0383
Boorman, D. B., Hollis, J. M., and Lilly, A. (1995). Hydrology of Soil Types: a Hydrologically Based Classification of the Soils of the United Kingdom. Wallingford, UK: Institute of Hydrology.
Carsel, R. F., Imhoff, J. C., Hummel, P. R., Cheplick, J. M., and Donigian, A. S. Jr. (2003). PRZM-3, A Model for Predicting Pesticide and Nitrogen Fate in the Crop Root and Unsaturated Soil Zones: Users Manual for Release 3.12. Athens, GA: Center for Exposure Assessment Modeling (CEAM). 535 U.S. Environmental Protection Agency (USEPA).
Chadwick, D., Misselbrook, T., Gilhespy, S., Williams, J., Bhogal, A., Sagoo, L., et al. (2005). Ammonia Emissions and Crop N Use Efficiency to Grassland and Tillage Land; Factors Affecting Ammonia Emissions From Urea Based Fertilisers; Ammonia Emissions Model. Report No. Defra NT2605 WP1b. Defra, IGER, ADAS.
Chambers, B. J., Lord, E. I., Nicholson, F. A., and Smith, K. A. (1999). Predicting nitrogen availability and losses following application of organic manures to arable land: MANNER. Soil Use Manag. 15, 137–143. doi: 10.1111/j.1475-2743.1999.tb00079.x
Collins, A. L., and Anthony, S. G. (2008). Assessing the likelihood of catchments across England and Wales meeting ‘good ecological status' due to sediment contributions from agricultural sources. Environ. Sci. Policy 11, 163–170. doi: 10.1016/j.envsci.2007.07.008
Collins, A. L., Anthony, S. G., Hawley, J., and Turner, T. (2009). The potential impact of projected change in farming by 2015 on the importance of the agricultural sector as a sediment source in England and Wales. Catena 79, 243–250. doi: 10.1016/j.catena.2009.05.007
Collins, A. L., Stromqvist, J., Davison, P. S., and Lord, E. I. (2007). Appraisal of phosphorus and sediment transfer in three pilot areas identified for the catchment sensitive farming initiative in England: application of the prototype PSYCHIC model. Soil Use Manag. 23, 117–132. doi: 10.1111/j.1475-2743.2007.00119.x
Collins, A. L., and Zhang, Y. (2016). Exceedance of modern ‘background' fine-grained sediment delivery to rivers due to current agricultural land use and uptake of water pollution mitigation options across England and Wales. Environ. Sci. Pol. 61, 61–73. doi: 10.1016/j.envsci.2016.03.017
Collins, A. L., Zhang, Y. S., Winter, M., Inman, A., Jones, J. I., Johnes, P. J., et al. (2016). Tackling agricultural diffuse pollution: what might uptake of farmer-preferred measures deliver for emissions to water and air. Sci. Total Environ. 547, 269–281. doi: 10.1016/j.scitotenv.2015.12.130
Comber, A., Collins, A., Haro, D., Hess, T., Smith, A., Turner, A., et al. (2018). “Real-time predictions of pesticide runoff risk: linking multi-scale runoff models and weather data APIs to improve water quality,” in Geospatial Technologies for All 21st AGILE Conference Proceedings (Lund). Available online at: https://agile-online.org/conference_paper/cds/agile_2018/shortpapers/93%20Agile_paper_sub.pdf
Comber, A. J., Proctor, C., and Anthony, S. (2008). The creation of a national agricultural land use dataset: combining pycnophylactic interpolation with dasymetric mapping techniques Transactions in GIS 12, 775–791. doi: 10.1111/j.1467-9671.2008.01130.x
Comber, S. D., Smith, S., Daldorph, P., Gardner, M. J., Constantino, C., and Ellor, B. (2013). Development of a chemical source apportionment decision support framework for catchment management. Environ. Sci. Technol. 47, 9824–9832. doi: 10.1021/es401793e
Davison, P. S., Withers, P. J., Lord, E. I., Betson, M. J., and Stromqvist, J. (2008). PSYCHIC – a process-based model of phosphorus and sediment mobilisation and delivery within agricultural catchments. Part 1: model description and parameterisation. J. Hydrol. 350, 290–302. doi: 10.1016/j.jhydrol.2007.10.036
Defra (2013). Developing the potential for Payments for Ecosystem Services: an Action Plan. Available online at: https://www.gov.uk/government/publications/payments-for-ecosystem-services-pes-action-plan (accessed May 20, 2019)
Defra, Drinking Water 2016 Q3. (2017a). A Report by the Chief Inspector of Drinking Water for England and Wales.
Defra, Drinking Water 2016 Q4. (2017b). A Report by the Chief Inspector of Drinking Water for England and Wales.
Ficklin, D. L., Luo, Y., and Zhang, M. (2013). Watershed modelling of hydrology and water quality in the Sacramento River watershed, California. Hydrol. Proc. 27, 236–250. doi: 10.1002/hyp.9222
Gao, J., Liu, L., Liu, X., Lu, J., Zhou, H., Huang, S., et al (2008) Occurrence distribution of organochlorine pesticides – lindane p,p'- DDT, heptachlor epoxide – in surface water of China. Environ. Int. 34, 1097–1103. doi: 10.1016/j.envint.2008.03.011
Garen, D. (1996). Technical Description for Logical Module: Curve_Number_Parameters and Technical Descripton for Logical Module: Runoff. Portland, OR: Natural Resources Conservation Service, National Water and Climate Center
Garthwaite, D., Barker, I., Laybourn, R., Huntly, A., Parrish, G. P., Hudson, S., et al. (2014). Pesticide Usage Survey Report 263. Arable crops in the United Kingdom.
Garthwaite, D., Barker, I., Mace, A., Parrish, G. P., Frost, S., Hallam, C., et al. (2015). Pesticide Usage Survey Report 270. Outdoor vegetable crops in the United Kingdom.
Garthwaite, D., Hudson, S., Barker, I., Parrish, G. P., Smith, L., and Pietravalle, S. (2013). Pesticide Usage Survey Report 255. Grassland & fodder crops in the United Kingdom.
Gassman, P. W., Reyes, M. R., Green, C. H., and Arnold, J. G. (2007). The soil and water assessment tool: historical development, applications, and future research directions. Trans. ASABE 50, 1211–1250. doi: 10.13031/2013.23637
Gassmann, M., Khodorkovsky, M., Friedler, E., Dubowski, Y., and Olsson, O. (2014). Uncertainty in the river export modelling of pesticides and transformation products. Environ. Modell. Softw. 51, 35–44. doi: 10.1016/j.envsoft.2013.09.021
Gaßmann, M., Stamm, C., Olsson, O., Lange, J., Kümmerer, K., and Weiler, M. (2013). Model-based estimation of pesticides and transformation products and their export pathways in a headwater catchment. Hydrol. Earth Syst. Sci. 17, 5213–5228. doi: 10.5194/hess-17-5213-2013
Guo, L., Jury, W. A., Wagenet, R. J., and Flury, M. (2000). Dependence of pesticide degradation on sorption: nonequilibrium model and application to soil reactors. J. Contam. Hydrol. 43, 45–62. doi: 10.1016/S0169-7722(99)00097-2
Hawkins, R. H., Hjelmfelt A. T. Jr., and Zevenbergen, A. W. (1985). Runoff probability, storm depth, and curve numbers. J. Irrigat. Drainage Eng. 111, 330–340. doi: 10.1061/(ASCE)0733-9437(1985)111:4(330)
Haygarth, P. M., Condron, L. M., Heathwaite, A. L., Turner, B. L., and Harris, G. P. (2005). The phosphorus transfer continuum: linking source to impact with an interdisciplinary and multi-scaled approach. Sci. Total Environ. 344, 5–14. doi: 10.1016/j.scitotenv.2005.02.001
Hess, T. M., and Counsell, C. (2000). A Water Balance Simulation Model for Teaching and Learning-WaSim. ICID British Section Irrigation and drainage Research Day 29, 1204–1213.
Hess, T. M., Holman, I. P., Rose, S. C., Rosolova, Z., and Parrott, A. (2010). Estimating the impact of rural land management changes on catchment runoff generation in England and Wales. Hydrol. Proc. 24, 1357–1368. doi: 10.1002/hyp.7598
Holman, I. P., Hess, T. M., and Rose, S. C. (2011). A broad-scale assessment of the effect of improved soil management on catchment Baseflow Index. Hydrol. Proce. 25, 2563–2572. doi: 10.1002/hyp.8131
Jacobs UK Ltd (2008). Environmental Accounts for Agriculture: Report to Defra, Welsh Assembly Government, Scottish Government. London: Department of Agriculture and Rural Development (N. Ireland), Jacobs UK Ltd.
Jarvis, S., Brown, C. D., and Granitz, E. (2000). Sources of error in model predictions of pesticide leaching: a case study using the MACRO model. Agricul. Water Manag. 44, 247–262. doi: 10.1016/S0378-3774(99)00094-3
Kannan, N., White, S. M., Worrall, F., and Whelan, M. J. (2006). Pesticide modelling for a small catchment using SWAT-2000. J. Environ. Sci. Health, Part B 41, 1049–1070. doi: 10.1080/03601230600850804
Kannan, N., White, S. M., Worrall, F., and Whelan, M. J. (2007). Sensitivity analysis and identification of the best evapotranspiration and runoff options for hydrological modelling in SWAT-2000. J. Hydrol. 332, 456–466. doi: 10.1016/j.jhydrol.2006.08.001
Keller, V. D. J., Tanguy, M., Prosdocimi, I., Terry, J. A., Hitt, O., Cole, S. J., et al. (2015). CEH-GEAR: 1 km resolution daily and monthly areal rainfall estimates for the UK for hydrological and other applications. Earth Syst. Sci. Data 7, 143–155. doi: 10.5194/essd-7-143-2015
Knisel, W. G. (1980). CREAMS: a Field Scale Model for Chemicals, Runoff, and Erosion from Agricultural Management Systems. Conservation research report (USA). Washington, DC: Department of Agriculture.
Lapworth, D. J., Baran, N., Stuart, M. E., and Ward, R. S. (2012) Emerging organic contaminants in groundwater: a review of sources, fate occurrence. Environ. Pollut. 163, 287–303. doi: 10.1016/j.envpol.2011.12.034
Lemunyon, J. L., and Gilbert, R. G. (1993). The concept and need for a phosphorus assessment tool. J. Product. Agricul. 6, 483–486. doi: 10.2134/jpa1993.0483
Lord, E. I. (1992). Modelling of nitrate leaching: nitrate sensitive areas. Aspects Appl. Biol. 30, 19–28.
Lord, E. I., and Anthony, S. G. (2000). MAGPIE: a modelling framework for evaluating nitrate losses at national and catchment scales. Soil Use Manag. 16, 167–174. doi: 10.1111/j.1475-2743.2000.tb00222.x
Louchart, X. (2001). Bassin Versant Roujan: Etude des Processus de Contamination Des Eaux Par Les Pesticides in Compte-rendu de l'atelier Dispositifs Pour l'étude du Comportement Des Pesticides Dans L'environnement. Montpellier: INRA, Coordinateur E. Bariuso.
Meyer, A. M., Klein, C., Fünfrocken, E., Kautenburger, R., and Beck, H. P. (2019) Real-time monitoring of water quality to identify pollution pathways in small middle scale rivers. Sci. Total Environ. 651, 2323–2333. doi: 10.1016/j.scitotenv.2018.10.069
Mishra, S. K., Jain, M. K., Bhunya, P. K., and Singh, V. P. (2005) Field applicability of the SCS-CN-based Mishra–Singh general model its variants. Water Res. Manage. 19, 37–62. doi: 10.1007/s11269-005-1076-3
Mitchell, C., Brodie, J., and White, I. (2005) Sediments, nutrients pesticide residues in event flow conditions of the Mackay Whitsunday Region, Australia. Mar. Pollut. Bull. 51, 23–26 doi: 10.1016/j.marpolbul.2004.10.036
Morselli, M., Vitale, C. M., Ippolito, A., Villa, S., Giacchini, R., Vighi, M., et al (2018) Predicting pesticide fate in small cultivated mountain watersheds using the DynAPlus model: toward improved assessment of peak exposure. Sci. Total Environ. 615, 307–318. doi: 10.1016/j.scitotenv.2017.09.287
National Audit Office (2010). Tackling Diffuse Water Pollution in England. Report by the Comptroller and Auditor General. London: National Audit Office.
Neal, C., and Davies, H. (2003). Water quality fluxes for eastern UK rivers entering the North sea: a summary of information from the Land Ocean Interaction Study (LOIS). Sci. Total Environ. 314–316, 821–882. doi: 10.1016/S0048-9697(03)00086-X
Newell-Price, J. P., Harris, D., Chadwick, D. R., Misselbrook, T. H., Taylor, M., Williams, J. R., et al (2011). Mitigation Methods—User Guide. An Inventory of Mitigation Methods and Guide to Their Effects on Diffuse Water Pollution, Greenhouse Gas Emissions and Ammonia Emissions From Agriculture. Prepared as part of Defra project WQ0106. 158. Available online at: https://www.feedadviserregister.org.uk/latest-documents/mitigation-methods–user-guide/mitigationmethods-userguidedecember2011final.pdf
NRCS (2002). Urban Hydrology for Small Watersheds, Technical Release 55 (TR-55). Washington D.C: Natural Resources Conservation Service
Pilgrim, D. H., and Cordery, I. (1993). “Chapter 9: Flood runoff,” in Handbook of hydrology, eds D. R. Maidment (NewYork, NY: McGraw-Hill), 9.1–9.42.
Pretty, J. N., Mason, C. F., Nedwell, D. B., Hine, R. E., Leaf, S., and Dils, R. (2003). Environmental costs of freshwater eutrophication in England and Wales. Environ. Sci. Technol. 37, 201–208. doi: 10.1021/es020793k
Prosser, I. P., and Rustomji, P. (2000). Sediment transport capacity relations for overland flow. Progr Physical Geogr. 24, 179–193. doi: 10.1177/030913330002400202
Pullan, S. P., Whelan, M. J., Rettino, J., Filby, K., Eyre, S., and Holman, I. P. (2016) Development application of a catchment scale pesticide fate transport model for use in drinking water risk assessment. Sci. Total Environ. 563–564, 434–447. doi: 10.1016/j.scitotenv.2016.04.135
Raes, D. D., and van Aelst, P. (1985). The Field Parameters of the BUDGET Model. Internal note, Lab. of Soil and Water Engineering. Leuven: University of Leuven.
Robinson, E. L., Blyth, E., Clark, D. B., Comyn-Platt, E., Finch, J., and Rudd, A. C. (2016). Climate Hydrology and Ecology Research Support System Potential Evapotranspiration Dataset for Great Britain (1961-2015) [CHESS-PE]. NERC Environmental Information Data Centre.
Robinson, E. L., Blyth, E., Clark, D. B., Comyn-Platt, E., Finch, J., and Rudd, A. C. (2017). Climate Hydrology and Ecology Research Support System Meteorology Dataset for Great Britain (1961-2015) [CHESS-met] v1.2. NERC Environmental Information Data Centre.
Schmitz, O., van der Perk, M., Karssenberg, D., Häring, T., and Jene, B. (2017). Spatially distributed modelling of pesticide leaching at European scale with the PyCatch modelling framework. Geophys. Res. Abstract. 19, EGU2017-14737.
Steffens, K., Jarvis, N., Lewan, E., Lindström, B., Kreuger, J., Kjellström, E., et al. (2015). Direct and indirect effects of climate change on herbicide leaching—A regional scale assessment in Sweden. Sci. Total Environ. 514, 239–249. doi: 10.1016/j.scitotenv.2014.12.049
Stromqvist, J., Collins, A. L., Davison, P. S., and Lord, E. I. (2008). PSYCHIC – a process-based model of phosphorus and sediment transfers within agricultural catchments. Part 2. A preliminary evaluation. J. Hydrol. 350, 303–316. doi: 10.1016/j.jhydrol.2007.10.044
Suarez, L. A. (2005). PRZM-3, A Model for Predicting Pesticide and Nitrogen Fate in the Crop Root and Unsaturated Soil Zones: Users Manual for Release 3.12.2. Athens: National Exposure Research Laboratory, US Environmental Protection Agency.
The Met Office (2018). Met Office DataPoint. Available online at: https://www.metoffice.gov.uk/datapoint (accessed 30th October, 2018)
USDA (2004). “Chapter 10: Estimation of direct runoff from storm rainfall,” in National Engineering Handbook. Part 630 Hydrology (Washington, DC: United States Department of Agriculture; Natural Resources Conservation Service). Available online at: https://www.defra.gov.uk/Document.aspx/Document/MitigationMethods-UserGuideDecember2011FINAL.pdf
USDA SCS (1972). National Engineering Handbook, Part 630 Hydrology, Section 4, Chapter 10. Washington, DC: Natural Resources Conservation Service, U.S. Department of Agriculture.
Verro, R., Calliera, M., Maffioli, G., Auteri, D., Sala, S., Finizio, A., et al. (2002). GIS-based system for surface water risk assessment of agricultural chemicals. 1. Methodological approach. Environ. Sci. Technol. 36, 1532–1538. doi: 10.1021/es010089o
Walling, D. E., and Zhang, Y. (2004). “Predicting slope-channel connectivity: a national-scale approach,” in Sediment Transfer through the Fluvial System (Wallingford: IAHS Press), 107–114.
Webb, J., and Misselbrook, T. H. (2004). A mass-flow model of ammonia emissions from UK livestock production. Atmosphere. Environ. 38, 2163–2176. doi: 10.1016/j.atmosenv.2004.01.023
WFD Water Framework Directive (2000). Directive 2000/60. EC of the European Parliament and of the Council of, 23.
Williams, J. R., Izaurralde, R. C., Singh, V. P., and Frevert, D. K. (2006). The APEX model. Watershed Models, 437–482. doi: 10.1201/9781420037432.ch18
Zeiger, S. J., and Hubbart, J. A. (2016). A SWAT model validation of nested-scale contemporaneous stream flow, suspended sediment and nutrients from a multiple-land-use watershed of the central USA. Sci. Total Environ. 572, 232–243. doi: 10.1016/j.scitotenv.2016.07.178
Zhang, X., Luo, Y., and Goh, K. S. (2018). Modelling spray drift and runoff-related inputs of pesticides to receiving water. Environ. Pollut. 234, 48–58. doi: 10.1016/j.envpol.2017.11.032
Zhang, Y., Collins, A. L., and Hodgkinson, R. A. (2016). Use of farm survey returns from the Demonstration Test Catchments to update modelled predictions of sediment and total phosphorus loadings from subsurface drains across England and Wales. Soil Use Manag. 32, 127–137. doi: 10.1111/sum.12249
Zhang, Y., Collins, A. L., Johnes, P. J., and Jones, J. I. (2017a). Projected impacts of increased uptake of source control mitigation measures on agricultural diffuse pollution emission to water and air. Land Use Policy 62, 185–201. doi: 10.1016/j.landusepol.2016.12.017
Zhang, Y., Collins, A. L., Jones, J. I., Johnes, P. J., Inman, A., and Freer, J. E. (2017b). The potential benefits of on-farm mitigation scenarios for reducing multiple pollutant loadings in prioritised agri-environment areas across England. Environ. Sci. Policy 73, 100–114. doi: 10.1016/j.envsci.2017.04.004
Keywords: big data & analytics, spatial data integration, pesticides, metaldehyde, web-based model, R, API (application program interface), United Kingdom
Citation: Comber A, Collins AL, Haro-Monteagudo D, Hess T, Zhang Y, Smith A and Turner A (2019) A Generic Approach for Live Prediction of the Risk of Agricultural Field Runoff and Delivery to Watercourses: Linking Parsimonious Soil-Water-Connectivity Models With Live Weather Data Apis in Decision Tools. Front. Sustain. Food Syst. 3:42. doi: 10.3389/fsufs.2019.00042
Received: 30 October 2018; Accepted: 15 May 2019;
Published: 04 June 2019.
Edited by:
Stephen James Ramsden, University of Nottingham, United KingdomReviewed by:
John Michael Lynch, University of Oxford, United KingdomLuca Brocca, Italian National Research Council (CNR), Italy
Copyright © 2019 Comber, Collins, Haro-Monteagudo, Hess, Zhang, Smith and Turner. This is an open-access article distributed under the terms of the Creative Commons Attribution License (CC BY). The use, distribution or reproduction in other forums is permitted, provided the original author(s) and the copyright owner(s) are credited and that the original publication in this journal is cited, in accordance with accepted academic practice. No use, distribution or reproduction is permitted which does not comply with these terms.
*Correspondence: Alexis Comber, YS5jb21iZXJAbGVlZHMuYWMudWs=