 José A. Rubio
 Luis I. Romero2
 Ann C. Wilkie
 José L. García-Morales
- 1Department of Environmental Technologies, Faculty of Marine and Environmental Sciences, Institute of Viticulture and Agri-Food Research, University of Cádiz, Cádiz, Spain
- 2Department of Chemical Engineering and Food Technology, Faculty of Science, Institute of Viticulture and Agri-Food Research, University of Cádiz, Cádiz, Spain
- 3Soil and Water Sciences Department, University of Florida-IFAS, Gainesville, FL, United States
The co-digestion of agri-food by-products and livestock manure is a feasible alternative for waste management and the recovery of biogas provides an option to generate renewable energy. A series of batch experiments were carried out in order to investigate the mesophilic anaerobic co-digestion of two-phase olive-mill waste (2POMW) and cattle manure (CM) in different mixtures (2POMW:CM = 50:50; 60:40; 75:25; 85:15). In addition, the biodegradability of the co-substrates was studied in order to analyze the performance of the co-digestion process. The results obtained in this study indicate that 2POMW has a low biodegradability since a high soluble organic matter concentration and a low accumulated methane production were obtained at the end of the corresponding biodegradability test. However, CM is more easily biodegradable in mesophilic anaerobic conditions. The co-digestion of both wastes produced an enhancement of the hydrolytic-acidogenic phase, increasing the organic matter potentially bioavailable as volatile fatty acids (VFAs) and the biogas productivity, as a consequence of the subsequent degradation of VFAs by methanogens. However, an accumulation of VFA, principally propionic acid, was observed in the reactors with higher proportions of 2POMW. The volatile solids (VS) removal increased with the 2POMW percentage of the mixture up to 75% fresh weight. The increase of 2POMW above 75% led to a decrease in total VS removal. Moreover, a decrease in methane production was observed for the 85:15 mixture, as a consequence of the high concentration of propionic acid, which is a known inhibitor of methanogenesis. The maximum cumulative methane production and methane yield were achieved in the 75:25 mixture with values of 18.70 L and 112.40 LCH4/kgVSadded, respectively. Compared with 2POMW, the co-digestion produced an increase of 264–319% in the volume of accumulated methane (L), 293–351% in the methane yield (LCH4/kgVSadded) and 312–342% based on the VS consumed (LCH4/kgVSremoved). These results suggest that the mixture of these agro-industrial by-products could be effective to enhance biogas production and organic matter removal from 2POMW.
Introduction
Organic wastes from the food industries are a growing problem due to the environmental risks that they can generate. Cattle manure (CM) is a potential source of infectious agents that can cause disease in humans, groundwater contamination problems and atmospheric pollution by methane emissions due to discharges at surface (Cole et al., 1999; Spencer and Guan, 2004). Similarly, the environmental problems of two-phase olive-mill waste (2POMW) are related to its high organic load and the pollution effects on soil and water.
Typically, CM includes excreted material from the animal (feces and urine) and used bedding, as well as waste feed, water and soil. A high percentage of the volatile solids in dairy manure is composed of cellulose, hemicellulose and lignin (Wilkie et al., 2004). The quantity of manure produced depends on several factors including animal age, diet and animal productivity, as well as other factors (Wilkie et al., 2004). The bovine population reached around 6.7 million livestock units in Spain in 2018; this implies a CM production of about 73.3 million tons (MAPA, 2019).
Two-phase olive-mill waste (2POMW) is a complex semi-solid residue from a continuous two-phase centrifugation system, in which a horizontal centrifuge is used for separating the oil fraction and the remaining components (Mateo and Maicas, 2015). This semi-solid effluent has water content about 65%, a slightly acidic pH and a very high organic matter content, mainly composed of lignin, hemicellulose and cellulose. It also has a considerable proportion of fats, proteins, water-soluble carbohydrates and a small but active fraction of hydrosoluble phenolic compounds (Alburquerque et al., 2004).
According to the International Olive Council (IOC, 2018), 3.3 million tons of olive oil are produced annually worldwide, 65.8% of which are produced in Europe, with Spain (37.9%), Italy (13%) and Greece (10.6%) being the largest olive oil producers. Other olive oil producers are Africa (14.5%), Asia (8.7%) and America (1.9%) (FAO, 2018). The production of olive oil in 2017/18 in Spain using the two-phase centrifugation system was estimated at 1.25 million tons (IOC, 2018). Approximately 800 kg of 2POMW per ton of processed olives are generated by using the two-phase system (Alburquerque et al., 2004). This implies that the 2017/18 production of 2POMW in Spain was approximately five million tons.
Treatment systems for livestock manure have evolved beyond traditional collection, storage and land application. Manure treatment technologies are grouped into two major categories: physicochemical and biological treatment. Physicochemical treatments include thermal conversion, solid-liquid separation and filtration, advanced alkaline treatment, and aeration and mixing. The main biological approaches to the treatment of livestock manure include composting, vermicomposting, anaerobic digestion and constructed wetlands (Wilkie, 2005b; Millner, 2009). Similarly, the olive oil industry wastes, such as 2POMW, are managed through physicochemical and biological treatments. The physicochemical treatment systems include drying and second extraction of oil, combustion and gasification, and direct soil application. The biological treatments that can be applied to 2POMW are anaerobic digestion and composting (Roig et al., 2006; Morillo et al., 2009; Christoforou and Fokaides, 2016).
Anaerobic digestion is a biological process in which complex communities of micro-organisms transform organic matter into a mixture of carbon dioxide and methane (Wilkie, 2008). Anaerobic digestion of wastes from food industries is an attractive method for solid waste treatment, because the process enables an excellent waste stabilization and energy recovery without any pretreatment of the residue. The advantages of this type of treatment are low nutrients requirements, low sludge production, waste stabilization and biogas (methane) production. For these reasons, anaerobic digestion is widely used for the treatment of wastes and effluents from food industries. However, this treatment has not been widely applied to 2POMW due to the toxic effect of polyphenolic compounds, tannin and recalcitrant polymers. Moreover, another problem with high organic matter load wastes, such as 2POMW, is digester acidification by organic overloading, since volatile fatty acids, even at low concentrations, cause inhibition of the methanogenic microorganisms (Jiang et al., 2018).
Co-digestion of 2POMW with other wastes could be applied to reduce the problems related to the accumulation of inhibitory compounds. Thus, considering that CM has a low carbon to nitrogen ratio (C/N) whereas 2POMW has a high proportion of carbon in its composition, the mixing of both residues could provide a better balance of nutrients for the anaerobic microorganisms. Other advantages of co-digestion are that it solves the problem of the accumulation of toxic and inhibitory compounds, provides synergetic phenomena between the microorganisms and increases the methane yield (Wilkie, 2008). Many studies have demonstrated that the co-digestion of food industry wastes and CM can be a successful process (Cavinato et al., 2010; Fang et al., 2011; Zarkadas and Pilidis, 2011; Zhai et al., 2015). However, there are few studies of co-digestion with olive oil production waste and CM. In a study with three-phase olive-mill waste (3POMW) mixed with CM and cattle slurry, Carlini et al. (2015) found that the optimal mixture was 4.65% of CM, 72.10% of cattle slurry and 23.25% of 3POMW with a total solid content of 14% in a mesophilic regime. Goberna et al. (2010) compared the anaerobic co-digestion of a 1:3 ratio of 2POMW:CM in mesophilic and thermophilic regimes in pilot continuous reactors, with a hydraulic retention time (HRT) of 21.4 d and an organic loading rate (OLR) of 5.5 gCOD/L/d, for only 30 d. The authors made the comparison only in terms of temperature regime with a particular HRT and OLR. The selection of the best mixture ratio for the process within the optimal C/N for anaerobic digestion was not evaluated.
Therefore, the importance and novelty of the present study is that the main objective was to analyze the influence of the mixing ratio of 2POMW and CM in the co-digestion process. For this evaluation, the organic matter removal and methane yield were used as measures of process efficiency.
Materials and Methods
Characteristics of Substrates and Inoculum
Fresh 2POMW was collected from an olive oil mill located in Olvera (Cádiz, Spain) and CM was obtained from a semi-intensive livestock farm of dairy cattle in El Puerto de Santa Maria (Cádiz, Spain). In addition to animal feces, the collected manure also contained residues of straw used as bedding material and traces of soil. Both substrates, after the sampling procedure, were homogenized at the laboratory and stored at −4°C to preserve their original characteristics.
The reactors were inoculated with mesophilic anaerobic effluent from a laboratory digester adapted to co-digestion of both wastes. The inoculation reactor was operated with a HRT of 40 days and OLR of 1.92 gVS/LR/d. The daily biogas production was 0.45 L/LR/d with a methane content of 85%. The VS removal was 49.13%. Table 1 shows the composition and characteristics of the 2POMW, CM and inoculum. The parameters were determined in triplicate analysis.
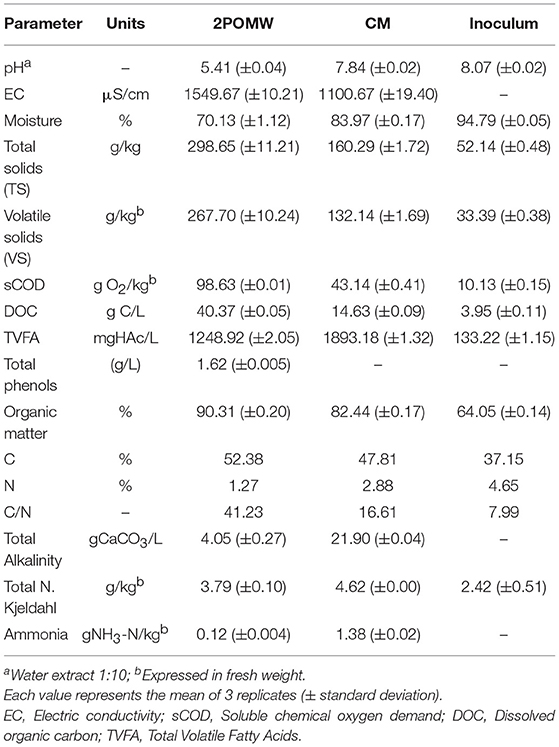
Table 1. Characteristics of the wastes used (2POMW and CM) and the inoculum.
Batch Digesters
The experiments were carried out in a series of 3 L stainless steel digesters (2 liters of active volume). A schematic representation is shown in Figure 1. Each reactor was hermetically sealed to maintain anaerobic conditions during the digestion process and its content was continuously mixed by a mechanical stirrer (20 r.p.m). A heater jacket and a temperature probe were used to maintain mesophilic temperature (35 ± 1°C). The digesters had two ports that were used for sampling and biogas output. The biogas produced during the fermentation was collected in a 5 L Tedlar® bag.
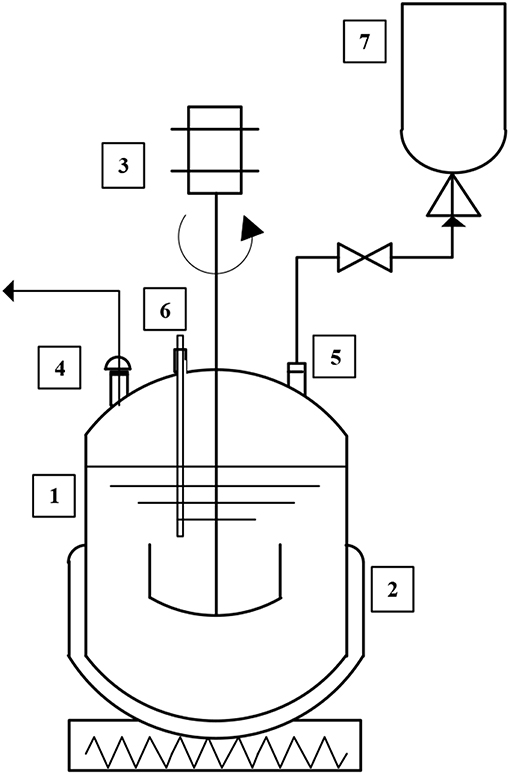
Figure 1. Schematic diagram of the laboratory-scale anaerobic digestion system. (1) Reactor, (2) heating jacket, (3) motor agitation, (4) sampling port, (5) biogas port, (6) temperature probe, and (7) Tedlar® bag.
Experimental Procedure
In order to evaluate the effect produced by the co-digestion process of the by-products, two assays were conducted: a biodegradability test of both co-substrates and a study of the effect of mixing ratio between 2POMW and CM. A control reactor (RCI) containing only anaerobic inoculum (400 ml) was used to analyze the activity of anaerobic microorganisms and to determine the potential methane production of the inoculum. The experiment was carried out at mesophilic temperature (35 ± 1°C) and the pH was maintained about 8.0 by using a solution of Na2CO3 (2.8 M).
Biodegradability Tests
In order to evaluate the anaerobic biodegradability of 2POMW and CM, batch experiments were carried out in two digesters, R2POMW and RCM. The main initial characteristics are shown in Table 2. The R2POMW and RCM were filled with 2POMW and CM, respectively, up to 80% of effective volume (1,600 mL) and were completed with 400 mL of the inoculum described previously. The total solids concentration of the assays was adjusted to about 10% of TS with distilled water. The reactors were flushed with nitrogen gas to obtain anaerobic conditions before the start of the experiment.
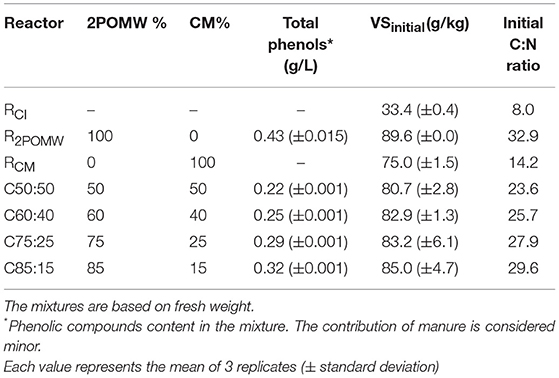
Table 2. Compositions of co-digestion (C50:50, C60:40, C75:25, and C85:15) and biodegradability (R2POMW, RCM and RCI) reactors.
During the anaerobic digestion period (about 40 days), biogas production and composition were analyzed daily. Samples of about 40 mL were taken from the reactors three times a week.
Co-digestion Tests
As the main objective of this work was to study the performance of mesophilic (35°C) co-digestion of 2POMW and CM, four mixtures of the co-substrates were analyzed. The ratios of wastes were selected on the basis of the optimal C/N ratio for the development of anaerobic processes (C/N 20-30) (Yadvika et al., 2004; Flotats and Sarquella, 2008). The mixtures were prepared by increasing the proportion of 2POMW from 50% to 85% fresh weight. Four reactors were used in this study and the main features of the mixtures are shown in Table 2. The reactors were named using the proportions of both wastes (2POMW:CM) as C50:50, C60:40, C75:25, and C85:15 and the C/N ratios were in the required range: 23.6, 25.7, 27.9, and 29.6, respectively. The total solids concentration of the mixtures was adjusted to about 10% of TS with distilled water and the reactors were filled with the co-substrates mixture up to 80% of effective volume (1,600 mL) and completed with 400 mL of mesophilic inoculum. The reactors were flushed with N2 at the start of the experiment.
Biogas production and composition were determined every day and the sampling procedure was similar to the biodegradability test previously described. Analytical monitoring was carried out for 39 days. The experiment was terminated when the methane production was less than 1% (with respect to previous data) for three consecutive days.
Analytical Methods
The following parameters were measured in triplicate for the waste characterization and monitoring of the batch assays: total solids (TS), total volatile solids (VS), organic matter (OM), soluble chemical oxygen demand (sCOD), alkalinity, total Kjeldahl nitrogen (TKN), ammonia (NH3-N), pH, dissolved organic carbon (DOC) and volatile fatty acids (VFA). All parameters were determined following Standard Methods (APHA, 2012).
The pH, TS, VS, OM, TKN were determined directly from the samples. The rest of the parameters were measured over samples previously lixiviated (10 g of sample in 100 mL of distilled water for 30 min). Subsequently, the samples were filtered through a 0.7 μm glass-fiber filter for the determination of sCOD and DOC.
The DOC was determined by combustion/non-dispersive infrared gas analysis method (total organic carbon analyzer Shimadzu TOC-5000). For the VFA analysis, a Shimadzu GC-2010 gas chromatograph equipped with a flame ionization detector, a capillary column filled with Nukol (polyethylene glycol modified by nitroterephthalic acid) and a Shimadzu AOC-20i autoinjector was used. The temperature of the injection port and detector was 200 and 250°C, respectively. Hydrogen was the carrier gas with a flow rate of 42.1 mL/min. In addition, synthetic air and hydrogen for the GC flame ionization were used at 400 and 40 mL/min flow rate, respectively. The makeup gas used was nitrogen (30 mL/min). The samples of leaching were filtered through a 0.22 μm Teflon filter and prepared by acidifying with a 1:2 (v/v) solution of phosphoric acid and spiked phenol as internal standard. Total acidity (TVFA) was calculated by the addition of individual VFA levels, taking into account the molecular weights of the different VFAs in order to express this parameter as acetic acid concentration.
The biogas composition (hydrogen, methane and carbon dioxide) was determined by gas chromatography (Shimadzu GC-14 B) with a stainless-steel column packed with Carbosive SII and a thermal conductivity detector (TCD). The injected sample volume was 1 mL and the operational conditions were as follows: 7 min. at 55°C; ramped at 27°C per min. until 150°C; detector temperature: 255°C; injector temperature: 100°C. The carrier was helium and the flow rate used was 30 mL/min. The volume of biogas produced in the reactor was directly measured using a high-precision gas meter (RITTER Drum-type Gas Meters, 0.1 mbar). Gas volumes were expressed at standard temperature and pressure (STP).
For measuring total phenols, the samples were centrifuged, filtered and analyzed by liquid chromatography using 0.2 mM syringic acid as internal standard, per the methodology described by Medina et al. (2011).
Results and Discussion
The monitoring of organic matter evolution in an anaerobic process can be performed by using several parameters, some of which are discussed below.
The biomethanization process involves the conversion of organic matter in the waste to obtain mainly methane and carbon dioxide as final products (Wilkie, 2008). However, initially, in the acidogenic phase, the organic compounds must be transformed into soluble compounds (acetate, propionate, butyrate, hydrogen and carbon dioxide) susceptible to be metabolized by acetogenic and methanogenic microorganisms (Boone et al., 1993; Graunke and Wilkie, 2014). The next step in the anaerobic process is the transformation of VFAs into acetic acid in the acetogenic phase. Finally, these compounds are subsequently transformed into methane by acetoclastic and hydrogenotrophic methanogenesis (Wilkie, 2005a).
Total Volatile Solids Removal
The total volatile solids (VS) represent the organic fraction (biodegradable and non-biodegradable), in both particulate and dissolved form, susceptible to being metabolized during the anaerobic digestion process.
The degradation of organic matter expressed as total VS removal (VSr) is shown in Figure 2. As can be seen, the co-digestion of both residues (C75:25) permitted an increase in total VS removal around 18% and 23%, with respect to 2POMW and CM respectively.
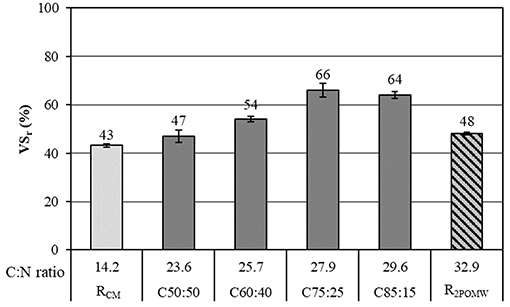
Figure 2. Organic matter removal, expressed as percentage of total volatile solids (VSr), in the co-substrates and mixtures.
In general, the percentage of VS removal increased with a greater proportion of 2POMW in the mixture (C50:50 < C60:40 < C75:25). However, a decrease in performance occurred in the C85:15 reactor with respect to the previous mixture. This result is similar to the results obtained by Zhang et al. (2008) in the co-digestion of biosolids and the organic fraction of municipal solid waste by enriching the mixture with the substrate with higher organic load (OFMSW). This decrease in performance for the mixture with the highest content of 2POWM (C85:15) can be related to the potential inhibition of the anaerobic process by phenolic compounds present in 2POMW. Borja et al. (1997) observed a direct relationship between the concentrations of the main phenolic compounds in olive-mill wastewater (substrate coming from the same raw material as the 2POMW) with inhibition of acetoclastic methanogenesis. Those authors found a partial inhibition on methane production with levels of caffeic acid > 300 mg/L or of p-coumaric acid > 100 mg/L. In this study, for the C85:15 assay, the level of total polyphenols was over 300 mg/L (Table 2).
In order to evaluate the degradation potential of each substrate, the coefficient of degradation, Kb, proposed by Haug (1993) for the biodegradability of substrates in a biological aerobic process (composting) has been used. The calculation of this parameter and its comparison with aerobic biological processes may be appropriate because this parameter (organic matter measured as volatile solids) could be useful to evaluate the performance of both processes (aerobic or anaerobic).
This parameter was defined by means of the initial (OMi) and final (OMf) organic matter concentrations, measured as VS, according to the equation:
According to the results obtained, the coefficient of degradation of CM (Kb = 0.62) was higher than for the 2POMW (Kb = 0.54). These results indicate a greater biodegradability of CM under the experimental conditions tested. However, Cegarra et al. (2006) obtained a degradation coefficient (Kb) of 0.70 for a mature compost of 2POMW. Compared with the results obtained in this study, it appears that the 2POMW was not completely biodegraded in the test time due to the presence of slowly degradable compounds, as observed in the evolution of the batch assay. The lignocellulosic fraction of 2POMW restricts the rate of degradation of this by-product during composting (Alburquerque et al., 2004; Serramiá et al., 2010) and it also impacts the anaerobic process. As well, the presence of different mesophilic fungi and actinobacteria populations during the maturation phase of the composting process allows the partial metabolization of the lignocellulosic fraction (Lopez-Gonzalez et al., 2013).
A high concentration of this fraction implies that the limiting step of anaerobic digestion is the hydrolytic phase (Frigon and Guiot, 2010). Brown et al. (2012) observed that the methane production was inversely related to the lignin content for the anaerobic digestion of lignocellulosic biomass. In the present study, the CM likely contains a high proportion of these compounds due to the characteristics of the waste used, including bedding straw and soil, which is typical of CM (Wilkie et al., 2004; Wilkie, 2008). Decreasing the proportion of manure in the mixtures led to higher removal efficiencies of VS (Figure 2). The combination of both wastes in the different mixtures produced an increase in biodegradability (Kb) which was increased with the proportion of 2POMW. The Kb values for C50:50, C60:40, and C75:25 were 0.71, 0.72, and 0.81, respectively. However, for the C85:15 mixture, the coefficient decreased (Kb = 0.76), showing a similar evolution to that previously commented on for VS removal.
Soluble Organic Matter Evolution
The soluble organic matter, determined as sCOD or DOC, is generated in the hydrolysis and fermentation of particulate organic matter during the hydrolytic-acidogenic phase of anaerobic digestion (Graunke and Wilkie, 2014). Most of the components of this soluble organic matter can be found as volatile fatty acids in the medium.
Evolutions of sCOD
Figure 3 shows the evolution of sCOD for the co-substrates and mixtures expressed as gO2/kg of wet weight. The different phases of the anaerobic digestion process can be distinguished in the figure, mainly in the co-digestion assays.
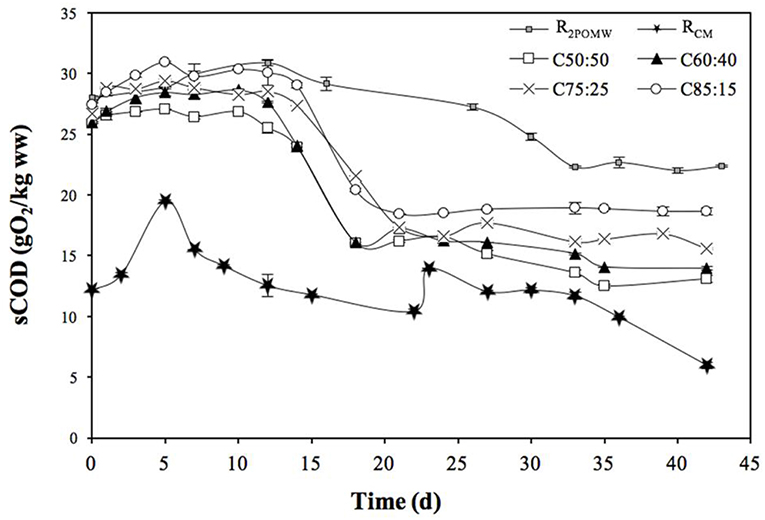
Figure 3. sCOD evolution for 2POMW, CM and co-digestion mixtures in batch experiments.
The hydrolytic-acidogenic phase took place on days 12 and 5–6 for 2POMW and CM, respectively. During this period, the solubilization of organic matter occurred, reaching a greater maximum concentration for 2POMW (30.87 gO2/kg) than for CM (19.48 gO2/kg). After this period, the sCOD level in 2POMW decreased and remained constant around 22.43 gO2/kg, with a sCOD decrease of 26.5%. This evolution indicates a balance between the organic matter solubilization and its biodegradation into biogas. For the CM test, the sCOD removal occurred progressively throughout the test period with a final concentration of 5.97 gO2/kg, which implies a removal efficiency about 69%.
These residual concentrations correspond to hardly biodegradable compounds in the test conditions. This implies the presence in the 2POMW of a significant fraction of slowly hydrolysable compounds with an inhibitor character, which limits the anaerobic digestion of this residue.
The maximum sCOD concentration (sCODmax) reached in the mixtures provides information about soluble organic matter potentially bioavailable to the microorganisms. As can be seen in Table 3, the sCODmax increased linearly as the 2POMW ratio increased (R2 = 0.97). This implies that the hydrolytic phase was not affected by the increase of organic matter present in 2POMW.
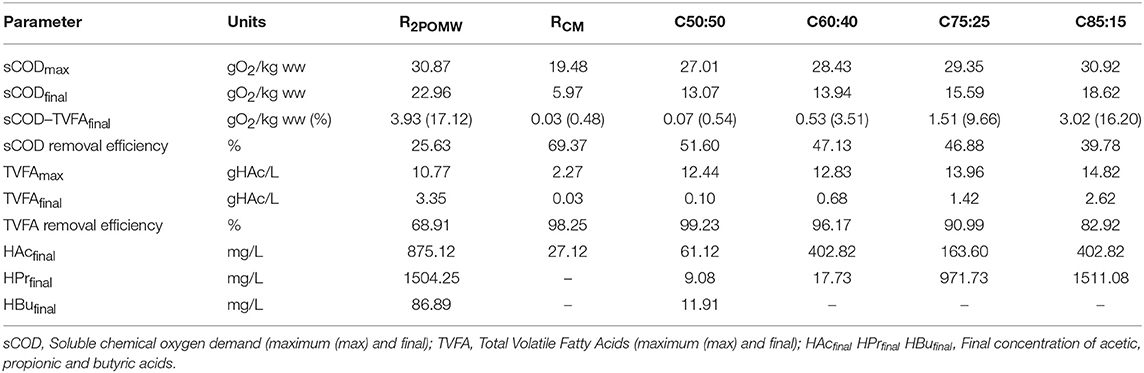
Table 3. Performance data and maximum/final soluble organic matter (as sCODs, TVFA, and VFA composition) for 2POMW, CM and co-digestion mixtures.
On day 12 of the assay, the methanogenic phase started with a sharp decrease of soluble organic matter concentration in all mixtures, as a result of VFA consumption by methanogenic microorganisms. From day 20 on, stabilization in sCOD levels occurred until the end of the test. The average basal levels of sCOD for C50:50, C60:40, C75:25, and C85:15 were 13.04 (±0.54), 14.39 (±0.67), 16.22 (±0.50), and 18.75 (±0.14) gO2/kg, respectively. These basal levels were calculated as the average of sCOD data from days 33 to 42 in each co-digestion assay. The basal sCOD concentrations increased linearly with the proportion of 2POMW in the initial mixture (R2 = 0.97). This means that as the percentage of 2POMW in the mixture increased, soluble organic matter removal performance decreased due to the increase of poorly biodegradable soluble compounds remaining in the reactor during the test period.
To evaluate the possible composition of the slowly biodegradable soluble organic fraction in the mixtures, the fraction of sCOD corresponding to VFAs at the end of test (sCOD as TVFAfinal) was calculated (Table 3). Eastman and Ferguson (1981) suggested the use of COD equivalents for each different acid in order to express their total concentration as COD. Comparing this parameter with sCOD, the fraction of soluble compounds corresponding to VFA and the fraction of other soluble organic compounds remaining in the reactor can be determined (see Table 3, sCOD–TVFAfinal as value and percentage of the sCODfinal). The percentage of soluble organic material corresponding to VFA increased linearly with the increasing proportion of 2POMW in the mixture. Similary, sCOD non-acids levels, the difference between sCODfinal and sCOD as TVFAfinal, also increased. This demonstrates the presence in the 2POMW of poorly biodegradable soluble organic compounds such as polyphenols, hemicellulose or lignin (Arvanitoyannis and Kassaveti, 2008).
Evolution of Volatile Fatty Acids
The evolutions of total acidity (TVFA) (expressed as acetic acid) and the main individual VFAs (acetic, propionic and butyric acids) in the biomethanization tests for both co-substrates and the different mixtures are presented in Figure 4.
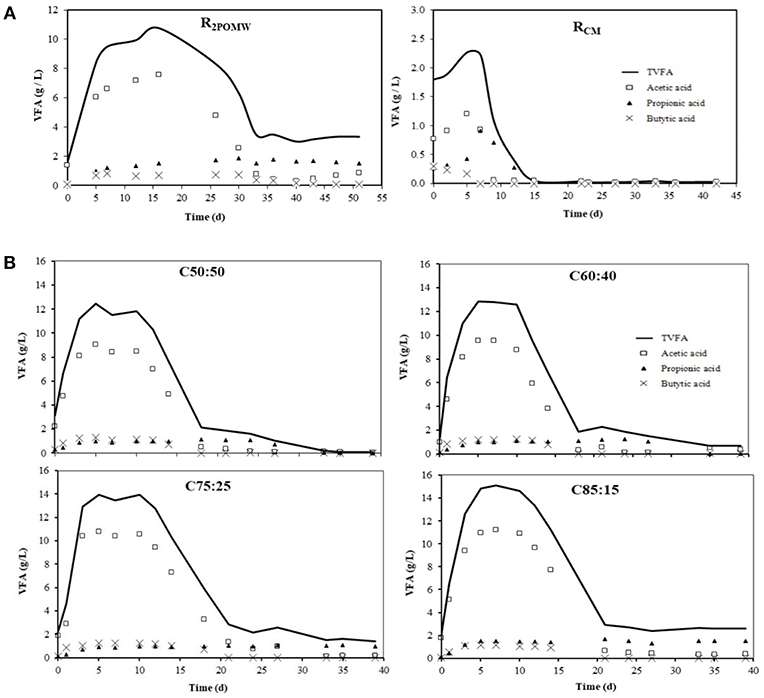
Figure 4. Total VFA and individual VFA evolution (acetic, propionic and butyric acid) for co-substrates (A) and mixtures of co-digestion (B).
At the beginning of the tests, TVFA for R2POMW and RCM were 1.57 and 1.79 gHAc/L, respectively (Figure 4A). However, for R2POMW, the VFAs increased sharply (to 10.77 gHAc/L) during the first 16 days. In this period, the acidogenic and acetogenic phases were predominant. In turn, for RCM, maximum VFA concentration of 2.27 gHAc/L was reached after the first 5 days.
After this initial period, the acetoclastic methanogenic phase occurred and degradation of the accumulated VFAs began in both reactors (R2POMW and RCM), with a net increase in biogas production (Figure 5). In day 15 of the test, RCM reached its basal level of total acidity (0.04 gHAc/L). In contrast, the VFA degradation continued in R2POMW, reaching a final value of 3.31 gHAc/L at 33 days of operation.
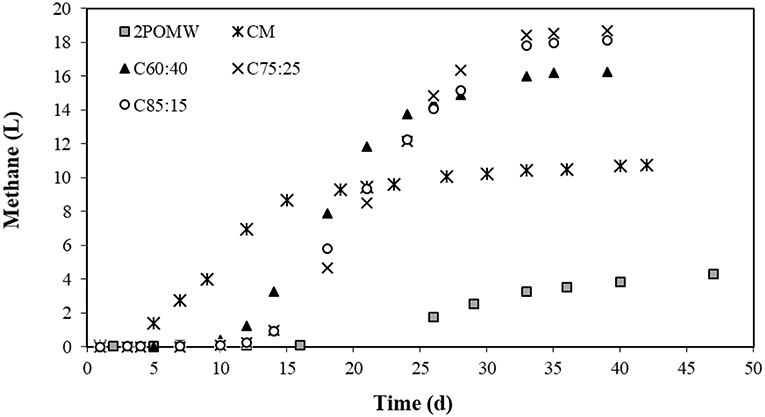
Figure 5. Cumulative methane production for 2POMW, CM and co-digestion mixtures in batch experiments.
The maximum concentrations of acetic acid (HAc), propionic acid (HPr) and butyric acid (HBu) reached in R2POMW were 7.56 (day 16), 1.81 (day 30), and 0.80 (day 7) g/L, respectively (Figure 4A). During the methanogenic phase, HAc and HBu were consumed in the first place, but HPr remained constant throughout the test at a concentration around 1.66 (±0.13) g/L. The accumulation of propionic acid may be due to the metabolism of the phenolic compounds present in the 2POMW. Pullammanappallil et al. (2001) observed that the increase of propionic acid in the reactor could be related to the metabolism of phenol compounds. Young and Rivera (1985) suggested a mechanism for phenol degradation to VFA, with a final transformation into propionic acid. Additionally, the propionic acid metabolism is very unfavorable thermodynamically (ΔG° = +76.1 kJ) (Van Lier et al., 1993), and its accumulation or an unbalanced degradation could be related to methanogenic microorganism inhibition (Hill et al., 1987; Wang et al., 2009).
In RCM, all the VFAs produced in the acidogenic phase were quickly transformed into biogas (Figure 5), resulting in a final acidity level that was practically negligible, around 27.12 mgHAc/L.
With respect to the co-digestion tests, the hydrolytic and acidogenic phases took place in the first 5–7 days. A significant increase was observed in the TVFA concentration, directly related to the proportion of 2POMW in the mixture. Maximum total acidity for the co-digestion reactors ranged from 12.44 to 14.82 gHAc/L (Table 3). The comparison of the maximum concentrations of TVFA in the different reactors indicates that the majority of the total acidity contribution came from 2POMW. Furthermore, this increase in total acidity in the mixtures compared to R2POMW is indicative that the mixture of substrates enhanced the acidogenesis in these reactors.
The evolution of TVFA was similar in all the mixtures. As shown in Figure 4B, removal of the VFA, mainly acetic acid, occurred between days 10 and 24, coinciding with the maximum methane production for all mixtures. The acid removal was very high for all the reactors, between 82 and 99%, with a final basal concentration of TVFA between 0.1 and 2.6 g/L, with a direct relationship to the initial content of 2POMW in the mixture. These concentrations of non-degraded TVFA were mainly composed of propionic acid in the assays with highest proportion of 2POMW. The data of TVFAfinal are linearly related to the proportion of 2POMW in the mixture (R2 = 0.96). In the same way, the concentration of propionic acid at the end of the test period follows a linear trend with the percentage of 2POMW in the mixture (R2 = 0.93).
In Figure 4B, a similar trend of VFA concentration was observed for all the mixtures tested. In general, a stage (acidogenesis) with a significant increase in VFAs was observed initially and, later, a second stage (methanogenesis) occurred in which VFAs were degraded and transformed into biogas. Certain acids, such as propionic, were accumulated in the reactors with a higher proportion of 2POMW. This fact produced an inhibitory effect on the methanogenic populations. Nevertheless, the increase of the total acidity detected in the reactors during the acidogenic phase corresponds mainly to an increase in the concentration of acetic acid. Butyric acid levels were similar in the four mixtures, reaching maximum concentrations of 1.17 g/L at 10 days of operation. The maximum propionic acid concentrations were between 1.09 and 1.25 g/L for reactors C50:50, C60:40, and C75:25, and 1.67 g/L for reactor C85:15.
As previously mentioned, the increase of propionic acid in the first days may be related to the metabolic biodegradation of polyphenols (Pullammanappallil et al., 2001). Butyric acid was the first of the acids removed (between 18 and 20 days) in all the reactors. The concentration of acetic acid began to decrease at day 10–11 in the four reactors, coinciding with the start of methane production (Figure 5). Thus, in the C50:50 reactor it can be considered that anaerobic degradation was completed, since the final total acidity was practically negligible (0.10 g/L expressed as acetic acid). However, for the rest of the co-digestion reactors (C60:40; C75:25, and C85:15) the methane production was interrupted at around day 33, probably due to an inhibitory effect on methanogenic microorganisms. In fact, the HPr/HAc ratio reached values above 2 for these reactors, which are higher than those proposed by Hill et al. (1987) who established a maximum HPr/HAc ratio of 1.4 before methanogenesis inhibition occurs.
Wilkie et al. (1986) showed that addition of micronutrients stimulated propionate conversion to methane. Micronutrient deficiencies, therefore, could also be responsible for the propionate accumulation found in this study.
Methane Production
Figure 5 shows the cumulative production of methane as a function of digestion time for the substrates and mixtures studied. The evolution of methane production in the C50:50 assay is not included because of problems observed with the register of biogas volume due to a leak in the reactor. Methane production in R2POMW starts on day 16. This lag phase was also observed by Ergüder et al. (2000) in the anaerobic treatment of olive-mill wastes and could be related to the presence of some toxic compounds, including phenolics, in these wastes. Moreover, the concentration of propionic acid reached a level of 1,660 mg/L in this reactor. This concentration is much higher than 900 mg/L, which has been described by Wang et al. (2009) as inhibitory for the growth of methanogenic microorganisms. Also, as can be seen in Table 4, the total methane production in this test (4.46 L) is clearly lower than those obtained for the different mixtures, despite having a higher concentration of potentially biodegradable organic matter. The low rate of anaerobic digestion of 2POMW may be due to a low nitrogen content and, therefore, a high C/N ratio (32.9), resulting in a nutritional imbalance that affects the metabolism of the populations involved (Flotats and Sarquella, 2008). The unbalanced propionic production with a final HPr/HAc ratio of 1.72, higher than the methanogenic inhibition level of 1.4 proposed by Hill et al. (1987), also contributed to the low methane production. Additionally, the final HPr concentration (1504.25 mg/L) remained higher than the inhibitory level for the growth of methanogenic microorganisms (Wang et al., 2009). Other olive mill wastes, like 3POMW, show a low methane production. Carlini et al. (2015) obtained a methane productivity between 0.0010–0.0023 LCH4/gVSadded for direct digestion and 0.10 LCH4/gVSadded for co-digestion of 3POMW with cattle manure and slurries. These values are smaller than those obtained for 2POMW and the 75% proportion of this by-product in co-digestion with CM in this study.
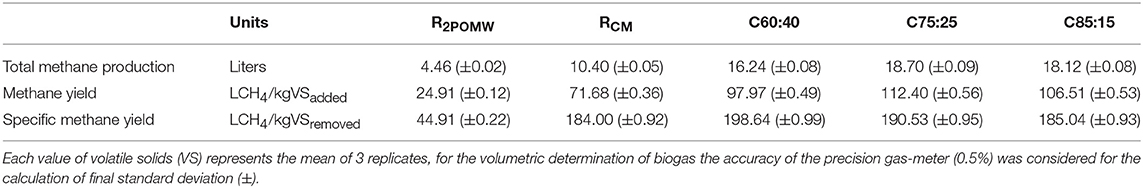
Table 4. Methane production, methane yield and specific methane yield of the 2POMW, CM and different co-digestion mixtures.
In RCM, however, no inhibition of methane production was observed. Thus, biogas was generated from the start of the test and production ceased at day 42 when a very low concentration of VFA (27.12 mg/L as acetic acid) was detected in the reactor. The methane yield was 71.68 LCH4/kgVSadded. This value is within the range observed by other authors, with maximum values of 184–260 LCH4/kgVS (Nasir et al., 2012) and minimum values of 55–69 LCH4/kgVS (Zhang et al., 2013). This wide range of values evidences the different potential of anaerobic digestion of CM depending on the typology of the substrate. Differences in animal feed and operating conditions of the farms, among other factors, can explain this fact (Møller et al., 2004).
The methane yields obtained have a relationship with the concentration of VFA registered for the different assays and indicate that VFAs are the most important methane precursors. There was an increase of methane yield between C60:40 and C75:25 of 14.7% due to the higher concentration of organic matter coming from 2POMW. However, for the C85:15 mixture, a decrease in the methane yield of 5.2% was observed, due to both inhibition of methanogenesis by an increased HPr/HAc ratio and the higher concentration of poorly biodegradable compounds.
Specific methane yield, expressed as LCH4/kgVSremoved, decreased as the proportion of 2POMW in the mixture increased, with a linear relation between both parameters. This behavior is consistent with the aforementioned problems of inhibition and likewise with the presence of a high fraction of soluble recalcitrant compounds, such as lignocellulosic material, associated with a higher proportion of 2POWM in the mixture.
In Figure 5, a lag phase of 14 days was observed in mixtures with a higher content of 2POMW (C75:25 and C85:15), whereas in the mixture with a lower proportion of 2POMW (C60:40) the lag phase for methane production was slightly lower, around 10 days. Methane production increased exponentially after this acclimation phase of methanogenic microbiota and finished around 33 days from the start-up, for all mixtures studied. The start of methane production corresponds to the metabolizing of acetic acid, as described above.
The average composition of biogas in RCM was 65:35 (CH4:CO2) which is within the typical range for this type of waste, as reported by Kirch et al. (2005). Moreover, for R2POMW, an average biogas composition of 79:21 (CH4:CO2) was obtained. Tekin and Coşkun Dalgiç (2000) have obtained similar results for anaerobic digestion of olive pomace (similar to 2POMW), with 80% methane in the biogas. For the different mixtures tested, C50:50, C60:40, C75:25, and C85:15, the average methane content ranged from 77 to 85%. Carlini et al. (2015) obtained a lower methane percentage (64%) in their co-digestion assays using 3POMW with CM and slurries. Therefore, the mixture of wastes produced an enrichment of methane in the biogas generated with respect to the CM alone and remained broadly unchanged with respect to 2POMW, since the pH, which determines the solubility of CO2 in the medium, was similar in all the reactors containing 2POMW.
Conclusions
The present study demonstrates the feasibility of co-digestion of 2POMW and CM in a mesophilic temperature regime.
Methane production and methane yields for the different mixtures were higher compared to both individual co-substrates. All the mixtures tested improved the total methane production, with an increase of 264–319% with respect to 2POMW. Likewise, the methane yield was also improved in co-digestion tests, with an increase of 293–351% LCH4/kgVSadded and 312–342% LCH4/kgVSremoved.
The increased proportion of 2POMW in the mixtures led to an increase in the organic matter concentration available for anaerobic microorganisms but also led to problems with HPr accumulation and its inhibition of methanogenesis. There was a linear relationship between HPr concentration and the 2POMW initial content in the mixture.
Based on the results obtained in the analysis of the co-digestion process of 2POMW and CM, it is evident that the mixing ratio of both wastes is a very important variable. To prevent problems of process inhibition, the 2POMW:CM ratios of 60:40 or 75:25 are recommended.
Author Contributions
JR developed the experiments, the chemical analyses and the monitoring parameters. He also, contributed to data collection and data results summary. LR supervised the set-up and the general design of batch experiments, collaborated in discussion and conclusions. AW collaborated in discussion of the results and conclusions. JG-M coordinated all the research, contributed conception and design of the study, and collaborated in discussion and conclusions. All authors participated in writing of the manuscript and contributed to manuscript revision.
Conflict of Interest Statement
The authors declare that the research was conducted in the absence of any commercial or financial relationships that could be construed as a potential conflict of interest.
Acknowledgments
The authors wish to express their gratitude to the Spanish Ministry of Science and Innovation and the European Regional Development Fund (ERDF), specifically to PROBIOGAS Project PS-120000-2007-6 for providing financial support. The authors would also like to thank the collaboration of the olive mill facility Nuestra Señora de los Remedios in this project. JG-M wishes to express his gratitude to the University of Cádiz (UCA) and its research plan for the mobility grant (EST2018-045). Finally, JG-M wishes to thank AW and the University of Florida-IFAS for hosting him as a Visiting Research Scholar in summer 2018.
References
Alburquerque, J. A., Gonzálvez, J., García, D., and Cegarra, J. (2004). Agrochemical characterisation of “alperujo”, a solid by-product of the two-phase centrifugation method for olive oil extraction. Bioresour. Technol. 91, 195–200. doi: 10.1016/S0960-8524(03)00177-9
APHA (2012). Standard Methods for the Examination of Water and Wastewater, 22nd Edn. Washington, DC: American Public Health Association, American Water Works Association, Water Pollution Control Federation.
Arvanitoyannis, I. S., and Kassaveti, A. (2008). “Olive oil waste management: treatment methods and potential uses of treated waste,” in Waste Management for the Food Industries, ed I. S. Arvanitoyannis (Elservier Inc.), 453–552.
Boone, D. R., Chynoweth, D. P., Mah, R. A., Smith, P. H., and Wilkie, A. C. (1993). Ecology and microbiology of biogasification. Biomass Bioenergy 5, 191–202. doi: 10.1016/0961-9534(93)90070-K
Borja, R., Alba, J., and Banks, C. J. (1997). Impact of the main phenolic compounds of olive mill wastewater (OMW) on the kinetics of acetoclastic methanogenesis. Process Biochem. 32, 121–133. doi: 10.1016/S0032-9592(96)00055-6
Brown, D., Shi, J., and Li, Y. (2012). Comparison of solid-state to liquid anaerobic digestion of lignocellulosic feedstocks for biogas production. Bioresour. Technol. 124, 379–386. doi: 10.1016/j.biortech.2012.08.051
Carlini, M., Castellucci, S., and Monetia, M. (2015). Anaerobic co-digestion of olive-mill solid waste with cattle manure and cattle slurry: analysis of bio-methane potential. Energy Proc. 81, 354–367. doi: 10.1016/j.egypro.2015.12.105
Cavinato, C., Fatone, F., Bolzonella, D., and Pavan, P. (2010). Thermophilic anaerobic co-digestion of cattle manure with agro-wastes and energy crops: comparison of pilot and full scale experiences. Bioresour. Technol. 101, 545–550. doi: 10.1016/j.biortech.2009.08.043
Cegarra, J., Alburquerque, J. A., Gonzálvez, J., Tortosa, G., and Chaw, D. (2006). Effects of the forced ventilation on composting of a solid olive-mill by-product (“alperujo”) managed by mechanical turning. Waste Manage. 26, 1377–1383. doi: 10.1016/j.wasman.2005.11.021
Christoforou, E., and Fokaides, P. A. (2016). A review of olive mill solid wastes to energy utilization techniques. Waste Manage. 49, 346–363. doi: 10.1016/j.wasman.2016.01.012
Cole, D. J., Hill, V. R., Humenik, F. J., and Sobsey, M. D. (1999). Health, safety, and environmental concerns of farm animal waste. Occup. Med. 14, 423–448.
Eastman, J. A., and Ferguson, J. F. (1981). Solubilization of particulate organic carbon during the acid phase of an- aerobic digestion. J. Water Pollut. Control Federat. 53, 352–366.
Ergüder, T. H., Güven, E., and Demirer, G. N. (2000). Anaerobic treatment of olive mill wastes in batch reactors. Process Biochem. 36, 243–248. doi: 10.1016/S0032-9592(00)00205-3
Fang, C., Boe, K., and Angelidaki, I. (2011). Anaerobic co-digestion of by-products from sugar production with cow manure. Water Res. 45, 3473–3480. doi: 10.1016/j.watres.2011.04.008
FAO (2018). Food and Agriculture Organization of the United Nations. FAOSTAT Database. Available online at: http://faostat.fao.org (Accessed July 7, 2018).
Flotats, X., and Sarquella, L. (2008). Producció de Biogás per Codigestió Anaeròbia. Institut Català d'Energia. Barcelona: Generalitat de Catalunya.
Frigon, J. C., and Guiot, S. R. (2010). Biomethane production from starch and lignocellulosic crops: a comparative review. Biofuels Bioprod. Bioref. 4, 447–458. doi: 10.1002/bbb.229
Goberna, M., Schoen, M. A., Sperl, D., Wett, B., and Insam, H. (2010). Mesophilic and thermophilic co-fermentation of cattle excreta and olive mill wastes in pilot anaerobic digesters. Biomass Bioenergy 34, 340–346. doi: 10.1016/j.biombioe.2009.11.005
Graunke, R. E., and Wilkie, A. C. (2014). Examining the mechanisms of short-term solubilization of ground food waste for high-rate anaerobic digestion. Int. Biodeterior. Biodegradation 86, 323–333. doi: 10.1016/j.ibiod.2013.10.007
Hill, D. T., Gobb, S. A., and Bolte, J. P. (1987). Using volatile fatty acid relationships to predict anaerobic digester failure. Trans. ASAE 30, 496–501. doi: 10.13031/2013.31977
IOC (2018). International Olive Council Database. Available online at: http://www.internationaloliveoil.org/
Jiang, Y., Dennehy, C., Lawlor, P. G., Hu, Z., McCabe, M., Cormican, P., et al. (2018). Inhibition of volatile fatty acids on methane production kinetics during dry co-digestion of food waste and pig manure. Waste Manage. 79, 302–311. doi: 10.1016/j.wasman.2018.07.049
Kirch, K., Augenstein, D., Batmale, J. P., Benemann, J., Rutledge, B., and Salour, D. (2005). Biomethane from Dairy Waste. A Sourcebook for the Production and Use of Renewable Natural Gas in California. Western United Dairymen.
Lopez-Gonzalez, J. A., Lopez, M. J., Vargas-Garcia, M. C., Suarez-Estrella, F., Jurado, M., and Moreno, J. (2013). Tracking organic matter and microbiota dynamics during the stages of lignocellulosic waste composting. Bioresour. Technol. 146, 574–584. doi: 10.1016/j.biortech.2013.07.122
MAPA (2019). Spanish Ministry of Agriculture, Fisheries and Food. Livestock Statistics. Available online at: https://www.mapa.gob.es/es/estadistica/temas/estadisticas-agrarias/ganaderia/encuestas-ganaderas/
Mateo, J. J., and Maicas, S. (2015). Valorization of winery and oil mill wastes by microbial technologies. Food Res. Int. 73, 13–25. doi: 10.1016/j.foodres.2015.03.007
Medina, E., Romero, C., De Los Santos, B., De Castro, A., García, A., Romero, F., et al. (2011). Antimicrobial activity of olive solutions from stored alpeorujo against plant pathogenic microorganisms. J. Agricult. Food Chem. 59, 6927–6932. doi: 10.1021/jf2010386
Millner, P. D. (2009). “Manure management,” in The Produce Contamination Problem Causes and Solutions, eds G. M. Sapers, E. B. Solomon, and K. R. Matthews (Elsevier Inc.), 79–97.
Møller, H. B., Sommer, S. G., and Ahring, B. K. (2004). Methane productivity of manure, straw and solid fractions of manure. Biomass Bioenergy 26, 485–495. doi: 10.1016/j.biombioe.2003.08.008
Morillo, J. A., Antizar-Ladislao, B., Monteoliva-Sánchez, M., Ramos-Cormenzana, A., and Russell, N. J. (2009). Bioremediation and biovalorisation of olive-mill wastes. Appl. Microbiol. Biotechnol. 82, 25–39. doi: 10.1007/s00253-008-1801-y
Nasir, I. M., Tinia, I. M. G., and Rozita, O. (2012). Anaerobic digestion technology in livestock manure treatment for biogas production: a review. Eng. Life Sci. 12, 258–269. doi: 10.1002/elsc.201100150
Pullammanappallil, P. C., Chynoweth, D. P., Lyberatos, G., and Svoronos, S. A. (2001). Stable performance of anaerobic digestion in the presence of a high concentration of propionic acid. Bioresour. Technol. 78, 165–169. doi: 10.1016/S0960-8524(00)00187-5
Roig, A., Cayuela, M. L., and Sánchez-Monedero, M. A. (2006). An overview on olive mill wastes and their valorisation methods. Waste Manage. 26, 960–969. doi: 10.1016/j.wasman.2005.07.024
Serramiá, N., Sánchez-Monedero, M. A., Fernández-Hernández, A., García-Ortiz Civantos, C., and Roig, A. (2010). Contribution of the lignocellulosic fraction of two-phase olive-mill wastes to the degradation and humification of the organic matter during composting. Waste Manage. 30, 1939–1947. doi: 10.1016/j.wasman.2010.04.031
Spencer, J. L., and Guan, J. (2004). Public health implications related to spread of pathogens in manure from livestock and poultry operations. Methods Mol. Biol. 268, 503–515. doi: 10.1385/1-59259-766-1:503
Tekin, A. R., and Coşkun Dalgiç, A. (2000). Biogas production from olive pomace. Resour. Conserv. Recycling 30, 301–313. doi: 10.1016/S0921-3449(00)00067-7
Van Lier, J. B., Hulsbeek, J., Stams, A. J., and Lettinga, G. (1993). Temperature susceptibility of thermophilic methanogenic sludge: implication for reactor start-up and operation. Bioresource Technol. 43, 227–235. doi: 10.1016/0960-8524(93)90035-A
Wang, Y., Zhang, Y., Wang, J., and Meng, L. (2009). Effects of volatile fatty acid concentrations on methane yield and methanogenic bacteria. Biomass Bioenergy 33, 848–853. doi: 10.1016/j.biombioe.2009.01.007
Wilkie, A. C. (2005a). “Anaerobic digestion: biology and benefits,” in Dairy Manure Management: Treatment, Handling, and Community Relations (Ithaca, NY: NRAES-176, Natural Resource, Agriculture, and Engineering Service, Cornell University), 63–72.
Wilkie, A. C. (2005b). “Anaerobic digestion of dairy manure: design and process considerations,” in Dairy Manure Management: Treatment, Handling, and Community Relations (Ithaca, NY: NRAES-176, Natural Resource, Agriculture, and Engineering Service, Cornell University), 301–312.
Wilkie, A. C. (2008). “Biomethane from biomass, biowaste and biofuels,” in Bioenergy, eds J.D. Wall, C. S. Harwood, and A. Demain (Washington, DC: American Society for Microbiology Press), 195–205.
Wilkie, A. C., Castro, H. F., Cubinski, K. R., Owens, J. M., and Yan, S. C. (2004). Fixed-film anaerobic digestion of flushed dairy manure after primary treatment: wastewater production and characterization. Biosyst. Eng. 89, 457–471. doi: 10.1016/j.biosystemseng.2004.09.002
Wilkie, A. C., Goto, M., Bordeaux, F. M., and Smith, P. H. (1986). Enhancement of anaerobic methanogenesis from Napiergrass by addition of micronutrients. Biomass 11, 135-146.
Yadvika, S., Sreekrishnan, T. R., Kohli, S., and Rana, V. (2004). Enhancement of biogas production from solid substrates using different techniques—a review. Bioresour. Technol. 95, 1–10. doi: 10.1016/j.biortech.2004.02.010
Young, L. Y., and Rivera, M. (1985). Methanogenic degradation of four phenolic compounds. Water Res. 19, 1325–1332. doi: 10.1016/0043-1354(85)90189-7
Zarkadas, I. S., and Pilidis, G. A. (2011). Anaerobic Co-Digestion of table olive debittering & washing Effluent, cattle manure and pig manure in batch and high volume laboratory anaerobic digesters: effect of temperature. Bioresour. Technol. 102, 4995–5003. doi: 10.1016/j.biortech.2011.01.065
Zhai, N., Tong, Z., Dongxue, Y., Gaihe, Y., Xiaojiao, W., Guangxin, R., et al. (2015). Effect of initial PH on anaerobic co-digestion of kitchen waste and cow manure. Waste Manage. 38, 126–131. doi: 10.1016/j.wasman.2014.12.027
Zhang, C., Xiao, G., Peng, L., Su, H., and Tan, T. (2013). The anaerobic co-digestion of food waste and cattle manure. Bioresour. Technol. 129, 170–176. doi: 10.1016/j.biortech.2012.10.138
Keywords: anaerobic co-digestion, mixture ratio, biodegradability, methane production, 2POMW, dairy cattle manure
Citation: Rubio JA, Romero LI, Wilkie AC and García-Morales JL (2019) Mesophilic Anaerobic Co-digestion of Olive-Mill Waste With Cattle Manure: Effects of Mixture Ratio. Front. Sustain. Food Syst. 3:9. doi: 10.3389/fsufs.2019.00009
Received: 08 October 2018; Accepted: 01 February 2019;
Published: 21 February 2019.
Edited by:
Raul Moral, Universidad Miguel Hernández de Elche, SpainReviewed by:
Beatriz Molinuevo-Salces, Instituto Tecnológico Agrario de Castilla y León, SpainArturo F. Chica, Universidad de Córdoba, Spain
Copyright © 2019 Rubio, Romero, Wilkie and García-Morales. This is an open-access article distributed under the terms of the Creative Commons Attribution License (CC BY). The use, distribution or reproduction in other forums is permitted, provided the original author(s) and the copyright owner(s) are credited and that the original publication in this journal is cited, in accordance with accepted academic practice. No use, distribution or reproduction is permitted which does not comply with these terms.
*Correspondence: José L. García-Morales, am9zZWx1aXMuZ2FyY2lhQHVjYS5lcw==