- 1College of Forestry, Northwest A&F University, Yangling, China
- 2Institute of Bio-and Geosciences, Agrosphere Institute (IBG-3), Forschungszentrum Jülich, Jülich, Germany
- 3Qinling National Forest Ecosystem Research Station, Ningshan, China
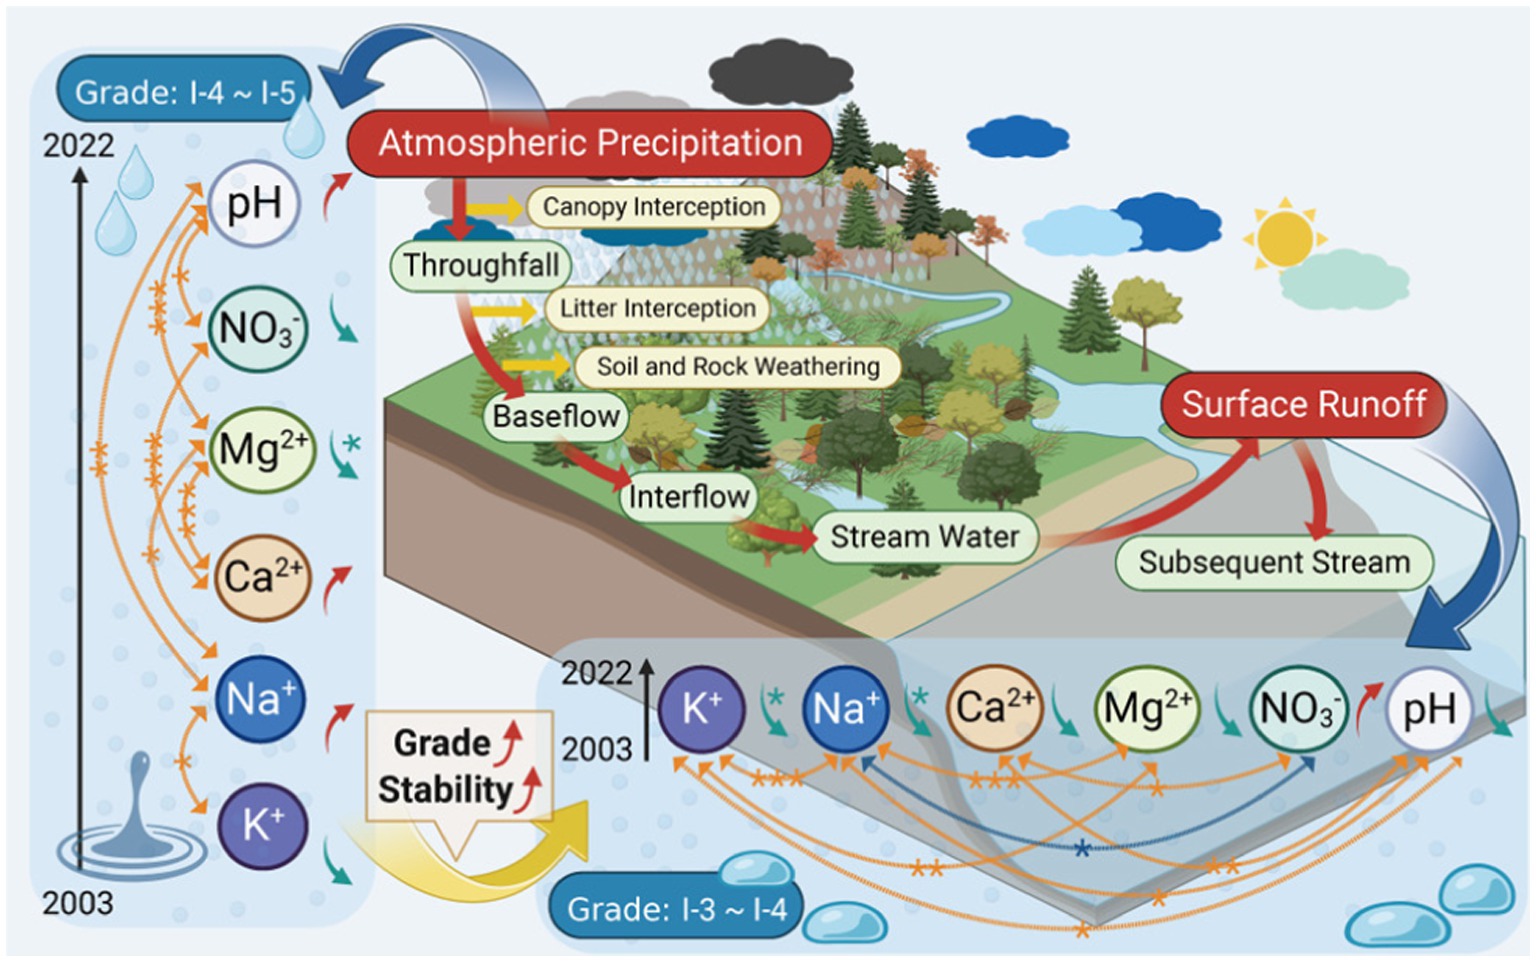
The Qinling Mountains, the so-called “central water tower,” are extremely important water resource hubs in China. The influence of the forest ecological environment on water quality is complicated. Therefore, to investigate the spatiotemporal variations in water quality, we employed a random forest model to integrate multiple key water quality indicators into one overall ranking value. Monthly monitoring data of surface runoff and atmospheric precipitation events (2003–2022) for the Huodigou stream in the Qinling Mountains were used. The results revealed that after atmospheric precipitation entered the forest ecosystem, the coefficients of variation of surface runoff for most of the selected indicators decreased, but there were significant differences among the six indicators (NO3−, Mg2+, Na+, pH, K+, Ca2+). Most of the indicators within surface runoff were positively correlated, such as those in atmospheric precipitation. However, some indices of surface runoff were negatively correlated with those of atmospheric precipitation, and there was a significant negative correlation between Ca2+ in atmospheric precipitation and Ca2+ in surface runoff and between NO3−in atmospheric precipitation and K+ and Na+ in surface runoff (p < 0.01). The water quality grade of the surface runoff generated by atmospheric precipitation through forest ecosystems was significantly improved (p < 0.001), among which the average water quality grade of surface runoff was approximately 3.6, that is, between Grade I-3 and Grade I-4, whereas the average water quality grade of atmospheric precipitation was approximately 4.5, that is, between Grade I-4 and Grade I-5. The order of improved water quality was NO3− > Mg2+ > Na+ > pH > K+ > Ca2+. Overall, our assessment revealed that from 2003 to 2022, the water quality grade in the Huodigou stream improved and was more stable. In summary, the forest ecosystem in the Huodigou stream has a significant water quality purification effect on the atmospheric precipitation it receives. Our novel criterion-based approach for categorizing the water quality of atmospheric precipitation and surface runoff offers a new tool for examining spatiotemporal stream water quality variations in the Qinling region and other mountainous areas.
1 Introduction
At present, the rapid growth in population, urbanization, industrialization, agriculture and deforestation have led to increasingly serious global water shortages (UN-Water, 2018). Nearly one-third of the world’s population resides in countries facing severe water shortages, highlighting the critical issue of water scarcity, which hampers both quality of life and economic development (Misaghi et al., 2017; Mishra et al., 2016). As a global resource, water is vital in the natural water cycle and international trade. Many of the products consumed in the European Union (EU28) are produced abroad, so the European economy is particularly dependent on water resources elsewhere; if the production of products in these places decreases due to water shortages, the supply of these imported products, particularly those that rely on water, will be at great risk (Ercin et al., 2016). The scope of environmental impact has expanded to the global level. Quantitative indicators, including the criticality ratio (water stress) (Alcamo et al., 2003), water footprint-based assessment, the cumulative abstraction-to-demand ratio (Hoekstra and Hung, 2002), the LCA-based water stress indicator (Pfister et al., 2009), the quantity–quality–environmental flow requirement (QQE) indicator (Liu et al., 2017; Zeng et al., 2013) and model analysis (Boulay et al., 2014; Dalezios et al., 2018), have been used in previous research to evaluate water shortages, but the regional water shortages caused by water quality changes have not been fully discussed. Every 1% improvement in water quality can result in critical savings in processing costs to ease water shortages (Klemeš, 2012) and create significant ecological benefits (Griffiths et al., 2012). In the natural water cycle, the function of forests for water conservation and quality improvement is recognized. There is research that increased overall forest cover decreases water yield in sub-watersheds, thereby likely increasing nutrient retention and decreasing the export of potentially harmful nitrogen and phosphorus (Delphin et al., 2014). Therefore, exploring changes in water quality after atmospheric precipitation enters forest ecosystems is critical to ensuring a sustainable water supply.
Known as the central water tower in the hinterland of China, the Qinling Mountains are among the most important water resource hubs in China. The water quality of the Hanjiang River Basin, which originates in the Qinling Mountains, is very important for ensuring the production and domestic water consumption of 34.68 million people in North China (Zhang, 2007). It also serves as a crucial water supply for the central section of China’s South-to-North Water Diversion Project (Zhang et al., 2022), and directly affects the water quality of many water sources and tributaries. In recent years, most studies on forest and water quality in the Qinling Mountains have focused mostly on the water quality effects of various levels of forest ecosystems (Chen et al., 2018; Zhang and Liang, 2012) and the effects of thinning intensity on the hydrological system of forest ecosystems. Most of these studies were limited to a few years of individual forest areas on the southern or northern slopes of the Qinling Mountains (Zhao et al., 2015). Studying water quality change on a larger time scale can further clarify its complexity and make hydrological predictions more accurate and reliable. Hence, it becomes imperative to conduct research on forest water quality changes in the Qinling Mountains over a large time scale.
Water quality evaluation has become a popular research topic worldwide due to the water quality decline caused by the competition between the supply and demand of water resources and their pollution (Hurk et al., 2014; Yan et al., 2022; Zhou et al., 2013). There are many methods for assessing water quality, such as the single element assessment, comprehensive pollution index, water pollution index, graded weighted average, fuzzy evaluation, and random forest methods (Li et al., 2017; Yang et al., 2023). The random forest model can be used to evaluate water quality accurately, and the method has high training efficiency, objectivity and stability (Jena et al., 2023; Xiong et al., 2023). Thus, it can be used in future water quality monitoring and timely warning systems (Chen et al., 2020). There are very few reports on water quality evaluation in the Qinling Mountains thus far. Previous studies adopted principal component analysis (PCA) (Gao, 2018), single factor evaluation and the comprehensive pollution index method (Wei, 2023) to evaluate water quality in the Qinling Mountains. Although the single attribute and comprehensive attribute of water were considered to achieve a comprehensive evaluation, the accuracy of the evaluation was affected by the limitation of the pollution index. It is essential to use more accurate methods to provide a theoretical basis for water quality evaluation, water pollution prevention and management in the Qinling Mountains.
In this study, we used a random forest model to construct a water quality assessment model for the Houdigou stream in the Qinling Mountains. Different water quality indices of atmospheric precipitation and surface runoff in the Huodigou stream over the last 20 years were used to evaluate the water quality levels of the stream during different periods. With less reference adjustment, high prediction accuracy and good generalization ability, the random forest model can be used to fully study the water quality in the Huodigou region of Qinling on a large time scale and analyze the temporal and spatial characteristics of regional water quality under the influence of forest ecosystems. We then identified the influencing factors, which can provide a scientific decision-making basis for the sustainable development of water resources and the evaluation of water resource security in the Qinling Mountains.
2 Materials and methods
2.1 Study area
As one of China’s most important water diversion projects and one of China’s national strategic projects, the South-to-North Water Diversion Middle Route Project has attracted much attention (Zhang and Liang, 2012). The Qinling Mountains are a mountain range that extends from east to west in central China and are important water conservation areas in China (Yan, 2011). Among them, the middle mountain area on the southern slope of the Qinling Mountains represents the core water source forest area of the middle route of China’s South-to-North Water Diversion project. The Huoditang natural forest region is located within the middle section of the mid-mountain zone on the southern slope of the Qinling Mountains and has typical characteristics in terms of climate, forest vegetation, soil, topography, etc. Furthermore, the Huodigou stream has a dendritic water system in the middle mountain zone on the southern slope of the Qinling Mountains. The selection of the Qinling experimental site in Huodigou Valley has good representativeness.
The administrative division of the Huoditang natural forest region is Ningshan County, Shaanxi Province. The longitude and latitude coordinates are 33°25′–33°29′N, 108°25′–108°30′E (Figure 1a). The forest area is 22.25 km2, the altitude is 1,470–2,473 m, and the area has a warm temperate moist montane climate. The Huodigou stream, which is approximately feather shaped, is the largest natural water catchment area in the Huoditang forest region, covering an area of 729 hm2. The surface runoff from this area is channeled into the Ziwu River, which is a feeder stream of the Han River (Lu et al., 2014). The Danjiangkou Reservoir serves as the water supply hub for China’s South-to-North Water Diversion Middle Route Project, with more than 70% of its water originating from the Han River. The annual average temperature near the watershed is 8–12°C, the annual precipitation is between 900 and 1,200 mm, the average relative humidity is approximately 77%, and the frost-free period is 199 days. The major soil types are mountain chestnut soil, dark chestnut soil, and meadow soil, with the parent rocks for soil formation primarily consisting of granite, gneiss, metamorphic sandstone, and slate. The forests in the stream area have been being cut down since the 1960s. In 1998, the country banned the logging of natural forests and implemented stream protection measures. The existing forest is a natural secondary forest where the original vegetation was restored after logging, with a vegetation coverage rate of more than 90%. The major tree species include Quercusaliena var. acuteserrata, Pinus tabuliformis, Pinus armandii, Betula albosinensis, Betula luminifera, etc.
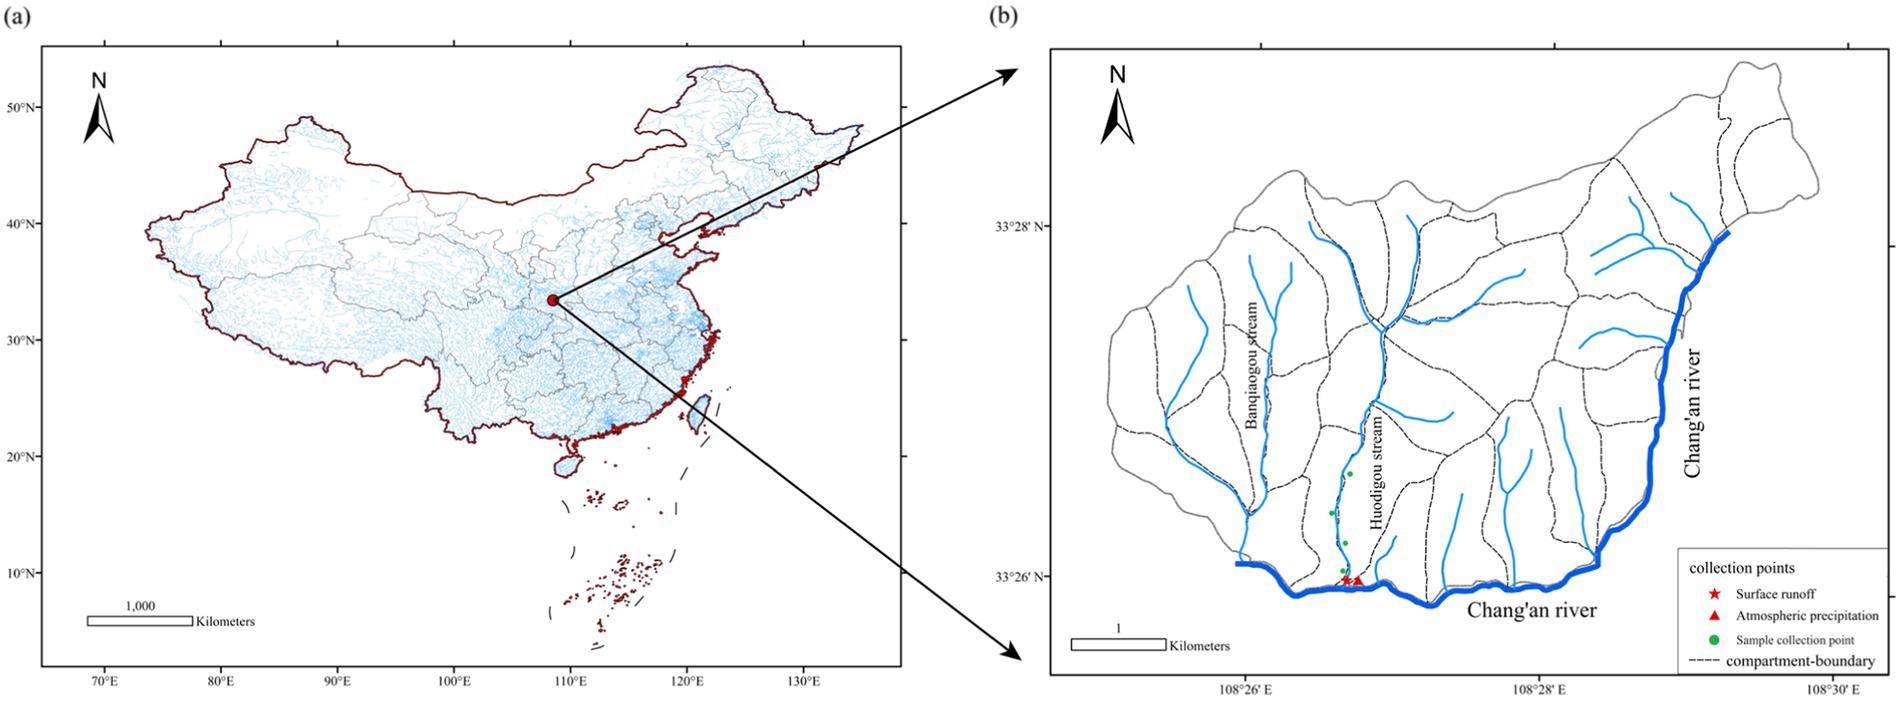
Figure 1. Stream location schematic diagram (a) red points represent the locations in this study; sampling site location schematic diagram (b).
2.2 Water sampling
Sampling was conducted in the Huodigou stream of the Qinling Mountains. In 2003, 2004, 2009, 2010, 2011, 2012, 2013, 2014, 2015, 2016, 2017, 2018, 2020, and 2022, precipitation water samples and runoff water samples were collected from the Huodigou stream. Surface runoff water samples were collected at the lower part of the Parshall flume, and 500 mL was collected each time and placed in polyethylene water sample bottles. The four collection sites of atmospheric precipitation are in the open area next to the Huodigou stream, approximately 100 m from the Parshall flume (Figure 1b).
The water samples were collected via eight rain gauges, each with a radius of 10 cm and a height of 20 cm, positioned two per site. The bucket openings were secured with gauze mesh, which allowed the entry of rainfall while blocking insects and plant debris and helped minimize the impact on water quality of element loss due to evaporation. The precipitation collected from all the samples was mixed on the second morning after each rain shower, and 500 mL was collected with a polyethylene water sample bottle. The runoff water samples were collected at the same time.
2.3 Laboratory methods for chemical analysis
After sampling, the samples for various projects were stored in a sample bottle with the lid tightened to ensure that the samples were kept sealed, refrigerated at 0°C and sent to the laboratory for analysis on the same day. The sample determination methods and standards used were as follows.
2.3.1 pH value: electrode method
A laboratory pH meter (PHSJ-6 L) was used for testing the samples. A standard solution that differed from the pH of the sample by no more than 2 pH (pH = 4, 25°C) units was chosen as the first standard calibration solution. The electrodes were removed, rinsed thoroughly, and blotted dry with filter paper. A standard solution that was approximately 3 pH (pH = 9.18, 25°C) units different from the first standard calibration solution was chosen as the second standard solution. The electrode was rinsed carefully with distilled water, and the surface of the electrode was blotted with the edge of a filter paper. Immediately after the sample was poured into a 100 mL beaker along the wall of the cup, the electrode was immersed in the sample and stirred slowly and horizontally to prevent bubbles. We measured the pH when the readings stabilized. After sample detection, the electrodes were flushed with distilled water.
2.3.2 Determination of NO3−: ion chromatography analysis
The 100 mL shaken sample was accurately measured and placed in a 250 mL polytetrafluoroethylene beaker. The sample was passed through a 0.45 μm cellulose acetate membrane for filtration and then stored at a temperature of 4°C for preservation. The NO3− content was determined via ion chromatography. The standard NO3− solution was removed, and the mass concentrations of NO3− were 0.40, 1.00, 2.00, 4.00, 10.00, 20.00 and 40.00 mg/L. The calibration curve was drawn with the mass concentration of each ion as the horizontal coordinate and the peak area as the vertical coordinate. The results revealed that all the ions had a good linear relationship in the corresponding concentration range, and the correlation coefficient was r > 0.999. The sample to be measured was injected into the ion chromatography instrument via a manual or automatic sampler.
2.3.3 Determination of metal elements (K+, Na+, Ca2+, Mg2+): inductively coupled plasma–mass spectrometry
Mixed standard solutions of K+, Na+, Ca2+ and Mg2+ were prepared. The standard curve series concentrations of the elements to be measured were 0.00 mg/L, 0.50 mg/L, 2.00 mg/L, 4.00 mg/L, 10.00 mg/L, and 20.00 mg/L, and the medium contained 1% nitric acid. Before sample atomization, the internal standard solution was automatically added through the peristaltic pump so that the concentration of the internal standard solution was 40 μg/L, and a standard curve was drawn.
The 100 mL shaken sample was accurately measured in a 250 mL polytetrafluoroethylene beaker and filtered through a 0.45 μm cellulose acetate membrane. Then, 2 mL nitric acid solution (1 + 1) and 1 mL hydrochloric acid solution (1 + 1) were added and dissolved at 85°C on an electric heating plate. The solution was allowed to stand from boiling until the sample had evaporated to 20 mL. The beaker was covered with a surface dish, and the solution was slightly reflowed for 30 min. After cooling, the samples were transferred to a 50 mL volumetric flask with deionized water and shaken well for measurement. The sampling amount could be appropriately reduced according to the actual situation of the sample. The surrounding environment of the fume hood ensured that the sample was not contaminated during digestion. If there was insoluble matter in the digestion solution, it was left overnight or centrifuged to obtain the clarified solution.
2.4 Theory and calculation
2.4.1 Principle of the random forest
The single-factor evaluation method is used to evaluate water quality when a certain index in the water exceeds the prescribed limit range; that is, when the water quality is judged as unqualified. When the water quality of multiple water bodies is unqualified in different indicators, the quality of these water bodies cannot be classified. The comprehensive pollution index method is only suitable for evaluating water quality with low evaluation requirements, and the fuzzy comprehensive evaluation method is suitable for evaluating water quality with more uncertain factors. The evaluation accuracy of the artificial neural network and Grey system theory methods is not high, or the results tend to be average. Principal component analysis (PCA) is suitable for water quality assessment with many evaluation indices and can reduce high-dimensional variables to several factors reflecting the information of the original variables. The random forest method has the characteristics of high robustness, strong practicability and good generalization performance, and the evaluation accuracy can reach 100% under certain circumstances (Zhang and Gao, 2016), which can be used to evaluate water quality effectively.
The random forest algorithm is an ensemble algorithm that integrates N decision trees for classification and regression. It operates on the principles of random subspace theory and the bagging method.
The core of the algorithm is to build a regression decision tree combination model. A single tree is split downward by the root node traversal so that it can grow freely without pruning.
The classification decision in the random forest algorithm is based on a majority voting mechanism. For a given input sample, each tree independently makes a classification prediction, and the final classification result is determined by the most frequently occurring category. This collective decision-making approach renders random forest highly accurate and robust in handling classification tasks.
The performance of the algorithm partially depends on the correlation among the trees and the strength of each individual tree. Ideally, the low correlation between trees combined with the high predictive power of each tree work together to minimize the model’s overall generalization error.
2.4.2 Water quality evaluation standards
The water quality evaluation grading standard is the basis of water quality evaluation, which needs to be open, be uniform, and reflect the progressive change in water quality. Drawing upon the relevant research in the literature and the “Environmental Quality Standards for Surface Water” (MEEPRC, 2002), the upper and lower limits of the water quality of the corresponding indicators were selected, as shown in Table 1. However, since the water quality in the Huodigou stream was at level I, Grade I of the water quality level was divided into five levels, I-1, I-2, I-3, I-4, and I-5, by scaling in equal proportions, as shown in Table 2.
The random interpolation method was used to generate 200 sets of sample data within each water quality grade interval in Table 1, and there were 1,000 sets of sample data in total for 5 water quality grades. A total of 750 groups were randomly selected as training samples, and the other 250 groups were selected as test samples. The distribution numbers I, II, III, IV, and V represent water quality grades I-1, I-2, I-3, I-4, and I-5, respectively. Water quality index data were taken as the input variable, and the water quality grade was taken as the output variable.
2.4.3 Model parameter optimization
There are two sensitive parameters within the random forest algorithm framework: ntree and mtry. The former is the number of decision trees, which affects the running speed and classification effect of the algorithm. The latter is the number of attributes in the split attribute set, which affects the split attribute assignment of nodes. These two parameters jointly determine the complexity of the random forest model. To establish the optimal model, a grid search method is usually used to set the parameters. Changing the parameters results in slightly different accuracy of the model. With increasing ntree, the error tends to decrease in general. When ntree is >400, the error is small and stable. Considering the variation trend of the error comprehensively, the error was set to 500, and the error was 0.03067 (Figure 2a). When mtry = 3, the out-of-bag error (OOB) reached a minimum, which was also 0.03067, indicating that the optimal parameter of mtry was 3 (Figure 2b).
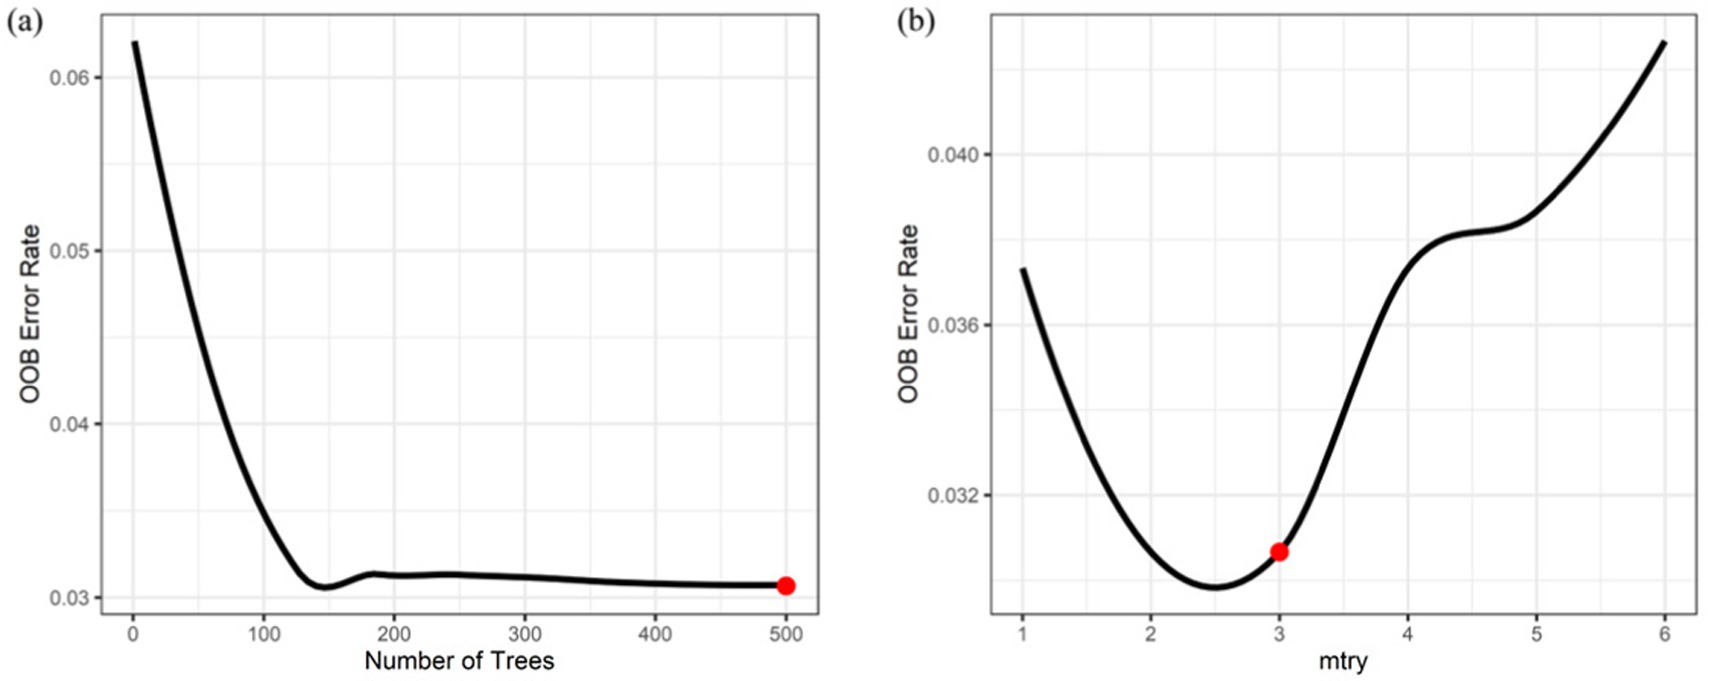
Figure 2. Random forest model parameter settings. The number of trees in a random forest (a); the number of variables preselected by the tree node (b).
2.4.4 Importance of OOB
In the process of stochastic forest modeling, the collinearity between variables and the influence of data noise can be excluded to identify the importance of variables. The influence of each index factor in the water quality evaluation model can be determined according to the importance scores. OOB is one of the methods for measuring the importance of variables within the random forest algorithm framework (Equation 1). In a single tree, the Gini coefficient is the sample purity of each node in the node splitting process. The formula is as follows:
where p is the proportion of positive samples allocated to tree node k, the proportion of negative samples of nodes is (1-p), and OOB is the coefficient value. In the random forest model, the importance of a variable is the sum of the decrease in the OOB value from parent to child on all nodes (i.e., the decrease in the Gini coefficient, MDG) when this characteristic variable is split. The higher the score is, the greater the importance of the variable.
2.4.5 Data processing
The water quality and water quality grade data of the monthly samples were analyzed in MS Excel for basic statistical processing. Correlations and differences between water quality data were visualized using Origin (2022). Random forest modeling, water quality assessment and Wilcoxon nonparametric testing were performed in R for Windows 4.3.1 and RStudio (2023).
3 Results
3.1 Statistical characteristics of water quality
The concentrations of K+ and Na+ in surface runoff and Mg2+ in atmospheric precipitation decreased linearly with time (Figures 3c,d,f). NO3−in surface runoff and pH, Na+, and Ca2+ in atmospheric precipitation showed a certain upward trend, whereas the other five indices all showed a certain downward trend (Figure 3). The overall water quality conditions in the Huodigou stream were favorable. The average concentrations of six indices in the process of surface runoff formed by atmospheric precipitation after passing through the forest ecosystem increased to varying degrees, among which the average concentrations of Ca2+ and Mg2+ increased by approximately 10 times at most, and the average concentrations of other indices increased by approximately 1–3 times. However, by comparing the dispersion coefficients of all the surface runoff and atmospheric precipitation indicators, it was evident that, except for Na+ concentration, the dispersion coefficients of the other ion concentrations were manifested as greater atmospheric precipitation than surface runoff; that is, the ion concentration of surface runoff formed after atmospheric precipitation passed through forest ecosystems became more stable.
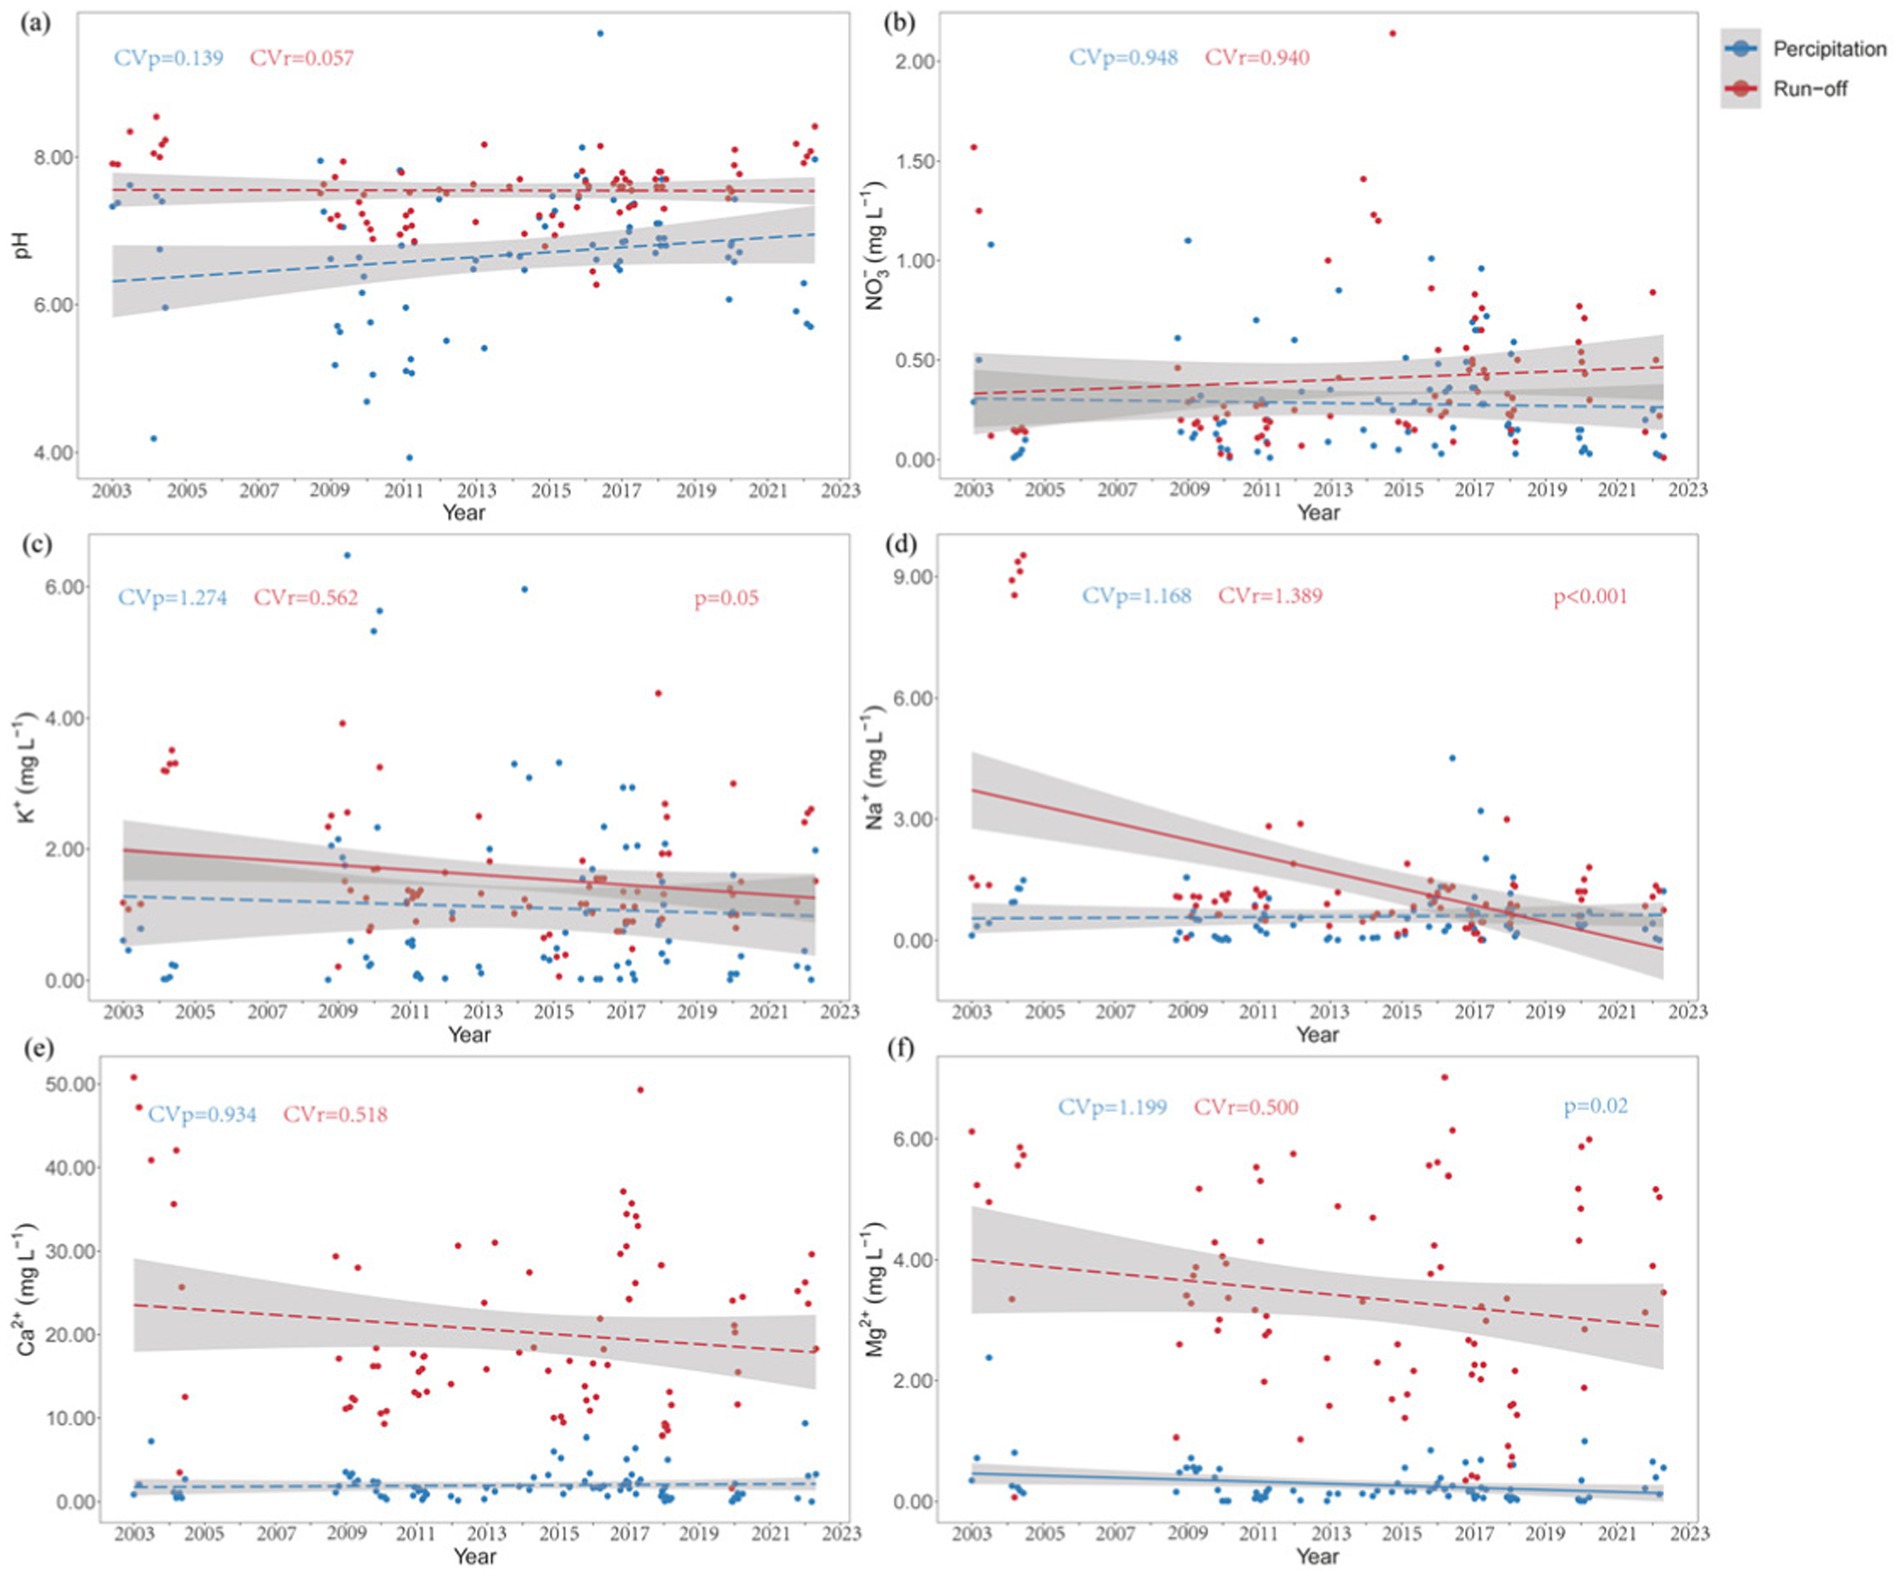
Figure 3. Linear regression plots of indicators of atmospheric precipitation and surface runoff over time. CVp, Coefficient of variation for atmospheric precipitation; CVr, Coefficient of variation for surface runoff. Indicators include: pH (a); NO3− (b), K+ (c), Na+ (d), Ca2+ (e), and Mg2+ (f).
There were significant differences between the six corresponding indices of atmospheric precipitation and surface runoff in the Huodigou area (p < 0.05, Figure 4). Except for NO3−, the differences in the other indices reached a very significant level (p < 0.001). In the process of transforming atmospheric precipitation into surface runoff after passing through forest ecosystems, the pH value changed from near-neutral and slightly acidic to weakly alkaline, indicating that H+ was consumed during the process of atmospheric precipitation passing through the three hydrologic layers of forest ecosystems, resulting in an increase in the pH value, whereas other ions all increased to varying degrees. NO3−, K+, and Na+ were less affected than Ca2+ and Mg2+.
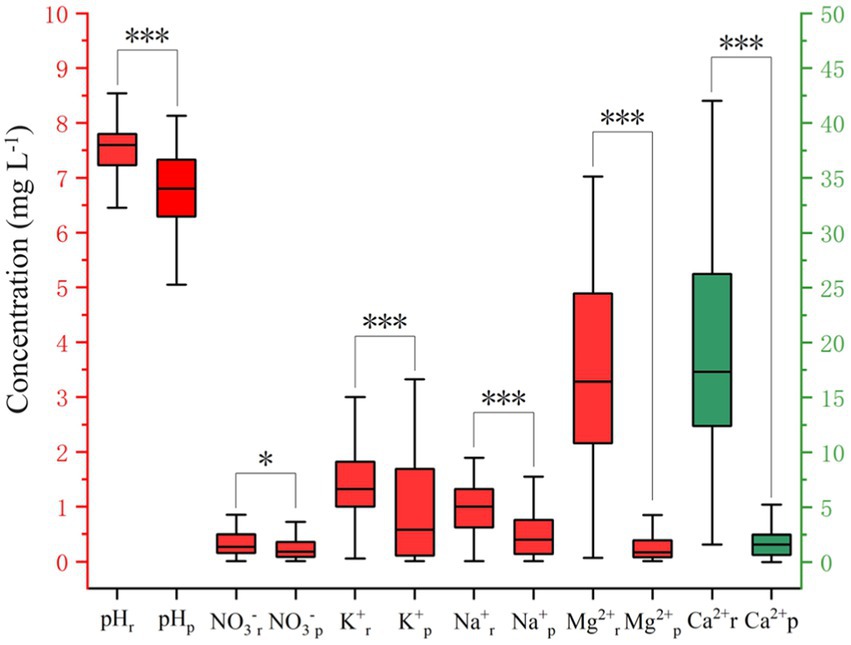
Figure 4. Box plots illustrating differences in corresponding indicators between atmospheric precipitation and surface runoff. pHr, pH value in surface runoff; pHp, pH value in atmospheric precipitation; NO3−r, K+r, Na+r, Ca2+r, and Mg2+r, Concentrations of NO3−, K+, Na+, Ca2+, and Mg2+ in surface runoff; NO3−p, K+p, Na+p, Ca2+p, and Mg2+p, Concentrations of NO3−, K+, Na+, Ca2+, and Mg2+ in atmospheric precipitation. The levels of statistical significance are as follows: *p < 0.05, **p < 0.01, ***p < 0.001.
3.2 Correlation of water quality
There was a positive correlation between surface runoff and atmospheric precipitation. There were significant positive correlations between pH and Mg2+, NO3− and Ca2+, Ca2+ and Mg2+ in atmospheric precipitation (p < 0.001) and significant positive correlations between pH and Na+ (p < 0.01, Figure 5). There were also significant positive correlations between pH and NO3−, K+ and Ca2+, and Na+ and Mg2+ (p < 0.05). There were significant positive correlations between K+ and Na+, Na+ and Mg2+ in surface runoff (p < 0.001) and between pH and Ca2+, K+ and Mg2+ (p < 0.01). There were also significant positive correlations between pH and K+, pH and Na+, NO3− and Na+, and NO3− and Ca2+ (p < 0.05). Each index of atmospheric precipitation in the Huodigou stream influenced each other before and after they entered the forest ecosystem. That is, there were positive effects among most indicators in the water body.
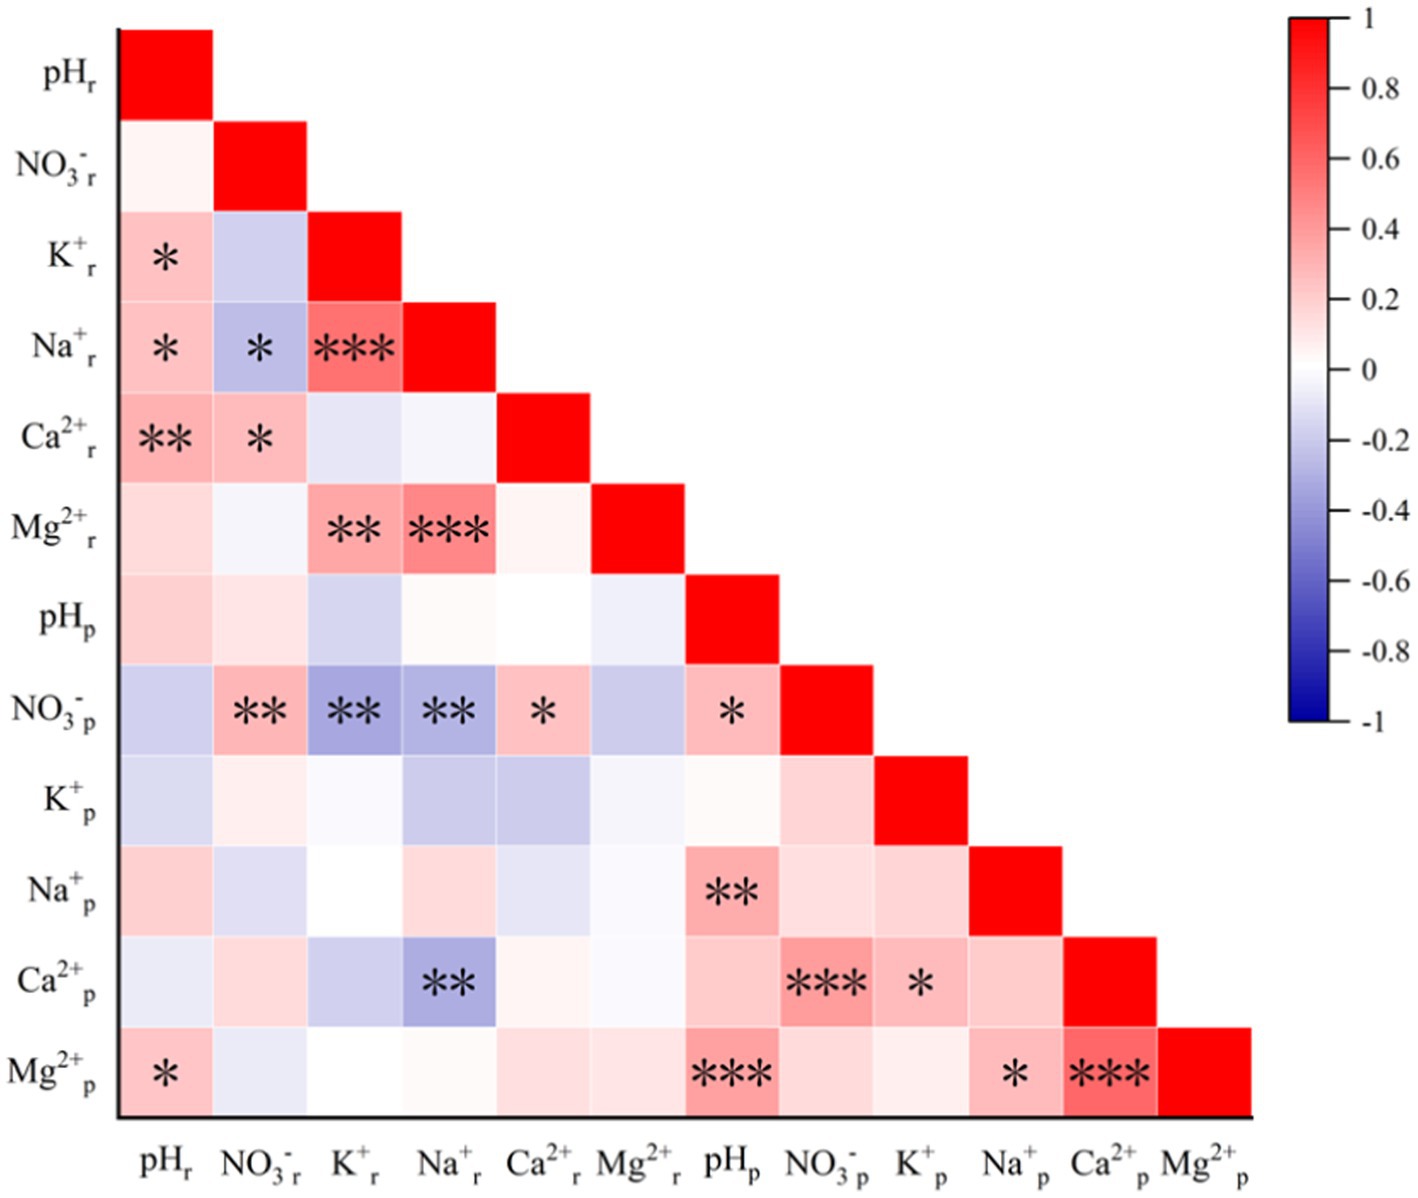
Figure 5. Heatmap depicting the correlation of indicators in atmospheric precipitation and surface runoff. pHr, pH value in surface runoff; pHp, pH value in atmospheric precipitation; NO3−r, K+r, Na+r, Ca2+r, and Mg2+r, Concentrations of NO3−, K+, Na+, Ca2+, and Mg2+ in surface runoff; NO3−p, K+p, Na+p, Ca2+p, and Mg2+p, Concentrations of NO3−, K+, Na+, Ca2+, and Mg2+ in atmospheric precipitation. The levels of statistical significance are as follows: *p < 0.05, **p < 0.01, ***p < 0.001.
There was a certain correlation between surface runoff and atmospheric precipitation in the Huodigou stream, and there was a significant negative correlation between Ca2+ in atmospheric precipitation and Ca2+ in surface runoff, NO3-in atmospheric precipitation and K+ and Na+ in surface runoff (p < 0.01). However, there was a significant positive correlation between NO3− in atmospheric precipitation and NO3− in surface runoff (p < 0.01) or Ca2+ in surface runoff (p < 0.05).
Moreover, a significant positive correlation was observed between Mg2+ in atmospheric precipitation and pH in surface runoff (p < 0.05). These findings indicate that NO3− in surface runoff is affected mainly by NO3− in atmospheric precipitation and that the effect on forest ecology is relatively small. Mg2+ in atmospheric precipitation affects the pH of surface runoff and NO3− in atmospheric precipitation, Ca2+ in surface runoff decreases with increasing Ca2+ in atmospheric precipitation, and K+ and Na+ in surface runoff decrease with increasing NO3− in atmospheric precipitation. Other ions are affected mainly by forest ecosystems. Furthermore, the atmospheric precipitation in the Huodigou stream series experienced extremely complex fluctuations in water quality after entering the forest ecosystem.
These correlation analyses help us to better understand the correlation between forest ecosystems and atmospheric precipitation, improve our understanding of hydrological processes, and better predict the factors affecting elemental change.
3.3 Water quality grade evaluation
The random forest model revealed that the water quality significantly improved when atmospheric precipitation entered the forest ecosystem and formed the Huodigou stream, among which the average water quality grade of surface runoff was approximately 3.6, that is, between Grade I-3 and Grade I-4, whereas the average water quality grade of atmospheric precipitation was approximately 4.5, that is, between Grade I-4 and Grade I-5. Over time, the water quality grade and its stability in the Huodigou stream improved (Figure 6).
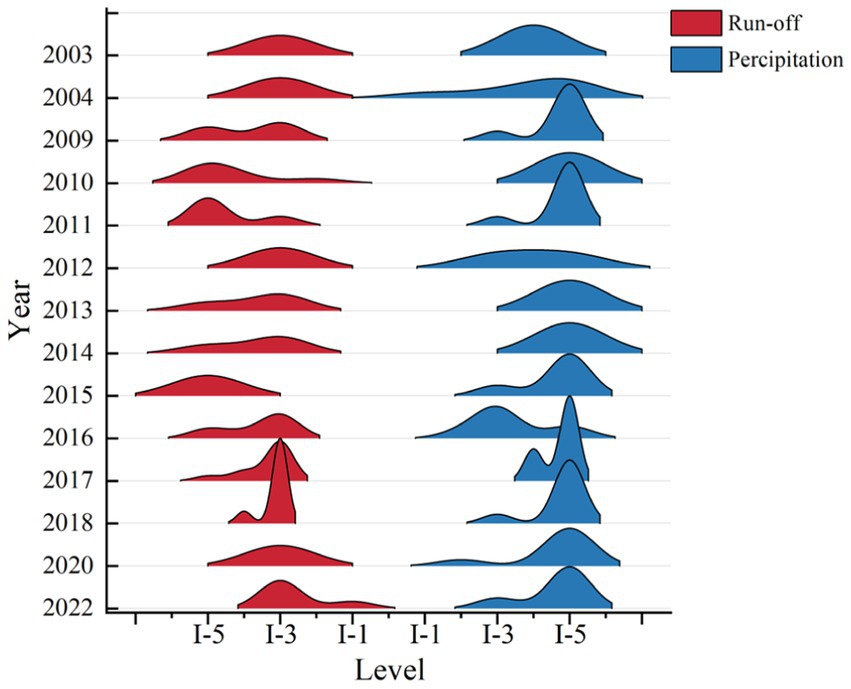
Figure 6. Topographic chart illustrating the distribution of water quality health grades across different years.
The results showed that forest ecosystems influence purifying water quality in the process of converting atmospheric precipitation into surface runoff, and with the continuous stability of forest ecosystems, the purification effect on water quality is also constantly improving. The regression analysis revealed that there was a positive correlation between them, which reached a significant level (r = 0.24, p < 0.05; Figure 7).
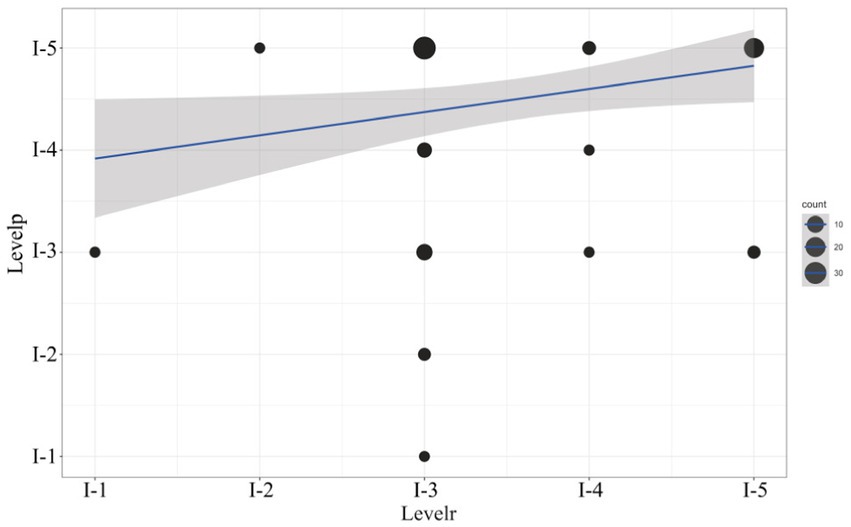
Figure 7. Linear regression plot of water quality grades between atmospheric precipitation and surface runoff. Levelp, Water quality grade of atmospheric precipitation; Levelr, Water quality grade of surface runoff.
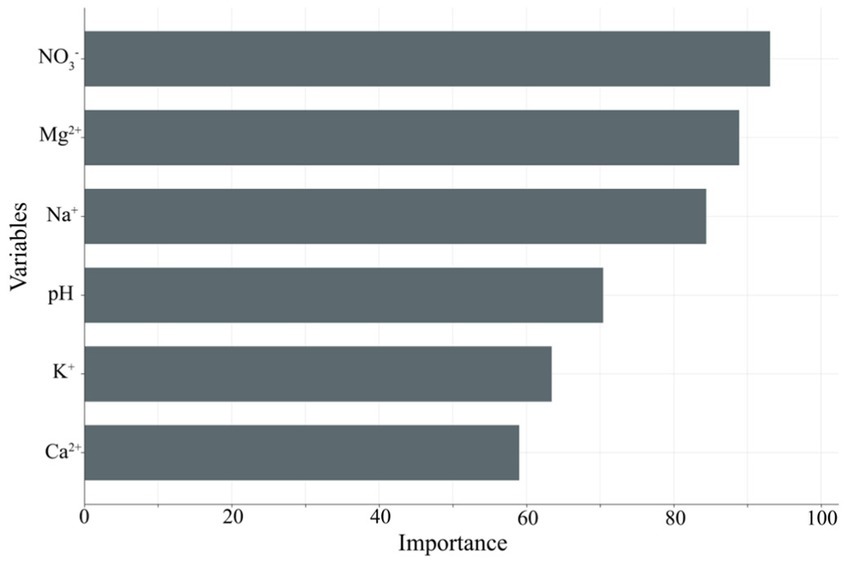
This illustrated that the water quality of surface runoff increased with increasing atmospheric precipitation water quality. The importance analysis of the established random forest model revealed that the order of influence on water quality in the Huodigou stream was NO3− > Mg2+ > Na+ > pH > K+ > Ca2+ (Figure 8).
4 Discussion
The impact of forests on water quality has been widely studied in Europe and North America (Grace, 2005; Matías and Juha, 2021; Shepard, 1994). It mostly includes two aspects. First, the forest itself absorbs and lixiviates multiple chemical components in natural precipitation, followed by a change in the composition and content of the chemical components in natural precipitation; second, the impact of the forest ecosystem on river water quality increases. We analyze and discuss the above two aspects.
Observations in Shaoshan Forest, Central-South China watershed, indicated that the content of chemical components changes during the process of precipitation passing through the tree canopy or reaching the ground along the tree trunk to form surface runoff. The contents of OH−, Na+, K+, Ca2+, Mg2+, NO3− and other ions in forest rainfall and tree trunk runoff have increased. When precipitation passes through a forest watershed, various chemical components can increase (Zhang et al., 2006). Some of our results were highly consistent with the changes in ion content in surface runoff found in this study. These findings indicate that the significant changes in the chemical composition of precipitation in the study area are caused mainly by forest precipitation penetrating the canopy. This may be due to the washing away of some substances when they contact the leaf surface and the leaching or absorption process of nutrients by the canopy.
One of the studies on pH variations revealed that the increase in pH observed when rainwater filtered through the canopy can be attributed to two main factors. The first is the exchange of base cations found in leaf tissue for hydrogen ions (H+) present in the rain; this process is particularly active during the growth season when leaves have a high concentration of exchangeable base cations (Li et al., 2010). The second factor is the neutralization of acidic cations in rainwater by weakly basic anions that are leached from leaves (Tao et al., 2007). However, in this study, the pH decreased after atmospheric precipitation was converted into surface runoff at almost all time points, especially when the precipitation pH was relatively low, and the study area effectively neutralized acidic precipitation. This increase in pH may be due to the involvement of weak acid anions in the forest canopy in the neutralization of H+.
Davis (2014) reported that the content of NO3− in streams decreased significantly after 5 years of afforestation. This result is exactly opposite to our results. However, studies have shown that increased atmospheric nitrogen deposition due to fossil fuel burning or agricultural activities leads to nitrogen saturation in forest ecosystems, and when forest ecosystems reach nitrogen saturation, the remaining nitrogen oxides seep into surface runoff (Crowley and Lovett, 2017). In recent years, rural tourism in the Qinling Mountains has developed rapidly, and more tourists and local residents choose to drive by themselves in the countryside, which leads to the congestion of tourist traffic in some areas on weekends and holidays (Zhou et al., 2024). The highways are located in the mountain valleys of the Qinling Mountains, and the air does not easily flow; however, high concentrations of nitrogen oxides from vehicle exhaust accumulate near highways, causing the forest ecosystem to reach nitrogen saturation (Zhang, 2007). The increase in NO3− in surface runoff relative to atmospheric precipitation in this study may have occurred because the forest ecosystem in the watershed is in the nitrogen saturation state mentioned above.
For metal cations, Ca2+ is more likely to be intercepted by the canopy, whereas K+ and Mg2+, which are more mobile, appear in higher proportions in penetrating rain (Béjar et al., 2018). For example, Jaramillo (2003) reported that rainfall has a K+ concentration increase of nearly 10 times when rain reaches the ground. However, other studies have shown that Ca2+ also has a canopy leaching effect (Hou and Wei, 2001). The increase in metal cations in the precipitation in the forest may have resulted from the transpiration liquor of the cell wall, and the cell protoplasm selectively absorbs only the nutrients needed at that time from the liquid flow. The remaining nutrients are condensed in the cell wall and cuticle, and they are exchanged by hydrogen ions when precipitation occurs. This is highly consistent with the findings in this study that the metal cation content increased as the pH increased.
Furthermore, a study has shown that the dissolution of various types of organic matter in soil rock weathering materials, plant and animal remains and the degree of water erosion all increase the contents of various chemical components in the water (Bogdał et al., 2019). Oulehle et al. (2017) reported that geological weathering is the main reason for the increased contents of Na+, Ca2+ and Mg2+ in streams.
Because the precipitation water quality output by forests is often partially purified, different vegetation types affect the water quality of streams differently. Many studies have hypothesized that broad-leaved tree species in vegetation types positively affect the chemical composition of surface runoff (Lopes et al., 2019; Matías and Juha, 2021; Vardon et al., 2019) and that mixed forests have the best purification effect on water quality. However, some studies have shown that the concentrations of organic matter, N, P, and Ca2+ in surface runoff in mixed forests significantly increase (Klimaszyk et al., 2015). Similar phenomena were found in surface runoff in this study, namely, significant increases in the concentrations of NO3−, K+, Na+, Ca2+, and Mg2+.
In terms of studies on the role of forests in protecting water sources and preventing pollution, Fujii et al. (2001) researched the role of forests in purifying runoff in the Lake Biwa watershed. The results revealed that forests have a certain purifying effect on nitrogen and organic matter, but they are also the source of most ion species (Fujii et al., 2001). It has also been reported that the coefficient of variation of various ions in atmospheric precipitation continues to decrease during the process of passing through the forest canopy to form in-forest precipitation and that the entire forest ecosystem forms surface runoff (Raat et al., 2023). In the water quality evaluation of atmospheric precipitation and surface runoff in this study, it was also found that the forest ecosystem has a purifying effect on water quality and increases the stability of pH, K+, Ca2+, Mg2+, and NO3−.
Although the forest ecological system in Huodigou Stream in this study has been continuously losing a variety of basic cations and nitrate nitrogen in the past two decades, there are almost no signs of forest destruction. The mechanisms that control nutrient cycling and regulate forest development are unknown. Therefore, there is an urgent need to elucidate nutrient cycling throughout forest ecosystems and the impact of these elements on forest productivity in future studies in this region.
5 Conclusion
This paper studies the changes in water quality in the Qinling Mountains of China over the past 20 years and constructs a random forest model using the R language to evaluate water quality. The results revealed that most of the indicators in surface runoff are positively correlated with those in atmospheric precipitation. Some surface runoff indices were negatively correlated with atmospheric precipitation indices. It has long been known that forest ecosystems affect the water quality of atmospheric rainfall, but notably, the degree of impact on water quality is different. The order of improvement in water quality was NO3− > Mg2+ > Na+ > pH > K+ > Ca2+. The coefficient of surface runoff variation decreased for most of the indicators, but there was a significant difference among the six indicators. Previous studies have shown that different indicators change due to environmental changes in tree species and forest ecosystems, but the internal complex mechanism of these changes is worth studying further.
Data availability statement
The raw data supporting the conclusions of this article will be made available by the authors, without undue reservation.
Author contributions
CZ: Formal analysis, Investigation, Methodology, Writing – original draft. NP: Formal analysis, Investigation, Methodology, Writing – review & editing. SH: Data curation, Formal analysis, Investigation, Writing – review & editing. ZL: Formal analysis, Validation, Writing – review & editing. LQ: Formal analysis, Validation, Writing – review & editing. XW: Data curation, Formal analysis, Writing – review & editing. RB: Writing – review & editing. SZ: Writing – review & editing. JY: Conceptualization, Funding acquisition, Methodology, Project administration, Supervision, Writing – review & editing.
Funding
The author(s) declare that financial support was received for the research, authorship, and/or publication of this article. This research was supported by the National Natural Science Foundation of China (32271647; 31800372), the Key Research and Development Program in Shaanxi Province of China (2023-YBSF-307), and the Chinese Universities Scientific Fund (2452023077).
Acknowledgments
We are grateful to the Qinling National Forest Ecosystem Research Station for providing some data and the experimental equipment.
Conflict of interest
The authors declare that the research was conducted in the absence of any commercial or financial relationships that could be construed as a potential conflict of interest.
Publisher’s note
All claims expressed in this article are solely those of the authors and do not necessarily represent those of their affiliated organizations, or those of the publisher, the editors and the reviewers. Any product that may be evaluated in this article, or claim that may be made by its manufacturer, is not guaranteed or endorsed by the publisher.
References
Alcamo, J., Döll, P., Henrichs, T., Kaspar, F., Lehner, B., Rösch, T., et al. (2003). Global estimates of water withdrawals and availability under current and future “business-as-usual” conditions. Hydrolog. Sci. J. 48, 339–348. doi: 10.1623/hysj.48.3.339.45278
Béjar, P. S. J., Cantú, S. I., Domínguez, G. T., Gonzále, R. H., Marmolejo, M. J. G., Yáñez, D. M. I., et al. (2018). Rainfall redistribution and nutrient input in Pinus cooperi C.E Blanco. Rev. Mexicana Ciencias Forestales 9, 94–120. doi: 10.29298/rmcf.v9i50.237
Bogdał, A., Wałęga, A., Kowalik, T., and Cupak, A. (2019). Assessment of the impact of forestry and settlement-forest use of the catchments on the parameters of surface water quality: case studies for Chechło reservoir catchment, Southern Poland. Water 11:964. doi: 10.3390/w11050964
Boulay, A., Motoshita, M., Pfister, S., Bulle, C., Muñoz, I., Franceschini, H., et al. (2014). Analysis of water use impact assessment methods (part a): evaluation of modeling choices based on a quantitative comparison of scarcity and human health indicators. Int. J. Life Cycle Assess. 20, 139–160. doi: 10.1007/s11367-014-0814-2
Chen, S., Cao, T., Tanaka, N., Gao, T., Zhu, L., and Zou, C. B. (2018). Hydrological properties of litter layers in mixed forests in Mt, Qinling, China. iForest – Biogeosci. Forestry 11, 243–250. doi: 10.3832/ifor2535-011
Chen, K. Y., Chen, H. X., Zhou, C. L., Huang, Y. C., Qi, X. Y., Shen, R. Q., et al. (2020). Comparative analysis of surface water quality prediction performance and identification of key water parameters using different machine learning models based on big data. Water Res. 171:115454. doi: 10.1016/j.watres.2019.115454
Crowley, K. F., and Lovett, G. M. (2017). Effects of nitrogen deposition on nitrate leaching from forests of the northeastern United States will change with tree species composition. Can. J. For. Res. 47, 997–1009. doi: 10.1139/CJFR-2016-0529
Dalezios, R. N., Angelakis, N. A., and Eslamian, S. S. (2018). Water scarcity management: part 1: methodological framework. Int. J. Global Environ. Issues 17, 1–40. doi: 10.1504/IJGENVI.2018.090629
Davis, M. (2014). Nitrogen leaching losses from forests in New Zealand. NZ J. Forestry Sci. 44, 1–14. doi: 10.1186/1179-5395-44-2
Delphin, S., Escobedo, F. J., Abdelrahman, A., Adams, E. A., Martin, J., and Cademus, R. (2014). Stewardship ecosystem services study series: Assessing forest water yield and purification ecosystem services in the lower Suwannee River watershed. Florida: University of Florida- IFAS, EDIS, FOR.
Ercin, A. E., Chico, D., and Chapagain, A. K. (2016). Dependencies of Europe's economy on other parts of the world in terms of water resources, horizon 2020 –IMPREXP Project, Technical Report D12.1. Enschede: Water Footprint Network.
Fujii, S., Somiya, I., Nagare, H., and Serizawa, S. (2001). Water quality characteristics of forest rivers around Lake Biwa. Water Sci. Technol. 43, 183–192. doi: 10.2166/wst.2001.0282
Gao, G. Q. (2018). The long-term variation of forest water quality and its trend in the Qinling forest region. M.S. thesis, Dept. soil and water conservation and desertification combating. Yangling: Northwest A&F University.
Grace, J. M. (2005). Forest operations and water quality in the south. T. ASABE. 48, 871–880. doi: 10.13031/2013.18295
Griffiths, C., Klemick, H., Massey, M., and Christopher, C. M. U. S. (2012). Environmental protection agency valuation of surface water quality improvements. Rev. Environ. Econ. Policy 6, 130–146. doi: 10.1073/pnas.2120252120
Hoekstra, A. Y., and Hung, P. Q. (2002). Virtual water trade: a quantification of virtual water flows between nations in relation to international crop trade. Water Sci. Technol. 49, 203–209.
Hou, B. F., and Wei, H. (2001). Estimation of dry deposition and canopy exchange in Chinese fir plantations. For. Ecol. Manag. 147, 99–107. doi: 10.1016/S0378-1127(00)00469-2
Hurk, D. V. M., Mastenbroek, E., and Meijerink, S. (2014). Water safety and spatial development: an institutional comparison between the United Kingdom and the Netherlands. Land Use Policy 36, 416–426. doi: 10.1016/j.landusepol.2013.09.017
Jaramillo, R. A. (2003). La lluvia y el transporte de nutrimentos dentro de ecosistemas de bosque y cafetales. Cenicafé 54, 134–144.
Jena, P. K., Rahaman, S. M., Das Mohapatra, P. K., Barik, D. P., and Patra, D. S. (2023). Surface water quality assessment by random Forest. Water Pract. Technol. 18, 201–214. doi: 10.2166/WPT.2022.156
Klemeš, J. J. (2012). Industrial water recycle/reuse. Curr. Opin. Chem. Eng. 1, 238–245. doi: 10.1016/j.coche.2012.03.010
Klimaszyk, P., Rzymski, P., Piotrowicz, R., and Joniak, T. (2015). Contribution of surface runoff from forested areas to the chemistry of a through-flow lake. Environ. Earth Sci. 73, 3963–3973. doi: 10.1007/s12665-014-3682-y
Li, J., Li, W., Hou, J. X., and Gao, F. (2010). Typical forests' leaching characteristics during acid rain in Guizhou. China Environ. Sci. 30, 1297–1302.
Li, B., Yang, G., Wan, R., Hörmann, G., Huang, J., Fohrer, N., et al. (2017). Combining multivariate statistical techniques and random forests model to assess and diagnose the trophic status of Poyang Lake in China. Ecol. Indic. 83, 74–83. doi: 10.1016/j.ecolind.2017.07.033
Liu, J. G., Yang, H., Gosling, S. N., Kummu, M., Flörke, M., Pfister, S., et al. (2017). Water scarcity assessments in the past, present and future. Earth's Future 5, 545–559. doi: 10.1002/2016EF000518
Lopes, A. F., Macdonald, J. L., Quinteiro, P., Arroja, L., Carvalho-Santos, C., Cunha-e-Sa, M. A., et al. (2019). Surface vs. groundwater: the effect of forest cover on the costs of drinking water. Water Resour. Econ. 28:100123. doi: 10.1016/j.wre.2018.06.002
Lu, B., Zhang, S. L., Li, K., and Ma, G. D. (2014). Distribution of soil macropores and their influence on saturated hydraulic conductivity in the Huoditang forest region of the Qinling Mountains. Acta Ecol. Sin. 34, 1512–1519. doi: 10.5846/stxb201210281493
Matías, P., and Juha, S. (2021). The value of forest water purification ecosystem services in Costa Rica. Sci. Total Environ. 789:147952. doi: 10.1016/J.SCITOTENV.2021.147952
MEEPRC. (2002). National Environmental quality standards of surface water of China, GB3838-2002. Ministry of Ecology and Environment of the People’s Republic of China. Available at: https://www.mee.gov.cn/ywgz/fgbz/bz/bzwb/shjbh/shjzlbz/200206/W020061027509896672057.pdf (Accessed November 10, 2023).
Misaghi, F., Delgosha, F., Razzaghmanesh, M., and Myers, B. R. (2017). Introducing a water quality index for assessing water for irrigation purposes: a case study of the Ghezel Ozan River. Sci. Total Environ. 589, 107–116. doi: 10.1016/j.scitotenv.2017.02.226
Mishra, S., Sharma, M. P., and Kumar, A. (2016). Ecological health assessment of Surha Lake. India. J. Mater. Environ. Sci. 7, 1708–1715.
Oulehle, F., Chuman, T., Hruška, J., Krám, P., McDowell, W. H., Myška, O., et al. (2017). Recovery from acidification alters concentrations and fluxes of solutes from Czech catchments. Biogeochemistry 132, 251–272. doi: 10.1007/s10533-017-0298-9
Pfister, S., Koehler, A., and Hellweg, S. (2009). Assessing the environmental impacts of freshwater consumption in LCA[J/OL]. Environ. Sci. Technol. 43, 4098–4104. doi: 10.1021/es802423e
Raat, K. J., Draaijers, G. P. J., Schaap, M. G., Tietema, A., and Verstraten, J. M. (2023). Spatial variability of through fall water and chemistry and forest floor water content in a Douglas fir forest stand. Hydrol. Earth Syst. Sci. 6, 363–374. doi: 10.5194/hess-6-363-2002
Shepard, J. P. (1994). Effects of forest management on surface water quality in wetland forests. Wetland 14, 18–26. doi: 10.1007/BF03160618
Tao, X. Q., Lu, G. N., Zhou, K. Q., and Liu, H. (2007). Phytodecontamination of atmosphere chemical pollution: a review. Ecol. Environ. 16, 1546–1550.
UN-Water (2018) Water scarcity. Available at: www.unwater.org/water-facts/scarcity (accessed May 6, 2019).
Vardon, M., Keith, H., and Lindenmayer, D. (2019). Accounting and valuing the ecosystem services related to water supply in the central highlands of Victoria, Australia. Ecosyst. Serv. 39:101004. doi: 10.1016/j.ecoser.2019.101004
Wei, Q. (2023). Analysis of water sources and research on nitrogen sources in typical watershed of Qinling water source area. M.S. thesis,. Xi’an: Department of Water Conservancy and Hydropower Engineering, Xi’an University of Technology.
Xiong, Y., Zhang, T., Sun, X., Yuan, W., Gao, M., Wu, J., et al. (2023). Groundwater quality assessment based on the random Forest water quality index—taking Karamay City as an example. Sustain. For. 15:14477. doi: 10.3390/SU151914477
Yan, W. (2011). Construction of Qinling ecological demonstration area. J. Agric. Sci. 39, 14278–14280.
Yan, T., Shen, S. L., and Zhou, A. (2022). Indices and models of surface water quality assessment: review and perspectives. Environ. Pollut. 308:119611. doi: 10.1016/j.envpol.2022.119611
Yang, X. C., Li, J. J., Liu, X. B., Gao, J. J., Dong, F., Huang, A. P., et al. (2023). Research on water quality assessment using the water quality index for the eastern route of the south-to-north water diversion project. Water 15:842. doi: 10.3390/W15050842
Zeng, Z., Liu, J., and Savenije, H. H. G. (2013). A simple approach to assess water scarcity integrating water quantity and quality. Ecol. Indic. 34, 441–449. doi: 10.1016/j.ecolind.2013.06.012
Zhang, S. L. (2007). Effects of forest ecosystem on runoff and water quality in mid-altitude mountains region of southern slopes, Qinling Mountains. Yangling: Northwest A&F University.
Zhang, Z. P., Duan, K. Q., Liu, H. C., Meng, Y. L., Chen, R., Li, D. W., et al. (2022). Runoff projections of the Qinling Mountains and their impact on water demand of Guanzhong region in Northwest China. J. Mt. Sci. 19, 2272–2285. doi: 10.1007/S11629-022-7358-X
Zhang, Y., and Gao, Q. Q. (2016). Water quality evaluation of Chaohu Lake based on random forest method. Chin. J. Environ. Eng. 10, 992–998.
Zhang, S., and Liang, C. (2012). Effect of a native forest canopy on rainfall chemistry in China’s Qinling Mountains. Environ. Earth Sci. 67, 1503–1513. doi: 10.1007/s12665-012-1594-2
Zhang, G., Zeng, G. M., Jiang, Y. M., Du, C. Y., Huang, G. H., Yao, J. M., et al. (2006). Seasonal dry deposition and canopy leaching of base cations in a subtropical evergreen mixed forest, China. Silva Fenn. 40:327. doi: 10.14214/sf.327
Zhao, X. J., Zhang, S. L., and Ma, G. D. (2015). Effects of thinning intensity on rain water chemistry of canopies and litters of Quercus aliena var. acuteserratain Qinling Mountain. Acta Ecol. Sin. 35, 8155–8164. doi: 10.5846/stxb201407251505
Zhou, W. W., Hu, C. L., and Rong, P. J. (2024). Research on the spatial distribution and influencing factors of rural homestay tourism in the Qinling Mountains Shaanxi section. Chin. J. Agric. Resour. Reg. Plann. 45, 235–246.
Keywords: Qinling Mountains, water quality, random forest model, surface runoff, hydrochemistry
Citation: Zhao C, Peng N, Hua S, Li Z, Qi L, Wang X, Bol R, Zhang S and Yuan J (2024) Water quality in the Chinese Qinling Mountains over the last 20 years. Front. Water. 6:1440411. doi: 10.3389/frwa.2024.1440411
Edited by:
Tatenda Dalu, University of Mpumalanga, South AfricaReviewed by:
Mandla Magoro, South African Institute for Aquatic Biodiversity, South AfricaCollins Oduro, Ningbo University, China
Copyright © 2024 Zhao, Peng, Hua, Li, Qi, Wang, Bol, Zhang and Yuan. This is an open-access article distributed under the terms of the Creative Commons Attribution License (CC BY). The use, distribution or reproduction in other forums is permitted, provided the original author(s) and the copyright owner(s) are credited and that the original publication in this journal is cited, in accordance with accepted academic practice. No use, distribution or reproduction is permitted which does not comply with these terms.
*Correspondence: Jie Yuan, eXVhbmppZUBud3N1YWYuZWR1LmNu
 Chensong Zhao
 Na Peng1
 Roland Bol
 Jie Yuan