 William P. Johnson
 Eddy Pazmiño
 Logan Frederick
 Cesar Ron
 Andrea Chica1
 Luis Tapia
- 1Department of Geology and Geophysics, University of Utah, Salt Lake City, UT, United States
- 2Department of Extractive Metallurgy, Escuela Politécnica Nacional, Quito, Ecuador
Water quality impacts from artisanal and small-scale alluvial (placer) gold mining operations occur in developing economies across several continents including Asia, Africa, and South America. They often occur in remote and/or resource-poor settings in which mitigation strategies must contend with extreme seasonal variation in river flow as well as the economic incentive to periodically churn (mine) alluvial floodplains without riparian restoration. A novel strategy addressing these constraints is herein explored which employs the alluvial floodplain for filtration-driven removal of particulate contaminants and gold from streams. This process of lateral channel filtration is explored in the Rio Nambija of southern Ecuador, in terms of success in achieving the hydraulic objective of passively driven lateral flow, and the corresponding removal of particulate contaminants (e.g., total mercury, lead, iron, and manganese) by filtration. Accumulation of gold was examined to evaluate whether incorporation of this proposed practice in alluvial (placer) mining can reduce particle-bound contaminants in streams and simultaneously increase economic benefit. Excavation of channels lateral to mining-impacted streams was shown to achieve the hydraulic, water quality, and economic (gold accumulation) objectives. The modest flow capture for any given lateral segment, along with the months-long timescale associated with economic gold accumulation and clogging by suspended solids, dictate a “cultivation” process whereby multiple lateral segments are worked annually.
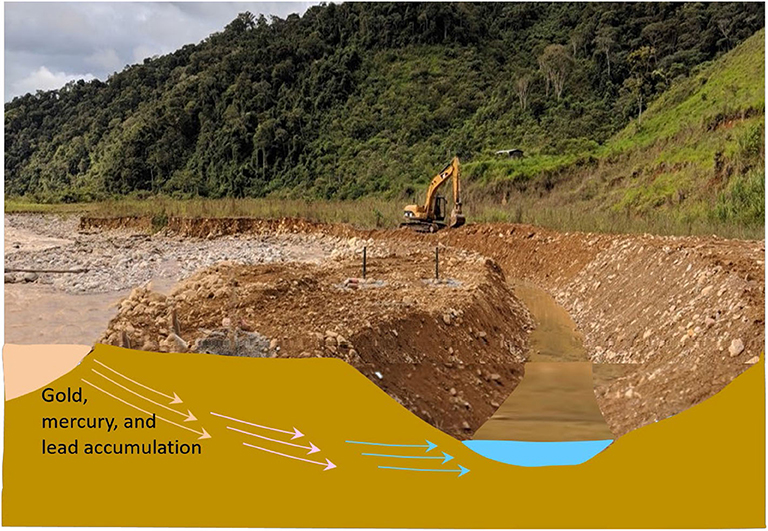
Graphical Abstract. Completed lateral channel oriented parallel to flow (away from camera). Rio Nambija forms the left boundary of the gravel bar, the lateral channel forms the right boundary.
Introduction
Artisanal or small-scale mining impacts to water quality occur in South America, Africa, and Asia in lesser-developed regions (Appleton et al., 1999; Taylor et al., 2005; Cordy et al., 2011) where regulatory frameworks and available resources do not support management of mine wastes (e.g., tailings and effluent), which are often in direct contact with streams, yielding high turbidity, and metal/metalloid concentrations (Ramírez et al., 2003; Carling et al., 2013). Alluvial (placer) mining is often performed on floodplains downstream of underground mining and processing areas to recover particle-bound precious metals not recovered by upstream activities, further exacerbating riverine turbidity and contaminant loads, and leaving behind a non-meandering channel that transmits contaminants directly downstream to receiving water bodies (Davies-Colley et al., 1992; Tarras-Wahlberg and Lane, 2003; Carling et al., 2013).
Meandering channels support many beneficial riparian processes that both remove contaminants and enhance ecological benefits (e.g., Packman and Brooks, 2001; Cardenas et al., 2004; Goeller et al., 2020). In mining-impacted streams, contaminant removal is a primary objective that is enhanced by stream meanders and streambed topography, which drive flow into the hyporheic zone, where contaminant attenuation occurs via physicochemical processes operating across the hyporheic redox transition (e.g., Fuller and Harvey, 2000; Packman and Brooks, 2001; Cardenas et al., 2004).
Options to restore in-stream contaminant removal processes in mining-impacted streams are typically constrained by their resource-poor settings, in which seasonal variations in flow are often uncontrolled (seasonal flooding), as and an economic incentive drives periodic mining of the alluvium.
We herein explore a system that attempts to couple economic and water quality benefit by altering current alluvial mining practice. The proposed practice is to excavate channels in the alluvial floodplain lateral to impacted streams. The hydraulic objective is to drive lateral streamflow through alluvium to support the water quality objective of filtration-driven deposition of particle-bound contaminants, as well as the economic objective of precious metals recovery. An advantage of lateral channel filtration is that lateral flow is forced using local natural materials, without constraining longitudinal flow during flood, and at a cost that can potentially be borne by the alluvial mining process itself. We demonstrate this concept in a pilot scale system installed on the Rio Nambija of southern Ecuador. Our driving hypothesis is that alluvial mining processes can be altered to develop a win-win improvement in capture of both particle-bound contaminants and gold.
Materials and Methods
Site Description
The Rio Nambija is located in the Zamora-Chinchipe Province of Ecuador and is impacted by the Nambija Mining District near the Ecuador-Peru border (Figure 1). The Nambija watershed upstream of the lateral channel site drains 80.8 km2. Alluvium at the site of the lateral channel on Rio Nambija is poorly sorted, ranging in size from silt to boulders. Contamination of the Rio Nambija is well-described in previous publications (Appleton et al., 2001; Ramírez et al., 2003; Carling et al., 2013).
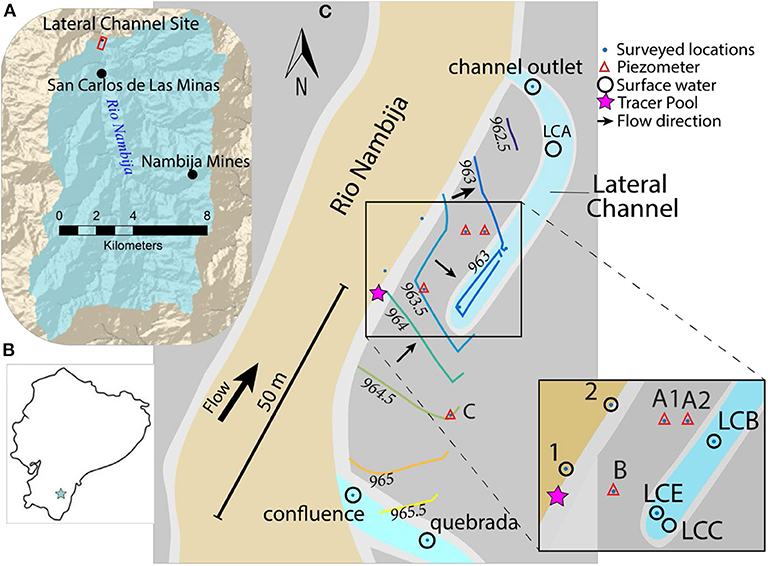
Figure 1. Rio Nambija. watershed area upstream of the lateral channel site denoted by the red rectangle in map at upper left (A). Star showing Rio Nambija location in Ecuador on map at bottom left (B). Nambija lateral channel schematic with surveyed and sampled locations and water table contours (C). Warm-colored contours represent higher hydraulic head, cool-colored contours represent lower hydraulic head. Flow direction is longitudinal (parallel to Rio Nambija) except at upstream reach of lateral channel where it is lateral. Inset of panel (C) shows rectangular area between the river, gravel bar, and lateral channel upstream of piezometers A1 and A2.
Lateral Channel Construction
Lateral channel installation on the Rio Nambija was performed during the dry season over a several-day period (July 31–August 3, 2018). A trackhoe was used to excavate a channel ~45 m in length, 3 m in width and 2 m in depth (0.5 m below channel water level) ~16 m lateral to the Rio Nambija, to force seepage through the intervening gravel bar (Figure 1).
Four polyvinyl chloride (PVC) piezometers (Environmental Service Products, Inc. Irvine, CA) were installed in the gravel bar to monitor pore water (Figure 1). Due to the very coarse nature of a large fraction of the alluvial material, as well as the prohibitive expense of drilling, piezometers were installed by trackhoe trenching with back-filling. Piezometers were arranged to create longitudinal and lateral sampling transects within the gravel bar (parallel and orthogonal to Rio Nambija flow) (Figures 1, 2). Following trench excavation, piezometers were assembled and held vertically during backfill. The bottom-most 1.5 m of each piezometer was screened (0.254 mm slot size) and floored by a threaded cap. Water depth on installation was ~0.6–1.0 m. During backfill, a gravel pack (4 cm diameter sub-angular grains) purchased from a local quarry was established around each piezometer by repeated filling and lifting of a cylindrical plastic culvert section (0.6 m diameter) (Supplementary Figure 1). Boulders that might compromise piezometer structure were removed by hand or track hoe from the area immediately surrounding the gravel pack (Supplementary Figure 2). Total piezometer length was ~4.5 m, with ~1 m extending above the gravel bar surface. Flip-top, lockable metal protectors (2 m × 0.1 m × 0.1 m, metal) were placed over each piezometer and were anchored ~0.6 meters below ground surface using concrete (Supplementary Figure 2).
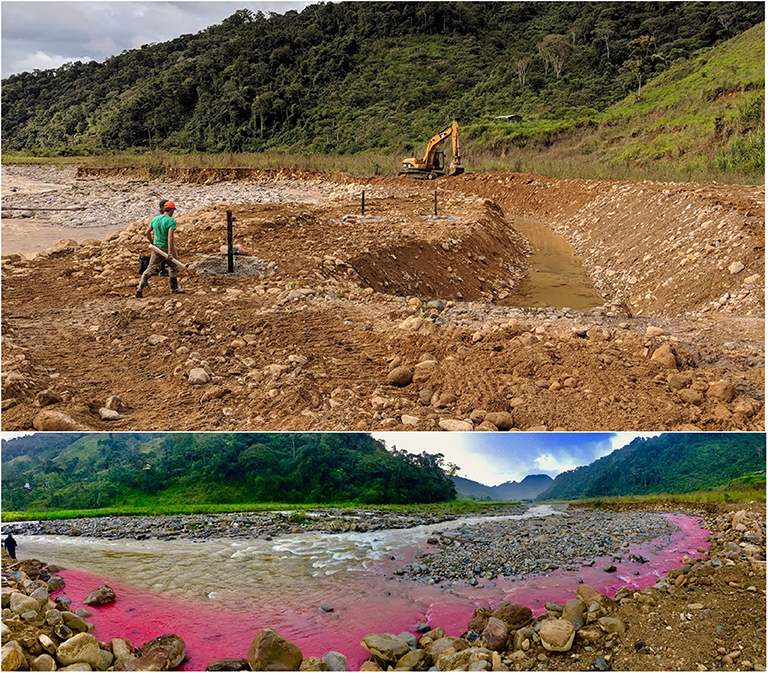
Figure 2. Top: Picture of completed lateral channel oriented parallel to flow (away from camera). Rio Nambija forms the left boundary of the gravel bar, the lateral channel forms the right boundary. Three piezometers are visible in the image, with piezometers A1 and A2 in the background, piezometer B in the foreground. Bottom: Panoramic photo of tracer plume in Rio Nambija during the tracer test. The source pool is immediately below the person shown on the left side, with river flow from left to right. Lead author shown for scale. Photo credit: Samuel Lopez.
Following construction, piezometers were developed by peristaltic pump (Geopump, GeoTech Environmental Inc., Denver, CO) using Teflon tubing inserted to the screen bottom to remove sediment-laden water. Pumping was continued until extracted water was visibly particle free, and field parameters (pH, temperature, specific conductance and dissolved oxygen DO) remained constant.
Lateral Channel Flow Characterization
Elevations of piezometers and select surface water locations were determined by surveying (Sokkia FX-101 Reflectorless Total station, Atsugi, Japan). The coordinates were generated using planar projection internally by the total station. Since the domain surveyed is small, the error is negligible if compared with spherical projection. Hydraulic heads were determined by subtraction of measured depths to water from piezometer tops (using an electronic water level indicator) or by equivalence to elevation (surface water) (Supplementary Table 1). Representation of hydraulic head contours (Figure 1) was developed using a software contour function (MATLAB, version 9.6.0 (R2019a), The MathWorks, Inc., Natick, MA).
In order to determine flow vectors and pore water velocities in the gravel bar, breakthrough of rhodamine WT dye tracer (Bright Dyes, Forestry Suppliers, Inc) was monitored at lateral channel sites LCE and LCB using the tracer pool as a source (Figure 1). The tracer pool was a small hand-constructed rock-rimmed pool (~0.3 m diameter) on the Rio Nambija flank of the gravel bar (Figures 1, 2). Rhodamine concentration was determined from a fluorescence intensity (FI) in collected water samples measured using a field fluorometer (AquaFluor®, Turner Designs MFG LLC). Calibration of rhodamine concentration to FI was described by the following equation for which the coefficient of determination, R2, was 0.917 (Supplementary Figure 3):
Samples were collected immediately following tracer addition, at 0.5–3 min frequencies (depending on proximity to source) for ~20–30 min.
Discharge was measured on the Rio Nambija and lateral channel using a mechanical Pygmy current-meter (Buchanan and Somers, 1969). Stream width orthogonal to flow was divided into twenty subsections using a marked rope strung across the full stream width. Subsection depth was determined using a top-setting rod with measurement of velocity at 0.6 height above bottom. Discharge was computed as the sum of the products of velocity and subsection areas across the stream width.
Sample Collection
Samples were collected using a peristaltic pump (Geopump, GeoTech Environmental) with Teflon tubing excepting the 30-cm section of silicon tubing within the pump rollers. Samples for mercury (Hg) and trace elements were collected in 125-mL fluorinated high-density polyethylene (FLPE) and 30-mL low density polyethylene (LDPE) bottles, respectively. Unfiltered and filtered samples (450 nm cutoff in-line cartridge filters, GeoTech Environmental, rinsed with 10% HCl) were collected from ten sites (Figure 1). Samples taken from the lateral channel (sites LCE, LCB, and LCC, LCA) were deliberately located where flow from the gravel bar visibly entered the lateral channel, excepting LCC where flow visibly entered from the mountain side of the gravel bar (Figure 1). Samples were taken in Rio Nambija adjacent to the gravel bar on two separate days (referred to individually as Nambija 1 and 2, with the average referred to as Nambija) in order to characterize contaminant concentration variability with mining/processing activity and rainfall (Figure 1).
“Clean hands, dirty hands” sampling protocol (Method 1669) (U.S. Environmental Protection Agency, 1996) was used for mercury and trace elements. Teflon pump tubing was rinsed with ~500 mL of 10% HCl between sites. Samples were preserved after collection via addition of trace metal grade (TMG) HCl to 1% for mercury samples, and via addition of TMG HNO3 to 2.4% for trace element samples. Samples were stored on ice or refrigerated until analysis for preservation.
Field Analysis
Temperature (T), electrical conductance (SC), dissolved oxygen (DO), and pH were measured at each sampling site using a multi-parameter field probe (YSI Quatro). Sulfide concentrations were measured using the methylene blue method for acid soluble sulfide (Method 376.2) (U.S. Environmental Protection Agency, 1983) (CHEMetrics Vacu-Vials and V-2000 Multi-Analyte Photometer). Alkalinity was measured via sulfuric acid titration with Bromcresol Green-Methyl Red using a field kit (Hach Inc. Loveland, CO).
Laboratory Analysis
Mercury samples were analyzed for total Hg (THg) (inorganic plus methyl) and methyl Hg (MeHg) within 1 month following collection using cold vapor atomic fluorescence spectrometer (CVAFS) (Model III Brooks-Rand, Inc.). THg and MeHg concentrations were determined by BrCl oxidation using USEPA Methods 1631E and 1630 (U.S. Environmental Protection Agency, 2002a,b), respectively. Matrix spike recoveries were analyzed for every 10 samples. Results were accepted if matrix spike recoveries were within 75–125% of the spiked amount. Recoveries ranged 83–93%. Method blanks analyzed at the beginning of each run resulted in an average blank of 0.14 ng/L THg.
Trace elements were analyzed within 1 month of sample collection using an Agilent 7500ce quadrupole inductively coupled plasma mass spectrometer (ICP-MS) with collision cell. Calibration of the ICP-MS from a separate stock yielded results within 1% of the Standard Reference Material 1643f (NIST Office of Reference Materials, Gaithersburg, MD).
Total suspended solids (TSS) was determined by passing a known volume of sample water through a pre-weighed filter that was weighed before and after drying (~130°C). The mass difference divided by the filtered volume yields TSS. Analytical results below the detection limit (DL) were set as one-half the DL for statistical analyses. Trace element mass associated with > 450 nm particles was calculated as the difference between the unfiltered and filtered concentrations. The fraction passing 450 nm was considered operationally dissolved.
Results and Discussion
Hydraulic Objective
Flow directions determined by perpendiculars to hydraulic head contours (Figure 1) show that predominant longitudinal flow (parallel to Rio Nambija) in the alluvium became lateral (perpendicular to Rio Nambija) locally at the upstream portion of the lateral channel between Piezometers B and A1/A2, demonstrating that the objective of passive lateral flow through the alluvium was achieved. The lateral hydraulic gradients (orthogonal to river flow) obtained from hydraulic head differences (~0.88 m) between River at A vs. LCA (and River at B vs. LCB) were similar and ~0.055. The longitudinal (along river) hydraulic head drop from the confluence to the channel outlet was 2.01 m, with a corresponding hydraulic gradient of ~0.024 (Figure 1 and Supplementary Table 1).
Measured flow rates in the Rio Nambija and the lateral channel outlet were 4,600 and 12.6 L/s, respectively, indicating that ~0.27% of Rio Nambija flow was captured by the single segment of lateral channel. However, the measured flow in the lateral channel carries low accuracy since all of the velocity values fell below the rating limits of the Pygmy meter, which are 0.25–3.0 ft/s (Supplementary Table 2).
During the tracer test, the tracer pool concentration decreased by two log values (to 1% of initial value) within 5 min due to advection of the majority of added tracer mass downstream in the Rio Nambija (Figure 3). Breakthrough of the tracer occurred within 4.5 and 7 min at LCE and LCB, respectively (Figure 3), yielding pore water velocities of 6.1 cm/s (LCE) and 6.2 cm/s (LCB) based on their distances from the tracer pool of 16.5 and 25 m, respectively. The pulse vs. step breakthroughs at LCE vs. LCB, respectively (Figure 3) are consistent with the fact that there are both lateral and longitudinal components of flow through the gravel bar (Figure 1). The plume component that intercepted LCE was transient (consistent with relatively rapid decrease in the pool concentration) and was peripheral to the tracer plume center of mass based on the flow directions (Figure 1). In contrast, the plume component that intercepted LCB was closer to the tracer plume center of mass. The greater dispersion associated with breakthrough at LCB relative to LCE (Figure 3) is consistent with its greater distance from the pool.
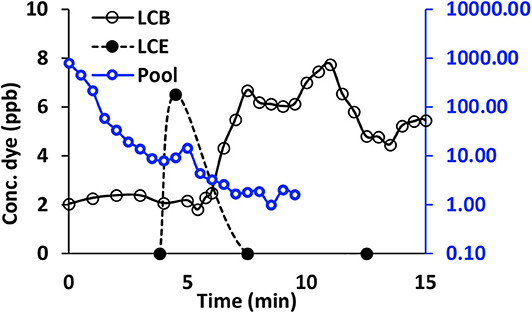
Figure 3. Tracer concentrations in the pool and at lateral channel locations LCE and LCB. A moving average across three consecutive values was used for the data at LCB because of its variability. A background from preceding tracer tests(~ 2 ppb) is apparent at LCB.
Comparison of water inflows to the gravel bar indicated by lateral channel flow vs. tracer velocity is performed assuming that inflow occurs primarily between Piezometers B and A1/A2 (Supplementary Figure 4), where flow direction was predominantly lateral along this ~12.1 m length of river. Given an assumed depth of lateral flow of 0.88 m based on the water elevation difference between Rio Nambija and the lateral channel (Supplementary Table 1), the area of inflow normal to Rio Nambija is ~10.6 m2, which coupled with the lateral tracer velocity (0.061 m/s), yields an inflow of 197 L/s. That this inflow exceeds by more than an order of magnitude than the measured (low reliability) channel flow (12.6 L/s) may reflect inaccuracy in the assumed depth of inflow as well as inaccuracy in the measured channel outflow, as described above. The results suggest, however, channel flow was higher than measured using the Pygmy meter, and that the portion of river flow captured was >0.27%.
The measured hydraulic heads and rapid tracer breakthrough times demonstrate that natural lateral inflow across the gravel bar occurred in response to excavating the upper end of the lateral channel deeper than the adjacent river in the floodplain of this high-energy stream with high-conductivity alluvium composed of materials ranging in size from boulders to sand.
Water Quality Objective
Fe, Pb, Mn, and THg in the Rio Nambija were predominantly particle-bound (> 80% in the 450 nm size fraction) (Figure 4) with particle-bound concentrations accounting for 96, 97, 80, 99% of total concentrations, respectively. MeHg concentrations were found to be negligible and below the detection limit for all samples (<0.01 ng/L). Particle-bound contaminant concentrations decreased 1–3 orders of magnitude during transport from the Rio Nambija through the gravel bar to the lateral channel (Figure 4). THg concentrations decreased from 1,311 ± 131 ng/L in the Rio Nambija to 2.3 ng/L in the lateral channel during transport through the gravel bar (Figure 4), yielding a factor of 577 reduction in THg. Other particle-bound contaminants showed dramatic reductions in particulate concentrations from the Rio Nambija to the lateral channel; e.g., Pb and Fe, although in all cases higher particle bound trace element concentrations were observed in A2 relative to up-gradient and down-gradient locations A1 and LCB (Figure 4), suggesting the possibility of preferential flow and lesser removal of particles in the flow path to A2. Consistent with the removal of particle-bound trace elements, TSS decreased by nearly a factor of 40 from the Rio Nambija (75 mg/L) through the gravel bar to the lateral channel (2 mg/L) (Figure 5). However, the higher TSS in piezometer A2 relative to A1 (Figure 5) despite A2 being located farther from Rio Nambija (Figure 1) further suggests the presence of preferential flow paths in the gravel bar, as common in hyporheic contexts (e.g., Wagner and Bretschko, 2002).
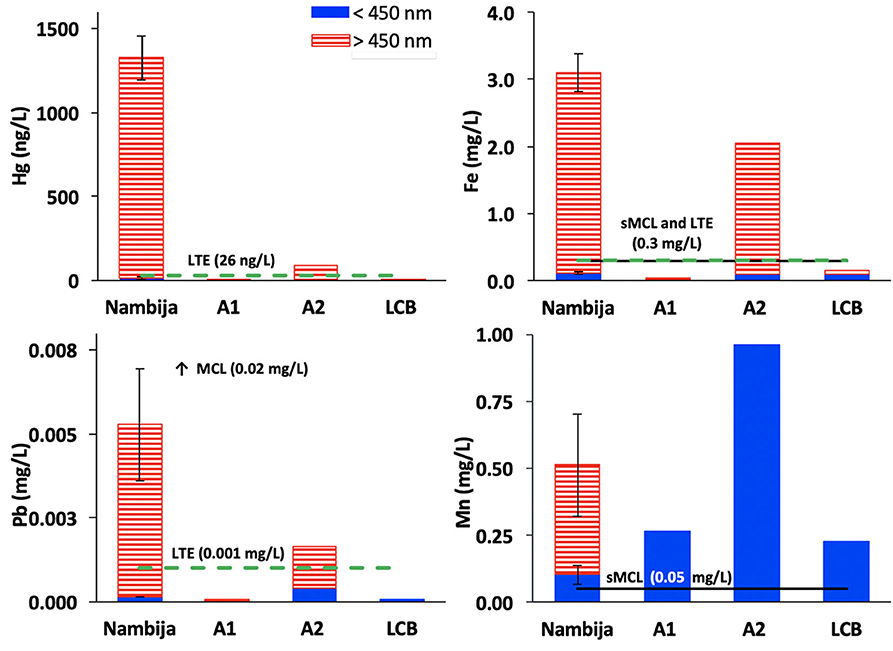
Figure 4. Select trace element concentrations in the transect from Rio Nambija to the lateral channel (LCB) through piezometers A1 and A2. Red-striped bars represents particulates > 450 nm (unfiltered minus filtered), blue-solid bars represent filtered (< 450 nm). Error bars represent range of concentrations from samples taken on separate days. Black solid lines show USEPA secondary maximum contaminant level (sMCL). Green dashed lines show the Canadian Council of Ministers of the Environment thresholds for protection of aquatic life from long-term effects (LTE).
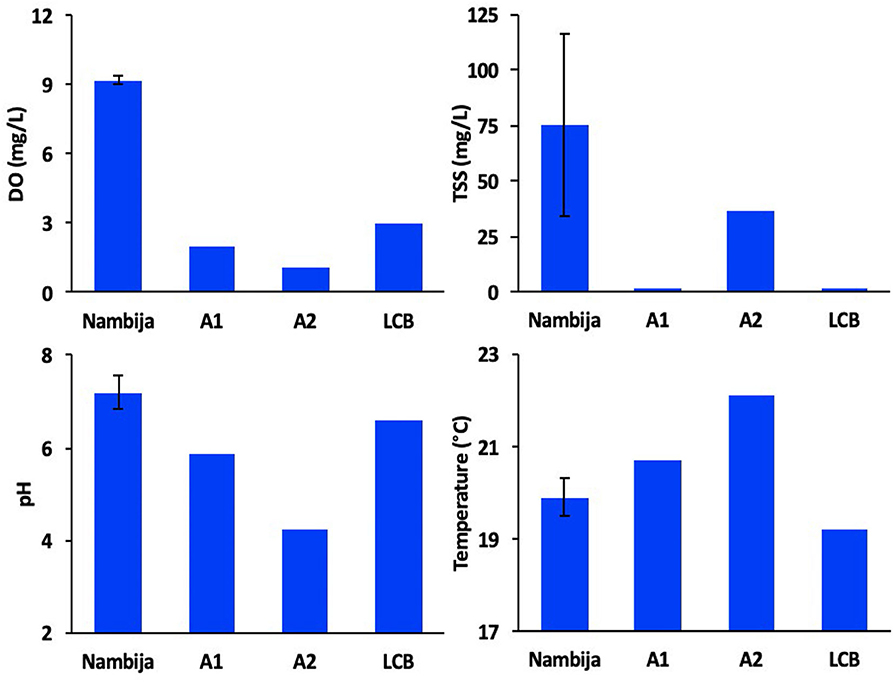
Figure 5. Field parameter values in the transect from Rio Nambija to the lateral channel (LCB) through piezometers A1 and A2. Error bars represent range of concentrations from samples taken on consecutive days.
Dissolved forms of trace elements either showed no significant decrease (e.g., Fe and Pb), or increased during transport in the gravel bar (e.g., Mn, Cd, and Zn) (Figures 4 and Supplementary Figure 5). The latter includes production of dissolved Mn, which is consistent with microbial utilization of Mn(IV) as an electron acceptor in microbial degradation of organic carbon as an electron donor. Reductive manganese oxyhydroxide dissolution may in turn explain mobilization of trace elements such as Cd and Zn (Supplementary Figure 5). Microbial respiration of organic matter is also indicated by the dramatic decrease in DO with distance from the Rio Nambija (9 mg/L) through the gravel bar (2.0 and 1.1 mg/L) to the lateral channel (3.0 mg/L) (Figure 5). The corresponding pH decrease from 7.2 in the Rio Nambija to 4.2 and 5.9 in the gravel bar may reflect the production of carbon dioxide during respiration, and its dissolution to carbonic acid. Microbial activity may also contribute to the temperature increase (19.9–22.1°C) during transport from the Rio Nambija through the gravel bar (Figure 5), although heat conduction from the gravel bar surface is an expected contributor. The somewhat greater DO and pH in the lateral channel relative to the gravel bar may reflect the influences of mixing with atmosphere in the shallow channel (~0.5 m depth). The low DO (0.72 mg/L) and pH (5.26) in piezometer C situated longitudinally upgradient of the lateral channel demonstrates that upgradient hyporheic water is similar to that in the gravel bar. That piezometer A2 showed evidence of both enhanced manganese reduction and lesser particle filtration is surprising and unexplained. The removal of particle-bound contaminants shown above, and the lack of removal of dissolved contaminants also shown above, demonstrates that the mechanism of contaminant removal in the gravel bar was filtration.
In terms of the water quality objective, Fe and Mn concentrations in Rio Nambija (3.1 and 0.51 mg/L, respectively) exceeded by factors of 10.2 and 10.3, respectively the secondary maximum contaminant level (sMCL) established by the U.S. Environmental Protection Agency (Figure 4). Likewise, THg, Pb, and Fe concentrations in Rio Nambija (1,311 ng/L, 0.005 mg/L and 2.99 mg/L, respectively), exceeded by factors of 51, 5, and 10, respectively, the Canadian Council of Ministers of the Environment (CCME) thresholds for protection of aquatic life from long-term effects (LTE). During transport from Rio Nambijha to the lateral channel, concentrations of THg, Pb, and Fe were reduced well-below the sMCL and LTE values via filtration (Figure 4). In contrast, dissolved Mn production during transport through the gravel bar increased the concentration of Mn relative to its sMCL.
Economic and Sustainability Objective
Average filtered and unfiltered gold concentrations in the Rio Nambija were 0.087 ± 0.051 μg/L and 0.057 ± 0.030 μg/L, respectively (Figure 6), indicating that about two-thirds of the water column gold concentration was dissolved or more likely in nanoparticulate form (<450 nm). The mechanism of gold removal in the gravel bar can be presumed as filtration, based on the observed contaminant removal as well as the tendency of gold to associate with particles. In contrast to the Rio Nambija, gold concentrations were below the quantitation limit (0.05 ug/L) in all piezometer and lateral channel samples (unfiltered and filtered) with the exception of unfiltered samples from piezometer A2, and site LCC (Figure 6), which were those located at visible outflow from gravel bar. Gold concentrations in the lateral channel were set to one-half the quantitation limit (0.002 μg/L) to represent the vast majority of lateral channel and piezometer samples. It should be noted that measured gold concentration in the Rio Nambija varied ~60% across the two sampled days (Table 1).
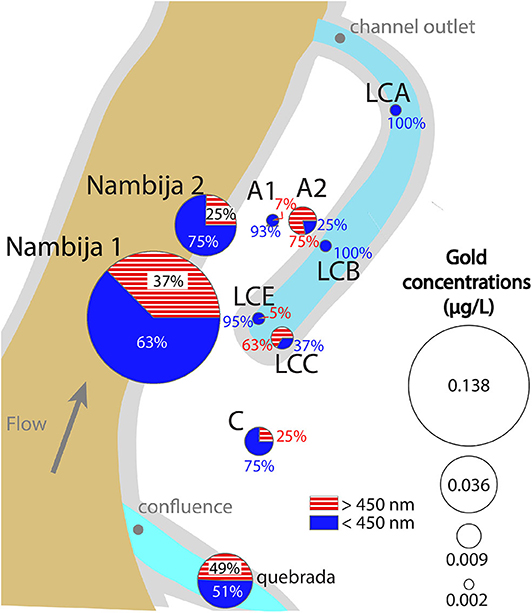
Figure 6. Gold concentrations in the Rio Nambija and lateral channel. Larger sized circles represent high concentrations. Red-striped portions of pie charts represent particles > 450 nm, while blue, solid represents < 450 nm.
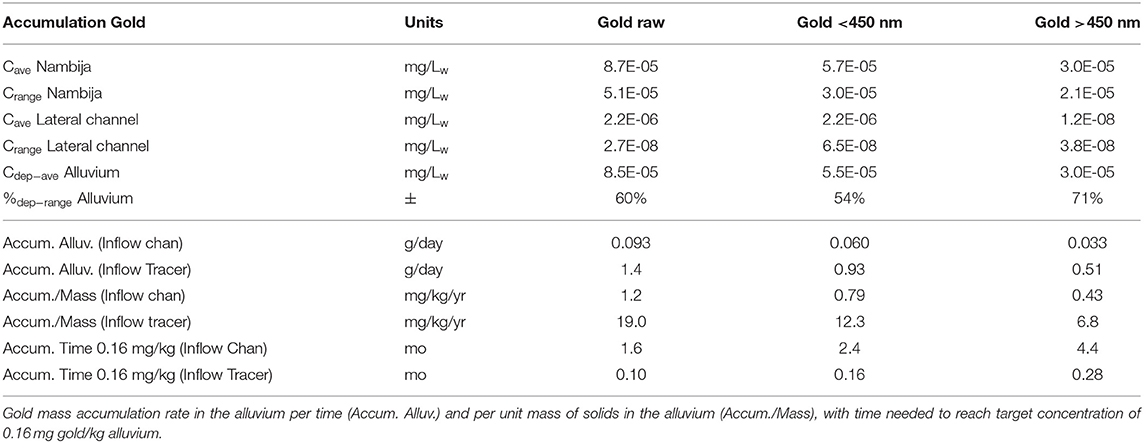
Table 1. Gold concentration averages and ranges in Rio Nambija and the lateral channel, with concentration differences (of averages) and % range relative to average difference based on measured variability in concentration in Rio Nambija.
Using the contrasting discharge values measured in the lateral channel vs. calculated from the tracer velocity (and assumed area of inflow), the calculated mass accumulation rates for > 450 nm gold range from 0.033 to 0.5 g/day, respectively (Table 1). Assuming a bulk density of 1.6 g/cm3 for the gravel, and an effective deposition depth into the gravel bar of 1 m, which reflects the exponential decrease in particle concentration with depth (e.g., Johnson et al., 2018), gold accumulation per mass of solids ranged from 0.43 to 6.8 mg/kg/yr, corresponding to the channel flow- vs. tracer velocity-determined flow rates, respectively (Table 1). The corresponding time needed to attain the target 0.16 mg kg−1 gold concentration (~ 0.25 mg gold per m3 alluvium, assuming 1.6 kg/L bulk density) ranges ~0.28–4.4 months, for the tracer-velocity flow- vs. channel flow-determined flow rates, respectively (Table 1). Since ~2/3 and 1/3 of these accumulation rates apply to <450 and > 450 nm particles, respectively (Table 1), an ability to collect <450 nm gold would increase the favorability of these values by a factor of three.
The gold accumulation rates (Table 1) indicate that there exists a significant economic incentive for implementation of lateral channel filtration even with current technology implemented to recover > 450 nm particles. The suspended particle size, ranging from several μm to several hundred μm (averaging 10–20 μm) (Supplementary Figure 6), is recoverable using current conventional technology. Notably, an ability to recover the <450 nm fraction (e.g., via centrifugal concentrators or froth flotation cells) would increase the economic incentive by a factor of three. The range reported above does not reflect the 60% variability of concentration measured on two separate days in Rio Nambija, nor does it reflect temporal variation in river flow, hydraulic head gradient, or permeability, which are also variables worthy of further investigation.
With respect to permeability loss over time, the measured TSS concentrations provides some guidance. Assuming a particle (TSS) density of 2.6 g/cm3 and a gravel porosity of 0.3, the rate of pore space clogging in the gravel bar ranges from 30 to 450% per month based on the channel flow- and tracer velocity-determined flow rates through the gravel, respectively (Table 2). These potential high rates of clogging suggest the need to regenerate the pore space on the river-side of the gravel bar over seasonal to annual time scales, rather than multiple year scales. The gold accumulation rate discussed above may also support this possibility, since the time frame for economic levels of gold accumulation range from 0.28 to 4.4 months based on the limited data. Further supporting a seasonal to annual timescale of operation is the expected loss of filtration-based removal during seasonal high flow and submergence, which will alter hydraulic gradient across the gravel bar, as well as the depth at which the hyporheic redox transition occurs (Yabusaki et al., 2017).
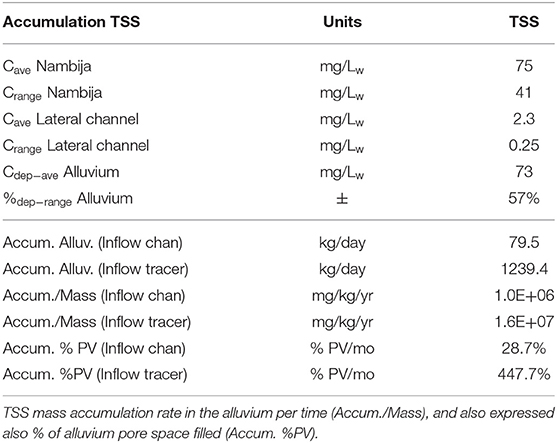
Table 2. TSS concentration averages and ranges in Rio Nambija and the lateral channel, with concentration differences (of averages) and % range relative to average difference based on measured variability in concentration in Rio Nambija.
The above considerations frame the lateral channel filtration approach as being more akin to a cultivation process, as opposed to a conventional mining process. To this end, we propose splitting contaminated river flows to develop multiple parallel streams, each with lateral channels (Figure 7) along which gold and contaminant deposition would occur primarily on the river side of the gravel bars. These zones would be worked annually across the dry season, wherein mining, processing, recovery of particulate precious metals and contaminants, and replacement of alluvium would be conducted across the system of lateral channels over the duration of a dry season. The intensity of heavy equipment operation would consequently change from the current practice of disruptive high-intensity activity recurring on decadal time scales to recovery-focused low-intensity activity recurring on seasonal to annual time scales. A pilot system is planned for implementation at Rio Nambija in summer 2021.
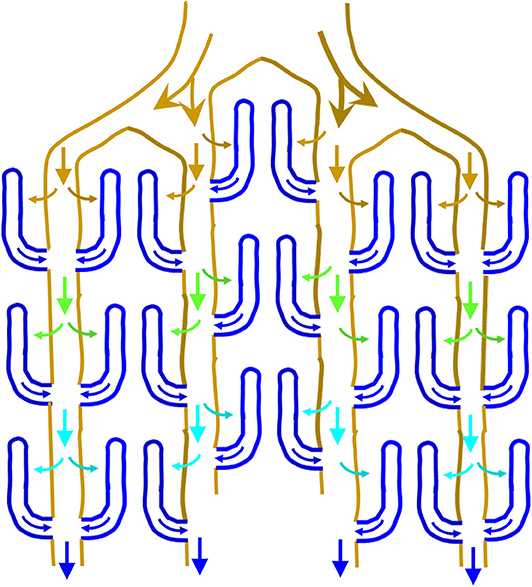
Figure 7. Schematic of lateral channel filtration gallery, associated flow directions, and qualitative impact on river water quality with respect to particulate contaminants and precious metals, as shown by flow vector colors ranging from brown (high total suspended solids) to blue (low total suspended solids).
In addition to the Rio Nambija results presented here, we have investigated the proposed process at an additional site constructed in 2017 on the Rio Congüime, Zamora Chinchipe Province, which impacted by the Chinapintza gold mining district. A natural site examined in 2016 was formed by an oxbow lake (abandoned river meander) adjacent to the Rio Gala, Guayas Province, which impacted by the San Gerardo gold mining district. Data corroborating the Rio Nambija lateral channel site presented here is provided from the Rio Congüime and Rio Gala sites in the Supporting Information.
Data Availability Statement
The datasets generated for this study can be found in online repositories. The names of the repository/repositories and accession number(s) can be found in the article/Supplementary Material.
Author Contributions
All authors contributed to the article and approved the submitted version.
Funding
This article is based upon work supported by the National Science Foundation Program under grant numbers DMREF-1629078 and HS-1547533, as broader impacts aspects of those awards. Any opinions, findings, and conclusions expressed in this material are those of the authors and do not necessarily reflect the views of the National Science Foundation.
Conflict of Interest
The authors declare that the research was conducted in the absence of any commercial or financial relationships that could be construed as a potential conflict of interest.
Acknowledgments
We also acknowledge support provided by three separate Learning Abroad classes (2014, 2017, and 2018) at the University of Utah. Travel grants and support were received from Center for Latin American Studies and Foreign Language Area Studies fellowship at the University of Utah. Construction and maintenance of the Rio Nambija lateral channel site was partially supported by the Asociación De Pequeños Mineros Autónomos De Las Cuencas Del Rio Nambija y Cambana, and the United Nations Development Programme – National Chemical Management Program- Ecuador (PNUD). The authors appreciate the very helpful comments of two reviewers.
Supplementary Material
The Supplementary Material for this article can be found online at: https://www.frontiersin.org/articles/10.3389/frwa.2020.586698/full#supplementary-material
References
Appleton, J. D., Williams, T. M., Breward, N., Apostol, A., Miguel, J., and Miranda, C. (1999). Mercury contamination associated with artisanal gold mining on the island of Mindanao, the Philippines. Sci. Total. Environ. 228, 95–109. doi: 10.1016/S0048-9697(99)00016-9
Appleton, J. D., Williams, T. M., Orbea, H., and Carrasco, M. (2001). Fluvial contamination associated with artisanal gold mining in the Ponce Enriquez, Portovelo-Zaruma and Nambija areas, Ecuador. Water Air Soil Poll. 131, 19–39. doi: 10.1023/A:1011965430757
Buchanan, T. J., and Somers, W. P. (1969). Discharge Measurements at Gaging Stations: U.S. Geological Survey Techniques of Water-Resources Investigations. Washington, DC: Government Printing Office.
Cardenas, M. B., Wilson, J. L., and Zlotnik, V. A. (2004). Impact of heterogeneity, bed forms, and stream curvature on subchannel hyporheic exchange. Water Resour. Res. 40:153. doi: 10.1029/2004WR003008
Carling, G. T., Diaz, X., Ponce, M., Perez, L., Nasimba, L., Pazmino, E., et al. (2013). Particulate and dissolved trace element concentrations in three southern Ecuador rivers impacted by artisanal gold mining. Water Air Soil Poll. 224:1415. doi: 10.1007/s11270-012-1415-y
Cordy, P., Veiga, M. M., Salih, I., Al-Saadi, S., Console, S., Garcia, O., et al. (2011). Mercury contamination from artisanal gold mining in Antioquia, Colombia: the world's highest per capita mercury pollution. Sci. Total. Environ. 410, 154–160. doi: 10.1016/j.scitotenv.2011.09.006
Davies-Colley, R. J., Hickey, C. W., Quinn, J. M., and Ryan, P. A. (1992). Effects of clay discharges on streams. Hydrobiologia 248, 215–234. doi: 10.1007/BF00006149
Fuller, C. C., and Harvey, J. W. (2000). Reactive uptake of trace metals in the hyporheic zone of a mining-contaminated stream, Pinal Creek, Arizona. Environ. Sci. Technol. 34, 1150–1155 doi: 10.1021/es990714d
Goeller, B. C., Febria, C. M., McKergow, L. A., Harding, J. S., Matheson, F. E., Tanner, C. C., et al. (2020). Combining tools from edge-of-field to in-stream to attenuate reactive nitrogen along small agricultural waterways. Water 12:383. doi: 10.3390/w12020383
Johnson, W. P., Rasmuson, A., Hilpert, M., and Pazmino, E. (2018). Why variant colloid transport behaviors emerge among identical individuals in porous media when colloid-surface repulsion exists. Environ. Sci. Technol. 52, 7230–7239. doi: 10.1021/acs.est.8b00811
Packman, A. I., and Brooks, N. H. (2001). Hyporheic exchange of solutes and colloids with moving bed forms. Wat. Resour. Res. 37, 2591–2605. doi: 10.1029/2001WR000477
Ramírez, M. E., Ramos, J. F., Angélica, R. S., and Brabo, E. S. (2003). Assessment of Hg contamination in soils and streams sediments in the mineral district of Nambija, Ecuadorian Amazon. Appl. Geochem. 18, 371–381. doi: 10.1016/S0883-2927(02)00088-4
Tarras-Wahlberg, N., and Lane, S. (2003). Suspended sediment yield and metal contamination in a river catchment affected by El Niño events and gold mining activities: the Puyango River Basin, southern Ecuador. Hydrol. Processes 17, 3101–3123. doi: 10.1002/hyp.1297
Taylor, H., Appleton, J. D., Lister, R., Smith, B., Chitamweba, D., Mkumbo, O., et al. (2005). Environmental assessment of mercury contamination from the Rwamagasa artisanal gold mining centre, Geita District, Tanzania. Sci. Total. Environ. 343, 111–133, doi: 10.1016/j.scitotenv.2004.09.042
U.S. Environmental Protection Agency, Office of Research and Development Washington DC. (1983). USEPA Method 376.2, Methods for Chemical Analysis of Water and Wastes. Available online at: https://rb.gy/w8bboj (accessed August, 10, 2019).
U.S. Environmental Protection Agency, Office of Water, Office of Science and Technology, Engineering and Analysis Division (4303), Washington, DC. (1996). USEPA Method 1669, Method for Sampling Ambient Water for Determination of Metals at U.S. EPA Ambient Criteria Levels. Available online at: https://rb.gy/6mjf3p (accessed August, 10, 2019).
U.S. Environmental Protection Agency, Office of Water, Office of Science and Technology, Engineering and Analysis Division (4303), Washington, DC. (2002a). USEPA Method 1631E, Mercury in Water by Oxidation, Purge and Trap, and Cold Vapor Atomic Fluorescence Spectrometry. Available online at: https://rb.gy/sbgeef (accessed August, 10, 2019).
U.S. Environmental Protection Agency, Office of Water, Office of Science and Technology, Engineering and Analysis Division (4303), Washington, DC. (2002b). USEPA Method 1630, Methylmercury in Water by Distillation, Aqueous Ethylation, Purge and Trap, and Cold Vapor Atomic Fluorescence Spectrometry. Available online at: https://rb.gy/sbgeef (accessed August 10, 2019).
Wagner, F. H., and Bretschko, G. (2002). Interstitial flow through preferential flow paths in the hyporheic zone of the Oberer Seebach, Austria. Aquat. Sci. 64, 307–316. doi: 10.1007/s00027-002-8075-8
Keywords: Riverbank filtration, mercury, trace metals, alluvial gold, hyporheic
Citation: Johnson WP, Pazmiño E, Frederick L, Ron C, Chica A and Tapia L (2020) Contaminant Removal and Precious Metal Recovery by Lateral Channel Filtration in Mining-Impacted Alluvial Floodplains. Front. Water 2:586698. doi: 10.3389/frwa.2020.586698
Received: 23 July 2020; Accepted: 08 September 2020;
Published: 24 November 2020.
Edited by:
Yusong Li, University of Nebraska-Lincoln, United StatesReviewed by:
Reza Soltanian, University of Cincinnati, United StatesTy Ferre, University of Arizona, United States
Copyright © 2020 Johnson, Pazmiño, Frederick, Ron, Chica and Tapia. This is an open-access article distributed under the terms of the Creative Commons Attribution License (CC BY). The use, distribution or reproduction in other forums is permitted, provided the original author(s) and the copyright owner(s) are credited and that the original publication in this journal is cited, in accordance with accepted academic practice. No use, distribution or reproduction is permitted which does not comply with these terms.
*Correspondence: William P. Johnson, d2lsbGlhbS5qb2huc29uQHV0YWguZWR1