 Olivier Rosanne
 Danielle Benesch
 Gregory Kratzig
 Simon Paré
 Nicole Bolt
 Tiago H. Falk
- 1Institut National de la Recherche Scientifique, University of Québec, Montreal, QC, Canada
- 2Thales Research and Technology Canada, Québec City, QC, Canada
- 3Department of Psychology, University of Regina, Regina, SK, Canada
- 4Public Safety Canada, Ottawa, ON, Canada
- 5Department of Psychology and Health Studies, University of Saskatchewan, Saskatoon, SK, Canada
Virtual Reality (VR) has expanded beyond the entertainment field and has become a valuable tool across different verticals, including healthcare, education, and professional training, just to name a few. Despite these advancements, widespread usage of VR systems is still limited, mostly due to motion sickness symptoms, such as dizziness, nausea, and headaches, which are collectively termed “cybersickness”. In this paper, we explore the use of electroencephalography (EEG) as a tool for real-time characterization of cybersickness. In particular, we aim to answer three research questions: (1) what neural patterns are indicative of cybersickness levels, (2) do EEG amplitude modulation features convey more important and explainable patterns, and (3) what role does EEG pre-processing play in overall cybersickness characterization. Experimental results show that minimal pre-processing retains artifacts that may be useful for cybersickness detection (e.g., head and eye movements), while more advanced methods enable the extraction of more interpretable neural patterns that may help the research community gain additional insights on the neural underpinnings of cybersickness. Our experiments show that the proposed amplitude modulation features comprise roughly 60% of the top-selected features for EEG-based cybersickness detection.
1 Introduction
Virtual Reality (VR) has experienced significant growth in recent years due to advances in hardware technology and its increasing availability to the general public. Today, it is a widely adopted solution in various fields beyond entertainment, including medicine, therapy, and professional training, just to name a few (Angelov et al., 2020; Stecuła, 2022; Cassani et al., 2020a). One of the reasons for its success is its ability to create highly realistic and modular environments at fairly low costs. This can provide exposure therapy for patients with, e.g., obsessive-compulsive disorder and post-traumatic stress disorder (Cullen et al., 2021; Maples-Keller et al., 2017) or allow for cost-effective training in various sectors, such as aerospace or remote surgery (e.g. (Rojas-Sánchez et al., 2023; Barteit et al., 2021; Dymora et al., 2021; Fracaro et al., 2021)). Moreover, for training of law enforcement officers, VR is crucial to allow them to practice decision-making, communication, and tactical skills in computer-generated scenarios that closely resemble real-world situations. This overcomes logistical constraints and allows for training of cadets in safety-critical situations that would not otherwise be possible in the real-world (Koutitas et al., 2021; Muñoz et al., 2020; Mills et al., 2020).
However, the widespread adoption of VR has been hindered by a factor termed ‘cybersickness’, which is akin to motion sickness experienced by many in boats and moving cars. Cybersickness is characterized by symptoms such as dizziness, nausea, headaches, disorientation, vertigo, visual disturbances, and increased salivation. It can vary significantly among individuals and can be influenced by numerous factors, including age, gender (Gamito et al., 2008), prior VR exposure, characteristics of the VR system and the displayed content (e.g., resolution, field of view, motion dynamics, frame rate), as well as behavioural factors such head movements or standing versus sitting (Moss and Muth, 2011). The root causes of cybersickness and its variability across the general population are still unknown. The sensory conflict theory posits that cybersickness primarily arises from discrepancies between visual inputs and vestibular sensory feedback (Celikcan, 2019). Many studies have been interpreted in relation to the sensory conflict theory to explain the relationship between VR system specifications, content design, and cybersickness symptoms (Sawada et al., 2020; Kim et al., 2020; Irmak et al., 2023). However, these findings are often compatible with other etiological theories, and the results are not exclusive to sensory conflict explanations (Stanney et al., 2020). While the sensory conflict theory provides a framework for understanding cybersickness, it did not directly influence the design of this study, which instead focused on identifying neural markers associated with symptom intensity.
The traditional method of assessing cybersickness involves subjective questionnaires, such as the Simulator Sickness Questionnaire (SSQ) and the Fast Motion Sickness (FMS) (Keshavarz and Hecht, 2011). Notwithstanding, while subjective tests are valuable for quantifying the multidimensional impact of cybersickness, disrupting users to continuously report on their symptoms can negatively impact the immersiveness of the application. In recent years, there has been a push for more objective measures based on processing of different biosignals and user behaviours. These methods offer a more objective measure of the user’s physiological state, enhancing our understanding and ability to quantify and compare the effectiveness of different VR systems and content designs to mitigate cybersickness.
VR hardware today is equipped with numerous sensors that may be useful to characterize cybersickness. For example, several commercial head-mounted displays (HMDs) are equipped with IMUs (inertial measurement units) that can help track head movements, eye trackers to monitor gaze changes, and photoplethysmography (PPG) sensors to measure heart rate and heart rate variability. These sensors could be useful in monitoring discrepancies in perceived motion and orientation in space (Lopes et al., 2020), as well as in physiological changes such as heart rate (Kim et al., 2022), postural instability (Risi and Palmisano, 2019), and visual fatigue (Souchet et al., 2023), among others. These measures have been shown useful in predicting cybersickness severity (Arcioni et al., 2019; Islam et al., 2021; Shimada et al., 2023a; Reyero Lobo and Perez, 2022; Kim, 2024; Setiowati et al., 2020; Wang et al., 2022).
Moreover, there is a recent trend to add additional (bio)sensors to VR headsets. For example, the Galea and Kaptics headsets have proposed the inclusion of sensors such galvanic skin response (GSR), skin temperature, and electroencephalography (EEG) (Bernal et al., 2022; Cassani et al., 2020b). GSR can be useful in detecting sweat, a cybersickness symptom (Dennison et al., 2016; Islam et al., 2020; Guna et al., 2020), but also changes in mental states such as stress (Garrido et al., 2022) and cognitive load (Sepich et al., 2022), which could be due to cybersickness or other external factors (Katsigiannis et al., 2018; Wu and Lin, 2011). EEG, in turn, provides a real-time glimpse of neural changes linked to cybersickness (Krokos and Varshney, 2022; Yang et al., 2022a), potentially guiding new interventions to mitigate symptoms [e.g. (Benelli et al., 2023)]. Very recently, several works have suggested that to more accurately predict cybersickness, multiple signal modalities need to be explored concurrently, in particular EEG, electrocardiography (ECG), eye movements, and head movements (Islam et al., 2022; Jeong et al., 2023; Qu et al., 2022; Hwang et al., 2022; Moinnereau and Falk, 2024). Electrogastrography (EGG) has also shown to be useful in characterizing cybersickness, but requires electrodes to be placed around the participant’s abdomen area, which could disrupt the user’s immersive experience (Stern, 2002; Yin and Chen, 2013; Jakus et al., 2022).
Characterizing cybersickness using biosignals has some disadvantages. For example, signals are often contaminated with artifacts. While automated pre-processing algorithms exist [e.g. (Yildirim, 2020; Delorme, 2023)], it is not clear what impact they may have on signal patterns and, ultimately, on downstream cybersickness characterization tasks. As an example, automated pre-processing of EEG signals has shown to affect different diagnostic tasks, such as Alzheimer’s disease diagnosis (Cassani et al., 2014). Moreover, when it comes to electrical biosignals, physiological processes often serve as contaminants. With EEG, for example, signals may be contaminated by heart beats, as well as by eye and/or head movements. In this case, removal of eye/head movement artifacts may indeed be removing information that could help characterize cybersickness.
Lastly, the latest trend in biosignal processing has involved the use of deep learning for both feature extraction and classification (Yildirim, 2020; Liao et al., 2020; Liu et al., 2024). In these scenarios, there is little interpretability and explainability (Jeong et al., 2019; Fan et al., 2021). As such, while prediction/detection of cybersickness is possible with high accuracy, few insights on what occurs in the brain/body during cybersickness are available, thus limiting the development of tactics to reduce symptoms. Moreover, existing datasets are relatively small and with a small number of subjects, which can likely lead to overfitting by highly-complex models (Yildirim, 2020; Tsimenidis, 2020), as well as to limited generalization capability (Roy et al., 2019).
In this paper, we aim to take a different approach to cybersickness detection. First, we explore the impact of different levels of artifact removal–from very basic techniques where head/body artifacts are kept, to more advanced pipelines leaving only neural signatures for evaluation–on cybersickness characterization. While the former effectively transforms the EEG into an embedded multimodal system, thus potentially improving detection accuracy, the latter can uncover the specific neurological patterns associated with cybersickness, thus leading to potential interventions to mitigate symptoms. Second, we extend our analysis beyond EEG conventional Power Spectral Density (PSD) features and propose the use of EEG Amplitude Modulation (AM) and connectivity features for detection of cybersickness symptoms, offering a complementary perspective on the neural interactions underlying cybersickness symptoms. AM analysis has shown to be useful for mental and cognitive state characterization (Albuquerque et al., 2020; Clerico et al., 2015; Clerico et al., 2018), as well as for health diagnostics (Fraga et al., 2013; Trambaiolli et al., 2011). To the best of our knowledge, this is the first time that AM features are being explored for cybersickness measurement.
AM is a second-order spectral analysis which aims to capture the temporal variations of amplitudes in cortical oscillations. It consists in constructing a frequency representation from the envelope of these oscillations. This hidden structure in EEG signals reflects the interaction between several fundamental mechanisms that occur naturally in the brain (Bondar’ and Fedotchev, 2000; Hidalgo et al., 2022; Hilla et al., 2020), and therefore may provide greater insights for cybersickness characterization.
Three different ablation studies are conducted to investigate the impact of the Automatic Artifact Removal (AAR) algorithm used, epoch size, and number of features. These ablation studies are used to find the optimal combination of such factors, which are then used to find the best cybersickness prediction model to be tested on an unseen test set. The goal of the first ablation study is to evaluate the efficacy of each AAR algorithm at removing head and eye movements. In the second ablation study, we investigate the predictive power of different combinations of AAR algorithms, feature types, and epoch sizes. Lastly, in the third ablation study, we explore the optimal number of features for cybersickness prediction.
The remainder of this paper is as follows: Section 2 will describe the methods and materials used in the study, while Section 3 presents the obtained results. Section 4 will discuss the implications of our findings and, finally, Section 5 will conclude the paper and suggest directions for future research.
2 Materials and methods
2.1 Dataset
For this study, we relied on a cybersickness dataset described in Li et al. (2021), which followed an experimental protocol specifically designed to induce cybersickness. Data was collected from 20 participants who were immersed in two VR scenarios: a tunnel travel simulation and a roller coaster ride. The ‘Tunnel’ session emphasized strong linear vection with minimal rotational motion to induce mild to moderate cybersickness. Participants who did not reach a cybersickness threshold of 11/20 on the Fast Motion Sickness (FMS) scale after 10 repetitions (approximately 10 min) proceeded to the ‘Roller Coaster’ session. This session included similar linear vection but added stronger rotational motion to intensify symptoms, ensuring that all participants reached sufficient cybersickness levels to enable subsequent analyses. The rationale behind these tasks was to account for individual differences in susceptibility while ensuring sensory conflict through visual motion without movements.
Each session lasted up to 10 min, with the duration tailored to individual participant responses, as indicated by their cybersickness levels. Cybersickness severity was systematically measured using the 20-point FMS questionnaire, administered at the end of each minute, for as long as the participants could manage their symptoms until reaching an FMS score of 11. Some participants did not experience cybersickness and reported FMS values not exceeding 4 (out of 20). Specifically, subjects 1, 3, 10 and 15 in the Tunnel session and subjects 1, 3, 10 and 16 in the Roller coaster session. In addition, data from 10 subjects in the Roller Coaster session was not available since these subjects did not continue to the second part of the experiment due to severe discomfort after the first video. In the roller coaster session only the data from subjects 7, 8, 11, 13, 15 and 20 were included in the analysis.
The study recorded multi-channel EEG, 1-channel Electrooculography (EOG), and head movements via a 3-axis accelerometer. The seven EEG channel locations used in this study included Fz, Pz, P3, P4, Cz, CP5, and CP6, recording with a sampling rate of 500 Hz. The EOG channel, located on the left lower eyelid, was used to monitor eye movements and eye blinks. Both the ground and reference electrodes were connected together and attached to the right earlobe using an ear clip. The interested reader is referred to Li et al. (2021) for complete details about the data collection process and the dataset used.
2.2 Pre-processing
Pre-processing is crucial in EEG research to remove unwanted physiological (e.g., heart beats, muscle/eye/head movements) and environmental (e.g., powerline, temperature, humidity) interferences (Tanner et al., 2016; Bigdely-Shamlo et al., 2020). With such pre-processing algorithms, a trade-off must always be achieved between the aggressiveness of the artifact removal step and the potential (unwanted) removal of useful discriminatory information from the collected signals (Delorme, 2023; Robbins et al., 2020). For example, AAR algorithms based on Independent Component Analysis (ICA) are susceptible to causing phase distortion (Thatcher et al., 2020) and/or loss of useful information (Sadiya et al., 2021; Klug and Gramann, 2021). Similarly, rejecting channels and segments of the signal contaminated by artifacts introduces information loss and discontinuities (Sadiya et al., 2021; Huberty et al., 2024).
With cybersickness prediction, however, artifact removal may play a crucial role, as the information that is often removed, such as head movements, eye movements, and heart beats, may indeed help in the prediction process. As such, here we explore three different levels of AAR, from light to aggressive, to gauge the effect this has on cybersickness characterization, as well as on the insights generated by the top features later used for the prediction task. This, in fact, has been recently emphasized in Delorme (2023) where a reduction in the amount of pre-processing was suggested to prevent the loss of relevant neural information of event related potentials. In addition, authors in Thatcher et al. (2020) demonstrate that AAR based on ICA result in phase distortion that could compromise connectivity analysis. The three different pre-processing techniques explored herein are detailed next.
2.2.1 Minimal pre-processing
Inspired by the work in Delorme (2023), an extremely simple pre-processing pipeline–called ‘Minimal’ – was tested to minimize potential distortion of the EEG signals at the cost of limited noise reduction. The ‘Minimal’ pre-processing strategy comprised exclusively of a high-pass filtering using a zero-phase Butterworth filter set to a cutoff frequency of 0.25 Hz used to eliminate low-frequency drift. This method should preserve artifacts related to eye, muscle, and head movements, as well as powerline interference. Previous studies [e.g. (Zao et al., 2016; Chang et al., 2021; Jin et al., 2018)] have demonstrated the utility of EOG and head movement data in cybersickness detection, motivating our exploration of whether these signals could be indirectly captured and utilized from EEG alone.
2.2.2 Artifact subspace reconstruction pre-processing
In this second approach, the widely-used artifact Subspace Reconstruction (ASR) algorithm (Mullen et al., 2013) followed by an independent component rejection step using the ICLabel algorithm (Pion-Tonachini et al., 2019) was used. This configuration is known to remove many common EEG artifacts and to minimally interfere with relevant EEG information (Delorme, 2023). It is important to note that, while the efficiency of ICA may be reduced when applied to datasets with a small number of channels, empirical evidence suggests that ICA-based pre-processing has performed satisfactorily despite these limitations (Rejer and Górski, 2015). Following ASR pre-processing, any removed channels were replaced using default EEGLAB spherical interpolation (Delorme and Makeig, 2004), ensuring a consistent dataset for subsequent analyses.
2.2.3 Data-driven pre-processing
Automatic artifact detection algorithms, such as ASR, utilize threshold-based techniques or depend upon predefined templates and assumptions about the nature of EEG noise. In contrast to these conventional approaches, data-driven pre-processing pipelines make use of experiment-specific artifact data from both EOG and head movement measurements thereby offering more precise noise reduction of specific types of distortion.
Regression ICA (RegICA) is one such method which combines blind source separation and regression to more accurately remove, e.g., ocular artifacts (Klados et al., 2011). Here, RegICA is used to dynamically attenuate EEG frequency components that originate from non-neuronal sources, such as ocular and head movements. Reference signals (i.e., EOG and head accelerometry) are used to characterize components of the EEG signal that have high correlations (here, characterized as a correlation greater than 0.25) with the non-neuronal signal.
Since EEG signals and reference signals have very different magnitudes, the data was scaled by subtracting the median of each channel and dividing by the median absolute deviation to avoid numerical instability. Subsequently, RegICA is applied twice: initially using the head accelerometer signals as references, and then using EOG signals. Here, the following hyperparameters are used: a filter order of 3, sigma of 0.01, a forgetting factor of 0.999 and stable root mean square error as the optimization criterion. Using both EOG and accelerometer signals as reference with RegICA should remove eye and head movements in a data-driven manner.
2.3 Feature extraction
2.3.1 Power spectral density and coupling
Traditional methods have relied on conventional power spectral density measures computed for different EEG frequency bands, namely,: delta (1–4 Hz), theta (4–8 Hz), alpha (8–12 Hz), beta (12–30 Hz), and gamma (30–50 Hz) bands (Li et al., 2022; Ozkan et al., 2023). Here, band decomposition was achieved using a filter bank (FB) of zero-phase Finite impulse response (FIR) filter, which applied two successive filtering steps in opposite directions on a mirror-padded version of the input signal, thereby producing Band-filtered time series (BFT). Band-filtered time series were then epoched with window sizes corresponding to 2, 5, 8, 20 and 30 s and shifts of 2 s.
Power values were computed per sub-band by squaring the samples and then normalizing by the total EEG power. Three statistical functionals are then used to aggregate the per-epoch features: mean, standard deviation, and skewness. This approach resulted in 105 PSD candidate features per epoch duration (5 bands
Moreover, to measure the coupling between brain regions (i.e., between different electrodes) and between EEG frequency bands, a coupling measure is computed using either the Pearson correlation or mutual information to measure linear and non-linear properties, respectively, between different electrode pairs or frequency bands (Clerico et al., 2018; Akhand et al., 2024; Afshani et al., 2019; Lu et al., 2011). Here, Inter-channel coupling (CCPL) accounts for 630 candidate features (2 coupling types
2.3.2 Amplitude modulation features and coupling
To derive the AM time series, we first extract the temporal envelope of each of the five BFT employed for the extraction of PSD features. This initial step is represented in the top left block of Figure 1A, which shows how the raw signal is filtered by the filter bank. The ‘envelope extraction’ block consists of computing the analytical representation of the signal by applying a Hilbert transform. In this process, the Hilbert transform is implemented using a Kaiser-windowed sinc FIR filter. The envelope is then extracted from the norm of the analytical representation. Finally, we further decompose the envelopes using the same five bands, represented in Figure 1A by five BFT blocks, resulting in a total of 25 AM time series. The matrix at the bottom of Figure 1A depicts the AM time series resulting from this process.
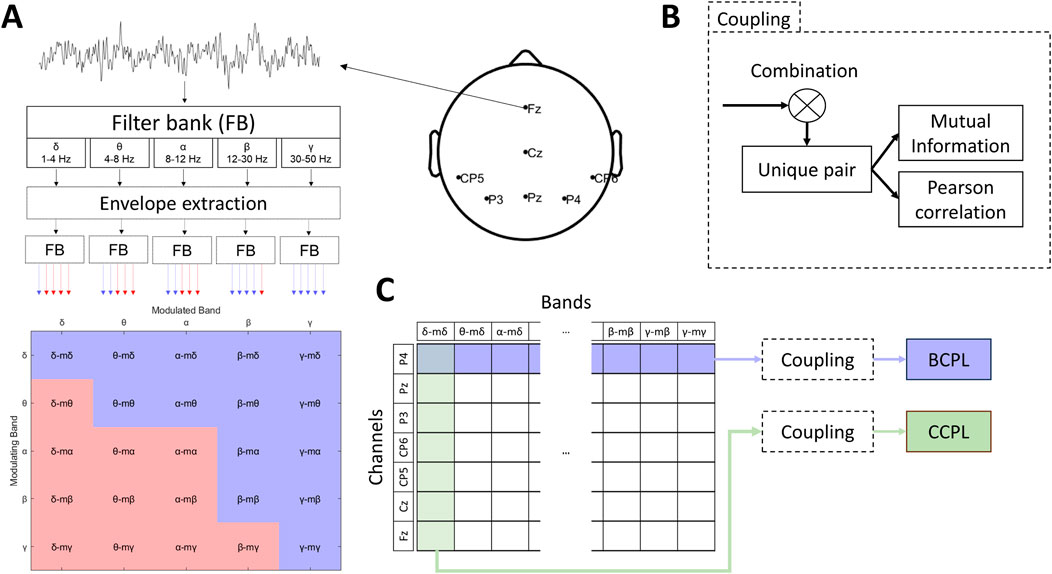
Figure 1. (A) Data flow diagram presenting each step of the AM time series extraction process. Blue arrows and cells correspond to meaningful AM band while bands marked as red are discarded. (B) Abstract data flow showing the general extraction process of coupling measurements from a set of time series. The combination operation generates all unique pairs of channels or bands. Unique pairs refer to the unique occurrence of joint elements regardless of their order. For example, both pairs (P3, P4) and (P4, P3) refer to the same coupling measure, therefore to prevent redundancy in the coupling analysis only one occurrence is kept. (C) Schematic representing how time series are selected for the computation of either AM-CCPL or AM-BCPL.
However, according to Bedrosian’s theorem (Trajin et al., 2008), only 14 of these 25 series are considered valid due to the inappropriate modulation of low-frequency bands by high-frequency bands resulting in signals that are not physically meaningful. The valid AM bands are represented in blue in Figure 1A. The interested reader is referred to Fraga et al. (2013); Cassani and Falk (2018) for a more comprehensive exploration of the features derived from AM.
For these new AM features, the epoch duration is a critical parameter, as it directly influences the latency in feature extraction and resolution. Furthermore, identifying the optimal epoch duration is essential for gaining insights into the temporal dynamics at which cybersickness-related neuronal patterns become discernible. In the literature, epoch durations when using AM features have ranged from 5, 8, to 20 s (Fraga et al., 2013; Cassani and Falk, 2019; Trambaiolli et al., 2020) to effectively capture neuronal patterns needed for diagnostics.
As this is the first attempt at using these features for cybersickness detection, we leave epoch size as a hyper-parameter to be optimized in the experiments. To capture potential transient micro-state changes (Nam et al., 2022; Chang et al., 2023; Aubonnet et al., 2023), shorter windows are also explored. For completeness, we explore epoch sizes of 2, 5, 8, 20, and 30 s. The power in each of the 14
Moreover, as with spectral coupling measures, coupling between different AM times series was shown in Clerico et al. (2018) to better characterize different mental states. As such, AM-CCPL is used to capture interactions between every possible pair of channels, while AM-BCPL to measure coupling across all possible cross-band combinations. Figures 1B, C depict the processing steps to compute the coupling parameters for the two different scenarios, respectively. Figure 1C depicts the process of selecting channels or bands (indicated by green and blue colors, respectively) and combining them to compute AM-CCPL and AM-BCPL features. The green color represents selected channels that are paired to compute spatial interactions (AM-CCPL), while the blue color represents selected bands that are paired to compute spectral interactions (AM-BCPL). The pairing itself is handled by the process illustrated in Figure 1B. In both cases, the notation used for AM-CCPL and AM-BCPL AM_{feature subtype}_{statistic} c =
2.4 Testing setup
Figure 2 illustrates the general testing methodology employed in this experiment. With the dataset used, cybersickness FMS ratings were provided every minute.
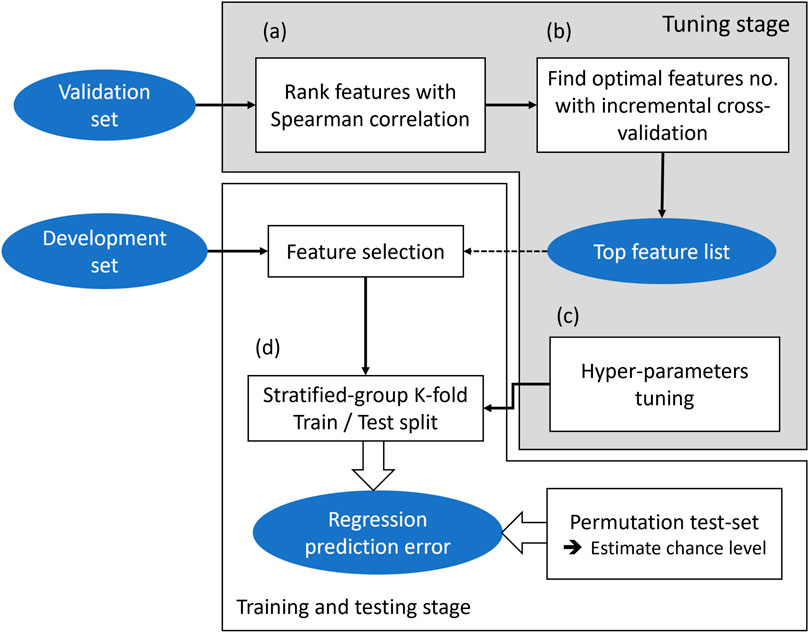
Figure 2. Flowchart presenting the testing methodology which is divided into two main stages: Tuning stage (top light grey area) relies on the validation set (33% of the original dataset). Training and testing stage (bottom white area) relies on the development set (67% of the original dataset). (A) Features are ranked using their correlation with the FMS score. (B) Incremental cross-validation determines the optimal number of features, ensuring only the top features are retained in the development set. (C) The validation set is used to find the best hyperparameters for SVR. Once the tuning stage is completed, the optimal features and hyperparameters are used to train and validate the model (D).
FMS scores were recorded by participants at the end of each 1-min interval, while the EEG data used in regression analysis were taken from the same 1-min segment. This means that EEG trials could correspond to any moment within the interval-potentially near the beginning or end of the minute-relative to the reported FMS score. This approach may introduce a small temporal mismatch between the EEG features and the moment the FMS score reflects. As such, in this study we are measuring the cybersickness level (given by the FMS score) on a per-minute basis. Future studies could take this further and use the EEG trials to predict cybersickness levels many minutes ahead.
To augment the amount of data available for training of the classifiers, a bootstrapping method was applied where a random selection of epochs within a certain 1-min EEG segment under the same FMS rating were used. The statistical functionals, such as mean, standard deviation, and skewness were then computed from the resulting subset. This process can be repeated multiple times where after each iteration a distinct set is created. The number of epochs taken per 1-min segment and the number of times this bootstrap sampling was done was empirically set to 75% of total epoch number within the minute and 10 repetitions, respectively.
The data augmentation process produced a total of 712 samples from the collected data, as compared to the 7,035 features extracted for analysis. Feature selection methods were implemented to mitigate the high sample-to-feature ratio, ensuring a more robust and interpretable regression model. The tuning stage involved the use of a validation set to estimate the best subset of features, as depicted in Figures 2A, B.
To avoid data leakage between training and test samples, a Stratified-group K-fold methodology was used to restrict groups of samples from the same minute segment to a unique data subset (i.e., train or test). This step corresponds to item (d) in Figure 2. Train and test set were generated from the development set which correspond to a portion of 67% of samples reserved exclusively for training and testing. Hyperparameters of the support vector regression model were optimized using the validation set, as represented by Figure 2C, during the tuning stage.
2.5 Post-processing
After extracting features from each EEG recording session, outlier detection was conducted independently on each feature using a threshold of three times the median absolute deviation. Detected outliers, along with near infinite, near zero, and missing samples (Not-A-Number), were corrected via linear interpolation of time contiguous samples. Lastly, FMS ratings were normalized to a scale ranging from 0 to 1 to facilitate the use of the root-mean-square error (RMSE) as a figure-of-merit to gauge system accuracy.
2.6 Feature ranking and selection
Given that the used dataset has a low sample-to-feature ratio, feature selection is needed to reduce the number of features to a manageable number to prevent overfitting. Additionally, to mitigate the risk of data leakage, features selection is performed on a validation subset (set as 33% samples of the dataset) of the data using the “StratifiedGroupKFold” module within scikit-learn (Pedregosa et al., 2011) prior to the train/test split procedure. This approach ensures that the validation samples come from different time instances than those reserved for testing, keeping the test set completely unseen.
Here, a simple feature ranking method was utilized based on Spearman correlation. For each feature, the correlation was calculated between samples and their corresponding FMS rating. This process is represented by step (a) in Figure 2. The correlation score attributed to each feature is used in ablation study II presented in Section 3.2.
The rank ordering was based firstly by statistical significance (Holm-Bonferroni corrected with significance set at a threshold of 0.05), followed by absolute Spearman correlation coefficient values. After this ranking, the top 100 features were selected (empirically) for further analysis. To gauge the impact of including additional features on cybersickness measurement, top-features were added one by one and regression performance on the validation set was assessed via stratified 5-fold cross-validation. This step corresponds to item (b) of the Tuning stage presented in Figure 2; this step further described in the ablation study III in Section 3.3. The final number of features to be used is the one that leads to the smallest RMSE value obtained on the validation set after Gaussian smoothing.
2.7 Regression analysis
A Support Vector Regressor (SVR) was selected as the regression algorithm, motivated by its robustness to overfitting, a characteristic particularly advantageous for high dimensional datasets. Hyper-parameter optimization for the SVR model was carried out through an exhaustive 3-fold cross-validation grid search, exploring combinations of 3 × 4 × 20x20 for kernel types (‘poly’, ‘rbf’, and ‘sigmoid’), polynomial degrees (2 through 5), and the parameters C and gamma. The search covered logarithmic scales from
3 Results
The following sub-sections presents the results of a series of ablation studies aimed at examining the impact of different EEG pre-processing methods, feature types, and epoch sizes on cybersickness prediction. Ablation studies are analytical approaches used to investigate the contribution of specific components or processing steps to the performance of a predictive model. By systematically isolating and testing individual factors, such as pre-processing strategies or feature sets, these studies allow us to evaluate their independent effects on the inference process.
3.1 Ablation study I: artifacts and artifact removal
To better understand the impact of head movements and eye movements on certain EEG frequency bands, Figures 3, 4 depict (top plots) the power spectral representation of the accelerometer signals (averaged across the x, y, and z-axes) and the Signal-to-Noise Ratio (SNR) representation (bottom plot), for each of these two signal modalities, respectively. SNR is computed for each frequency bin as the ratio between the power of the bin’s central frequency and the mean power of neighboring frequencies excluding immediately adjacent ones (Meigen and Bach, 1999).
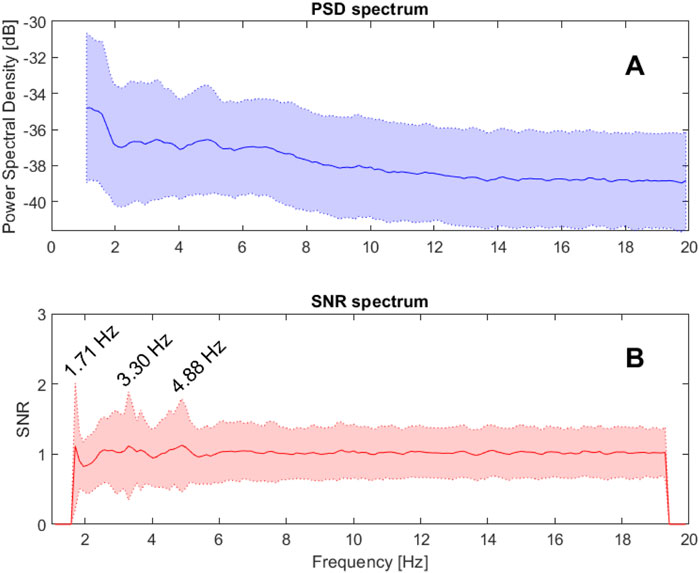
Figure 3. (A) Spectral analysis of accelerometer data: This graph presents the spectral representation of accelerometer data averaged across the x, y, and z-axes for multiple subjects and sessions. On the y-axis, power is expressed in decibels (dB), while the x-axis displays frequency in Hertz (Hz), covering a spectrum from 1 Hz to 50 Hz. The blue curve illustrates the mean power spectrum, and the shaded area represents the standard deviation, reflecting variability across recordings. (B) Signal-to-Noise Ratio (SNR): This part of the figure presents the SNR across the frequency spectrum, amplifying local activity in relation to adjacent background noise levels. The x-axis displays the frequency in Hertz (Hz), covering the same range as in Figure (A).
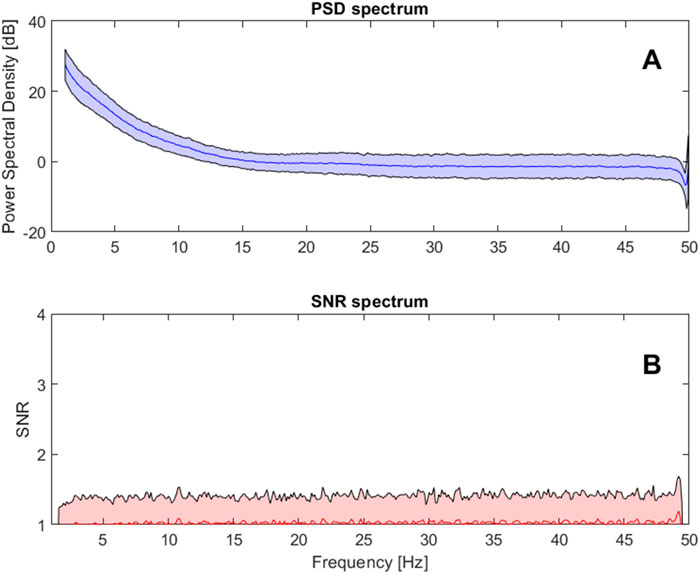
Figure 4. (A) Spectral representation of EOG signals: This graph presents the EOG signal averaged across various subjects and sessions, providing a spectral overview. The y-axis quantifies power in decibels (dB), and the x-axis represents frequency in Hertz (Hz), spanning from 1 Hz to 50 Hz. The blue curve indicates the average power spectrum, while the shaded area around this curve illustrates the standard deviation, reflecting variability among subjects and sessions. (B) Signal-to-Noise Ratio (SNR) of the corresponding EOG spectrum.
As can be seen from Figure 3, notable power peaks occur at 1.7 Hz, 3.3 Hz, and 4.9 Hz, likely harmonics of the head movements. These findings suggest that head movement information can likely be a confound for EEG features based on delta and theta bands. Similarly, from Figure 4 ocular activity exhibits a 1/f spectral roll-off, suggesting that eye movements may also affect lower frequency bands, specifically the delta and theta bands.
Next, we wish to explore the potential of the three different AAR algorithms at removing these two artifact sources. To this end, we utilize the mutual information computed from the processed EEG signal and the temporal series of the EOG and the averaged tri-axes accelerometer signals. A higher mutual information will signal that the artifacts have not been removed and the EEG signal still contains substantial artifactual information embedded in the signal. In turn, lower mutual information values suggest that the artifacts were correctly removed. Figure 5 presents the computed mutual information (averaged over the head and eye movement signals) for each of the seven EEG channels. As can be seen, minimal processing showed the highest mutual information, as expected. The RegICA method removed some of the artifacts, while the more complex ASR + ICLabel combination resulted in the least amount of mutual information, suggesting the most aggressive removal of artifacts.
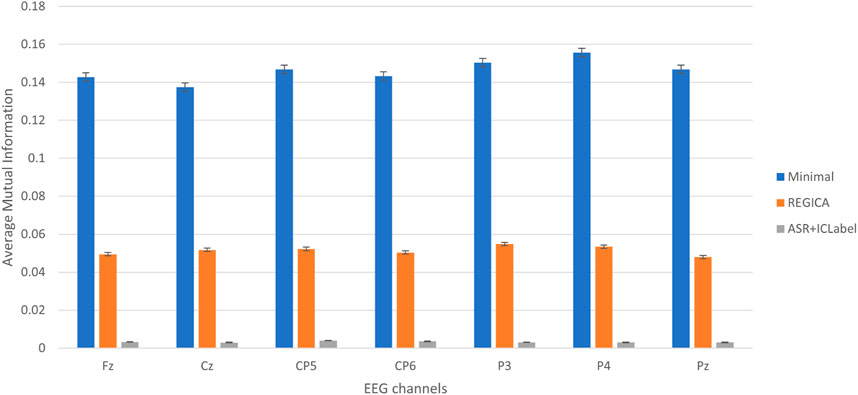
Figure 5. Comparative analysis of pre-processing algorithms for EEG signals based on mutual information. The bar plots illustrate the average mutual information scores between EEG channels of pre-processed signals and recorded noise signals (EOG and accelerometer signals) for different pre-processing pipelines. The y-axis represents the mutual information score, quantifying the dependency between the EEG signals and noise, while the x-axis categorizes EEG electrodes. Error bars indicate standard error, reflecting variability among subjects and sessions.
Lastly, Figure 6 depicts the EEG Power Spectral Density averaged across channels processed by the Minimal and the ASR + ICLabel pipelines. As can be seen, the 1.7 Hz, 2.5, and 3.2 Hz peaks, likely due to head movements, can be seen with the former, but not the latter. The spectral density above 6 Hz, in turn, closely matches in both scenarios.
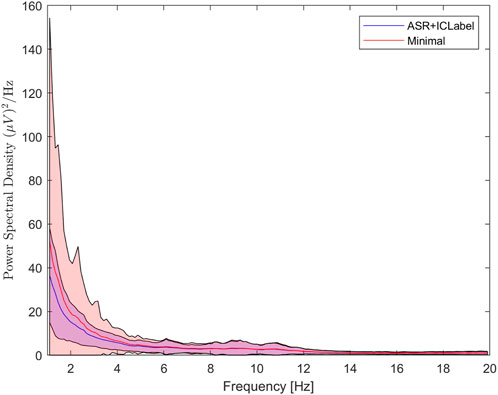
Figure 6. Comparison of power spectral density between Minimal and ASR + ICLabel pre-processings methods. The y-axis quantifies power density in
Comparison of the spectra of the two pipelines, Minimal and ASR + ICLabel, suggests that the components identified as ocular and motion artifacts, in Figures 3, 4 respectively, were eliminated by the ASR + ICLabel pipeline, but not by the Minimal pipeline. This observation in the spectral domain is consistent with the results obtained from the mutual information measurements.
3.2 Ablation study II: combination of AARs, epoch size, and feature type
Despite the effective removal of artifacts, AARs can distort the signals. Therefore, we investigated their impact on the useful information related to cybersickness. We compared different combinations of epoch sizes and each AARs for the predictive power of each type of feature. As a figure-of-merit, we employed the correlation measures described in Section 2.6, which were calculated between the samples and the associated FMS rating independently for each feature.
Figure 7 presents the Spearman correlation between different features and the FMS scores in the training set. The correlation map shows results for the different AAR methods, feature types, and epoch sizes. As can be seen, PSD and AMP features showed the highest correlations with the Minimal processing pipeline with the 8 and 20 s epochs for AMP features and 8-s epochs for PSDs. Moreover, the band and channel coupling measures showed mild to moderate correlation with FMS across various pre-processing scenarios, suggesting their potential complementarity for cybersickness characterization.
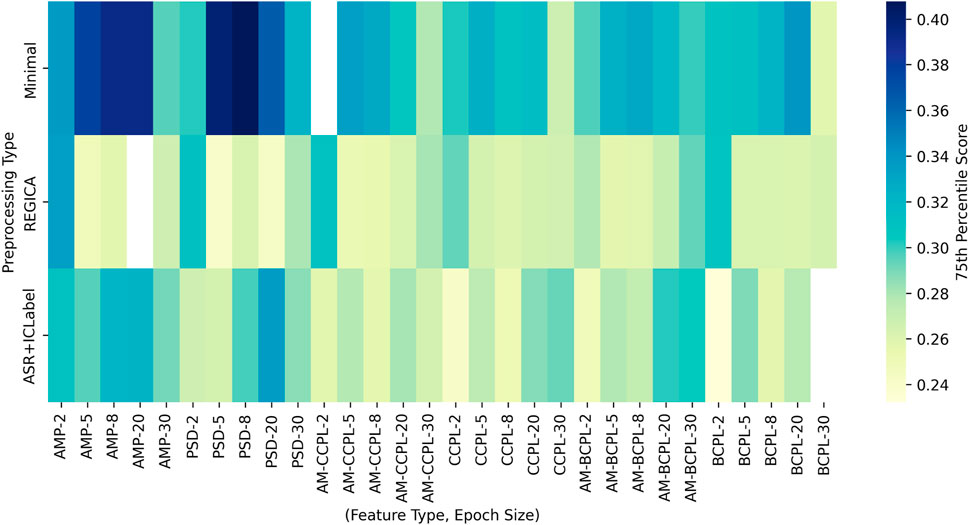
Figure 7. Comparative analysis of feature type distribution across different pre-processing conditions and epoch sizes, encompassing six distinct feature types: AMP, PSD, AM-CCPL, CCPL, AM-BCPL, and BCPL. The color intensity within the heatmap denotes the magnitude of the average correlation between data of selected features and FMS ratings.
Overall, the RegICA and ASR + ICLabel AAR methods showed lower correlation scores with FMS ratings across most epoch sizes and feature types, whereas the Minimal pre-processing showed the highest. These findings suggest that, indeed, retaining artifacts related to blinks, eye movements, and head movements can be useful to characterize the multimodal effects of cybersickness.
3.3 Ablation study III: feature selection
Next, we explore the selection of the optimal number of features. Figure 8 shows the coefficient of determination
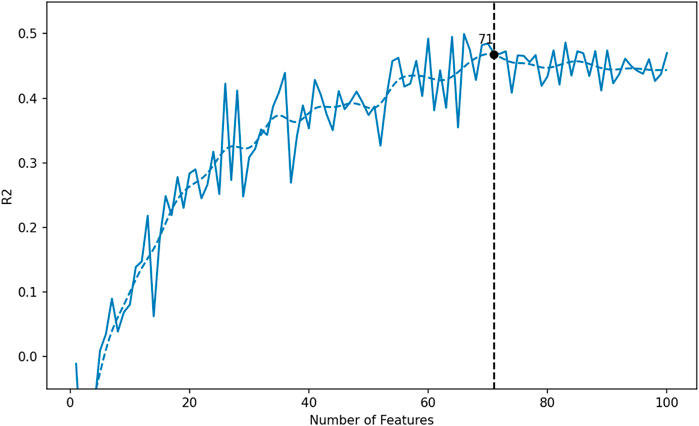
Figure 8. Performance metrics for the ASR + ICLabel pre-processing method over a 5-s epoch, as a function of feature count. The graph illustrates the variation of coefficient of determination
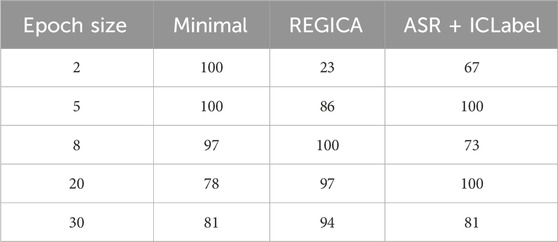
Table 1. Optimal number of features selected for each combination of epoch sizes and pre-processing techniques. The maximum number of features is set (empirically) to 100 to prevent overfitting.
3.4 Top-features analysis
To gain greater insight into cybersickness characterization, two analyses were performed based on the interpretation of the most relevant features. The first analysis explores the neural patterns indicative of cybersickness, while the second investigates the multi-modal potential of cybersickness detection with minimal EEG pre-processing.
We employed a strategy to summarize the multiple lists of top features generated for each combination of the AAR algorithm and epoch size. For each AAR, a unified list was created by gathering all features that appeared in at least one of the lists across various epoch sizes. A common list is then defined as the intersection of two unified lists, meaning that a feature must be present in both lists to be included. Therefore, the analysis in the discussion section is based on common features between the two AARs, regardless of the epoch size.
3.4.1 Neurological patterns associated with cybersickness
For this analysis, the underlying assumption is that the common top-ranked features selected with and without pre-processing will most likely convey details about the neural underpinnings associated with cybersickness. Based on the ablation studies, we use the ‘ASR + ICLabel’ and the ‘Minimal’ pre-processing methods in this analysis. It was found that the common/overlapped top features list comprised 51 features with 22 accounting for AMP and PSD; 11 for inter-channel coupling features; and 18 for inter-band coupling features. More details about these top features are given next.
3.4.1.1 PSD and AM power features
Figure 9 shows the average correlation with FMS ratings of the top-22 common features from the AMP and PSD categories. In the figure, the electrode locations and feature types are detailed in the x-axis labels, while the frequency bands are color-coded. Spatially, the neuronal patterns correlated with cybersickness form two distinct clusters: alpha-mtheta, alpha, and theta bands are prevalent in the parietal (P3, P4, Pz) and centro-parietal (CP5, CP6) areas, while alpha-mdelta, delta, and beta-mdelta bands are primarily observed in the central (Cz) and frontal (Fz) regions.
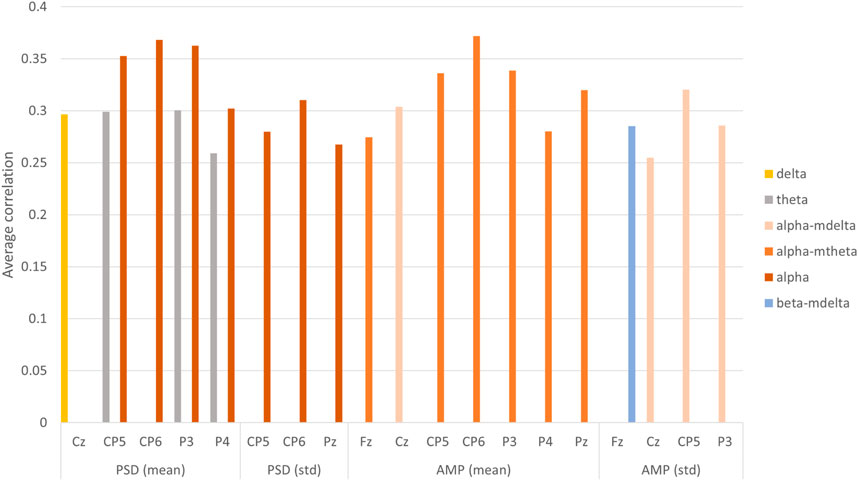
Figure 9. Bar plot representing average correlation between overlapped AMP and PSD features and FMS ratings. The feature types and EEG electrodes are described on the x-axis, while the corresponding frequency bands are color-coded (see the figure legend).
The average AM power (AMP_mean) primarily consists of alpha-mtheta frequencies, while the average band power (PSD_mean) is mainly characterized by theta and alpha frequencies. Notably, theta oscillations are more significant when their average power across an entire minute is taken, indicating their role as a persistent process.
Moreover, the variability in power, as indicated by the standard deviation features (AMP_std and PSD_std), is most closely associated with the alpha-mdelta and alpha bands, respectively. The observed increase in the variability of alpha-mdelta band power, taken over a 1-min window indicate instability of the alpha band slow temporal dynamic as the perceived cybersickness symptoms increase. This feature may reflect neuronal mechanisms capable of flexible and adaptive responses to cybersickness.
Next, we take a more in-depth look at the two features with the highest correlation with FMS in Figure 9, namely, mean alpha-mtheta at CP6 and the standard deviation of alpha-mdelta power at CP5. As can be seen in Figure 10, the average alpha-mtheta activity and the alpha-mdelta power standard deviation exhibits a significant positive correlation with FMS ratings. Notably, variability among participants is increased within the 0.5-1 normalized FMS score range, suggesting a more unstable/inconsistent pattern across this interval.
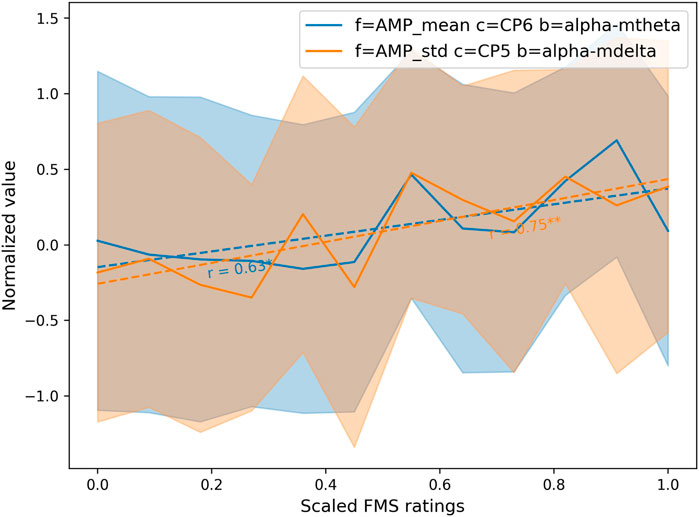
Figure 10. Lateral Parietal Grand average feature values of AMP_mean_alpha-mtheta_CP6 and AMP_std_alpha-mdelta_CP5 versus FMS ratings using the ASR + ICLabel pre-processed dataset. The grand average was calculated by grouping individual subject ratings, averaging them within subjects, and then averaging these values across all subjects to obtain a unified measure for each feature. Both features show a significant positive correlation. The filled areas correspond to standard errors around each curve. Coefficients marked with * and ** represent the Pearson correlation between the grand average and FMS ratings with a p-value
Figure 11, in turn, depicts the temporal changes of the two features over the 10-min experiment which exhibited increased cybersickness levels over time. As can be seen, both features exhibited a significant increase over time, suggesting they may serve as a precursor to predict the onset of cybersickness, with symptomatic manifestation becoming consistently evident across participants only after they have been exposed to VR for an extended period. Moreover, it is important to highlight that the variability across subjects (represented by the shaded bands) increased towards the end of the experiment, likely attributed to the reduced amount of data available for accurate standard deviation estimation, as not all participants reached the end of the experiment due to nausea symptoms.
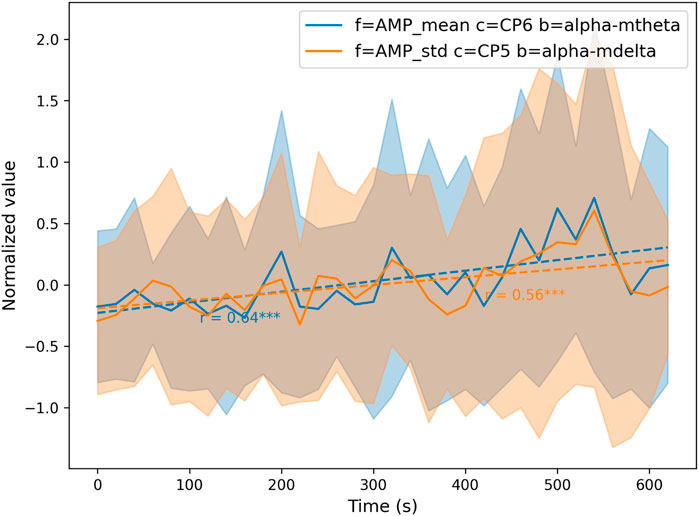
Figure 11. Lateral Parietal Grand average feature value of AMP_mean_alpha-mtheta_CP6 (blue curve) and AMP_std_alpha-mdelta_CP5 (orange curve) as a function of time using ASR + ICLabel pre-processed dataset with 5 s epoch size. Both features show an increase over time, suggesting potential tracking of cybersickness levels. The filled area corresponds to the standard error around each curves. Coefficients marked with *** represent the Pearson correlation with a p-value
3.4.1.2 Inter-channel coupling features
Figure 12 depicts the average correlation between data from CCPL based features and FMS ratings. As observed, the most relevant pattern appears to be associated with the beta band. Both average and standard deviation power exhibit similar correlations with cybersickness, specifically with beta-mtheta and beta for AM-CCPL and CCPL, respectively. Channel coupling seems to predominantly occur in centro-parietal (channels Cz, CP5, CP6) and parietal regions (channels P3, Pz, P4). The predominance of centro-parietal activity correlated with FMS ratings suggests involvement in proprioceptive processes, visual/sensorial stimulus processing, and the integration of contextual information (Albanese et al., 2023; Walter and Dassonville, 2008; Summerfield and Mangels, 2005) during cybersickness.
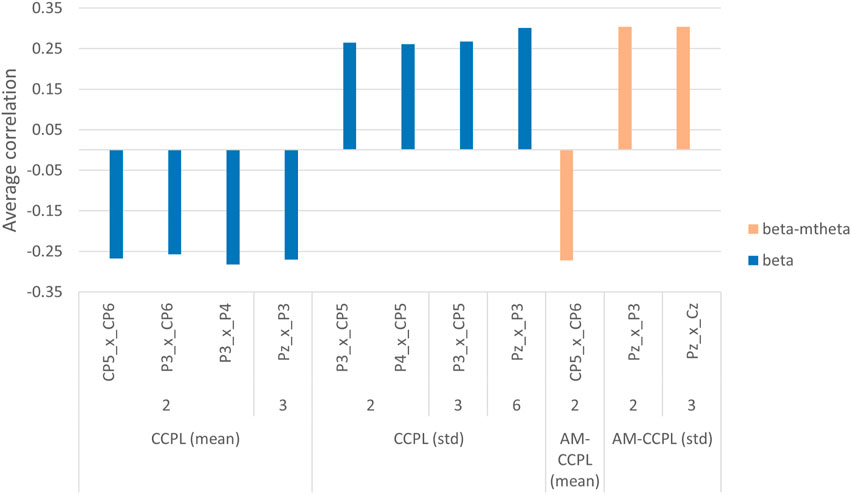
Figure 12. Bar plot representing average correlation between overlapped CCPL features and FMS ratings. The feature subtype and coupled channel pairs are described in the x-axis, while the corresponding frequency bands are color coded (see figure legend).
Moreover, the figure reveals a significant pattern of coupling within the beta-mtheta band, evidenced by features such as AM_ccor_mean CP5 × CP6 and AM_ccor_std Pz × Cz. This pattern emphasizes the crucial role of the beta band in mediating interactions between various cortical areas.
3.4.1.3 Inter-band coupling features
Figure 13 depicts the average correlations between data from inter-band coupling features and FMS ratings. Within BCPL features only two features appeared in the top: an average decoupling is observed between theta and gamma in left Parietal area (channel P3) whereas a strong coupling variability occurs between theta and beta band in left centro-parietal area (channel CP5).
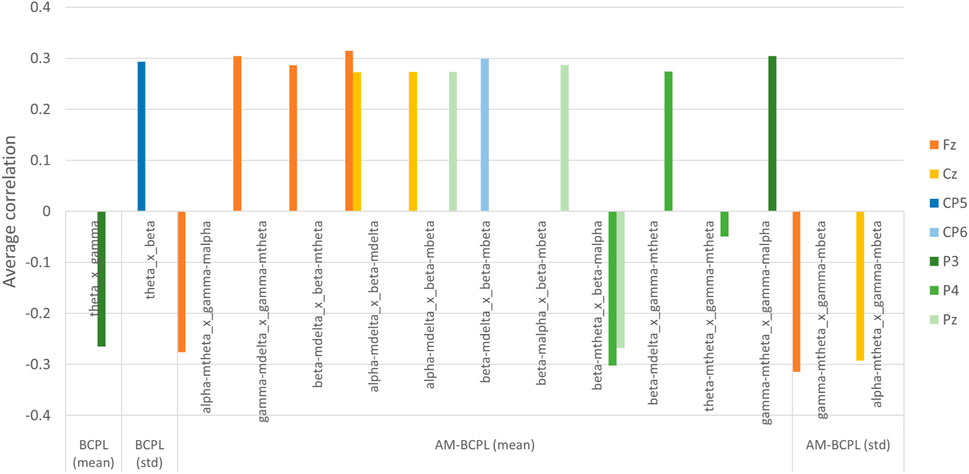
Figure 13. Bar plot representing average correlation between overlapped BCPL features data and FMS ratings. The feature subtype and coupled band pairs are described in the x-axis, while the corresponding channels are color coded (see figure legend).
AM-BCPL features are, in turn, predominant in the top feature list. As can be seen, activities correlated with cybersickness intensity are observed in multiples cortical regions with alpha and beta band couplings in the midline electrodes (Fz, Cz and Pz) represented by features alpha-mdelta
The frontal lobe (channel Fz), like the centro-parietal area, seems to be particularly important in the coupling between frequency bands. A notable decoupling between gamma and alpha bands, represented by the feature alpha-mtheta
Overall, the prevalent patterns involve the average coupling of the modulated beta band with alpha and gamma bands, suggesting that the beta band may act as a conduit between slow and rapid neuronal activities during cybersickness episodes. Furthermore, the coupling between beta-mtheta and beta-malpha can be identified as a significant pattern associated with cybersickness. Theta and alpha bands appear to engage in a common neuronal mechanism that modulates the amplitude of fast oscillations, notably within the beta band. According to the top-down theory (Richter et al., 2017), this modulation could be attributed to changes in activity within local neuronal assemblies–represented by fast oscillations–under the remote control of deeper brain structures through slower waves.
The manifestation of coupling related to the beta band, both spatially across centro-parietal channels (Cz, CP5, CP6, Pz) and spectrally between the beta-mtheta and beta-malpha bands, highlights the beta band’s central role in facilitating the dynamic formation and integration of cortical networks under cybersickness conditions.
The negative correlation between cybersickness severity and the coupling between beta-mtheta and beta-malpha indicates a diminishing interaction between their respective cortical processes as cybersickness intensifies, as depicted by Figures 14, 15. It could be argued that increased presence of artifacts affecting the theta band with rising cybersickness levels, could lead to a decoupling. However, the temporal progression of both beta-mtheta and beta-malpha, shown in Figure 16, exhibits a significant increase over time. The increase is also observed in the P4 electrode, although not significant, as illustrated in Figure 17. Furthermore, the similar correlation values of −0.31 and −0.29 for the Minimal and ASR + ICLabel pipelines, respectively, suggest that the decoupling between beta-mtheta and beta-malpha bands is not primarily due to artifacts.
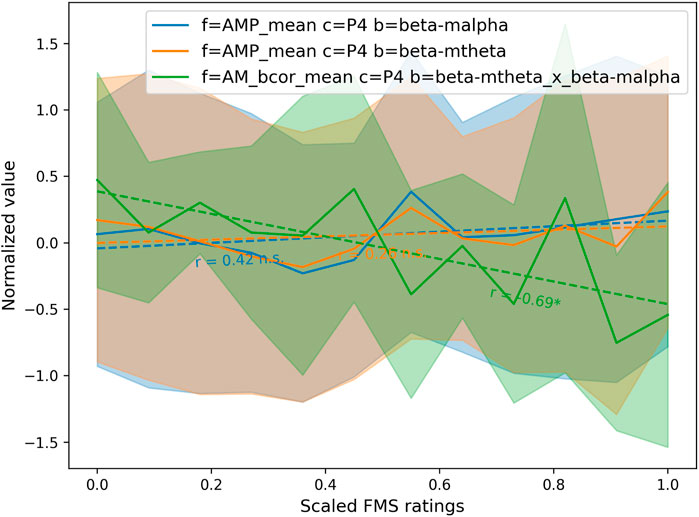
Figure 14. Right Parietal Grand average feature value of AMP_mean_beta-malpha_P4 (blue), AMP_mean_beta-mtheta_P4 (orange) and AM_bcor_mean_P4_beta-mtheta_beta-malpha (green) across recordings as a function of normalized FMS ratings using ASR + ICLabel pre-processed dataset with 5 s epoch size. A strong significant negative correlation is observed with AM_bcor_mean_P4_beta-mtheta_beta-malpha. Coefficients marked with * and n.s. represent the Pearson correlation between grand average and FMS ratings with a p-value
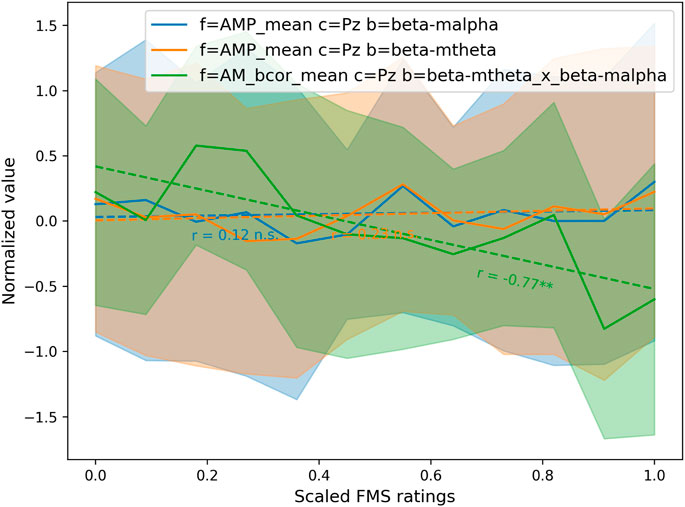
Figure 15. Parietal Grand average feature value of AMP_mean_beta-malpha_Pz (blue), AMP_mean_beta-mtheta_Pz (orange) and AM_bcor_mean_Pz_beta-mtheta_beta-malpha (green) across subjects and sessions as a function of normalized FMS ratings using ASR + ICLabel pre-processed dataset. A strong significant negative correlation is observed with AM_bcor_mean_Pz_beta-mtheta_beta-malpha. Coefficients marked with ** and n.s. represent the Pearson correlation between grand average and FMS ratings with a p-value
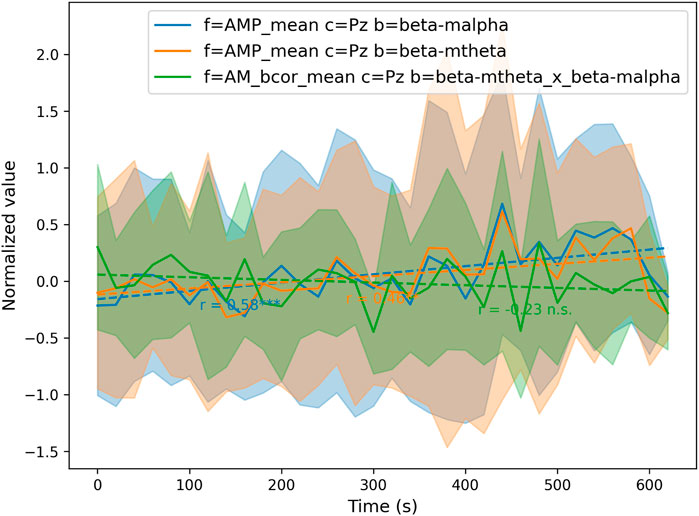
Figure 16. Parietal Grand average feature value of AMP_mean_beta-malpha_Pz (blue), AMP_mean_beta-mtheta_Pz (orange) and AM_bcor_mean_Pz_beta-mtheta_beta-malpha (green) across subjects and sessions as a function of time using ASR + ICLabel pre-processed dataset. Both power beta-malpha and beta-mtheta features show a significant strong positive correlation with time. Coefficients marked with **, * and n.s. represent the Pearson correlation between grand average and FMS ratings with a p-value
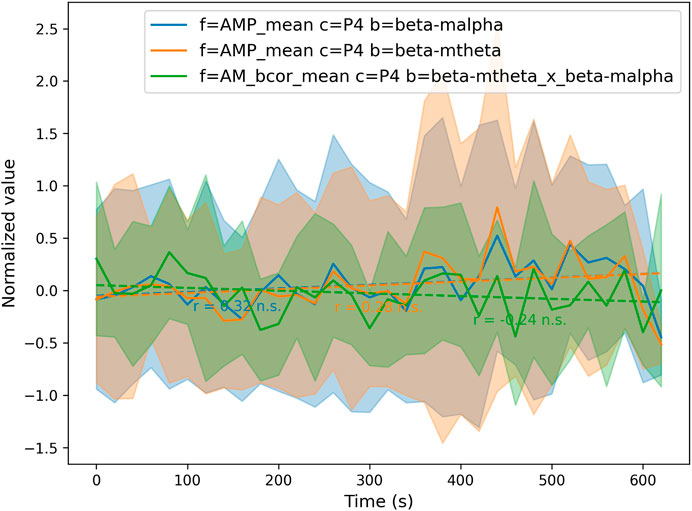
Figure 17. Right Parietal Grand average feature value of AMP_mean_beta-malpha_P4 (blue), AMP_mean_beta-mtheta_P4 (orange) and AM_bcor_mean_P4_beta-mtheta_beta-malpha (green) across recordings as a function of time using ASR + ICLabel pre-processed dataset. Both power beta-malpha and beta-mtheta features show a weak positive correlation with time. Coefficients represent the Pearson correlation between grand average and FMS ratings. None of the correlations were significant as indicated by n.s.
Additionally, both bands display a similarly weak, non-significant correlation with FMS ratings for both channels P4 and Pz, as illustrated in Figures 14, 15. Considering the absence of a significant correlation with FMS ratings, the observed decoupling between beta-mtheta and beta-malpha bands is unlikely to stem from direct changes in power within either band. Instead, this pattern underscores a more complex interaction, suggesting a dynamic rerouting or reorganization of the cortical network as an adaptive response to cybersickness. This observation support the robustness of AM-based features in extracting meaningful patterns regardless of the presence of artifacts.
3.4.2 EEG-based embedding of multiple modalities and their role in cybersickness prediction
As mentioned previously, minimal pre-processing of the EEG signal leaves several artifacts within the EEG time series that may be useful for cybersickness prediction, such as eye and head movements. In this analysis, we take an in-depth look at the top-features selected with the Minimal pre-processing pipeline that did not overlap with those selected from the other two more complex pre-processing methods. The top-features were selected based on their prevalence within the top feature lists across at least three out of five epoch sizes tested within the Minimal pre-processing condition.
Figure 18 shows the top PSD and AM power-based features, which accounted to 23 of the 44 top features. As can be seen, the correlation values are higher than those reported from the previous analysis. Moreover, a marked increase in the occurrence of the delta and theta band features is shown, especially around the central and parietal regions (channels Cz, CP5, CP6, P3, Pz, P4). As was discussed in Section 3.1, these bands tend to be more sensitive to head and eye movements artifacts, thus may be encoding such details.
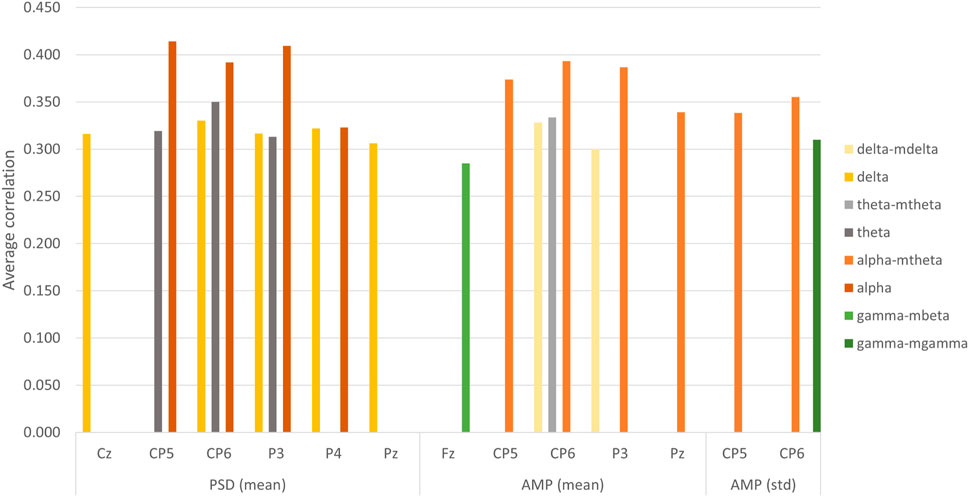
Figure 18. Bar plot representing average correlation between feature data and FMS ratings from the top features list using Minimal pre-processing method. Some features overlap with those from the ASR + ICLabel preprocessing. Only the AMP and PSD features are represented. The feature type and EEG electrodes are described in the x-axis, while the corresponding frequency bands are color coded (see figure legend).
Comparing Figure 18 with Figure 9, the presence of delta and theta bands in the latter remains limited. This is likely due to contamination by ocular and movement artifacts preserved by Minimal pipeline but removed by ASR + ICLabel. Notwithstanding, the previous analysis also showed the presence of theta band activity within the top features that overlapped the ASR + ICLabel and Minimal pre-processing approaches, thus suggesting that theta-band patterns may not be entirely attributed to artifacts, but may also convey some neurological origin related to cybersickness.
Table 2 shows the remaining top-21 features (out of total 44) from the CCPL and BCPL feature categories. As can be seen, the majority of the top features correspond to band coupling between amplitude modulated bands. The most recurring carrier band is gamma followed by beta, while the most recurring modulator band is theta.
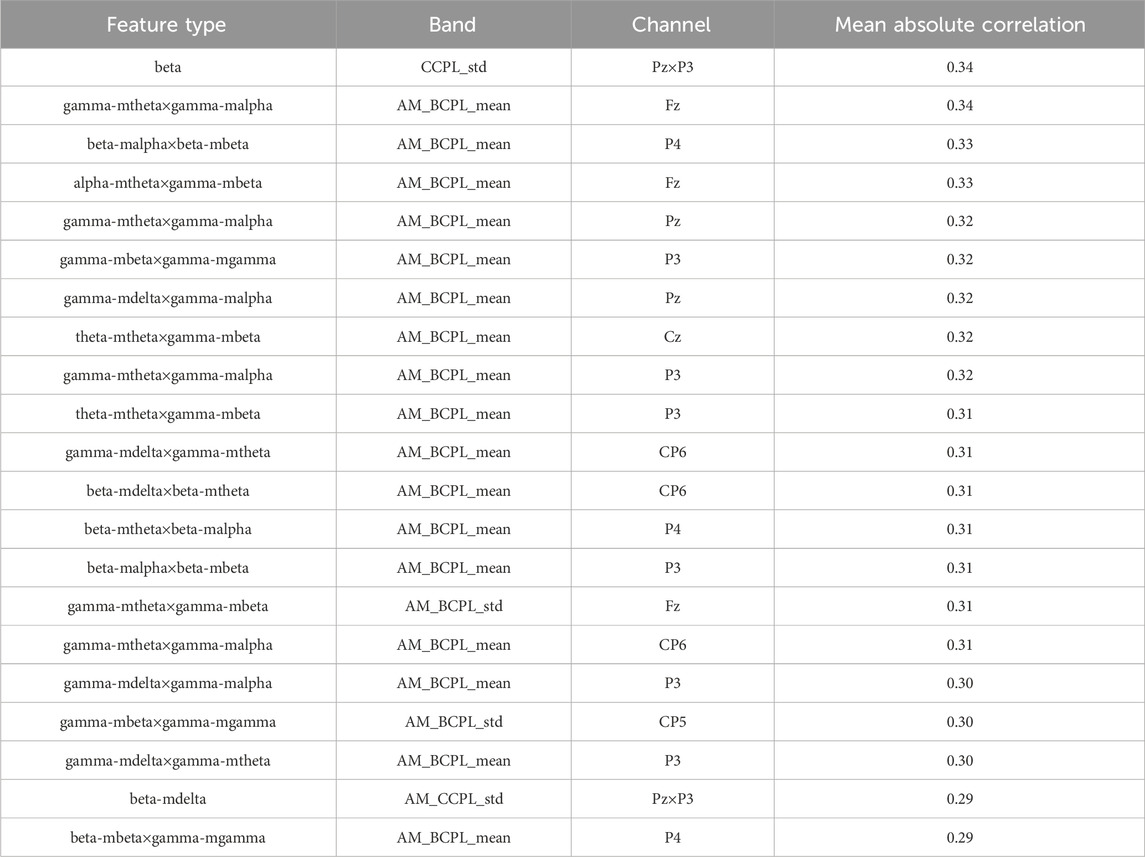
Table 2. Top-selected coupling features (BCPL, CCPL, AM-BCPL and AM-CCPL) identified using Minimal pre-processing across different epoch durations (2, 5, 8, 20, and 30 s).
3.5 Overall cybersickness characterization
Table 3 lists the final RMSE achieved between the real (normalized) FMS ratings and the predicted ones for each pre-processing strategy and epoch size. These results reflect the model’s performance on unseen data, as the training and testing folds used in cross-validation are strictly non-overlapping. To gauge the significance of the results in the table over chance, a random classifier is also trained where the FMS ratings, which serve as regression labels, are randomized. As can be seen, across all tested configurations, performance significantly exceeded this chance level. Table 4 summarizes the main relevant features used for cybersickness level measurement.
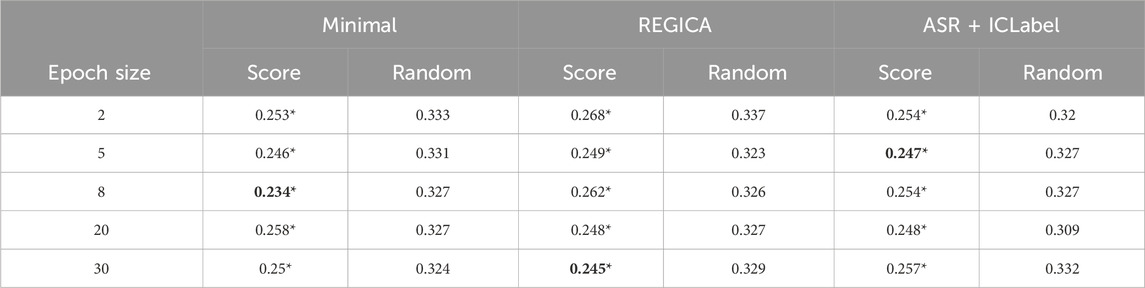
Table 3. RMSE values derived from a 5-fold cross-validation regression analysis, assessing the impact of various pre-processing techniques over different epoch durations on regression performance. The benchmark for random performance was established through successive permutation tests and random FMS ratings. Entries significantly surpassing this benchmark (p
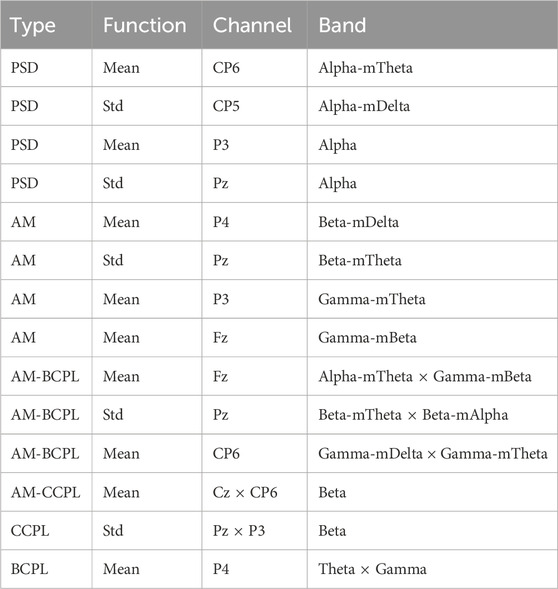
Table 4. Summary of relevant features for cybersickness measurement.
Overall, the ‘Minimal’ pre-processing approach achieved the lowest RMSE values with top features computed from 8-s epochs, achieving an RMSE of 0.234, significantly lower than chance-level (0.327), corroborating the importance of the multi-modal aspect achieved by leaving artifacts untouched. In contrast, the RegICA and ASR + ICLabel pre-processing approaches achieved their lowest RMSE values at higher epoch sizes. As these methods tend to remove artifacts, the regressors are relying solely on neural signatures for cybersickness prediction. In such cases, the longer duration epochs are needed to capture the neural underpinnings of cybersickness, which may be present in lower-frequency activity.
4 Discussion
In this study, we started with two main objectives: (1) to better understand the impact of artifact removal on EEG-based cybersickness prediction, and (2) to obtain more insights on the neural underpinnings of cybersickness via the use of new amplitude modulation features. Via a series of ablation studies, correlation analyses, and top-feature evaluations, our experiments have provided cues into these two objectives. In the subsequent sections, we discuss these findings in more detail.
4.1 To pre-process or not to pre-process?
In EEG studies, the presence of artifacts can negatively influence the validity and interpretation of results (Zhou et al., 2023; Lopes et al., 2023; Bennett et al., 2021), as artifacts can take on various forms (Delorme, 2023; Michel and Brunet, 2019; Jin et al., 2023) and overlap with neurological signals in spatial, temporal and spectral domains (Thompson et al., 2008; Chiarion et al., 2023). While this makes the use of pre-processing an essential step in EEG signal analysis, there is no universally accepted method. Algorithms are developed to target certain types of artifacts [e.g. (Robbins et al., 2020; Yu et al., 2022)] and each pre-processing method comes with its own set of advantages and limitations. As such, researchers must trade-off between effective artifact removal and minimal signal distortion (Bouazizi and Ltifi, 2024; Tajmirriahi et al., 2022; Bao et al., 2022).
Recently, the extensive use of AAR has been contested due to the excessive data distortions and destruction they might cause to the data (Delorme, 2023; Chiarion et al., 2023). For instance, ICA has been shown to produce distortions due to the non-stationary nature of EEG signals (Chiarion et al., 2023; Bouazizi and Ltifi, 2024). Additionally, it may mix neurological and non-neurological sources within the same components when the number of channels is much smaller than the number of sources (Thompson et al., 2008; Sun and Mou, 2023; Chaddad et al., 2023), which can often be the case in VR applications.
As with most EEG studies, our results also indicate that non-neurological activity is recorded along with neurological activity. More specifically, we show that ocular activity and head movements are observed in the lower frequencies of the EEG spectrum, such as delta and theta, and these were selected as top-features in the Minimal processing case. In turn, other features from these regions, but measuring temporal dynamics information, could be indicative of regulatory and coordinating roles in cognitive processes.
Unlike other studies, however, for cybersickness prediction, the presence of physiological artifacts can serve as useful sources of multimodal information to predict cybersickness levels (Islam et al., 2021; Dennison et al., 2016; Islam et al., 2022; Chang et al., 2021; Shimada et al., 2023b; Jeong et al., 2022). The obtained findings showed that Minimal processing, indeed, resulted in the lowest cybersickness level prediction error. Therefore, if one is interested in maximizing cybersickness prediction accuracy, performing minimal pre-processing may be the way to go. It is suggested, however, that careful scrutiny of the top-used features be evaluated, to ensure that indeed the developed models are also relying on relevant neural data, and not just physiological artifacts. Furthermore, the main sources of artifacts should be precisely identified when implementing an EEG-embedded multimodal system, as not all artifacts are useful for predictions and may negatively impact outcomes.
4.2 Cybersickness and neural insights
4.2.1 Beta band insights
We showed that the features measuring CCPL and AM-CCPL variability in the centro-parietal region (channels Cz, CP5, P3, Pz, P4) within the beta and beta-mtheta bands indicated an increase in coupling variability as the FMS score increased. With the increase in cybersickness symptoms reflected by the FMS score, not only did we observe a decrease in the interaction between distant regions of the parietal area, but their connections also become more unstable.
Although a decrease in beta power is the most recurrent pattern related to cybersickness in the literature (Chang et al., 2023; Jang et al., 2022; Achanccaray and Sumioka, 2023), some studies showed that spectral activity above 11 Hz showed no significant difference (Nürnberger et al., 2021) (or inconsistent trend across subjects and electrodes (Ozkan et al., 2023)) between baseline and severe cybersickness conditions. In our analyses, features measuring beta power were not representative of the most correlated features with cybersickness. Thus, since most of the observed beta activity was related to coupling measures, our results better align with the theory that beta is linked to the temporary cohesion of distant cortical regions (Li et al., 2021; Yang et al., 2022b), rather than due to a specific change in local activity.
Overall, cortical networks formed within the beta band have been associated with fundamental function of complex cognitive processes, such as active waiting and anticipation of a stimulus (Betti et al., 2021), temporary retention of sensory information (Liang et al., 2021; Silberstein and Klimesch, 2006), and the dynamic allocation of cognitive resources (Betti et al., 2021). The dynamic nature of these networks explains the rapid changes in activity observed in the beta band, thereby leading to the disparity in observations across cybersickness studies. Moreover, power change observed during high levels of cybersickness might be attributed to cybersickness related physiological states such as arousal (Agić and Mandić, 2019), cognitive effort (Li et al., 2021; Arafat et al., 2018), as well as visual and mental fatigue (Foong et al., 2019; Yue and Wang, 2019).
Moreover, decreases in the correlation between the beta-mtheta and beta-malpha bands at the Pz and P4 electrodes were observed as the intensity of the cybersickness symptoms increased. As shown in Figures 14, 15, the power of the two beta-malpha and beta-mtheta bands increases with the FMS score, and their correlation decreases. These findings corroborate the importance of the AM features in capturing the temporal dynamics of the beta band.
According to the literature, the theta band plays a role in the temporal organization of cognitive processes (Herweg et al., 2016; Popov et al., 2018). Therefore, we hypothesize that beta-mtheta may be linked to the process of integration of sensory information mentioned earlier. Moreover, since alpha is known to reflect selective inhibition of population of neurons [as per (Ahn et al., 2021) and (Sauseng et al., 2005)], and beta is associated with intense cognitive activity [(Borra et al., 2023) and (Ghiani et al., 2021)], the beta-malpha feature may reflect a selective attention mechanism. Although alpha and beta are associated with opposite mechanisms, it is hypothesized that their interaction may serve a complementary role in the integration of extracted visual features into a coherent representation of the object (Di Dona and Ronconi, 2023). The proposed AM measures may be able to capturing and quantifying this interaction.
4.2.2 Alpha band insights
In addition to its interaction with beta, the alpha band power in the parietal cortex (channels P3, P4) was also highlighted in the analysis of the most correlated features. The increase in alpha activity in this area is indicative of sensory information processing inhibition in response to the sensory conflict induced by the VR experience. This activity appears to be a reliable marker of cybersickness, as this pattern is recurrent across EEG studies (Yang et al., 2022a; Ahn et al., 2021; Kim et al., 2019; Aboud, 2023).
Interestingly, the increase in alpha band identified by PSD features co-occurred with an increase in alpha-mtheta feature, suggesting that theta may play a regulatory role on inhibition similarly to what is observed with the beta band. While theta, alpha, and beta bands seem to have an intricate hierarchical role aligning with the top-down theory, the location of relevant activity in the cortex provides additional insights. In addition to revealing interactions between AM bands that suggest the coordination of distinct cognitive processes, AM features allow a better understanding of the nature of neurological processes, particularly those linked to top-down mechanisms.
4.2.3 Gamma band insights
The analysis the top-features obtained from the Minimal pre-processing method revealed the presence of activity in the gamma band potentially related to artifacts. Figure 18 showed that the average power in amplitude of gamma-mbeta was correlated with FMS scores, while Figure 13 showed the presence of average coupling of the gamma band with other AM bands present in Table 2. However, the presence of gamma modulated by theta and alpha in the top BCPL features presented in Figure 13 suggests rather an underlying neurological origin related to the symptom of cybersickness. Therefore, an increase in the coupling of the gamma-mtheta band would not be caused by the presence of artifacts but would serve as an additional marker of the brain’s cognitive state during virtual reality sickness. Specifically, the fact that gamma activity is regulated by low-frequency oscillations suggests downward control mechanisms (Ahn et al., 2021).
The EEG high-frequency range, comprised of the gamma and beta bands, is thought to reflect intense local cognitive activity, as indicated by various studies (Freeman and Vitiello, 2015; Palva and Palva, 2012; Jerbi et al., 2010; Jensen and Mazaheri, 2010). These bands are often observed in the occipito-parietal region as correlated with increased cybersickness symptoms (Yang et al., 2022a). Given these findings, the gamma-band activity observed during the participants’ exposure to the VR simulation can be, similarly to the beta band, attributed to sensory information processing. However, both bands have separate sources and serve different roles. Gamma rhythms often involve interactions between excitatory pyramidal cells and fast-spiking inter-neurons in the formation of cell assemblies (Neske and Connors, 2016; Nunez and Srinivasan, 2010). In contrast, beta band rhythms mainly originating from gap junction-connected bursting pyramidal cells enable the binding of different neural assemblies thereby allowing a simultaneous manipulation of past and current input and the integration from different modalities (Alavash et al., 2017; Kopell et al., 2010).
4.2.4 Brain regions and lateralization insights
The increase in coupling variability observed in Figure 12 for the beta (CCPL_std) and beta-mtheta (AM_CCPL_std) bands was predominant in the left hemisphere (i.e., the features most correlated with the FMS score in the beta-mtheta band concern the coupling between the Pz electrode and the P3 and Cz electrodes, and in the beta band between the CP5 electrode and the P3 and P4 electrodes, as well as the coupling between P3 and Pz). The mean coupling measurement (AM_CCPL_mean and CCPL_mean), in turn, was more correlated with the FMS ratings on the right hemisphere (i.e., with P4 and CP6 electrodes).
In addition, the left centro-parietal region (channels CP5, P3) exhibited highly variable power in the alpha-mdelta band, thus aligning with findings from Angioletti and Balconi (2022). According to the study, increased delta band activity and decreased alpha band activity in the centro-temporal cortex were indicative of a shift in attention towards endogenous sensory information. This lateralization of activity has been recognized in the literature, with right-hemisphere parietal activity associated with visuospatial attention to the environment, whereas the left hemisphere has shown to be responsible for motor coordination and planning related to proprioception (Rushworth et al., 2001).
In contrast, when processing visuo-spatial information, the superior parietal lobe and the primary visual cortex are activated (Rolls, 2020; Li et al., 2018; Andersson et al., 2019), which have nearest electrodes Cz, Pz, P3, Pz, and P4. Consistent with these studies, we posit that the coupling variability is associated with active cognitive processes in this area, particularly those involving proprioceptive information rather than visual information. This implies that shifts of attention towards proprioceptive information may either instigate or respond to cybersickness. This hemispheric phenomenon during cybersickness was well captured by the new AM features.
In addition to the lateralized role, the study in Limanowski and Friston (2020) also revealed significant bilateral activity in the superior parietal lobe–covered by electrodes Pz and Cz–where its role would be to resolve inter-sensory conflict, enabling the maintenance of a unique body representation. Therefore, this region plays an important role in the management of the cognitive processes that process sensory information.
Interestingly, within Cz, an increasing alpha-mdelta power observed in Figure 9 was accompanied by an increase in its coupling with the beta-mdelta and beta-mbeta features over Cz and Fz observed in Figure 13. This coupling was shown with the mutual information measurement analysis, thus suggesting a nonlinear relationship between alpha and beta band activity.
Moreover, Figure 13 showed that the delta band frequently appears to modulate the amplitude of both the alpha and beta bands, thereby controlling their activity. This observation supports the top-down control theory, which suggests long-distance control from the brain’s decision-making centers to local cortical activity.
4.3 Limitations and future work
This research presents some limitations. First, the use of a non-linear SVR kernel made it difficult to analyze feature ranking by inherent regularization, which is possible only with linear kernels. As a result, we relied on Spearman correlation for feature ranking, which does not consider the interaction between features. Future work may explore the use of more advanced feature selection methods that take such interactions into account, such as the mRMR (Minimum Redundancy Maximum Relevance) (Ding and Peng, 2005).
The findings of this study apply primarily to open-loop VR systems, where users have limited control over motion stimuli. EEG patterns observed under these conditions may not directly translate to closed-loop systems, where active control relies on anticipatory mechanisms, as shown in research comparing drivers and passengers (Dong et al., 2011; Rolnick and Lubow, 1991), in contrast to the compensatory responses observed in open-loop scenarios. While the study provides valuable insights into the neural correlates of cybersickness, its findings are primarily applicable to open-loop VR systems. Given that closed-loop systems are more common among general VR users, further research is needed to validate the relevance of these markers in user-controlled environments.
Moreover, here we relied on the efficiency metrics for pre-processing algorithms based on the mutual information difference with head accelerometer and one EOG time serie. Other artifacts may contaminate the EEG signals, such as muscle movements, poor electrode-skin contact, and sweat, to name few. Continuous measurement of such signals are more challenging, but alternate modalities, such as galvanic skin response, facial electromyography (EMG), or impedance measurements may provide additional cues for future works. Emerging VR headsets are already including such modalities directly into the head-mounted display, thus facilitating this type of analyses in the future. In this study, we relied on a publicly available dataset, which primarily included artifacts from ocular and head movements. While these are common in VR scenarios, future work should validate the impact of minimal preprocessing under a broader range of artifact types to ensure the generalizability of these findings.
Lastly, the proposed work relied on publicly available data, which was collected from a limited number of participants, and not all of them completed the full task. This limitation led to variability across subjects, particularly at higher FMS rating levels. Additionally, the dataset’s gender composition (31 females, 9 males) introduces a potential bias, as the findings may predominantly reflect female responses, consistent with studies reporting higher susceptibility to motion sickness among females (Koslucher et al., 2015; Munafo et al., 2017). Furthermore, while this study focused on the sensory conflict theory, other theories, such as the ecological theory of motion sickness and postural instability (Stanney et al., 2020; Riccio and Stoffregen, 1991), emphasize individual differences and environmental interactions that were beyond the scope of this work. Future research could investigate these complementary perspectives and employ advanced cross-subject generalization tools (e.g. (Albuquerque et al., 2022)) to address these limitations.
5 Conclusion
In this study, we sought to answer two main research questions: (1) what role does EEG pre-processing play on overall cybersickness characterization?, and (2) what neural patterns can be indicative of cybersickness levels? To help answer these questions, we processed a publicly-available EEG-cybersickness dataset with three pre-processing methods, from minimal to more complex methods removing head and eye movements, as well as explored several benchmark power spectral and coupling features. To assist with question #2, we also explored new amplitude modulation power and coupling measures to capture interactivity between frequency bands and channels. We showed that, indeed, minimal processing kept head and eye movement related cues that were important for cybersickness detection, but did not provide a full glimpse into the neural patterns associated with cybersickness. To this end, a more complex pre-processing method was used. Ultimately, several AM and coupling measures showed to be top-performing features, thus emphasizing their complementarity to PSD parameters and their importance for cybersickness prediction.
Data availability statement
Publicly available datasets were analyzed in this study. This data can be found here: https://zenodo.org/records/6373681.
Ethics statement
The studies involving humans were approved by the University of Glasgow (No. 300200009), College of Science and Engineering. The studies were conducted in accordance with the local legislation and institutional requirements. Written informed consent for participation was not required from the participants or the participants’ legal guardians/next of kin in accordance with the national legislation and institutional requirements.
Author contributions
OR: Formal Analysis, Investigation, Software, Writing–original draft, Writing–review and editing. DB: Conceptualization, Methodology, Resources, Writing–original draft, Writing–review and editing. GK: Conceptualization, Resources, Writing–original draft, Writing–review and editing. SP: Conceptualization, Methodology, Resources, Writing–original draft, Writing–review and editing. NB: Writing–original draft, Writing–review and editing. TF: Conceptualization, Methodology, Resources, Supervision, Writing–original draft, Writing–review and editing.
Funding
The author(s) declare that financial support was received for the research, authorship, and/or publication of this article. The authors would like to acknowledge funding from the Natural Sciences and Engineering Research Council of Canada, MITACS, and Thales Digital Solutions Inc. under the Alliance Grants Program (ALLRP576732 - 22).
Acknowledgments
ChatGPT-4 and Copilot were used in drafting of the very first version of the introductory text. The generated text was then fully reviewed and edited by the author(s), who take full responsibility for the final content presented here.
Conflict of interest
The authors declare that the research was conducted in the absence of any commercial or financial relationships that could be construed as a potential conflict of interest.
Publisher’s note
All claims expressed in this article are solely those of the authors and do not necessarily represent those of their affiliated organizations, or those of the publisher, the editors and the reviewers. Any product that may be evaluated in this article, or claim that may be made by its manufacturer, is not guaranteed or endorsed by the publisher.
References
Aboud, A. (2023). Identifying cybersickness features from eeg data using deep learning. University of Oulu. Master’s thesis, 67. Available at: https://oulurepo.oulu.fi/handle/10024/46862.
Achanccaray, D., and Sumioka, H. (2023). “A physiological approach of presence and vr sickness in simulated teleoperated social tasks,” in 2023 IEEE international conference on systems, man, and cybernetics (SMC), 01-04 October 2023, Honolulu, Oahu, HI, USA, (IEEE), 4562–4567.
Afshani, F., Shalbaf, A., Shalbaf, R., and Sleigh, J. (2019). Frontal–temporal functional connectivity of eeg signal by standardized permutation mutual information during anesthesia. Cogn. neurodynamics 13, 531–540. doi:10.1007/s11571-019-09553-w
Agić, A., and Mandić, L. (2019). Evaluation of cybersickness in virtual reality in driving simulator. Acta Graph. znan. časopis za tisk. i graf. komun. 30 (2), 11–16. doi:10.25027/agj2017.28.v30i2.210
Ahn, S., Gleghorn, D., Doudican, B., Fröhlich, F., and Cha, Y.-H. (2021). Transcranial alternating current stimulation reduces network hypersynchrony and persistent vertigo. Neuromodulation Technol. at Neural Interface 24 (5), 960–968. doi:10.1111/ner.13389
Akhand, M., Maria, M. A., Kamal, M. A. S., and Shimamura, T. (2024). Emotion recognition from eeg signal enhancing feature map using partial mutual information. Biomed. Signal Process. Control 88, 105691. doi:10.1016/j.bspc.2023.105691
Alavash, M., Daube, C., Wöstmann, M., Brandmeyer, A., and Obleser, J. (2017). Large-scale network dynamics of beta-band oscillations underlie auditory perceptual decision-making. Netw. Neurosci. 1 (2), 166–191. doi:10.1162/netn_a_00009
Albanese, G. A., Marini, F., Morasso, P., Campus, C., and Zenzeri, J. (2023). μ-band desynchronization in the contralateral central and central-parietal areas predicts proprioceptive acuity. Front. Hum. Neurosci. 17, 1000832. doi:10.3389/fnhum.2023.1000832
Albuquerque, I., Monteiro, J., Rosanne, O., and Falk, T. H. (2022). Estimating distribution shifts for predicting cross-subject generalization in electroencephalography-based mental workload assessment. Front. Artif. Intell. 5, 992732. doi:10.3389/frai.2022.992732
Albuquerque, I., Tiwari, A., Parent, M., Cassani, R., Gagnon, J.-F., Lafond, D., et al. (2020). Wauc: a multi-modal database for mental workload assessment under physical activity. Front. Neurosci. 14, 549524. doi:10.3389/fnins.2020.549524
Andersson, P., Ragni, F., and Lingnau, A. (2019). Visual imagery during real-time fmri neurofeedback from occipital and superior parietal cortex. NeuroImage 200, 332–343. doi:10.1016/j.neuroimage.2019.06.057
Angelov, V., Petkov, E., Shipkovenski, G., and Kalushkov, T. (2020). “Modern virtual reality headsets,” in 2020 international congress on human-computer interaction, optimization and robotic applications (HORA), 26-28 June 2020, (IEEE), 1–5.
Angioletti, L., and Balconi, M. (2022). Delta-alpha eeg pattern reflects the interoceptive focus effect on interpersonal motor synchronization. Front. Neuroergonomics 3, 1012810. doi:10.3389/fnrgo.2022.1012810
Arafat, I. M., Ferdous, S. M. S., and Quarles, J. (2018). “Cybersickness-provoking virtual reality alters brain signals of persons with multiple sclerosis,” in 2018 IEEE conference on virtual reality and 3D user interfaces (VR), 18-22 March 2018, (IEEE), 1–120.
Arcioni, B., Palmisano, S., Apthorp, D., and Kim, J. (2019). Postural stability predicts the likelihood of cybersickness in active hmd-based virtual reality. Displays 58, 3–11. doi:10.1016/j.displa.2018.07.001
Aubonnet, R., Hassan, M., Mheich, A., Di Lorenzo, G., Petersen, H., and Gargiulo, P. (2023). Brain network dynamics in the alpha band during a complex postural control task. J. Neural Eng. 20 (2), 026030. doi:10.1088/1741-2552/acc2e9
Bao, C., Hao, Z., and Dou, W. (2022). “Automatic removal of scalp eeg artifacts using an interpretable hybrid deep learning method,” in 2022 IEEE international conference on bioinformatics and biomedicine (BIBM), 6-8 Dec. 2022, (IEEE), 1451–1456.
Barteit, S., Lanfermann, L., Bärnighausen, T., Neuhann, F., and Beiersmann, C. (2021). Augmented, mixed, and virtual reality-based head-mounted devices for medical education: systematic review. JMIR serious games 9 (3), 29080. doi:10.2196/29080
Benelli, A., Neri, F., Cinti, A., Pasqualetti, P., Romanella, S. M., Giannotta, A., et al. (2023). Frequency-dependent reduction of cybersickness in virtual reality by transcranial oscillatory stimulation of the vestibular cortex. Neurotherapeutics 20 (6), 1796–1807. doi:10.1007/s13311-023-01437-6
Bennett, J. D., John, S. E., Grayden, D. B., and Burkitt, A. N. (2021). “Universal neurophysiological interpretation of eeg brain-computer interfaces,” in 2021 9th international winter conference on brain-computer interface (BCI), 22-24 Feb. 2021, (IEEE), 1–6.
Bernal, G., Hidalgo, N., Russomanno, C., and Maes, P. (2022). “Galea: a physiological sensing system for behavioral research in virtual environments,” in IEEE Conference on Virtual Reality and 3D User Interfaces (VR) (IEEE), 66–76.
Betti, V., Della Penna, S., Pasquale, F., and Corbetta, M. (2021). Spontaneous beta band rhythms in the predictive coding of natural stimuli. Neurosci. 27 (2), 184–201. doi:10.1177/1073858420928988
Bigdely-Shamlo, N., Touryan, J., Ojeda, A., Kothe, C., Mullen, T., and Robbins, K. (2020). Automated eeg mega-analysis i: spectral and amplitude characteristics across studies. NeuroImage 207, 116361. doi:10.1016/j.neuroimage.2019.116361
Bondar’, A., and Fedotchev, A. (2000). Concerning the amplitude modulation of the human eeg. Hum. Physiol. 26, 393–399. doi:10.1007/bf02760265
Borra, D., Fantozzi, S., Bisi, M. C., and Magosso, E. (2023). Modulations of cortical power and connectivity in alpha and beta bands during the preparation of reaching movements. Sensors 23 (7), 3530. doi:10.3390/s23073530
Bouazizi, S., and Ltifi, H. (2024). Enhancing accuracy and interpretability in eeg-based medical decision making using an explainable ensemble learning framework application for stroke prediction. Decis. Support Syst. 178, 114126. doi:10.1016/j.dss.2023.114126
Cassani, R., and Falk, T. H. (2018). “Spectrotemporal modeling of biomedical signals: theoretical foundation and applications,” in Encyclopedia of Biomedical Engineering. Editor R. Narayan Elsevier 3, 144–163. doi:10.1016/B978-0-12-801238-3.99993-8
Cassani, R., and Falk, T. H. (2019). Alzheimer’s disease diagnosis and severity level detection based on electroencephalography modulation spectral “patch” features. IEEE J. Biomed. health Inf. 24 (7), 1982–1993. doi:10.1109/jbhi.2019.2953475
Cassani, R., Falk, T. H., Fraga, F. J., Kanda, P. A., and Anghinah, R. (2014). The effects of automated artifact removal algorithms on electroencephalography-based alzheimer’s disease diagnosis. Front. aging Neurosci. 6, 55. doi:10.3389/fnagi.2014.00055
Cassani, R., Moinnereau, M.-A., Ivanescu, L., Rosanne, O., and Falk, T. H. (2020b). Neural interface instrumented virtual reality headsets: toward next-generation immersive applications. IEEE Syst. Man, Cybern. Mag. 6 (3), 20–28. doi:10.1109/msmc.2019.2953627
Cassani, R., Novak, G. S., Falk, T. H., and Oliveira, A. A. (2020a). Virtual reality and non-invasive brain stimulation for rehabilitation applications: a systematic review. J. neuroengineering rehabilitation 17, 16. doi:10.1186/s12984-020-00780-5
Celikcan, U. (2019). “Detection and mitigation of cybersickness via eeg-based visual comfort improvement,” in 2019 3rd international symposium on multidisciplinary studies and innovative technologies (ISMSIT), 11-13 Oct. 2019, (IEEE), 1–4.
Chaddad, A., Wu, Y., Kateb, R., and Bouridane, A. (2023). Electroencephalography signal processing: a comprehensive review and analysis of methods and techniques. Sensors 23 (14), 6434. doi:10.3390/s23146434
Chang, E., Billinghurst, M., and Yoo, B. (2023). Brain activity during cybersickness: a scoping review. Virtual Real. 27 (3), 2073–2097. doi:10.1007/s10055-023-00795-y
Chang, E., Kim, H. T., and Yoo, B. (2021). Predicting cybersickness based on user’s gaze behaviors in hmd-based virtual reality. J. Comput. Des. Eng. 8 (2), 728–739. doi:10.1093/jcde/qwab010
Chiarion, G., Sparacino, L., Antonacci, Y., Faes, L., and Mesin, L. (2023). Connectivity analysis in eeg data: a tutorial review of the state of the art and emerging trends. Bioengineering 10 (3), 372. doi:10.3390/bioengineering10030372
Clerico, A., Gupta, R., and Falk, T. H. (2015). “Mutual information between inter-hemispheric eeg spectro-temporal patterns: a new feature for automated affect recognition,” in 2015 7th international IEEE/EMBS conference on neural engineering (NER), 22-24 April 2015, (IEEE), 914–917.
Clerico, A., Tiwari, A., Gupta, R., Jayaraman, S., and Falk, T. H. (2018). Electroencephalography amplitude modulation analysis for automated affective tagging of music video clips. Front. Comput. Neurosci. 11, 115. doi:10.3389/fncom.2017.00115
Cullen, A. J., Dowling, N. L., Segrave, R., Carter, A., and Yücel, M. (2021). Exposure therapy in a virtual environment: validation in obsessive compulsive disorder. J. anxiety Disord. 80, 102404. doi:10.1016/j.janxdis.2021.102404
Delorme, A. (2023). Eeg is better left alone. Sci. Rep. 13 (1), 2372. doi:10.1038/s41598-023-27528-0
Delorme, A., and Makeig, S. (2004). Eeglab: an open source toolbox for analysis of single-trial eeg dynamics including independent component analysis. J. Neurosci. methods 134 (1), 9–21. doi:10.1016/j.jneumeth.2003.10.009
Dennison, M. S., Wisti, A. Z., and D’Zmura, M. (2016). Use of physiological signals to predict cybersickness. Displays 44, 42–52. doi:10.1016/j.displa.2016.07.002
Di Dona, G., and Ronconi, L. (2023). Beta oscillations in vision: a (preconscious) neural mechanism for the dorsal visual stream? Front. Psychol. 14, 1296483. doi:10.3389/fpsyg.2023.1296483
Ding, C., and Peng, H. (2005). Minimum redundancy feature selection from microarray gene expression data. J. Bioinforma. Comput. Biol. 3 (02), 185–205. doi:10.1142/s0219720005001004
Dong, X., Yoshida, K., and Stoffregen, T. A. (2011). Control of a virtual vehicle influences postural activity and motion sickness. J. Exp. Psychol. Appl. 17 (2), 128–138. doi:10.1037/a0024097
Dymora, P., Kowal, B., Mazurek, M., and Romana, S. (2021). “The effects of virtual reality technology application in the aircraft pilot training process,” in IOP Conf. Ser, Mater. Sci. Eng., IOP Conference Series: Materials Science and Engineering, 2nd to 5th September 2020, Bristol, United Kingdom: IOP Publishing, 1024, 012099. doi:10.1088/1757-899x/1024/1/012099
Fan, F.-L., Xiong, J., Li, M., and Wang, G. (2021). On interpretability of artificial neural networks: a survey. IEEE Trans. Radiat. Plasma Med. Sci. 5 (6), 741–760. doi:10.1109/trpms.2021.3066428
Foong, R., Ang, K. K., Quek, C., Guan, C., Phua, K. S., Kuah, C. W. K., et al. (2019). Assessment of the efficacy of eeg-based mi-bci with visual feedback and eeg correlates of mental fatigue for upper-limb stroke rehabilitation. IEEE Trans. Biomed. Eng. 67 (3), 786–795. doi:10.1109/tbme.2019.2921198
Fracaro, S. G., Chan, P., Gallagher, T., Tehreem, Y., Toyoda, R., Bernaerts, K., et al. (2021). Towards design guidelines for virtual reality training for the chemical industry. Educ. Chem. Eng. 36, 12–23. doi:10.1016/j.ece.2021.01.014
Fraga, F. J., Falk, T. H., Kanda, P. A., and Anghinah, R. (2013). Characterizing alzheimer’s disease severity via resting-awake eeg amplitude modulation analysis. PloS one 8 (8), 72240. doi:10.1371/journal.pone.0072240
Freeman, W. J., and Vitiello, G. (2015). Matter and mind are entangled in eeg amplitude modulation and its double. Berkeley, USA: University California.
Gamito, P., Oliveira, J., Santos, P., Morais, D., Saraiva, T., Pombal, M., et al. (2008). Presence, immersion and cybersickness assessment through a test anxiety virtual environment. Annu. Rev. CyberTherapy Telemedicine 6, 83–90.
Garrido, L. E., Frías-Hiciano, M., Moreno-Jiménez, M., Cruz, G. N., García-Batista, Z. E., Guerra-Peña, K., et al. (2022). Focusing on cybersickness: pervasiveness, latent trajectories, susceptibility, and effects on the virtual reality experience. Virtual Real. 26 (4), 1347–1371. doi:10.1007/s10055-022-00636-4
Ghiani, A., Maniglia, M., Battaglini, L., and Ronconi, L. (2021). Binding mechanisms in visual perception and their link with neural oscillations: a review of evidence from tacs. Front. Psychol. 12, 643677. doi:10.3389/fpsyg.2021.643677
Guna, J., Geršak, G., Humar, I., Krebl, M., Orel, M., Lu, H., et al. (2020). Virtual reality sickness and challenges behind different technology and content settings. Mob. Netw. Appl. 25, 1436–1445. doi:10.1007/s11036-019-01373-w
Herweg, N. A., Apitz, T., Leicht, G., Mulert, C., Fuentemilla, L., and Bunzeck, N. (2016). Theta-alpha oscillations bind the hippocampus, prefrontal cortex, and striatum during recollection: evidence from simultaneous eeg–fmri. J. Neurosci. 36 (12), 3579–3587. doi:10.1523/jneurosci.3629-15.2016
Hidalgo, V. M., Díaz, J., Mpodozis, J., and Letelier, J.-C. (2022). Envelope analysis of the human alpha rhythm reveals eeg gaussianity. IEEE Trans. Biomed. Eng. 70 (4), 1242–1251. doi:10.1109/tbme.2022.3213840
Hilla, Y., Von Mankowski, J., Föcker, J., and Sauseng, P. (2020). Faster visual information processing in video gamers is associated with eeg alpha amplitude modulation. Front. Psychol. 11, 599788. doi:10.3389/fpsyg.2020.599788
Huberty, S., Desjardins, J., Collins, T., Elsabbagh, M., and O’Reilly, C. (2024). Pylossless: a non-destructive eeg processing pipeline. bioRxiv. doi:10.1101/2024.01.12.575323
Hwang, J.-U., Bang, J.-S., and Lee, S.-W. (2022). “Classification of motion sickness levels using multimodal biosignals in real driving conditions,” in 2022 IEEE international conference on systems, man, and cybernetics (SMC), 9-12 October 2022, (IEEE), 1304–1309.
Irmak, T., Pool, D. M., Winkel, K. N., and Happee, R. (2023). Validating models of sensory conflict and perception for motion sickness prediction. Biol. Cybern. 117 (3), 185–209. doi:10.1007/s00422-023-00959-8
Islam, R., Desai, K., and Quarles, J. (2021). “Cybersickness prediction from integrated hmd’s sensors: a multimodal deep fusion approach using eye-tracking and head-tracking data,” in 2021 IEEE international symposium on mixed and augmented reality (ISMAR), 4-8 October 2021, (IEEE), 31–40.
Islam, R., Desai, K., and Quarles, J. (2022). “Towards forecasting the onset of cybersickness by fusing physiological, head-tracking and eye-tracking with multimodal deep fusion network,” in 2022 IEEE international symposium on mixed and augmented reality (ISMAR), 17-21 October 2022, (IEEE), 121–130.
Islam, R., Lee, Y., Jaloli, M., Muhammad, I., Zhu, D., Rad, P., et al. (2020). “Automatic detection and prediction of cybersickness severity using deep neural networks from user’s physiological signals,” in 2020 IEEE international symposium on mixed and augmented reality (ISMAR), 9-13 November 2020, (IEEE), 400–411.
Jakus, G., Sodnik, J., and Miljković, N. (2022). Electrogastrogram-derived features for automated sickness detection in driving simulator. Sensors 22 (22), 8616. doi:10.3390/s22228616
Jang, K.-M., Kwon, M., Nam, S. G., Kim, D., and Lim, H. K. (2022). Estimating objective (eeg) and subjective (ssq) cybersickness in people with susceptibility to motion sickness. Appl. Ergon. 102, 103731. doi:10.1016/j.apergo.2022.103731
Jensen, O., and Mazaheri, A. (2010). Shaping functional architecture by oscillatory alpha activity: gating by inhibition. Front. Hum. Neurosci. 4, 186. doi:10.3389/fnhum.2010.00186
Jeong, D., Jeong, M., Yang, U., and Han, K. (2022). Eyes on me: investigating the role and influence of eye-tracking data on user modeling in virtual reality. PLoS One 17 (12), 0278970. doi:10.1371/journal.pone.0278970
Jeong, D., Paik, S., Noh, Y., and Han, K. (2023). Mac: multimodal, attention-based cybersickness prediction modeling in virtual reality. Virtual Real. 27 (3), 2315–2330. doi:10.1007/s10055-023-00804-0
Jeong, D., Yoo, S., and Yun, J. (2019). “Cybersickness analysis with eeg using deep learning algorithms,” in 2019 IEEE conference on virtual reality and 3D user interfaces (VR), 23-27 March 2019, (IEEE), 827–835.
Jerbi, K., Vidal, J. R., Ossandon, T., Dalal, S. S., Jung, J., Hoffmann, D., et al. (2010). Category-specific visual responses: an intracranial study comparing gamma, beta, alpha, and ERP response selectivity. Front. Syst. Neurosci. 4, 195. doi:10.3389/fnhum.2010.00195
Jin, W., Fan, J., Gromala, D., and Pasquier, P. (2018). “Automatic prediction of cybersickness for virtual reality games,” in 2018 IEEE games, entertainment, media conference (GEM), 15-17 Aug. 2018, (IEEE), 1–9.
Jin, X., Wang, J., Liu, L., and Lin, Y. (2023). Uncertainty-aware denoising network for artifact removal in eeg signals. IEEE Trans. Neural Syst. Rehabilitation Eng. 31, 4470–4480. doi:10.1109/tnsre.2023.3330963
Katsigiannis, S., Willis, R., and Ramzan, N. (2018). A qoe and simulator sickness evaluation of a smart-exercise-bike virtual reality system via user feedback and physiological signals. IEEE Trans. Consumer Electron. 65 (1), 119–127. doi:10.1109/tce.2018.2879065
Keshavarz, B., and Hecht, H. (2011). Validating an efficient method to quantify motion sickness. Hum. factors 53 (4), 415–426. doi:10.1177/0018720811403736
Kim, A. (2024). “Exploring the relationship among cybersickness, locomotion method, and heart rate variability when navigating a virtual environment,” in 2024 IEEE international conference on artificial intelligence and eXtended and virtual reality (AIxVR), 17-19 January 2024, (IEEE), 215–220.
Kim, J., Luu, W., and Palmisano, S. (2020). Multisensory integration and the experience of scene instability, presence and cybersickness in virtual environments. Comput. Hum. Behav. 113, 106484. doi:10.1016/j.chb.2020.106484
Kim, J.-Y., Son, J.-B., Leem, H.-S., and Lee, S.-H. (2019). Psychophysiological alteration after virtual reality experiences using smartphone-assisted head mount displays: an eeg-based source localization study. Appl. Sci. 9 (12), 2501. doi:10.3390/app9122501
Kim, Y. S., Won, J., Jang, S.-W., and Ko, J. (2022). Effects of cybersickness caused by head-mounted display–based virtual reality on physiological responses: cross-sectional study. JMIR Serious Games 10 (4), 37938. doi:10.2196/37938
Klados, M. A., Papadelis, C., Braun, C., and Bamidis, P. D. (2011). Reg-ica: a hybrid methodology combining blind source separation and regression techniques for the rejection of ocular artifacts. Biomed. Signal Process. Control 6 (3), 291–300. doi:10.1016/j.bspc.2011.02.001
Klug, M., and Gramann, K. (2021). Identifying key factors for improving ica-based decomposition of eeg data in mobile and stationary experiments. Eur. J. Neurosci. 54 (12), 8406–8420. doi:10.1111/ejn.14992
Kopell, N., Kramer, M. A., Malerba, P., and Whittington, M. A. (2010). Are different rhythms good for different functions? Front. Hum. Neurosci. 4, 187. doi:10.3389/fnhum.2010.00187
Koslucher, F., Haaland, E., Malsch, A., Webeler, J., and Stoffregen, T. A. (2015). Sex differences in the incidence of motion sickness induced by linear visual oscillation. Aerosp. Med. Hum. Perform. 86 (9), 787–793. doi:10.3357/amhp.4243.2015
Koutitas, G., Smith, S., and Lawrence, G. (2021). Performance evaluation of ar/vr training technologies for ems first responders. Virtual Real. 25 (1), 83–94. doi:10.1007/s10055-020-00436-8
Krokos, E., and Varshney, A. (2022). Quantifying vr cybersickness using eeg. Virtual Real. 26 (1), 77–89. doi:10.1007/s10055-021-00517-2
Li, G., McGill, M., Brewster, S., Chen, C. P., Anguera, J. A., Gazzaley, A., et al. (2021). Multimodal biosensing for vestibular network-based cybersickness detection. IEEE J. Biomed. Health Inf. 26 (6), 2469–2480. doi:10.1109/jbhi.2021.3134024
Li, M., Pan, J., Gao, Y., Shen, Y., Luo, F., Dai, J., et al. (2022). Neurophysiological and subjective analysis of vr emotion induction paradigm. IEEE Trans. Vis. Comput. Graph. 28 (11), 3832–3842. doi:10.1109/tvcg.2022.3203099
Li, Y., Hu, X., Yu, Y., Zhao, K., Saalmann, Y. B., and Wang, L. (2018). Feedback from human posterior parietal cortex enables visuospatial category representations as early as primary visual cortex. Brain Behav. 8 (1), 00886. doi:10.1002/brb3.886
Liang, W.-K., Tseng, P., Yeh, J.-R., Huang, N. E., and Juan, C.-H. (2021). Frontoparietal beta amplitude modulation and its interareal cross-frequency coupling in visual working memory. Neuroscience 460, 69–87. doi:10.1016/j.neuroscience.2021.02.013
Liao, C.-Y., Tai, S.-K., Chen, R.-C., and Hendry, H. (2020). Using eeg and deep learning to predict motion sickness under wearing a virtual reality device. Ieee Access 8, 126784–126796. doi:10.1109/access.2020.3008165
Limanowski, J., and Friston, K. (2020). Attentional modulation of vision versus proprioception during action. Cereb. Cortex 30 (3), 1637–1648. doi:10.1093/cercor/bhz192
Liu, M., Yang, B., Xu, M., Zan, P., Chen, L., and Xia, X. (2024). Exploring quantitative assessment of cybersickness in virtual reality using eeg signals and a cnn-eca-lstm network. Displays 81, 102602. doi:10.1016/j.displa.2023.102602
Lopes, F., Leal, A., Pinto, M. F., Dourado, A., Schulze-Bonhage, A., Dümpelmann, M., et al. (2023). Removing artefacts and periodically retraining improve performance of neural network-based seizure prediction models. Sci. Rep. 13 (1), 5918. doi:10.1038/s41598-023-30864-w
Lopes, P., Tian, N., and Boulic, R. (2020). “Eye thought you were sick! exploring eye behaviors for cybersickness detection in vr,” in Proceedings of the 13th ACM SIGGRAPH Conference on Motion, Interaction and Games, October 16–18, 2020, New York, NY, United States: Association for Computing Machinery, 1–10.
Lu, C.-F., Teng, S., Hung, C.-I., Tseng, P.-J., Lin, L.-T., Lee, P.-L., et al. (2011). Reorganization of functional connectivity during the motor task using eeg time–frequency cross mutual information analysis. Clin. Neurophysiol. 122 (8), 1569–1579. doi:10.1016/j.clinph.2011.01.050
Maples-Keller, J. L., Yasinski, C., Manjin, N., and Rothbaum, B. O. (2017). Virtual reality-enhanced extinction of phobias and post-traumatic stress. Neurotherapeutics 14, 554–563. doi:10.1007/s13311-017-0534-y
Meigen, T., and Bach, M. (1999). On the statistical significance of electrophysiological steady-state responses. Doc. Ophthalmol. 98, 207–232. doi:10.1023/a:1002097208337
Michel, C. M., and Brunet, D. (2019). Eeg source imaging: a practical review of the analysis steps. Front. neurology 10, 325. doi:10.3389/fneur.2019.00325
Mills, B., Dykstra, P., Hansen, S., Miles, A., Rankin, T., Hopper, L., et al. (2020). Virtual reality triage training can provide comparable simulation efficacy for paramedicine students compared to live simulation-based scenarios. Prehospital Emerg. Care 24 (4), 525–536. doi:10.1080/10903127.2019.1676345
Moinnereau, M.-A., and Falk, T. (2024). “Cybersickness marker prediction using a biosensors-instrumented vr headset: a pilot study,” in 4th IEEE international conference on human-machine systems/ICHMS 2024, 15-17 May 2024.
Moss, J. D., and Muth, E. R. (2011). Characteristics of head-mounted displays and their effects on simulator sickness. Hum. factors 53 (3), 308–319. doi:10.1177/0018720811405196
Mullen, T., Kothe, C., Chi, Y. M., Ojeda, A., Kerth, T., Makeig, S., et al. (2013). “Real-time modeling and 3d visualization of source dynamics and connectivity using wearable eeg,” in 2013 35th Annual International Conference of the IEEE Engineering in Medicine and Biology Society, 3–7 July 2013, (IEEE: EMBC), 2184–2187.
Munafo, J., Diedrick, M., and Stoffregen, T. A. (2017). The virtual reality head-mounted display oculus rift induces motion sickness and is sexist in its effects. Exp. brain Res. 235, 889–901. doi:10.1007/s00221-016-4846-7
Muñoz, J. E., Quintero, L., Stephens, C. L., and Pope, A. T. (2020). A psychophysiological model of firearms training in police officers: a virtual reality experiment for biocybernetic adaptation. Front. Psychol. 11, 683. doi:10.3389/fpsyg.2020.00683
Nam, S., Jang, K.-M., Kwon, M., Lim, H. K., and Jeong, J. (2022). Electroencephalogram microstates and functional connectivity of cybersickness. Front. Hum. Neurosci. 16, 857768. doi:10.3389/fnhum.2022.857768
Neske, G. T., and Connors, B. W. (2016). Synchronized gamma-frequency inhibition in neocortex depends on excitatory-inhibitory interactions but not electrical synapses. J. neurophysiology 116 (2), 351–368. doi:10.1152/jn.00071.2016
Nunez, P. L., and Srinivasan, R. (2010). Scale and frequency chauvinism in brain dynamics: too much emphasis on gamma band oscillations. Brain Struct. Funct. 215 (2), 67–71. doi:10.1007/s00429-010-0277-6
Nürnberger, M., Klingner, C., Witte, O. W., and Brodoehl, S. (2021). Mismatch of visual-vestibular information in virtual reality: is motion sickness part of the brains attempt to reduce the prediction error? Front. Hum. Neurosci. 15, 757735. doi:10.3389/fnhum.2021.757735
Ozkan, A., Uyan, U., and Celikcan, U. (2023). Effects of speed, complexity and stereoscopic vr cues on cybersickness examined via eeg and self-reported measures. Displays 78, 102415. doi:10.1016/j.displa.2023.102415
Palva, S., and Palva, J. M. (2012). Discovering oscillatory interaction networks with m/eeg: challenges and breakthroughs. Trends cognitive Sci. 16 (4), 219–230. doi:10.1016/j.tics.2012.02.004
Pedregosa, F., Varoquaux, G., Gramfort, A., Michel, V., Thirion, B., Grisel, O., et al. (2011). Scikit-learn: machine learning in Python. J. Mach. Learn. Res. 12, 2825–2830.
Pion-Tonachini, L., Kreutz-Delgado, K., and Makeig, S. (2019). Iclabel: an automated electroencephalographic independent component classifier, dataset, and website. NeuroImage 198, 181–197. doi:10.1016/j.neuroimage.2019.05.026
Popov, T., Popova, P., Harkotte, M., Awiszus, B., Rockstroh, B., and Miller, G. A. (2018). Cross-frequency interactions between frontal theta and posterior alpha control mechanisms foster working memory. NeuroImage 181, 728–733. doi:10.1016/j.neuroimage.2018.07.067
Qu, C., Che, X., Ma, S., and Zhu, S. (2022). Bio-physiological-signals-based vr cybersickness detection. CCF Trans. Pervasive Comput. Interact. 4 (3), 268–284. doi:10.1007/s42486-022-00103-8
Rejer, I., and Górski, P. (2015). “Benefits of ica in the case of a few channel eeg,” in 2015 37th annual international conference of the IEEE engineering in medicine and biology society (EMBC), 25-29 Aug. 2015, (IEEE), 7434–7437.
Reyero Lobo, P., and Perez, P. (2022). “Heart rate variability for non-intrusive cybersickness detection,” in Proceedings of the 2022 ACM International Conference on Interactive Media Experiences, June 22 - 24, 2022, New York, NY, United States: Association for Computing Machinery, 221–228.
Riccio, G. E., and Stoffregen, T. A. (1991). An ecological theory of motion sickness and postural instability. Ecol. Psychol. 3 (3), 195–240. doi:10.1207/s15326969eco0303_2
Richter, C. G., Thompson, W. H., Bosman, C. A., and Fries, P. (2017). Top-down beta enhances bottom-up gamma. J. Neurosci. 37 (28), 6698–6711. doi:10.1523/jneurosci.3771-16.2017
Risi, D., and Palmisano, S. (2019). Effects of postural stability, active control, exposure duration and repeated exposures on hmd induced cybersickness. Displays 60, 9–17. doi:10.1016/j.displa.2019.08.003
Robbins, K. A., Touryan, J., Mullen, T., Kothe, C., and Bigdely-Shamlo, N. (2020). How sensitive are eeg results to preprocessing methods: a benchmarking study. IEEE Trans. neural Syst. rehabilitation Eng. 28 (5), 1081–1090. doi:10.1109/tnsre.2020.2980223
Rojas-Sánchez, M. A., Palos-Sánchez, P. R., and Folgado-Fernández, J. A. (2023). Systematic literature review and bibliometric analysis on virtual reality and education. Educ. Inf. Technol. 28 (1), 155–192. doi:10.1007/s10639-022-11167-5
Rolls, E. (2020). “The parietal cortex, spatial functions, and navigation,” in Brain computations, 363–378.
Rolnick, A., and Lubow, R. (1991). Why is the driver rarely motion sick? the role of controllability in motion sickness. Ergonomics 34 (7), 867–879. doi:10.1080/00140139108964831
Roy, Y., Banville, H., Albuquerque, I., Gramfort, A., Falk, T. H., and Faubert, J. (2019). Deep learning-based electroencephalography analysis: a systematic review. J. neural Eng. 16 (5), 051001. doi:10.1088/1741-2552/ab260c
Rushworth, M. F., Krams, M., and Passingham, R. E. (2001). The attentional role of the left parietal cortex: the distinct lateralization and localization of motor attention in the human brain. J. cognitive Neurosci. 13 (5), 698–710. doi:10.1162/089892901750363244
Sadiya, S., Alhanai, T., and Ghassemi, M. M. (2021). “Artifact detection and correction in eeg data: a review,” in 2021 10th international IEEE/EMBS conference on neural engineering (NER), 4-6 May 2021, (IEEE), 495–498.
Sauseng, P., Klimesch, W., Stadler, W., Schabus, M., Doppelmayr, M., Hanslmayr, S., et al. (2005). A shift of visual spatial attention is selectively associated with human eeg alpha activity. Eur. J. Neurosci. 22 (11), 2917–2926. doi:10.1111/j.1460-9568.2005.04482.x
Sawada, Y., Itaguchi, Y., Hayashi, M., Aigo, K., Miyagi, T., Miki, M., et al. (2020). Effects of synchronised engine sound and vibration presentation on visually induced motion sickness. Sci. Rep. 10 (1), 7553. doi:10.1038/s41598-020-64302-y
Sepich, N. C., Jasper, A., Fieffer, S., Gilbert, S. B., Dorneich, M. C., and Kelly, J. W. (2022). The impact of task workload on cybersickness. Front. Virtual Real. 3, 943409. doi:10.3389/frvir.2022.943409
Setiowati, N., Wijayanto, T., and Trapsilawati, F. (2020). “Identifying cybersickness when wearing a head-mounted display through heart rate variability data,” IOP Conf. Ser, Mater. Sci. Eng., IOP Conference Series: Materials Science and Engineering, 31 October 2019, Makassar, Indonesia, Bristol, United Kingdom: IOP Publishing, 885, 012069 doi:10.1088/1757-899x/885/1/012069
Shimada, S., Ikei, Y., Nishiuchi, N., and Yem, V. (2023a). “Study of cybersickness prediction in real time using eye tracking data,” in 2023 IEEE conference on virtual reality and 3D user interfaces abstracts and workshops (VRW), 25-29 March 2023, (IEEE), 871–872.
Shimada, S., Pannattee, P., Ikei, Y., Nishiuchi, N., and Yem, V. (2023b). High-frequency cybersickness prediction using deep learning techniques with eye-related indices. IEEE Access 11, 95825–95839. doi:10.1109/access.2023.3312216
Silberstein, R. (2006). “Dynamic sculpting of brain functional connectivity and mental rotation aptitude in Neuper C,” in Event-related dynamics of brain oscillations. Editor W. Klimesch (Amsterdam, Netherlands: Elsevier. Google Scholar), 63–78.
Souchet, A. D., Lourdeaux, D., Pagani, A., and Rebenitsch, L. (2023). A narrative review of immersive virtual reality’s ergonomics and risks at the workplace: cybersickness, visual fatigue, muscular fatigue, acute stress, and mental overload. Virtual Real. 27 (1), 19–50. doi:10.1007/s10055-022-00672-0
Stanney, K., Lawson, B. D., Rokers, B., Dennison, M., Fidopiastis, C., Stoffregen, T., et al. (2020). Identifying causes of and solutions for cybersickness in immersive technology: reformulation of a research and development agenda. Int. J. Human–Computer Interact. 36 (19), 1783–1803. doi:10.1080/10447318.2020.1828535
Stecuła, K. (2022). Virtual reality applications market analysis—on the example of steam digital platform. Informatics 9, 100. doi:10.3390/informatics9040100
Stern, R. (2002). The psychophysiology of nausea. Acta Biol. Hung. 53 (4), 589–600. doi:10.1556/abiol.53.2002.4.17
Summerfield, C., and Mangels, J. A. (2005). Coherent theta-band eeg activity predicts item-context binding during encoding. Neuroimage 24 (3), 692–703. doi:10.1016/j.neuroimage.2004.09.012
Sun, C., and Mou, C. (2023). Survey on the research direction of eeg-based signal processing. Front. Neurosci. 17, 1203059. doi:10.3389/fnins.2023.1203059
Tajmirriahi, M., Amini, Z., Rabbani, H., and Kafieh, R. (2022). An interpretable convolutional neural network for p300 detection: analysis of time frequency features for limited data. IEEE Sensors J. 22 (9), 8685–8692. doi:10.1109/jsen.2022.3159475
Tanner, D., Norton, J. J., Morgan-Short, K., and Luck, S. J. (2016). On high-pass filter artifacts (they’re real) and baseline correction (it’sa good idea) in erp/ermf analysis. J. Neurosci. methods 266, 166–170. doi:10.1016/j.jneumeth.2016.01.002
Thatcher, R., Soler, E., North, D., and Otte, G. (2020). Independent components analysis “artifact correction” distorts eeg phase in artifact free segments. J. Neurol. Neurobiol. 6 (4), 5–7. doi:10.16966/2379-7150.172
Thompson, T., Steffert, T., Ros, T., Leach, J., and Gruzelier, J. (2008). Eeg applications for sport and performance. Methods 45 (4), 279–288. doi:10.1016/j.ymeth.2008.07.006
Trajin, B., Chabert, M., Regnier, J., and Faucher, J. (2008). “Space vector analysis for the diagnosis of high frequency amplitude and phase modulations in induction motor stator current,” in 5th international conference on condition monitoring and machinery failure prevention technologies-CM/MFPT 200810, 1–8.
Trambaiolli, L. R., Cassani, R., and Falk, T. H. (2020). “Eeg spectro-temporal amplitude modulation as a measurement of cortical hemodynamics: an eeg-fnirs study,” in 2020 42nd annual international conference of the IEEE engineering in medicine and biology society (EMBC), 20-24 July 2020, (IEEE), 3481–3484.
Trambaiolli, L. R., Falk, T. H., Fraga, F. J., Anghinah, R., and Lorena, A. C. (2011). “Eeg spectro-temporal modulation energy: a new feature for automated diagnosis of alzheimer’s disease,” in 2011 Annual International Conference of the IEEE Engineering in Medicine and Biology Society (IEEE), 3828–3831.
Tsimenidis, S. (2020). Limitations of deep neural networks: a discussion of g. marcus’ critical appraisal of deep learning. arXiv Prepr. arXiv:2012, 15754. doi:10.48550/arXiv.2012.15754
Walter, E., and Dassonville, P. (2008). Visuospatial contextual processing in the parietal cortex: an fmri investigation of the induced roelofs effect. Neuroimage 42 (4), 1686–1697. doi:10.1016/j.neuroimage.2008.06.016
Wang, J., Liang, H.-N., Monteiro, D., Xu, W., and Xiao, J. (2022). Real-time prediction of simulator sickness in virtual reality games. IEEE Trans. Games 15 (2), 252–261. doi:10.1109/tg.2022.3178539
Wu, S., and Lin, T. (2011). “Exploring the use of physiology in adaptive game design,” in 2011 international conference on consumer electronics, communications and networks (CECNet), 16-18 April 2011, (IEEE), 1280–1283.
Yang, A. H. X., Kasabov, N., and Cakmak, Y. O. (2022a). Machine learning methods for the study of cybersickness: a systematic review. Brain Inf. 9 (1), 24. doi:10.1186/s40708-022-00172-6
Yang, S., Hwang, H.-S., Zhu, B.-H., Chen, J., Enkhzaya, G., Wang, Z.-J., et al. (2022b). Evaluating the alterations induced by virtual reality in cerebral small-world networks using graph theory analysis with electroencephalography. Brain Sci. 12 (12), 1630. doi:10.3390/brainsci12121630
Yildirim, C. (2020). “A review of deep learning approaches to eeg-based classification of cybersickness in virtual reality,” in 2020 IEEE international conference on artificial intelligence and virtual reality (AIVR), 14-18 Dec. 2020, (IEEE), 351–357.
Yin, J., and Chen, J. D. (2013). Electrogastrography: methodology, validation and applications. J. Neurogastroenterol. Motil. 19 (1), 5–17. doi:10.5056/jnm.2013.19.1.5
Yu, J., Li, C., Lou, K., Wei, C., and Liu, Q. (2022). Embedding decomposition for artifacts removal in eeg signals. J. Neural Eng. 19 (2), 026052. doi:10.1088/1741-2552/ac63eb
Yue, K., and Wang, D. (2019). Eeg-based 3d visual fatigue evaluation using cnn. Electronics 8 (11), 1208. doi:10.3390/electronics8111208
Zao, J. K., Jung, T.-P., Chang, H.-M., Gan, T.-T., Wang, Y.-T., Lin, Y.-P., et al. (2016). “Augmenting vr/ar applications with eeg/eog monitoring and oculo-vestibular recoupling,” in Foundations of augmented cognition: neuroergonomics and operational neuroscience: 10th international conference, AC 2016, held as part of HCI international 2016, Toronto, ON, Canada, july 17-22, 2016, proceedings, Part I 10, Toronto, ON, Canada, July 17-22, 2016, (Springer), 121–131.
Zhou, X., Liu, C., Zhai, L., Jia, Z., Guan, C., and Liu, Y. (2023). Interpretable and robust ai in eeg systems: a survey. arXiv Prepr. arXiv:2304.10755. doi:10.48550/arXiv.2304.10755
Glossary
AAR Automatic Artifact Removal
AM Amplitude Modulation
AM-BCPL Amplitude Modulation inter-band coupling
AM-CCPL Amplitude Modulation inter-channel coupling
AMP Amplitude Modulation Power
ASR artifact Subspace Reconstruction
BCPL Inter-band coupling
BFT Band-filtered time series
CCPL Inter-channel coupling
EOG Electrooculography
FIR Finite impulse response
FMS Fast Motion Sickness
ICA Independent Component Analysis
PSD Power Spectral Density
SNR Signal-to-Noise Ratio
SSQ Simulator Sickness Questionnaire
SVR Support Vector Regressor
VR Virtual Reality
Keywords: cybersickness, virtual reality, electroencephalography, amplitude modulation, artifact removal
Citation: Rosanne O, Benesch D, Kratzig G, Paré S, Bolt N and Falk TH (2025) To pre-process or not to pre-process? On the role of EEG enhancement for cybersickness characterization and the importance of amplitude modulation features. Front. Virtual Real. 6:1468971. doi: 10.3389/frvir.2025.1468971
Received: 22 July 2024; Accepted: 07 January 2025;
Published: 30 January 2025.
Edited by:
J. Adam Jones, Mississippi State University, United StatesReviewed by:
Diego Vilela Monteiro, ESIEA University, FranceThomas A. Stoffregen, University of Minnesota Twin Cities, United States
Copyright © 2025 Rosanne, Benesch, Kratzig, Paré, Bolt and Falk. This is an open-access article distributed under the terms of the Creative Commons Attribution License (CC BY). The use, distribution or reproduction in other forums is permitted, provided the original author(s) and the copyright owner(s) are credited and that the original publication in this journal is cited, in accordance with accepted academic practice. No use, distribution or reproduction is permitted which does not comply with these terms.
*Correspondence: Tiago H. Falk, dGlhZ28uZmFsa0BpbnJzLmNh
†ORCID: Olivier Rosanne, orcid.org/0009-0002-4445-3469; Danielle Benesch, orcid.org/0000-0002-2002-2325; Gregory Kratzig, orcid.org/0000-0003-1604-3729; Simon Paré, orcid.org/0009-0009-0759-5899; Nicole Bolt, orcid.org/0000-0002-2498-0555; Tiago H. Falk, orcid.org/0000-0002-5739-2514