- Department of Mathematics, Texas State University, San Marcos, TX, United States
As a driving force of the fourth industrial revolution, deep neural networks are now widely used in various areas of science and technology. Despite the success of deep neural networks in making accurate predictions, their interpretability remains a mystery to researchers. From a statistical point of view, how to conduct statistical inference (e.g., hypothesis testing) based on deep neural networks is still unknown. In this paper, goodness-of-fit statistics are proposed based on commonly used ReLU neural networks, and their potential to test significant input features is explored. A simulation study demonstrates that the proposed test statistic has higher power compared to the commonly used t-test in linear regression when the underlying signal is nonlinear, while controlling the type I error at the desired level. The testing procedure is also applied to gene expression data from the Alzheimer’s Disease Neuroimaging Initiative (ADNI).
Introduction
Since the creation of backpropagation, neural networks have regained their popularity, and deep neural networks are now the fundamental building blocks of sophisticated artificial intelligence. For instance, in computer vision, convolutional neural networks (CNNs) (LeCun, 1989) are commonly used for object detection, while recurrent neural networks (RNNs) (Rumelhart et al., 1988), or more recently, transformers (Vaswani et al., 2017) play vital roles in natural language processing.
One of the main reasons for the superior performance of deep learning models is that neural networks are universal approximators. In fact, in the early 1990s, various research established the universal approximation property for shallow neural networks, as well as their derivatives with squashing activation functions—functions that are monotonically increasing and approach 0 and 1 when the variable tends to negative and positive infinity, respectively (Cybenko, 1989; Hornik et al., 1989; Pinkus, 1999) showed that any neural network has the universal approximation property as long as the activation function is not a polynomial. Recently, similar results have also been established for deep neural networks with the Rectified Linear Unit (ReLU) activation function (Nair and Hinton, 2010). Another important characteristic of shallow neural networks is that the approximation rate to certain smooth functions is independent of the dimensionality of the input features (Barron, 1993), making neural networks a great candidate to avoid curse of dimensionality. For example (Shen et al., 2023; Braun et al., 2024), have shown that the rate of convergence of shallow neural networks is independent of the input dimension when the underlying function resides in the Barron space.
Such nice approximation properties provide deep neural networks with great potential for modeling complex genotype-phenotype relationships, and a lot of research has been done in this direction. For instance, a deep learning method known as DANN (Quang et al., 2014) was proposed to make predictions on the deleteriousness of genetic variants. In terms of predicting effects of the non-coding regions, DanQ (Quang and Xie, 2016) integrated CNNs and Bidirectional Long Short-Term Memory networks to capture different aspects of DNA sequences and outperformed other similar methods in various metrics. More recently (Zhou et al., 2023), used deep neural networks to model Alzheimer’s disease (AD) polygenic risk and the deep learning methods outperform traditional methods such as weighted polygenic risk score model and LASSO (Tibshirani, 1996).
Despite empirical and theoretical evidence on the powerful prediction performance of deep neural networks, an overlooked problem in deep learning is the interpretability of these models. From a statistical perspective, the interpretability of deep learning models can be improved if we know how to conduct statistical inference using deep neural networks. In recent years, several works have been done in this direction. For example (Horel and Giesecke, 2019), proposed a significant test based on shallow neural network using empirical process theory. However, the asymptotic distribution of the test statistic is hard to compute. Recently, Shen et al. (2021) and Shen et al. (2022) proposed two testing procedures for shallow neural networks with sigmoid activation function. Both of these testing procedures are easier to implement and have better performance compared to t-test or F test in linear regression. Dai et al. (2024) also proposed a black box testing procedure to test conditional independence between features and response. Below we would like to point out several challenges one needs to conquer in order to develop hypotheses testing based on deep learning models:
1. Classical statistical hypothesis testing techniques in parametric models are difficult to apply in DNNs. One reason is that the parameters (weights and biases) are unidentifiable in general (Fukumizu, 2003), making them hard to interpret. For example, in linear regression, testing the significance of a covariate is equivalent to testing the coefficient attached to it is equal to 0 or not. However, in a DNN, there are many ways to make the covariate vanish in the model. As an example one can let all the weights directly attached to an input feature be 0 or one can also let all the weights for each hidden-to-output unit to be 0.
2. The number of tuning parameters to train a DNN is large. There is no general guideline on how to choose the number of layers and the number of hidden units in each layer to achieve desirable performance in a DNN. Additionally, in the training process, how to wisely select the learning rate and the number of iterations needed is also unclear. Without carefully choosing these tuning parameters, it is likely that the trained DNN will overfit the data. Although overfitting might be acceptable for prediction, it generally needs to be avoided when conducting statistical hypothesis testing.
3. There is lack of theoretical guarantees to ensure the performance of DNNs as tools in genetic association studies. Current theories on DNNs mainly focus on evaluating the generalization errors of DNNs. Many results available are based on the assumption of high-dimensional regime, where the sample size and the number of features are of the same order, or in the polynomial regime, where the sample size grows polynomially as the number of features (Mei et al., 2022; Mei and Montanari, 2022). These conditions are easily satisfied in tasks like image classification, where one can use the data augmentation strategy to manually generate new samples. In genetic studies, however, researchers usually face a limited sample size but a huge number of genetic variants, making those results less attractive in genetic studies.
In this paper, we proposed a goodness-of-fit test based on deep ReLU neural networks, extending the work of (Shen et al., 2021). The rest of the paper is organized as follows: Section 2 provides a brief introduction to deep neural networks, followed by the proposed goodness-of-fit test. Results from simulation studies and real data analyses are presented in Section 3, and conclusions are drawn in Section 4.
Methods
Deep neural networks (DNNs)
A perceptron (Rosenblatt, 1958) originated from mimicking the functionality of a neuron in the human brain. As shown in Figure 1A, the green node is the only computation unit in a perceptron, and it outputs a nonlinear transformation of the linear combination of input units. Such a transformation in a computation unit is often called an activation function. By stacking multiple perceptrons together, a shallow neural network, shown in Figure 1B, is obtained. The blue computation nodes in the middle are known as the hidden units. Each of them computes a nonlinear activation of a linear combination of the nodes in the input layer. The green nodes are known as output units, and each of them applies a linear or nonlinear activation to a linear combination of the outputs from the hidden units. When the number of hidden layers is more than one, as shown in Figure 1C, a deep neural network is obtained.

Figure 1. Architectures of (A) a perceptron, (B) a shallow neural network and (C) a deep neural network.
Throughout the remainder of the paper, we consider deep neural networks with only one output unit and linear activation is applied to the output unit. In particular, the output of a deep neural network with L hidden layer can be represented as
where
Goodness-of-fit test based on DNNs
We consider the following nonparametric regression model:
where
where
In addition, we assume that
Our goal is to develop a statistical hypothesis testing procedure to test whether certain covariates should be included in the model or not based on the deep neural network estimator
Following (Shen et al., 2021), we proposed to use a goodness-of-fit (GoF) type statistic for genetic association studies using DNNs. Here are the steps to construct the GoF test statistic.
1. Randomly partitioned the dataset into two parts. Denote
2. Use the first part is used to fit the data under the null hypothesis
3. The asymptotic distribution of
where
4. The GoF test statistic can be obtained by replacing
As mentioned in (Yatchew, 1992), a possible choice for
5. The p-value of the test is then calculated the same way as in a two-sided Z-test. In other words,
Network structures
A sufficient condition, as has been mentioned above, to ensure asymptotic normality is
• If
• If
• If both
Results
Simulation 1
In this section, we conducted a simulation study to evaluate our proposed test’s type I error and power. Since in genetic studies, linear models are the most used method to detect genetic associations, we compared our proposed test with the t-test in linear regression. Specifically, we generated the response variable via the following equation:
where
Since the first component does not involve in the simulation equation, it was used to evaluate the performance of the type I error of the proposed test. The null hypothesis to be tested is
• A shallow ReLU neural network with the number of hidden units being
• A deep ReLU neural network with the number of hidden layer being
• A deep ReLU neural network with
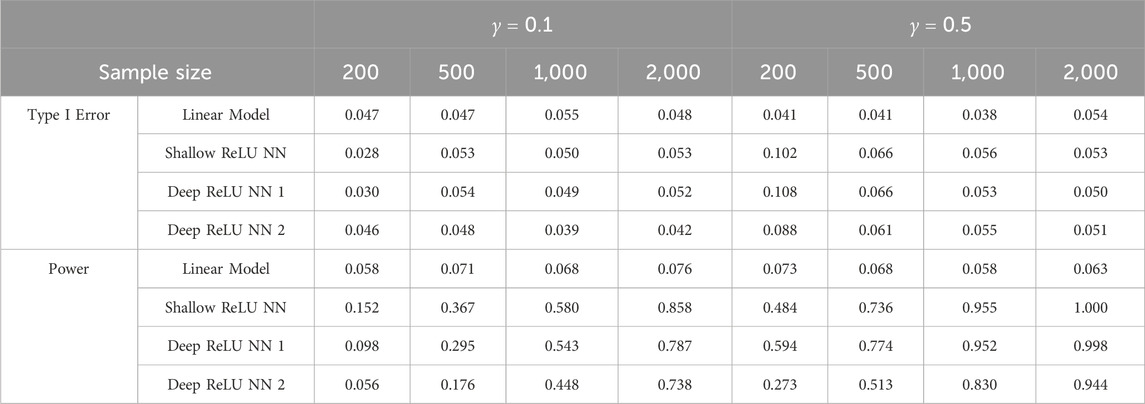
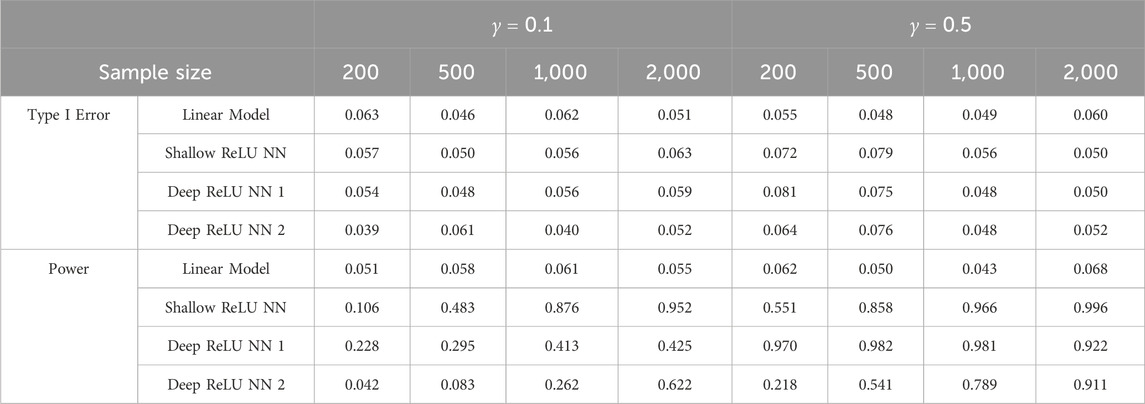
All the three network structures used here meet the requirement as mentioned in section 2.3. In the simulation, we considered sample sizes being 200, 500, 1,000 and 2000. The stochastic gradient descent algorithm was applied, and the batch size was determined so that 20 batches were used for each sample size. 200 epochs were used to run the stochastic gradient descent. To further alleviate the possible overfitting, we applied dropout to each hidden unit in the network with a dropout rate being 0.05. To obtain the empirical type I error and the empirical power, 1,000 Monte Carlo replications were conducted. Tables 1, 2 below summarize the simulation results.

Table 1. Comparisons between linear model and goodness-of-fit test based on ReLU neural networks under quadratic signal.

Table 2. Comparisons between linear model and goodness-of-fit test based on ReLU neural networks under cosine signal.
Based on Tables 1, 2, it can be easily seen that linear models and the proposed GoF test can control the empirical type I error very well at level 0.05, except that the proposed GoF test is slightly conservative when the sample size is small for the quadratic signal for the split-ratio
Simulation 2
In many situations, a response variable can be related to multiple causal variables. In this simulation, we investigated the performance of the proposed method under such a scenario. In particular, the response variable in this simulation was generated based on the following equation:
where all the covariates
In this scenario, the hypotheses of interest are

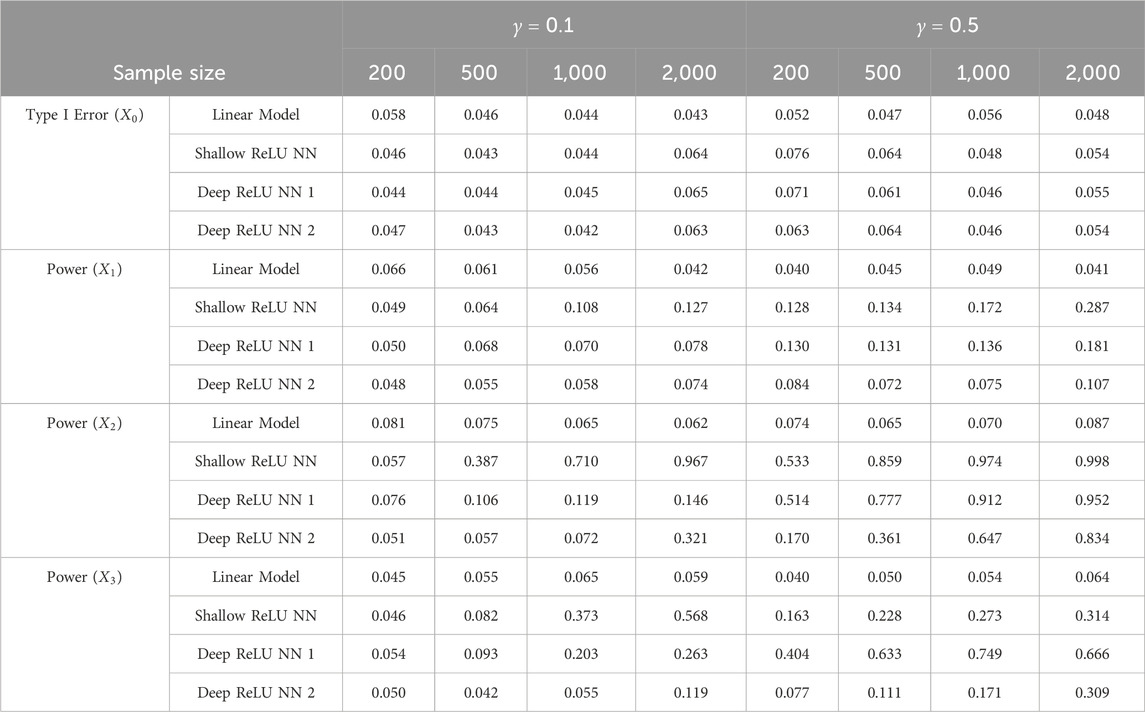
Table 3. Comparisons between linear model and goodness-of-fit test based on ReLU neural networks under multiple causal variables.
As we can see from Table 3, both linear model t-test and the proposed GoF test can control the type I error rate very well. Similar to what we saw from Simulation 1, even the underlying function contains multiple causal variables, the proposed GoF test can still detect the significance of the variables having nonlinear associations with the response variable.
Real data analyses
Alzheimer’s disease (AD) is one of the most common neurodegenerative diseases with a substantial genetic component (Karch et al., 2014; Sims et al., 2020). Therefore, it is of great importance to have an efficient method to screen the genetic components that are associated with AD pathogenesis so that early treatments can be applied for disease management (Zissimopoulos et al., 2015). To investigate the performance of our proposed GoF test in identifying AD-related genes, we applied our proposed method to the gene expression data from Alzheimer’s Disease Neuroimaging Initiative (ADNI).
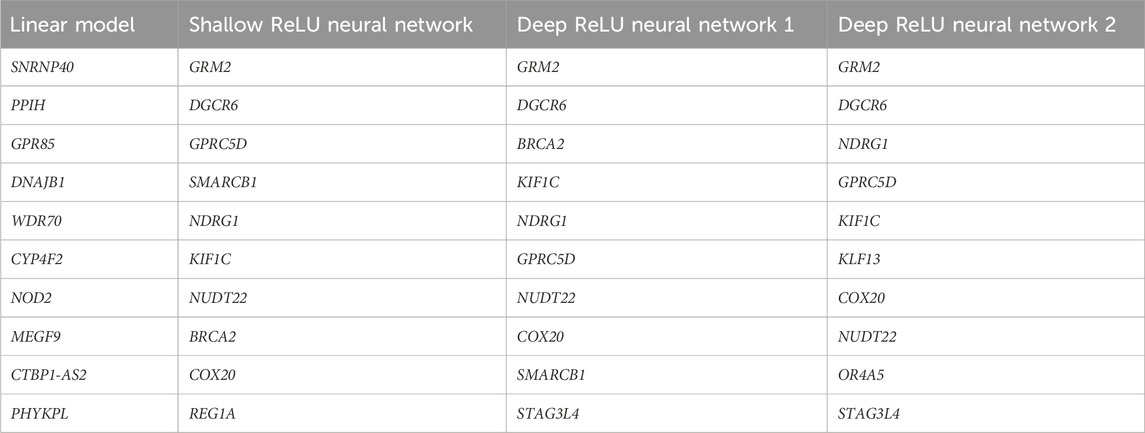
The hippocampus region plays a vital role in memory (Mu and Gage, 2011) and the shrinkage of hippocampus volume is an early symptom of AD (Schuff et al., 2009). Therefore, we chose the hippocampus volume as the phenotype in the real data analysis. After removing individuals with missing values for hippocampus volume and merging data from individuals having both gene expression information and hippocampus volume, a total of 464 individuals and 15,837 gene expressions were obtained. We then regressed the scaled hippocampus volume onto some important predictors including age, gender and education status. The residual obtained will be used as the response variable to train ReLU neural networks. The network structures and hyperparameters in the ReLU neural networks used in the real data analysis were the same as in the simulation studies. Table 4 summarizes the top 10 significant genes selected from t-test in linear model and the GoF tests based on ReLU neural networks.

Table 4. Top 10 significant genes selected from t-test in linear model and the GoF tests based on different ReLU neural network structures.
As can be seen from Table 4, the significant genes selected from the GoF test do not overlap with the ones selected from the linear models, and different network structures picked out similar genes. On the other hand, in (Shen et al., 2022), the top 10 significant genes selected using a testing procedure based on shallow sigmoid neural networks have large overlap with the ones selected from the linear model. This indicates that ReLU neural networks may be able to detect different signals that are hard to detect when using linear models or shallow sigmoid neural networks. Among them, the gene GRM2 is the top pick. Although the biological mechanism of the association between these genes and AD needs further validation, it is worth pointing out that a recent study has shown that the metabotropic glutamate receptor 2 (mGluR2), a protein encoded by the gene GRM2 plays a role in the pathogenesis of AD (Srivastava et al., 2020).
Discussions and conclusion
In this paper, we have proposed a goodness-of-fit test based on ReLU neural networks. The proposed test can be used to detect the significance of a predictor. Once the network structures are suitably chosen, the test statistics have an asymptotically normal distribution, making it easy to implement in practice. Simulation results have demonstrated that the proposed method can detect nonlinear underlying signals, and real data analysis also showed the potential that ReLU neural networks may detect signals that are hard to identify from linear models or even shallow sigmoid neural networks.
On the other hand, although the theoretical framework of the GoF test was proposed in this paper, in practice, the performance of a deep ReLU neural network also depends on the optimization algorithm used and the hyperparameters (e.g., learning rate, number of epochs, etc.) selected. So, there is still a gap in how the DNN can be used to conduct statistical inference on detecting significant variables. This will be our future work. In addition, while we mainly focused on testing a single variable (such as a gene expression in the real data analysis) in this paper, it is worthwhile to also investigate the performance of our proposed method on a wider range of datasets to evaluate the performance of the GoF test when testing a set of variants in a genetic region, such as in a chromosome or in a pathway. In addition, various significant testing procedures based on neural networks nowadays and as a future work, we plan to conduct a comprehensive comparison on these methods.
Data availability statement
The datasets presented in this study can be found in online repositories. The names of the repository/repositories and accession number(s) can be found in the article/supplementary material.
Author contributions
XS: Conceptualization, Formal Analysis, Methodology, Project administration, Supervision, Writing–original draft, Writing–review and editing. XW: Formal Analysis, Investigation, Software, Writing–original draft, Writing–review and editing.
Funding
The author(s) declare that no financial support was received for the research, authorship, and/or publication of this article.
Acknowledgments
ChatGPT 4o was used to correct grammatical mistakes.
Conflict of interest
The authors declare that the research was conducted in the absence of any commercial or financial relationships that could be construed as a potential conflict of interest.
Publisher’s note
All claims expressed in this article are solely those of the authors and do not necessarily represent those of their affiliated organizations, or those of the publisher, the editors and the reviewers. Any product that may be evaluated in this article, or claim that may be made by its manufacturer, is not guaranteed or endorsed by the publisher.
References
Barron, A. R. (1993). Universal approximation bounds for superpositions of a sigmoidal function. IEEE Trans. Inf. Theory 39, 930–945. doi:10.1109/18.256500
Braun, A., Kohler, M., Langer, S., and Walk, H. (2024). Convergence rates for shallow neural networks learned by gradient descent. Bernoulli 30, 475–502. doi:10.3150/23-BEJ1605
Cybenko, G. (1989). Approximation by superpositions of a sigmoidal function. Math. Control Signal Syst. 2, 303–314. doi:10.1007/BF02551274
Dai, B., Shen, X., and Pan, W. (2024). Significance tests of feature relevance for a black-box learner. IEEE Trans. Neural Netw. Learn. Syst. 35, 1898–1911. doi:10.1109/TNNLS.2022.3185742
Farrell, M. H., Liang, T., and Misra, S. (2021). Deep neural networks for estimation and inference. Econometrica 89, 181–213. doi:10.3982/ECTA16901
Fukumizu, K. (2003). Likelihood ratio of unidentifiable models and multilayer neural networks. Ann. Statistics 31, 833–851. doi:10.1214/aos/1056562464
Horel, E., and Giesecke, K., 2019. Towards explainable ai: significance tests for neural networks. arXiv preprint arXiv:1902.06021.
Hornik, K., Stinchcombe, M., and White, H. (1989). Multilayer feedforward networks are universal approximators. Neural Netw. 2, 359–366. doi:10.1016/0893-6080(89)90020-8
Karch, C. M., Cruchaga, C., and Goate, A. M. (2014). Alzheimer’s disease genetics: from the bench to the clinic. Neuron 83, 11–26. doi:10.1016/j.neuron.2014.05.041
LeCun, Y. (1989). “Generalization and network design strategies,” in Connectionism in perspective. Editors R. Pfeifer, Z. Schreter, F. Fogelman, and L. Steels
Mei, S., Misiakiewicz, T., and Montanari, A. (2022). Generalization error of random feature and kernel methods: hypercontractivity and kernel matrix concentration. Appl. Comput. Harmon. Analysis, Special Issue Harmon. Analysis Mach. Learn. 59, 3–84. doi:10.1016/j.acha.2021.12.003
Mei, S., and Montanari, A. (2022). The generalization error of random features regression: precise asymptotics and the double descent curve. Commun. Pure Appl. Math. 75, 667–766. doi:10.1002/cpa.22008
Mu, Y., and Gage, F. H. (2011). Adult hippocampal neurogenesis and its role in Alzheimer’s disease. Mol. Neurodegener. 6, 85. doi:10.1186/1750-1326-6-85
Nair, V., and Hinton, G. E. (2010). “Rectified linear units improve restricted Boltzmann machines,” in Proceedings of the 27th international conference on machine learning, Haifa, June 21, 2010, 807–814.
Pinkus, A. (1999). Approximation theory of the MLP model in neural networks. Acta Numer. 8, 143–195. doi:10.1017/S0962492900002919
Quang, D., Chen, Y., and Xie, X. (2014). DANN: a deep learning approach for annotating the pathogenicity of genetic variants. Bioinformatics 31, 761–763. doi:10.1093/bioinformatics/btu703
Quang, D., and Xie, X. (2016). DanQ: a hybrid convolutional and recurrent deep neural network for quantifying the function of DNA sequences. Nucleic acids Res. 44, e107. doi:10.1093/nar/gkw226
Rosenblatt, F. (1958). The perceptron: a probabilistic model for information storage and organization in the brain. Psychol. Rev. 65, 386–408. doi:10.1037/h0042519
Rumelhart, D. E., Hinton, G. E., and Williams, R. J. (1988). Learning representations by back-propagating errors. Cogn. Model. 5, 1. doi:10.1038/323533a0
Schuff, N., Woerner, N., Boreta, L., Kornfield, T., Shaw, L. M., and Trojanowski, J. Q.The Alzheimer’s; Disease Neuroimaging Initiative (2009). MRI of hippocampal volume loss in early Alzheimer’s disease in relation to ApoE genotype and biomarkers. Brain 132, 1067–1077. doi:10.1093/brain/awp007
Shen, X., Jiang, C., Sakhanenko, L., and Lu, Q. (2021). A goodness-of-fit test based on neural network sieve estimators. Statistics and Probab. Lett. 174, 109100. doi:10.1016/j.spl.2021.109100
Shen, X., Jiang, C., Sakhanenko, L., and Lu, Q. 2022. A sieve quasi-likelihood ratio test for neural networks with applications to genetic association studies. doi:10.48550/arXiv.2212.08255
Shen, X., Jiang, C., Sakhanenko, L., and Lu, Q. (2023). Asymptotic properties of neural network sieve estimators. J. Nonparametric Statistics 35, 839–868. doi:10.1080/10485252.2023.2209218
Sims, R., Hill, M., and Williams, J. (2020). The multiplex model of the genetics of Alzheimer’s disease. Nat. Neurosci. 23, 311–322. doi:10.1038/s41593-020-0599-5
Srivastava, A., Das, B., Yao, A. Y., and Yan, R. (2020). Metabotropic glutamate receptors in alzheimer’s disease synaptic dysfunction: therapeutic opportunities and hope for the future. J. Alzheimers Dis. 78, 1345–1361. doi:10.3233/JAD-201146
Tibshirani, R. (1996). Regression shrinkage and selection via the lasso. J. R. Stat. Soc. Ser. B Methodol. 58, 267–288. doi:10.1111/j.2517-6161.1996.tb02080.x
Vaswani, A., Shazeer, N., Parmar, N., Uszkoreit, J., Jones, L., Gomez, A. N., et al. (2017). “Attention is all you need,” in Advances in Neural Information Processing Systems 30: Annual Conferenceon Neural Information Processing Systems, Long Beach, CA, December 4–9, 2017, 5998–6008.
Yatchew, A. J. (1992). Nonparametric regression tests based on least squares. Econ. Theory 8, 435–451. doi:10.1017/S0266466600013153
Zhou, X., Chen, Yu, Ip, F. C. F., Jiang, Y., Cao, H., Lv, G., et al. (2023). Deep learning-based polygenic risk analysis for Alzheimer’s disease prediction. Commun. Med. 3, 49–20. doi:10.1038/s43856-023-00269-x
Keywords: deep neural networks, goodness-of-fit test, asymptotic normality, sample splitting, genetic association
Citation: Shen X and Wang X (2024) An exploration of testing genetic associations using goodness-of-fit statistics based on deep ReLU neural networks. Front. Syst. Biol. 4:1460369. doi: 10.3389/fsysb.2024.1460369
Received: 05 July 2024; Accepted: 30 October 2024;
Published: 18 November 2024.
Edited by:
Rongling Wu, The Pennsylvania State University (PSU), United StatesReviewed by:
Jianrong Wang, Michigan State University, United StatesTao He, San Francisco State University, United States
Copyright © 2024 Shen and Wang. This is an open-access article distributed under the terms of the Creative Commons Attribution License (CC BY). The use, distribution or reproduction in other forums is permitted, provided the original author(s) and the copyright owner(s) are credited and that the original publication in this journal is cited, in accordance with accepted academic practice. No use, distribution or reproduction is permitted which does not comply with these terms.
*Correspondence: Xiaoxi Shen, cmNkNjdAdHhzdGF0ZS5lZHU=
 Xiaoxi Shen
 Xiaoming Wang