 Chloe Spalding1,2
 Anne-Marie Krachler
 Sara Jabbari
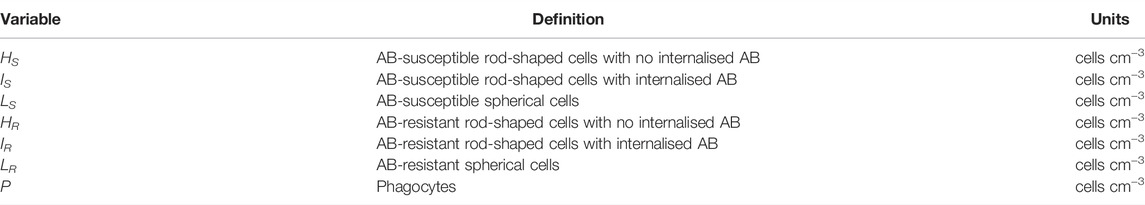

94% of researchers rate our articles as excellent or good
Learn more about the work of our research integrity team to safeguard the quality of each article we publish.
Find out more
ORIGINAL RESEARCH article
Front. Syst. Biol., 17 June 2022
Sec. Multiscale Mechanistic Modeling
Volume 2 - 2022 | https://doi.org/10.3389/fsysb.2022.899990
This article is part of the Research TopicSystems Biology, Women in Science 2021/22: Multiscale Mechanistic ModelingView all 6 articles
The bacterium Pseudomonas aeruginosa has been shown to undergo a morphological transition akin to L-forms under exposure to antibiotics, a process which may contribute to persistent infections. With the further consideration of antibiotic-resistance mechanisms, this transition renders the design of effective treatment strategies challenging. Through a mathematical model, we illustrate that additionally incorporating the complexities of the host immune response can render somewhat surprising predictions from the simulations. In particular, scenarios arise whereby the addition of a treatment strategy to directly target the L-forms results in a worsened infection, while in others this treatment could turn an antibiotic-resistant infection from persistent to treatable. The study highlights the importance of understanding the in vivo interplay between immune cells and pathogens for successful treatment design.
Pseudomonas aeruginosa is a Gram-negative pathogenic bacteria, categorised as critical by the World Health Organisation in the search for novel therapeutics to combat antimicrobial resistance (WHO, 2017). The β-lactam antibiotic meropenem works by targeting the cell wall of P. aeruginosa and inhibits its cell wall synthesis by binding to penicillin binding receptors. This mechanism of action results in a breakdown of the cell wall, which leads to filamentation and the formation of spheroplasts, which eventually lyse destroying the bacteria (Heinemann et al., 1998). However, in the presence of meropenem, P. aeruginosa has been observed to undergo a rapid morphological change: it changes from its usual rod-shaped cell to a spherical-shaped cell with a defective cell wall (Monahan et al., 2014). This sub-population of cells has the capacity to evade the effects of meropenem through the absence of crucial targets in this cell wall. These spherical-shaped cells remain dormant in vitro until the removal of the antibiotic triggers their transition back to proliferating rod-shaped cells, thus drawing analogies with persister cells and L-forms that have been implicated in chronic infections (Errington et al., 2016).
Persistence differs from genotypic drug resistance as, unlike the latter, it is not inheritable and is thought to be the result of an intrinsic survival mechanism. Additionally, unlike genetically resistant cells, when a persister cell reverts back to its original cell-type it is once again susceptible to antibiotics (thus, this is often referred to as antibiotic-tolerance). The spherical-shaped cells into which P. aeruginosa can transform are not unlike persister cells but the potential fragility of the P. aeruginosa spherical cells may lead to a high natural death rate, and perhaps as a result of this they are not always referred to as genuine persister cells. It is nonetheless quite plausible that they will play a role in chronic infections (Monahan et al., 2014). Thus while in this study we do refer to these spherical cells as L-forms/persister cells for ease of comparison to similar bacterial phenotypes, this potential distinction should be noted.
It has been postulated that antimicrobial peptides targeting the spherical cells could be a useful adjuvant to antibiotics to curtail chronic infections, and we previously developed a mathematical model that illustrated the feasibility of this in an in vitro setting (Spalding et al., 2018), agreeing with the experimental results of (Monahan et al., 2014). In the current study, we extend this model to consider the putative effects of the immune response on such a treatment, including cases where the bacteria may be additionally genetically resistant to antibiotics. The crucial interplay between the host defense and pathogen population results in often counter-intuitive outcomes. While there are scenarios where the immune system may be capable of clearing the persistent spherical cells without additional treatment (similar to the findings of (Gjini and Brito, 2016) where the immune response was found to potentially be critical in clearing antimicrobial resistant cells), there are also biologically plausible scenarios where adding AMPs could surprisingly have an adverse effect on the ability of the immune system to respond and therefore on the treatment outcome. For optimal treatment designs, this study highlights the need for mathematical models to consider the interactions of the host defense mechanisms with the pathogen and treatment load with a great deal of care.
The model describes the growth dynamics of a multi-strain P. aeruginosa population with the influences of antibiotics and the immune system at time t. The following subpopulations are used with i = S, R denoting antibiotic-susceptible and -resistant variants respectively:
• Antibiotic-free rod-shaped bacteria, Hi(t);
• Rod-shaped bacteria with internalised antibiotic, Ii(t);
• Spherical (L-form) cells, Li(t);
with extracellular antibiotic (A) included as a parameter, and the immune response captured through a variable, P(t), for phagocytes.
We assume the bacteria grow according to logistic growth, (with specific growth rate r and carrying capacity k), and assign a fitness cost parameter, c, to the growth of a resistant strain, as is done, for example, in (Bergstrom et al., 2000; Ternent et al., 2015; Baker et al., 2016). We neglect natural death for all subpopulations bar spherical cells (Li) that are likely more prone to this fate due to their fragility (occurring at rate ψ).
Figure 1 illustrates how the subpopulations respond to the presence of antibiotic. Cells are rod-shaped in their ‘natural’ state. In the presence of antibiotic, rod-shaped cells either.
• internalise the antibiotic (which prevents cell division and can potentially kill the cells), or
• transform to spherical L-forms (cell division is also obstructed here, see for example (Mercier et al., 2014; Cross et al., 2019; Chikada et al., 2021) where proliferation either does not occur or is seen to only occur in very specific environmental conditions).
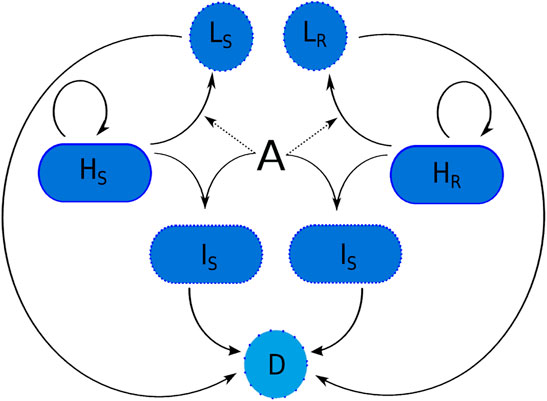
FIGURE 1. The transitions of a susceptible and resistant strain of P. aeruginosa in the presence of meropenem (A). Variable names are given in Table 1. Here, D represents dead cells. Spherical cells can lyse naturally due to fragility and bacteria that have internalised antibiotic can die due to the effects of the meropenem.
Antibiotic-internalisation is modelled using a non-linear saturating term with maximum transition rate, ν, and antibiotic concentration needed for half-maximal internalisation, A50. To represent resistance, we model efflux pump upregulation as simply a decrease in the internalisation rate, ν, and define ω ∈ (0, 1] to be the efflux pump upregulation parameter (resistance may be partial; w = 1 signifies maximal resistance).
Rod-shaped bacteria with internalised antibiotic may lyse due to antibiotic effects as the antibiotic inhibits cell wall synthesis. We define ρ to be the death rate of rod-shaped cells due to antibiotic effects and assume that this death rate is the same for both strains since resistance is instead captured via a decrease in internalisation. We note that A (antibiotic concentration) is not needed explicitly in these death terms as it is implicitly included in the variables IS and IR.
Following the microscopy images in Figure 2, we assume that both strains are able to transition to spherical cells following exposure to the antibiotic. The transition is modelled using a saturating nonlinear term with maximum transition rate, γ, and concentration needed for half-maximal transition, T50.
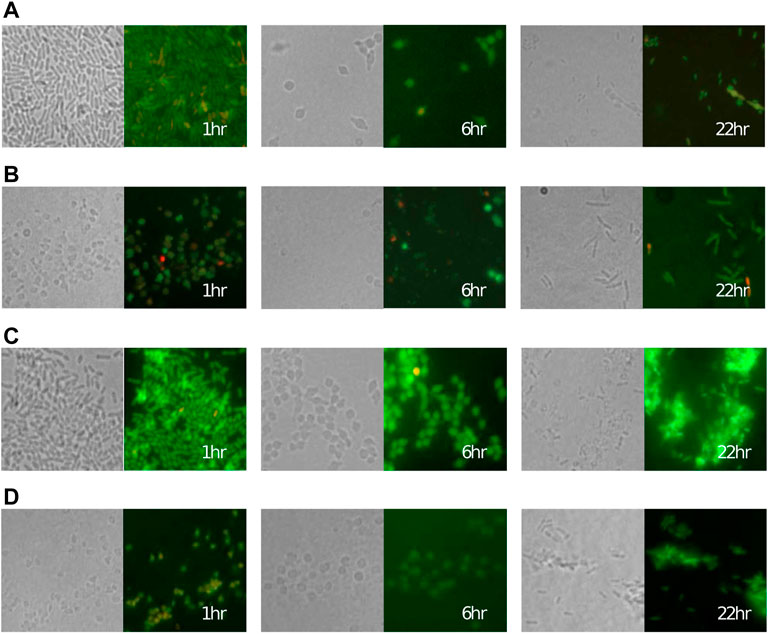
FIGURE 2. Cells of the P. aeruginosa (A,B) meropenem-susceptible PA1008 strain and (C,D) partially resistant PA1004 strain rapidly convert to a spherical shape after adding (A,C) 0.5 μg ml−1 and (B,D) 2 μg ml−1 of meropenem at 0 h before reverting back to a bacillary form. Left panels: transmitted light, right panels: fluorescence microscopy. In fluorescence images, green and red colouring indicates viable and lysed cells respectively (see (Spalding et al., 2018) for details).
For simplicity, we only consider continuous administration of the antibiotic in this study and hence the cells cannot transition back to the rod-shape (see (Spalding, 2018) for alternative administration strategies).
To capture an immune response, we assume that all bacterial subpopulations are susceptible to phagocytosis. The immunogenic properties of L-forms remain relatively unknown but it has been postulated that they will differ to those of actively growing cells (Domingue and Woody, 1997; Onwuamaegbu et al., 2005; Errington et al., 2016) where the cell envelope is highly immunogenic: both the outer membrane and peptidoglycan layer have constituents that act as pathogen-associated molecular patterns (PAMPs). These molecules are recognisable to the immune system and phagocytes will respond accordingly. Therefore, since the cell wall is disrupted in the spherical cells it is not clear whether or not the spherical cells will incur the same immune response as cells that harbour an intact cell wall. In line with other mathematical models of phagocyte recruitment (Smith et al., 2011; Ternent et al., 2015), we model phagocyte population growth using logistic growth, and assume that the morphology of a bacterium could affect its immunogenic properties. We define the maximum recruitment rate κi and phagocytosis rate ϕi, where
P. aeruginosa bacteria can produce toxins that induce apoptosis of neutrophils and other immune cells (Usher et al., 2002). We model bacteria-induced apoptosis using a linear density-dependent term with rate, μ. For simplicity, we assume that bacteria-induced apoptosis occurs at the same rate for all bacterial subpopulations. Additionally, we define a clearance rate of phagocytes, ξ.
We consider the introduction of resistance into the environment via spontaneous mutation or cross contamination, i.e. a resistant population is introduced at some point (TR) over the course of the simulated treatment. If we are considering a resistant population that has arisen due to mutation then our initial population size (HR0) would be small, whereas a population that appears from cross contamination could be much larger. Our aim is to understand the conditions under which a resistant population would grow and to investigate how treatments could work in conjunction with the host response to control the emergence of resistance and clear the bacterial infection.
Since we are exploring the limiting case of constant antibiotic administration, antibiotic is included as a parameter in the resulting model:
with initial conditions,
The definitions of all variables and parameters are displayed in Tables 1 and 2 respectively. A default parameter set was chosen using suitable literature, the parametrisation results from (Spalding et al., 2018), and our numerical investigations to ensure the model behaves realistically in the absence of an immune response or drugs (i.e., the infection takes hold in the absence of either, and the immune response alone cannot clear the infection). The default parameter values are shown in Table 2, although a range of values is used throughout and additional parameter sets have been tested to account for the inevitable uncertainty in the default choice.
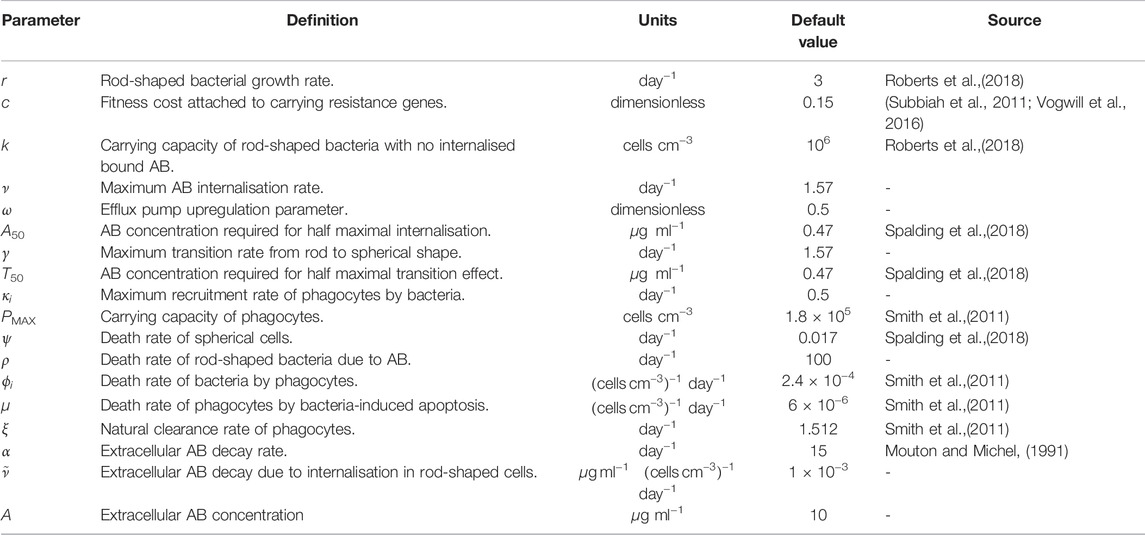
TABLE 2. Definitions, units and default values for the parameters used in Eqs. 1–7, AB=antibiotic. We define
To produce the simulations in this paper, as in (Ternent et al., 2015), we include the assumption that bacterial growth will cease when the population reaches a low critical threshold, i.e. environmental pressure and the stochasticity of biological processes would cause the rod-shaped population to die out if the population decreased to a sufficiently low level. When solving the model we include the assumption that growth will stop once the rod-shaped population reaches 50 cells cm−3 and further assume that the rod-shaped bacteria will no longer transition to the spherical form.
In the following results, we begin by considering the case where spherical cells and rod-shaped cells have identical immunogenic properties (κH = κL, ϕH = ϕL) before exploring the more complex consequences of these rates diverging by cell type.
We first consider the scenario whereby immune cells do not distinguish between rod-shaped and spherical cells.
To illustrate our parameter choice for the immune-related parameters, initially we consider bacterial growth of a fully susceptible strain, prior to treatment (A = 0), such that the initial conditions are Eq. 8 with,
Figure 3A displays the solutions of the model using the default parameter set with A = 0. All bacteria remain in the rod-shaped form since there is no antibiotic present to induce changes. κH (recruitment rate) and ϕH (phagocytosis rate) are chosen such that the immune response cannot clear the infection alone.
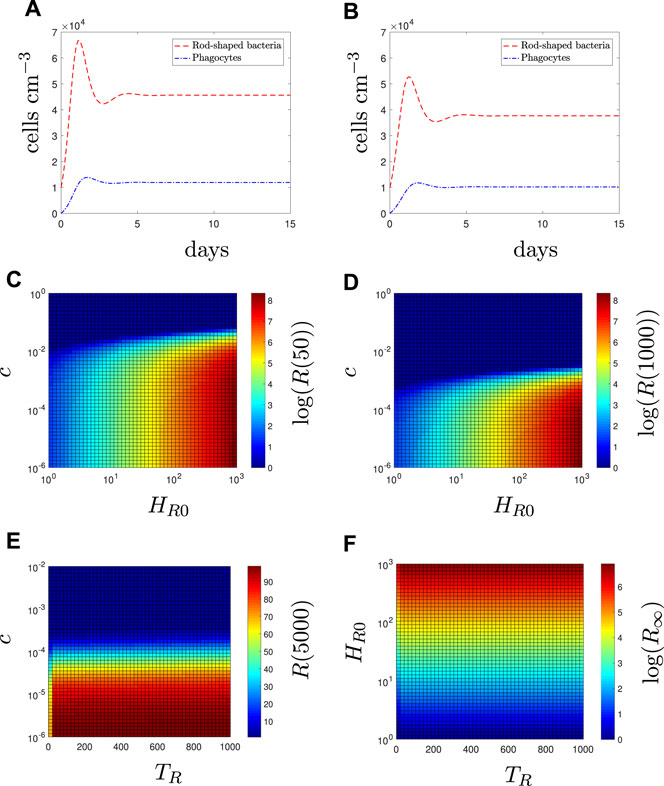
FIGURE 3. In the absence of antibiotic (A = 0), fitness cost and initial prevalence determine long-term resistant load. Time-dependent solutions with (A) all susceptible bacteria (8), (B) all resistant bacteria (9). The population levels of resistant bacteria (R = HR + IR + LR) for varying values of fitness cost, c, and initial condition, HR0 at (C) 50 days and (D) 1,000 days. The population levels of resistant bacteria for varying values of (E) fitness cost and (F) initial condition against the time of population appearance, TR (i.e., HR = 0 0 ≤ t < TR, HR (TR) = HR0, HS(0) = 104). In (E), HR0 = 100 and the simulation is run for 5,000 days (as the steady state is reached on a unrealistically long timescale). In (F), the resistant bacteria have no fitness cost (c = 0) to consider the limit case, and steady state results (R∞ are shown).
We now consider a single strain that is partially-resistant to the antibiotic and solve the model using initial conditions Eq. 8 and
to reflect the population being all antibiotic-resistant rod-shaped bacteria (Figure 3B). Although the initial population size is the same, the total bacterial load is lower than the susceptible case due to the fitness cost, c, of resistance. In Figures 3C–F, we illustrate how the initial number (HR0) and time at which resistance first appears (TR) affects the long-term resistant bacterial load in a mixed susceptible-resistant infection (HS(0) = 104 and HR0 is varied).
The resistant population inevitably dies out eventually except in certain cases where the fitness cost is very low (e.g., lower right section of Figures 3C,D). Fitness cost values of the size needed for extinction in Figure 3 are extremely small in comparison to the interval of realistic values provided in (Subbiah et al., 2011; Vogwill et al., 2016) and although these values are related to plasmid-mediated resistance, we can use them as an indication of the potential size of a fitness cost, i.e., it is likely such small values of c are unrealstic. Nevertheless, we include them in the sensitivity analysis for completeness. Figures 3C,D indicate that the initial condition will determine the size of the resistant population. In contrast, Figures 3E,F indicates that TR does not significantly affect the population size of the resistant population in the long term when compared to the effects of the fitness cost and initial condition. Results for the total number of susceptible bacteria are not shown as they are not significantly affected, regardless of the characteristics of the resistant population.
We first consider a population of only susceptible bacteria (initial conditions Eq. 9)– see green dashed lines in Figures 4A–D. Within the first few days we see a rapid decrease in rod-shaped bacteria with no internalised antibiotic (HS) as the antibiotic binds within the bacteria or they shed the cell wall. The presence of the bacterial population initiates an immune response (P). As the antibiotic treatment continues we see all subpopulations decrease until the infection is cleared, albeit after an undesirably lengthy treatment period. We note that our results in (Spalding et al., 2018) suggested that the morphological transition could enable an antibiotic-susceptible population to survive a constant dose of antibiotic; the results in Figures 4A–D suggest that the additional effects of the immune response could aid the antibiotic and clear an antibiotic-susceptible infection. This result can be directly related to the study by (Ankomah and Levin, 2014) in which they suggest that the presence of a subpopulation with phenotypic resistance (e.g., persister cells) would not cause treatment failure in cases where the rate of phagocytosis is sufficiently high. These results highlight the importance of acknowledging hosts defences when considering mechanisms of antibiotic evasion.
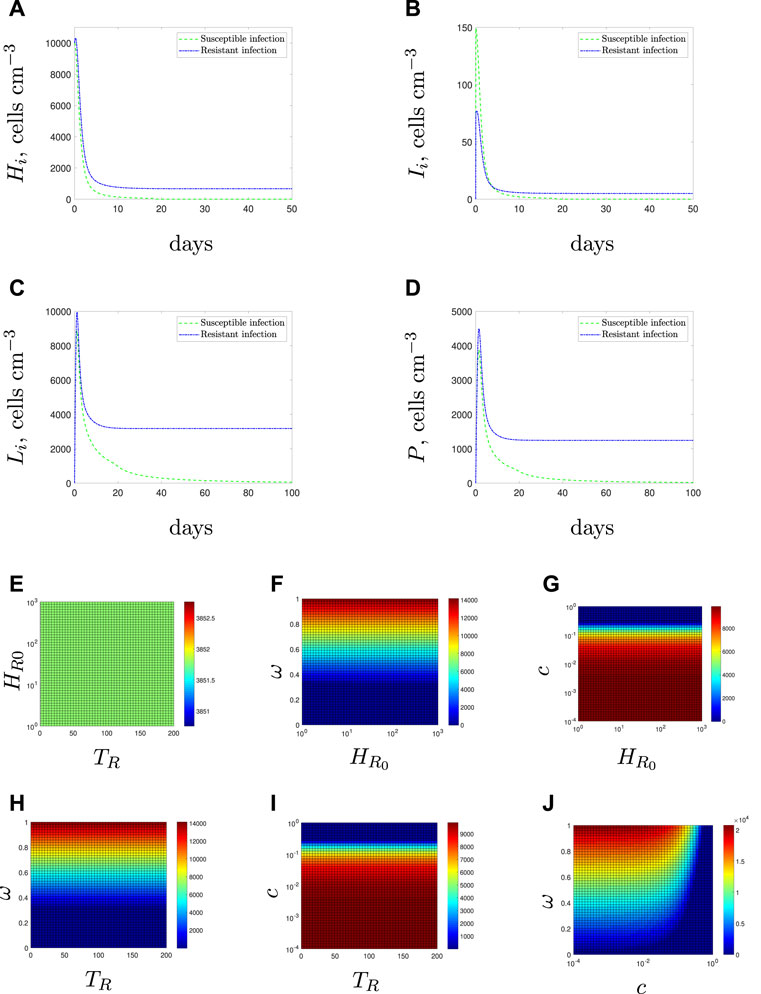
FIGURE 4. Resistant bacteria may persist in the presence of antibiotic (A–D). Time-dependent solutions for solely susceptible (green dashed line) or solely resistant (blue dot-dashed line) initial conditions. (E–J) Steady state values of the resistant bacterial population with mixed initial conditions Eq. 10. We vary the following parameter pairings: (E) emergence time and initial condition (F) initial condition and efflux parameter, ω, (G) initial condition and fitness cost, c, (H) emergence time and efflux parameter, (I) emergence time and fitness cost, and (J) fitness cost, and efflux parameter.
Conversely, if the population is entirely antibiotic resistant (initial condition Eq. 10 and blue dot-dashed line in Figures 4A–D), the resistant bacteria would reach a non-zero steady state, even after continued exposure to the antibiotic and in the presence of an intact immune response.
Using the mixed initial conditions,
Figure 4E displays the steady state values for the resistant population when the time of resistance introduction is varied against the initial number of resistant bacteria–unlike the antibiotic-free case in Section 3.1.1, neither variable affects the steady state population. In fact, neither TR nor R0 has any impact on the steady state population level when compared with the fitness cost, c, or the efflux parameter, ω (see Figures 4F–I).
Figure 4J displays the results if we vary the fitness cost, c, and efflux upregulation parameter, ω. Two clear regions of behaviour emerge for low and high values of c. When we have a low fitness cost (c < 10–2 for our parameter set), we find that changes to the efflux parameter have a large impact on the steady state of resistant bacteria whilst the fitness cost has little effect. This is reversed for higher fitness costs that prevent the long-term survival of the resistant population.
Note that Figures 4G,I both suggest that the threshold fitness cost, below which resistant bacteria would survive, is higher in this case than in the antibiotic-free environment (Figures 3C–E). This arises due to the niche created by the mass killing of the susceptible bacteria by the antibiotic. These results agree with the concept that antibiotic exposure causes a selective pressure that could enable resistant populations to emerge that would not survive in an antibiotic-free system.
The steady-state survival of bacteria in the above section is predicted to be due to efflux-mediated resistance rather than the morphological change, since the immune response ultimately tackles the L-forms. This ability to create L-forms, however, does enable susceptible bacteria to survive for lengthy periods of time before being cleared. Lengthy treatment periods would be costly and provide an ideal environment for further resistance mechanisms to develop and leave the patient vulnerable to more threatening infections. In (Monahan et al., 2014) antimicrobial peptides were suggested as a suitable therapy to target L-forms and our results in (Spalding et al., 2018) supported the use of antibiotics and AMPs when the bacteria was in isolation with the antibiotic (i.e., in the absence of an immune system).
We simulate the addition of AMPs through an increase in the lysis rate of spherical cells in Figure 5 for an entirely antibiotic-susceptible infection. If the antibiotic is administered alone (red dashed lines) then we predict that the population comprises only spherical cells towards the end of the treatment. Therefore, the antibiotic at the later stages is not bactericidal but instead preventing the spherical cells from reverting back to rods. The remaining spherical cells are then eradicated through natural clearance and phagocytosis. In theory, the AMPs should have the ability to clear this population of spherical cells faster. However, their potency has a detrimental effect on the immune response: if spherical cells are killed by the AMPs too quickly, the early immune response reduces accordingly and rod-shaped cells survive for longer. Eventually, the immune response recovers and the rod-shaped population is cleared, but the treatment duration is still lengthy (note that the sharp drop-off in population densities is due to the threshold below which cells can no longer proliferate–see end of Section 2). Thus in essence, the addition of AMPs really only affects the composition of the population: for higher values of ψ (addition of more peptides), the population towards the end of the treatment comprises mostly rod-shaped cells with no internalised antibiotic; for lower values the spherical cells are the surviving population. We recall that due to the compromised cell membrane the spherical cells could be less virulent than the rod-shaped cells. If so, using AMPs could result in a more threatening infection.
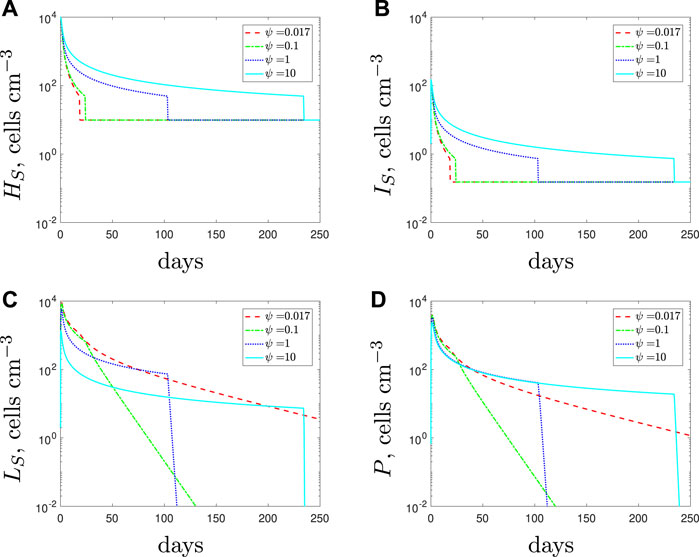
FIGURE 5. Numerical solutions of Eqs. 1–7, with the susceptible initial conditions Eq. 9, default parameter values shown in Table 2 and varying the spherical cell death rate, ψ, from the default value of 0.017 day−1. An increase in ψ represents the addition of antimicrobial peptides.
Figure 6 depicts the minimum time needed to eradicate the population varying ψ. We estimate the optimal death rate of the spherical cells to be ψ ≈ 0.25 day−1 for our default parameter set. Beyond this synergistic potency level, the AMPs could become ineffective and possibly detrimental to treatment efforts.
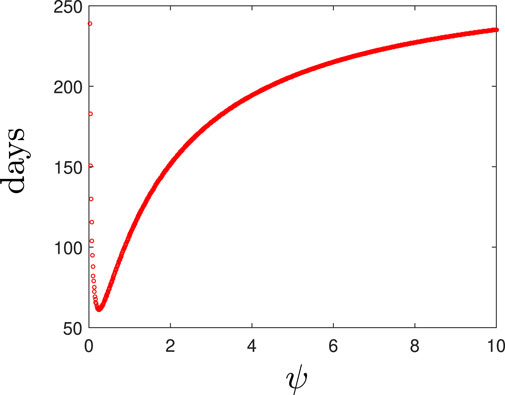
FIGURE 6. The time taken to clear an antiobiotic-susceptible infection for various values of the spherical cell death rate, ψ.
If we simulate a combined dose of antibiotics and AMPs as a treatment for a solely antibiotic-resistant population then the results, detailed in Figure 7, suggest similar findings to those obtained for the susceptible strain. Antibiotics alone cannot clear the infection and as we increase the spherical cells’ death rate from the default parameter value we predict fewer spherical cells and a larger rod-shaped bacteria population. Overall, the steady state of the total population is similar, regardless of the efficacy of the AMPs and their influence on the immune response. As before, it is the composition of the population that is mostly affected, not the total size.
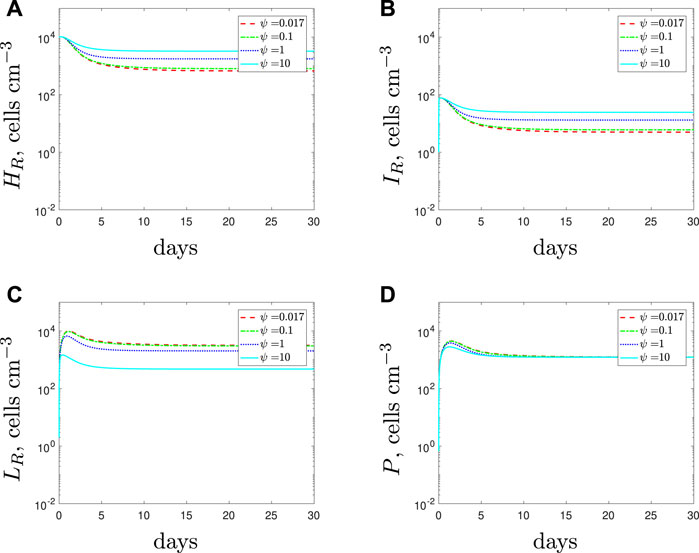
FIGURE 7. Numerical solutions of Eqs. 1–7, with resistant initial conditions Eq. 10, default parameter values shown in Table 2 and varying the spherical cell death rate, ψ, from the default value of 0.017 day−1. An increase in ψ represents the addition of antimicrobial peptides.
As mentioned in Section 2, it is unknown how well immune cells phagocytose spherical cells. Phagocytosis may occur at a faster rate since the cells have a depleted cell wall. However, the depletions may incur loss of targets for the immune cells and therefore phagocytosis could occur at a slower rate. Investigation into higher phagocytosis rates for the spherical cells (ϕL > ϕH) indicated that the bacteria would be cleared faster either with antibiotics alone or with AMPs as an adjuvant to antibiotics, than in the case where ϕH = ϕL (results omitted for brevity). This makes sense biologically since the ‘persistence’ mechanism is being targeted at a higher rate by the immune system and there is nothing interfering with the immune response. We turn, instead, to the case where ϕL < ϕH, i.e. the immune cells phagocytose spheres at a slower rate than they do rods.
Decreasing the spherical cell phagocytosis rate, ϕL, leads to the results in Figure 8. The model predicts larger populations of spherical cells as the phagocytosis rate is decreased from its default value. The larger spherical population causes the total population of bacteria to increase and this initiates a stronger immune response as more phagocytes are recruited. Additionally, since fewer spherical cells are phagocytosed, fewer phagocytes undergo apoptosis. Consequently, and perhaps counter intuitively, the higher number of phagocytes causes the rod-shaped populations to be cleared faster when the phagocytosis rate of the spherical cells decreases. The spherical cells are susceptible to natural death and replenishment depends on the size of the rod-shaped population. Hence we see a decline in the spherical population once the rod-shaped population has depleted.
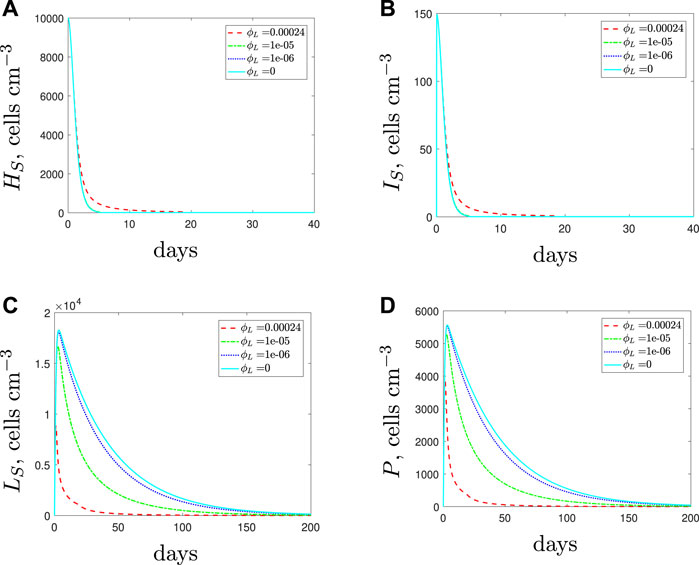
FIGURE 8. The variable solutions to system Eqs. 1–7, with initial conditions Eq. 9 (entirely antibiotic-susceptible infection), default parameter values shown in Table 2 and varying the spherical cell phagocytosis rate, ϕL, from the default value of 2.4 × 10⁻⁴ (cells cm−3)−1 day−1.
The qualitative result for the total population remains the same regardless of the phagocytosis rate: we predict total bacterial clearance, even if we assume that the spherical cells are immune to phagocytosis (ϕL = 0 cyan solid lines). The treatment duration needed to clear the infection increases as the phagocytosis rate decreases, and we could expect a higher bacterial load over the course of the treatment, albeit with the population dominated by spherical cells (note that antibiotics are required over the full course to prevent the spherical cells transitioning back to rod-shaped cells). Similarly, the addition of AMPs to target the spherical cells from the start of treatment encounters the same issues as seen in Section 3.1.3: the ensuing early reduction in the immune response can actually lengthen the treatment duration (details can be found in (Spalding, 2018)).
Figure 9 displays the model solutions for an antibiotic-resistant infection if we vary the phagocytosis rate of the spherical cells, ϕL, assuming that ϕL < ϕH. The results suggest similar findings to the susceptible strain: as the spherical cell phagocytosis rate decreases from the default value, the spherical population increases and initiates a stronger immune response. However, in the case of an antibiotic-resistant infection, the increase in phagocytes could kill off the rod-shaped population that would otherwise survive if the immunogenic properties were identical for all cell types (compare with the blue dot-dashed lines of Figures 4A–D). Therefore, we predict that a resistant strain infection could become treatable with antibiotics if the spherical cell phagocytosis rate is slower than that of the rod-shaped cells.
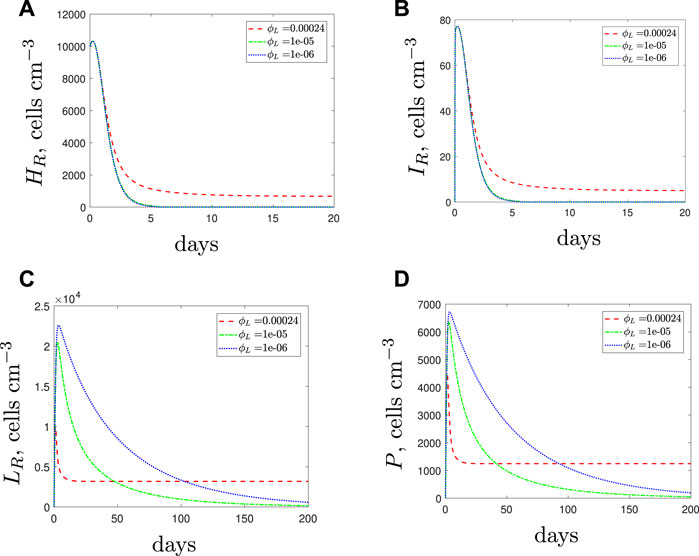
FIGURE 9. The variable solutions to system Eqs. 1–7, with initial conditions Eq. 10 (entirely resistant infection), default parameter values shown in Table 2 and varying the spherical cell phagocytosis rate, ϕL, from the default value of 2.4 × 10⁻⁴ (cells cm−3)−1 day−1.
The results in Figure 9 are counter-intuitive and it is only through consideration of the immune response that we are able to obtain these predictions. The results suggest that it may not be beneficial for the resistant bacteria to activate the morphological transition at a site of infection if the spherical cells are phagocytosed more slowly than the rod-shaped cells. If the resistant population suffers as a result of transitioning to the spherical form then it is possible that they may evolve to not utilise this mechanism; we will consider this in the discussion.
We next assume that the spherical cell phagocytosis rate is lower than that for rods and simulate the use of AMPs along with the antibiotic. If sufficiently potent the AMPs initially cause a decrease in spherical cells and therefore there are fewer phagocytes recruited than when the antibiotic was added alone (Figure 10). Consequently, the rod-shaped population is not overwhelmed by the immune response and the population survives treatment. These results suggest that AMPs could provide a more favourable environment for the rod-shaped population and again prove detrimental to treatment success.
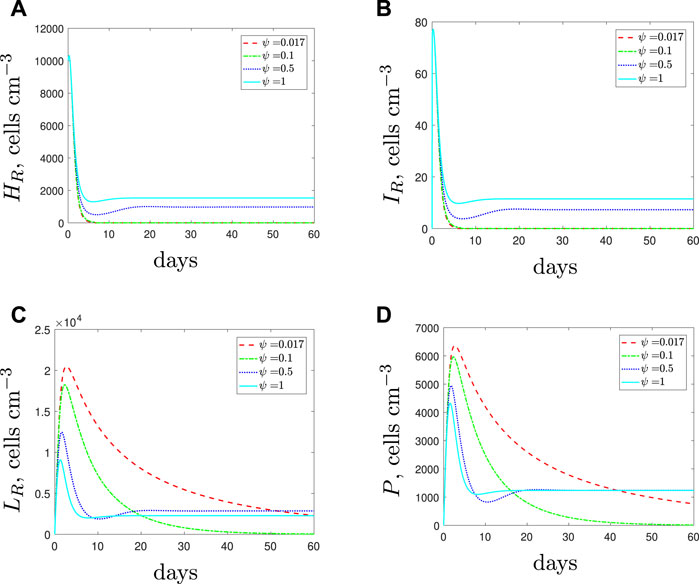
FIGURE 10. The variable solutions to system Eqs. 1–7, with initial conditions Eq. 10, default parameter values shown in Table 2, with ϕL = 1 × 10⁻⁵ (cells cm−3)−1 day−1 and varying the spherical cell death rate, ψ, from the default value of 1.7 × 10⁻² day−1. An increase in ψ represents the addition of antimicrobial peptides.
Figure 11 illustrates the results when we vary the phagocytosis rate for the spherical cells in a mixed strain infection. For both strains, the results indicate similar findings to those obtained when considering single strain populations. As the spherical cell phagocytosis rate is decreased, a larger spherical population that comprises mostly antibiotic-susceptible spherical cells emerges. The increased spherical population initiates stronger immune cell recruitment and subsequently the rod-shaped subpopulations die out faster. Eventually the susceptible population is cleared after continued antibiotic usage. As previously illusrtated in Figure 9, the rapid morphological transition could also potentially suppress the emergence of resistance through this boost to the phagocyte population. However, we still estimate a lengthy treatment period and conclude that a successful treatment would need to clear the spherical populations to prevent either strain recovering after the treatment is stopped.
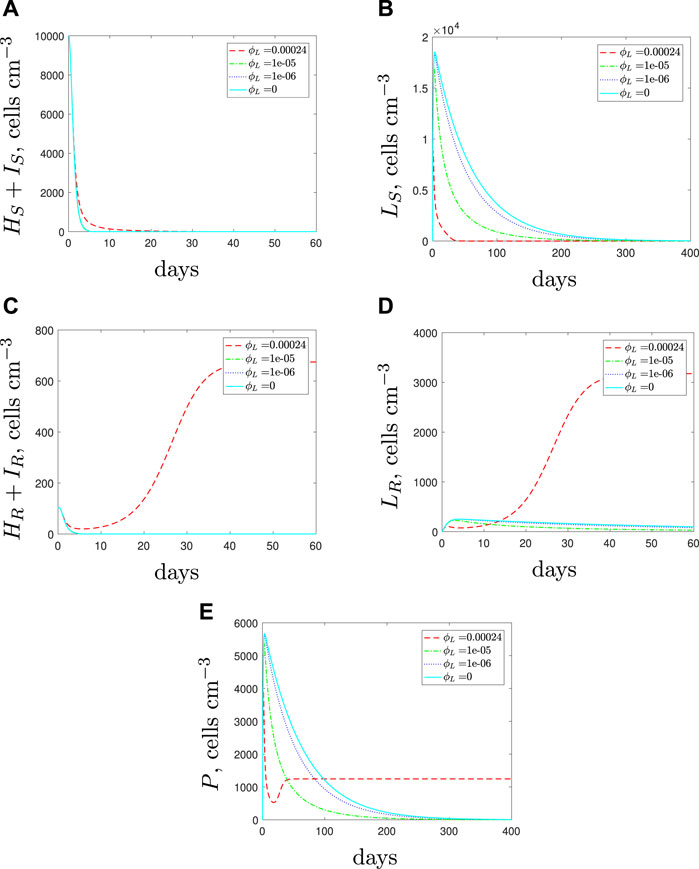
FIGURE 11. Numerical solutions of Eqs. 1–7, with initial conditions Eq. 11 (mixed infection), default parameter values shown in Table 2 and varying the spherical cell phagocytosis rate, ϕL, from the default value of 2.4 × 10⁻⁴ (cells cm−3)−1 day−1.
If we simulate the use of AMPs along with the antibiotic, we obtain the results in Figure 12. The effects of the AMPs cause a decrease in susceptible spherical cells and therefore there are fewer phagocytes recruited. When only antibiotics are used, the large phagocyte population (recruited due to the large susceptible spherical population) showed potential to delay the emergence of the resistant population. By adding AMPs we are providing a more favourable environment for the resistant strain (phagocytes are the main means to kill these cells) and we see the resistant rod-shaped cell population flourish for sufficiently large ψ. The increase in spherical cell death should negatively impact both of the spherical populations but the rod-shaped resistant population becomes so large that the AMPs do not prevent growth of the resistant population. Our predictions indicate that in the case of a multi-strain infection with a spherical population that is less susceptible to phagocytosis, the use of AMPs could be detrimental and may not pose a suitable treatment in combination with antibiotics.
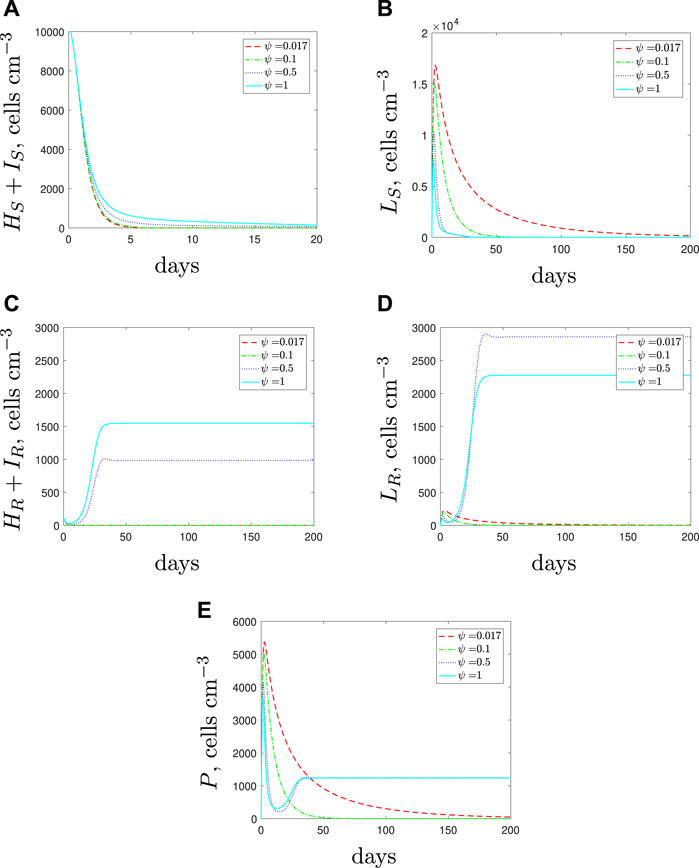
FIGURE 12. The variable solutions to system Eqs. 1–7, with initial conditions Eq. 11 (mixed infection), default parameter values shown in Table 2, with ϕL = 1 × 10⁻⁵ < ϕH (cells cm−3)−1 day−1 and varying the spherical cell death rate, ψ, from the default value of 1.7 × 10⁻² day−1 to mimic the addition of AMPs.
As the outer membrane may still be intact in the spherical cells, it may be reasonable to assume that shedding the cell wall is more likely to affect the recruitment rate than the phagocytosis rate. PAMPs are often found in the peptidoglycan layer of the cell membrane and the outer membrane and therefore it is possible that the spherical cells will have fewer PAMPs and be less immune stimulatory (κL < κH).
With κL < κH, in the initial stages of treatment, the lower recruitment rate of the spherical cells causes fewer phagocytes to be recruited to the infection (Figure 13). As a result of the smaller phagocyte population, all bacterial subpopulations increase as the recruitment rate of the spherical cells decreases. If the spherical cell recruitment rate decreases sufficiently, treatment now fails.
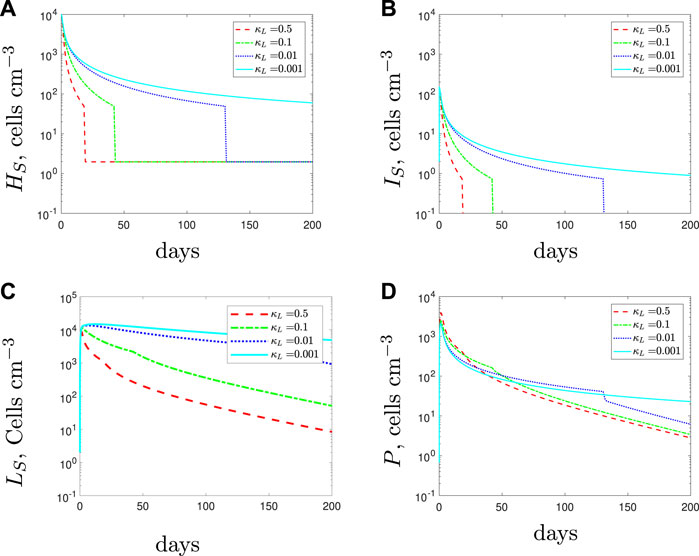
FIGURE 13. The variable solutions to system Eqs. 1–7, with initial conditions Eq. 9, default parameter values shown in Table 2 and varying the spherical cell phagocyte recruitment rate, κL, from the default value of 0.5 day−1.
For Figure 14 we adopt the phagocyte recruitment rate of the spherical cells to be κL = 1 × 10⁻³ (cells cm−3)−1 day−1 (i.e., treatment fails) and investigate whether the infection can be cleared using a combination therapy of antibiotic with AMPs. The results suggest that the addition of AMPs could lead to fewer spherical cells. However, as the AMPs only target the spherical cells and the spherical cells have a low phagocyte recruitment rate, we find that the remaining subpopulations are unaffected by the addition of AMPs (indeed the lines are indistinguishable). Thus while, adding AMPs could potentially help clear the infection, this could still require a lengthy treatment duration.
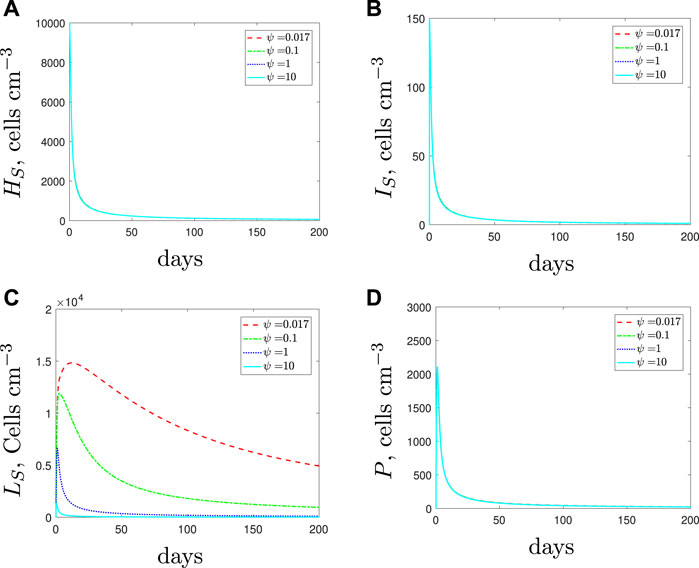
FIGURE 14. The variable solutions to system Eqs. 1–7, with initial conditions Eq. 9, default parameter values shown in Table 2, with κL = 1 × 10⁻³ day−1 < κH and increasing the spherical cell death rate, ψ, from the default value of 1.7 × 10⁻² day−1 to mimic the use of antimicrobial peptides.
The consequences of the spherical cells having a lower phagocyte recruitment rate than the rod-shaped cells cause identical changes on an antibiotic-resistant infection to the results described in Section 3.3.1 for the antibiotic-susceptible case. For brevity we do not include the corresponding simulations.
In a mixed strain infection (Figure 15), the model predicts similar dynamics to the single strain up to around day 20: all susceptible subpopulations grow to higher levels as we decrease spherical-cell-induced phagocyte recruitment. Due to the lower recruitment rate, we initially predict a weaker immune response and as a result we see faster growth of the resistant population. However, as the resistant population grows, the immune response increases. Consequently, the antibiotic and increased immune response can clear the susceptible population that previously persisted in the single strain simulations. This predicted behaviour suggests that if recruitment is lower for the spherical cells then we could expect the presence of a resistant strain to impact the survival of the susceptible strain negatively whilst promoting its own growth.
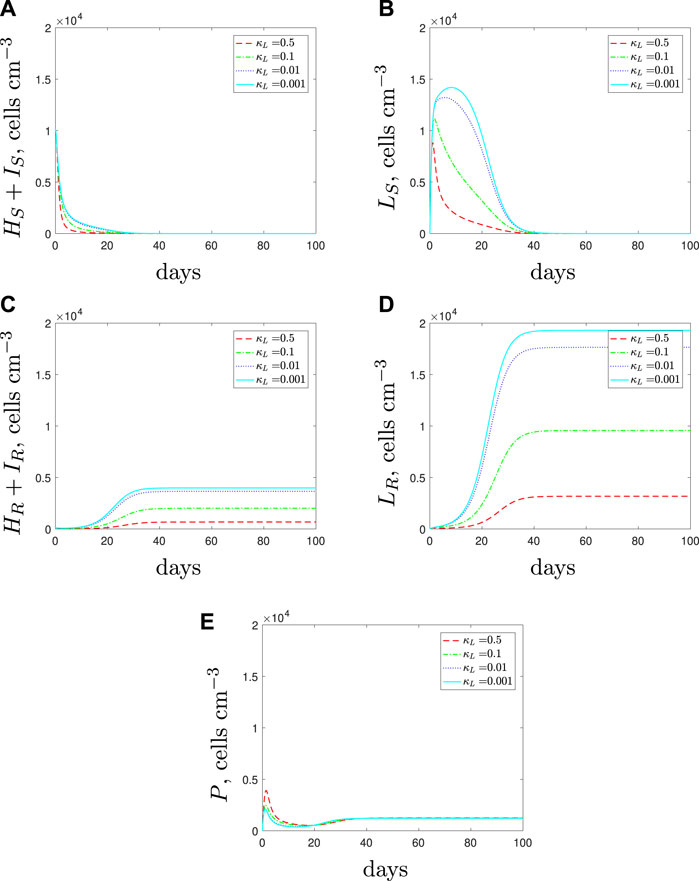
FIGURE 15. The variable solutions to system Eqs. 1–7, with initial conditions Eq. 11, default parameter values shown in Table 2 and varying the spherical cell phagocyte recruitment rate, κL, from the default value of 0.5 day−1.
If we simulate the combination of AMPs and antibiotics then we obtain the predictions in Figure 16. As expected, the AMPs are successful in clearing the spherical cells, however, they do not affect the rod-shaped cell populations and therefore we could still expect a dominant resistant population to emerge.
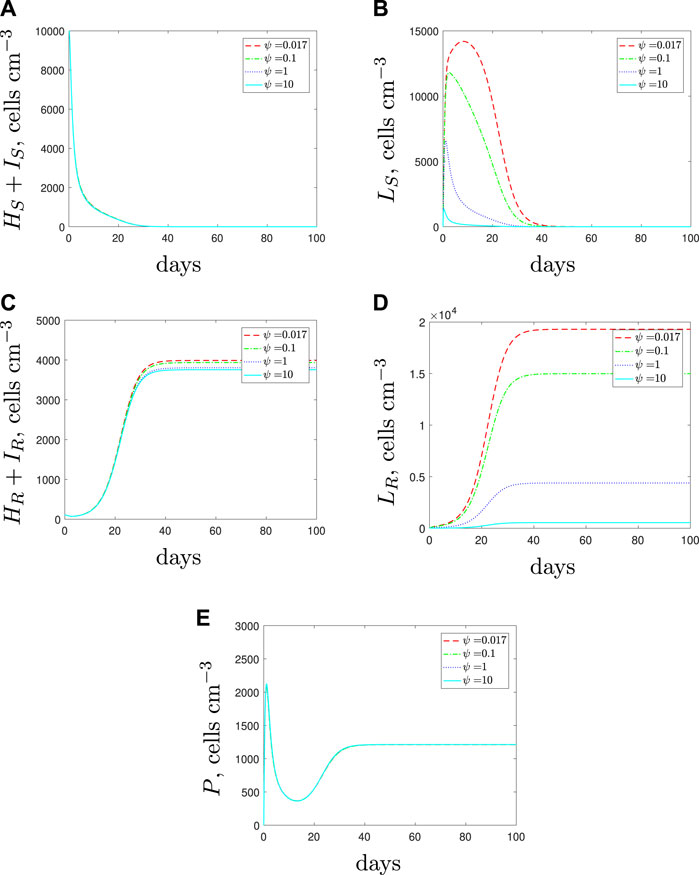
FIGURE 16. The variable solutions to system Eqs. 1–7, with initial conditions Eq. 11, default parameter values shown in Table 2, with κL = 1 × 10⁻³ < κH day−1 and increasing the spherical cell death rate, ψ, from the default value of 1.7 × 10⁻² day−1 to mimic the addition of antimicrobial peptides.
We have formulated a model that describes the growth dynamics of P. aeruginosa at the site of infection with the inclusion of a morphological transition, immune response, antibiotics and AMPs. We summarise our results for all treatment combinations and all explored immunogenic characteristic settings in Table 3.
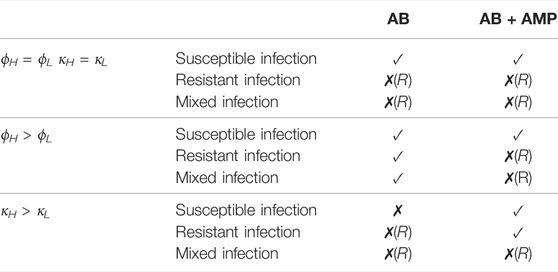
TABLE 3. A review of the results for treatments considered in this study. A tick, ✓, indicates that treatment success is possible but the duration required may be lengthy. A cross, ✗, indicates that treatment is not possible and if followed by (R) then the persisting infection is resistant to antibiotics.
If we assume that the immunogenic properties are identical between cell types then the results suggest that antibiotic treatment could clear a P. aeruginosa infection where L-forms can emerge only if it was purely susceptible to the antibiotic. In (Spalding et al., 2018) we predicted that a continuous dose of antibiotic would not clear a persistent infection and after including an immune response within the model we see that treatment success is now predicted. This result supports the conclusions in (Ankomah and Levin, 2014) and (Gjini and Brito, 2016) and emphasises the importance of including the immune response when considering persistent populations, as host defences will play an important role in the treatment outcome. If a resistant strain is present then we predict that the antibiotic treatment would fail, as expected.
The varied results in Table 3 indicate that the immunogenic properties of the spherical population could affect the survival of an infection and change the treatment outcome. If we examine the predictions for bacterial growth during antibiotic treatment and vary the immunogenic properties then we recognise two interesting scenarios.
Firstly, if the recruitment rate was slower for the spherical cells, we predicted that the susceptible population could be untreatable with antibiotics alone, and additional treatment types would be needed for infection eradication.
Secondly, we found that if the phagocytosis rate of the spherical cells is lower than the rod-shaped cells, a resistant infection could be treatable with antibiotics alone. The resistant bacteria cause a large influx of phagocytes that enable total bacterial clearance. This compelling result seems counter-intuitive and leads us to question whether the resistant bacteria would utilise the morphological transition in vivo if it was detrimental to the overall population. It is possible that the resistant bacteria could adapt and remain as bacillary cells if the selective pressures of the immune response caused by the antibiotic-induced morphological transition negatively impacted bacterial fitness.
Our results suggest that a susceptible strain could be cleared using antibiotic alone but that a lengthy treatment period would be necessary. After considering dual treatments we can formulate predictions about the clinical potential for AMPs. In (Spalding et al., 2018) we produced results that strongly supported the combined use of meropenem and AMPs to clear an antibiotic-susceptible bacterial population in vitro. Whilst we do not have experimental data to indicate the analogous result for a resistant strain, it is feasible that a resistant population could also be cleared with the antibiotic and AMPs in isolation. However, after including host defences, we find that the results do not strongly support the use of AMPs when used as part of a combined continuous therapeutic strategy. Our results suggest that the success of a combined treatment of an antibiotic and AMPs would depend on the effectiveness of the AMPs and the composition of the infection and, in many cases, the addition of AMPs was predicted to have a detrimental effect on the immune response and hence worsen the infection. This opens up an important question of timing–if AMPs were to be added only after the rod-shaped bateria had been cleared, this sequential treatment would ensure treatment success. Mathematical models will surely play a role in determining such personalised strategies.
There are, however, simulated scenarios where AMPs were predicted to improve treatment, and this work is in no way intended to condemn their use. Rather, similar to (Gjini and Brito, 2016), we aim to highlight the need for a better understanding of the interplay between the host, the pathogen and the treatment to design therapeutic strategies (Wheatley et al., 2021). Additional treatment types, such as phage therapy or anti-virulence drugs could also be considered for combination therapies (Spalding, 2018; Theuretzbacher and Piddock, 2019), and both experimental and theoretical studies have emphasised the need to consider careful timing of treatments and potential antagonism ((Ternent et al., 2015; Cogan et al., 2016; Gjini and Brito, 2016; Rezzoagli et al., 2020) for example).
We have presented a model of P. aeruginosa and its responses to meropenem and host defences, emphasising the sometimes surprising outcomes. While the model would of course benefit from experimental data against which we could validate and narrow down realistic scenarios, we have clearly demonstrated the importance of considering interactions with the host immune response when designing effective treatment strategies to counter chronic infections.
The original contributions presented in the study are included in the article/Supplementary Material, further inquiries can be directed to the corresponding author.
CS, SJ and AM-K conceived and designed the analysis; EK collected the data; CS and SS contributed data or analysis tools; CS performed the analysis; CS, SS and SJ wrote the paper.
The authors declare that the research was conducted in the absence of any commercial or financial relationships that could be construed as a potential conflict of interest.
All claims expressed in this article are solely those of the authors and do not necessarily represent those of their affiliated organizations, or those of the publisher, the editors and the reviewers. Any product that may be evaluated in this article, or claim that may be made by its manufacturer, is not guaranteed or endorsed by the publisher.
Ankomah, P., and Levin, B. R. (2014). Exploring the Collaboration between Antibiotics and the Immune Response in the Treatment of Acute, Self-Limiting Infections. Proc. Natl. Acad. Sci. U.S.A. 111, 8331–8338. doi:10.1073/pnas.1400352111
Baker, M., Hobman, J. L., Dodd, C. E. R., Ramsden, S. J., and Stekel, D. J. (2016). Mathematical Modelling of Antimicrobial Resistance in Agricultural Waste Highlights Importance of Gene Transfer Rate. FEMS Microbiol. Ecol. 92, fiw040. doi:10.1093/femsec/fiw040
Bergstrom, C. T., Lipsitch, M., and Levin, B. R. (2000). Natural Selection, Infectious Transfer and the Existence Conditions for Bacterial Plasmids. Genetics 155, 1505–1519. doi:10.1093/genetics/155.4.1505
Chikada, T., Kanai, T., Hayashi, M., Kasai, T., Oshima, T., and Shiomi, D. (2021). Direct Observation of Conversion from Walled Cells to Wall-Deficient L-form and Vice Versa in Escherichia coli Indicates the Essentiality of the Outer Membrane for Proliferation of L-form Cells. Front. Microbiol. 12, 645965. doi:10.3389/fmicb.2021.645965
Cogan, N. G., Rath, H., Kommerein, N., Stumpp, S. N., and Stiesch, M. (2016). Theoretical and Experimental Evidence for Eliminating Persister Bacteria by Manipulating Killing Timing. FEMS Microbiol. Lett. 363, fnw264. doi:10.1093/femsle/fnw264
Cross, T., Ransegnola, B., Shin, J. H., Weaver, A., Fauntleroy, K., VanNieuwenhze, M. S., et al. (2019). Spheroplast-Mediated Carbapenem Tolerance in Gram-Negative Pathogens. Antimicrob. Agents Chemother. 63, e00756. doi:10.1128/AAC.00756-19
Domingue, G. J., and Woody, H. B. (1997). Bacterial Persistence and Expression of Disease. Clin. Microbiol. Rev. 10, 320–344. doi:10.1128/cmr.10.2.320
Errington, J., Mickiewicz, K., Kawai, Y., and Wu, L. J. (2016). L-form Bacteria, Chronic Diseases and the Origins of Life. Phil. Trans. R. Soc. B 371, 20150494. doi:10.1098/rstb.2015.0494
Gjini, E., and Brito, P. H. (2016). Integrating Antimicrobial Therapy with Host Immunity to Fight Drug-Resistant Infections: Classical vs. Adaptive Treatment. PLoS Comput. Biol. 12, e1004857. doi:10.1371/journal.pcbi.1004857
Heinemann, M. M., Zick, R., Möricke, A., Seidelmann, M., and Berger, D. (1998). Antibacterial Activity of Meropenem against Pseudomonas aeruginosa , Including Antibiotic-Induced Morphological Changes and Endotoxin-Liberating Effects. Eur. J. Clin. Microbiol. Infect. Dis. 17, 754–760. doi:10.1007/s100960050180
Mercier, R., Kawai, Y., and Errington, J. (2014). General Principles for the Formation and Proliferation of a Wall-free (L-form) State in Bacteria. Elife 3, e04629. doi:10.7554/eLife.04629
Monahan, L. G., Turnbull, L., Osvath, S. R., Birch, D., Charles, I. G., and Whitchurch, C. B. (2014). Rapid Conversion of Pseudomonas aeruginosa to a Spherical Cell Morphotype Facilitates Tolerance to Carbapenems and Penicillins but Increases Susceptibility to Antimicrobial Peptides. Antimicrob. Agents Chemother. 58, 1956–1962. doi:10.1128/aac.01901-13
Mouton, J. W., and Michel, M. F. (1991). Pharmacokinetics of Meropenem in Serum and Suction Blister Fluid during Continuous and Intermittent Infusion. J. Antimicrob. Chemother. 28, 911–918. doi:10.1093/jac/28.6.911
Onwuamaegbu, M., Belcher, R., and Soare, C. (2005). Cell Wall-Deficient Bacteria as a Cause of Infections: a Review of the Clinical Significance. J. Int. Med. Res. 33, 1–20. doi:10.1177/147323000503300101
Rezzoagli, C., Archetti, M., Mignot, I., Baumgartner, M., and Kümmerli, R. (2020). Combining Antibiotics with Antivirulence Compounds Can Have Synergistic Effects and Reverse Selection for Antibiotic Resistance in Pseudomonas aeruginosa. PLoS Biol. 18, e3000805. doi:10.1371/journal.pbio.3000805
Roberts, P. A., Huebinger, R. M., Keen, E., Krachler, A. M., and Jabbari, S. (2018). Predictive Modelling of a Novel Anti-adhesion Therapy to Combat Bacterial Colonisation of Burn Wounds. PLoS Comput. Biol. 14, e1006071. doi:10.1371/journal.pcbi.1006071
Smith, A. M., McCullers, J. A., and Adler, F. R. (2011). Mathematical Model of a Three-Stage Innate Immune Response to a Pneumococcal Lung Infection. J. Theor. Biol. 276, 106–116. doi:10.1016/j.jtbi.2011.01.052
Spalding, C., Keen, E., Smith, D. J., Krachler, A. M., and Jabbari, S. (2018). Mathematical Modelling of the Antibiotic-Induced Morphological Transition of Pseudomonas aeruginosa. PLoS Comput. Biol. 14, e1006012. doi:10.1371/journal.pcbi.1006012
Spalding, C. (2019). Mathematical Modelling of P. aeruginosa Considering the Antibioticinduced Morphological Transition to Improve Treatment Strategies. PhD thesis. Birmingham: University of Birmingham.
Subbiah, M., Top, E. M., Shah, D. H., and Call, D. R. (2011). Selection Pressure Required for Long-Term Persistence of blaCMY-2-Positive IncA/C Plasmids. Appl. Environ. Microbiol. 77, 4486–4493. doi:10.1128/AEM.02788-10
Ternent, L., Dyson, R. J., Krachler, A.-M., and Jabbari, S. (2015). Bacterial Fitness Shapes the Population Dynamics of Antibiotic-Resistant and -susceptible Bacteria in a Model of Combined Antibiotic and Anti-virulence Treatment. J. Theor. Biol. 372, 1–11. doi:10.1016/j.jtbi.2015.02.011
Theuretzbacher, U., and Piddock, L. J. V. (2019). Non-traditional Antibacterial Therapeutic Options and Challenges. Cell Host Microbe 26, 61–72. doi:10.1016/j.chom.2019.06.004
Usher, L. R., Lawson, R. A., Geary, I., Taylor, C. J., Bingle, C. D., Taylor, G. W., et al. (2002). Induction of Neutrophil Apoptosis by the Pseudomonas aeruginosa Exotoxin Pyocyanin: a Potential Mechanism of Persistent Infection. J. Immunol. 168, 1861–1868. doi:10.4049/jimmunol.168.4.1861
Vogwill, T., Kojadinovic, M., and MacLean, R. C. (2016). Epistasis between Antibiotic Resistance Mutations and Genetic Background Shape the Fitness Effect of Resistance across Species of Pseudomonas. Proc. Biol. Sci. 283. doi:10.1098/rspb.2016.0151
Wheatley, R., Diaz Caballero, J., Kapel, N., de Winter, F. H. R., Jangir, P., Quinn, A., et al. (2021). Rapid Evolution and Host Immunity Drive the Rise and Fall of Carbapenem Resistance during an Acute Pseudomonas aeruginosa Infection. Nat. Commun. 12, 2460. doi:10.1038/s41467-021-22814-9
WHO (2017). WHO Publishes List of Bacteria for Which New Antibiotics Are Urgently Needed. Available at: https://www.who.int/news/(Accessed 0207, 21).
Keywords: pseuodomonas aeruginosa, immune response, l-form, mathematical model, antimicrobial resistance, antimicrobial pepides
Citation: Spalding C, Shirgill S, Taylor E, Krachler A-M and Jabbari S (2022) Mathematical Modelling of Pseudomonas aeruginosa L-forms Reveals Complex Interplay Between Host Defence Mechanisms and Putative Treatments. Front. Syst. Biol. 2:899990. doi: 10.3389/fsysb.2022.899990
Received: 19 March 2022; Accepted: 05 May 2022;
Published: 17 June 2022.
Edited by:
Helen Byrne, University of Oxford, United KingdomReviewed by:
Grant Lythe, University of Leeds, United KingdomCopyright © 2022 Spalding, Shirgill, Taylor, Krachler and Jabbari. This is an open-access article distributed under the terms of the Creative Commons Attribution License (CC BY). The use, distribution or reproduction in other forums is permitted, provided the original author(s) and the copyright owner(s) are credited and that the original publication in this journal is cited, in accordance with accepted academic practice. No use, distribution or reproduction is permitted which does not comply with these terms.
*Correspondence: Sara Jabbari, cy5qYWJiYXJpQGJoYW0uYWMudWs=
Disclaimer: All claims expressed in this article are solely those of the authors and do not necessarily represent those of their affiliated organizations, or those of the publisher, the editors and the reviewers. Any product that may be evaluated in this article or claim that may be made by its manufacturer is not guaranteed or endorsed by the publisher.
Research integrity at Frontiers
Learn more about the work of our research integrity team to safeguard the quality of each article we publish.