 Rohan Jha
 Rishabh Jha
 Mazhar Islam3
94% of researchers rate our articles as excellent or good
Learn more about the work of our research integrity team to safeguard the quality of each article we publish.
Find out more
ORIGINAL RESEARCH article
Front. Sustain., 09 January 2025
Sec. Modeling and Optimization for Decision Support
Volume 5 - 2024 | https://doi.org/10.3389/frsus.2024.1507030
Data centers are poised for unprecedented growth due to a revolution in Artificial Intelligence (AI), rise in cryptocurrency mining, and increasing cloud demand for data storage. A sizable portion of the data centers’ growth will occur in the US, requiring a tremendous amount of power. Our hypothesis is that the expansion of data centers will contribute to an increase in US CO2 emissions. To estimate CO2 emissions, we applied three forecasted power demands for data centers and applied 56 NREL (National Renewable Energy Laboratory) power mixes and policy scenario cases using 11 AI models. Among these, the linear regression model yielded the most accurate predictions with the highest R-square. We found that overall CO2 emissions in the US could increase up to 0.4–1.9% due to expansion of data centers by 2030. This increase represents ~3–14% of CO2 emissions from the US power sector by 2030. Using the state-level power mix forecasts for 2030 among increasing CO2 emission scenarios, we predict that Virginia’s power mix will maintain emissions in line with the US average, while the Texas, Illinois, and Washington’s power mix are expected to reduce emissions due to greater renewables in their power mix in 2030. However, Illinois and Washington may face challenges due to their limited power resource availability. In contrast, New York and California’s power mix may increase CO2 emissions due to higher natural gas in their power mix in 2030. The highest variability in data center CO2 emissions stems from AI-driven demand and improvements in data center efficiency and is followed by the power mix. To reduce CO2 emissions from data centers, we offer pathways such as reducing power consumption, improving power mix with renewable sources, and using hydrogen in power plants. We propose focusing on New Mexico and Colorado for data centers to minimize CO2 emissions. Finally, we highlight a set of federal policies supplemented by states to facilitate CO2 emission reductions across energy, emissions, waste, R&D, and grid infrastructure.
Data centers are vital for Artificial Intelligence (AI), cloud computing, and cryptocurrency mining. AI is transforming various sectors by enabling early healthcare diagnoses, personalized education, and autonomous vehicles. It also supports interactive communication, and other applications (Elahi et al., 2023). This transformative technology has significantly enhanced convenience and efficiency, making it one of the defining innovations of the 21st century. From 2017 and 2022, AI applications grew rapidly doubling in demand (Chui, 2022). For instance, Google leverages AI to refine its search algorithms. Facebook, YouTube, and Amazon utilize AI to track user activities and personalize content, videos, and products. These advancements offer tremendous value to users but have a hidden cost. Data centers now consume more power, which could sharply raise CO2 emissions. This growing environmental impact is a pressing challenge. In this paper, we estimate data center CO2 emissions in the US by 2030 and propose strategies and policies to reduce them.
Along with AI, data center servers perform two other key critical tasks namely cloud storage and cryptocurrency mining. Clouds allow users to store data online instead of on physical hard drives. This makes data sharing through the internet fast and seamless (Islam et al., 2023). This also provides accessibility and reliability for users in accessing data. Cloud computing is also used for big data, where companies have access to user data and can provide users personalized results (Amazon, 2024). Like AI, cloud requires significant energy, greater than the entire airline industry energy consumes (Monserrate, 2022). Its market size is expected to grow at an annual growth rate of ~20% until 2030 (Grad view research, 2023).
Similarly, cryptocurrency is an innovative digital asset that enables fast and secure transfer of digital money over the internet. This is extremely fast and cheap transactions, and incredible security making it very difficult to hack accounts (Tambe and Jain, 2024). Like cloud and AI, cryptocurrency is also growing at a fast pace. The number of users has grown by more than 100 times in 7 years (Best, 2023). However, its high energy consumption means profits are viable only with cheap energy. The energy demand from both large data centers supporting cloud services and crypto mining contributes significantly to rising CO2 emissions.
The rise in CO2 emissions from data centers is widely acknowledged. This paper explores four key research questions about CO2 emissions from data centers and other waste. (i) What are the projected CO2 emissions in the US by 2030 under different power demands, power mixes, and policy scenarios? What are the main drivers of these trends and will data center emissions grow exponentially? (ii) How do the different power mixes of US states with data centers affect CO2 emissions? (iii) Which US states are best suitable for hosting data centers to minimize emissions? What strategies and policies can help mitigate these emissions? and (iv) What is the impact of growing data centers on electronic waste and water consumption? These questions test the hypothesis that CO2 emissions will rise due to the rapid growth of data centers. They also seek ways to curb emissions through targeted measures. We leveraged three forecasted power demands for data centers and applied 56 NREL power mixes and policy scenario cases using 11 AI models. Finally, we selected a linear regression model to respond to these research questions and thus the inherent assumptions with linear regression model stay with the conclusion. The paper begins with an overview of data centers and a literature review. The methodology section covers data collection and model development, selection, and validation. The results section presents findings, and finally the conclusion along with next steps is in the discussion section.
Data centers are composed of servers, storage, cooling systems, IT systems, and networking (Cisco, 2024). This is pictorially represented in Figure 1. The servers are the backbone of data centers enabling them to perform the operations. The cabling allows the data to be transmitted efficiently, and the storage keeps all the data in one place. The cooling systems prevent overheating in the facility and on chips. The network connects all parts together. All these parts of the data centers require energy to run.
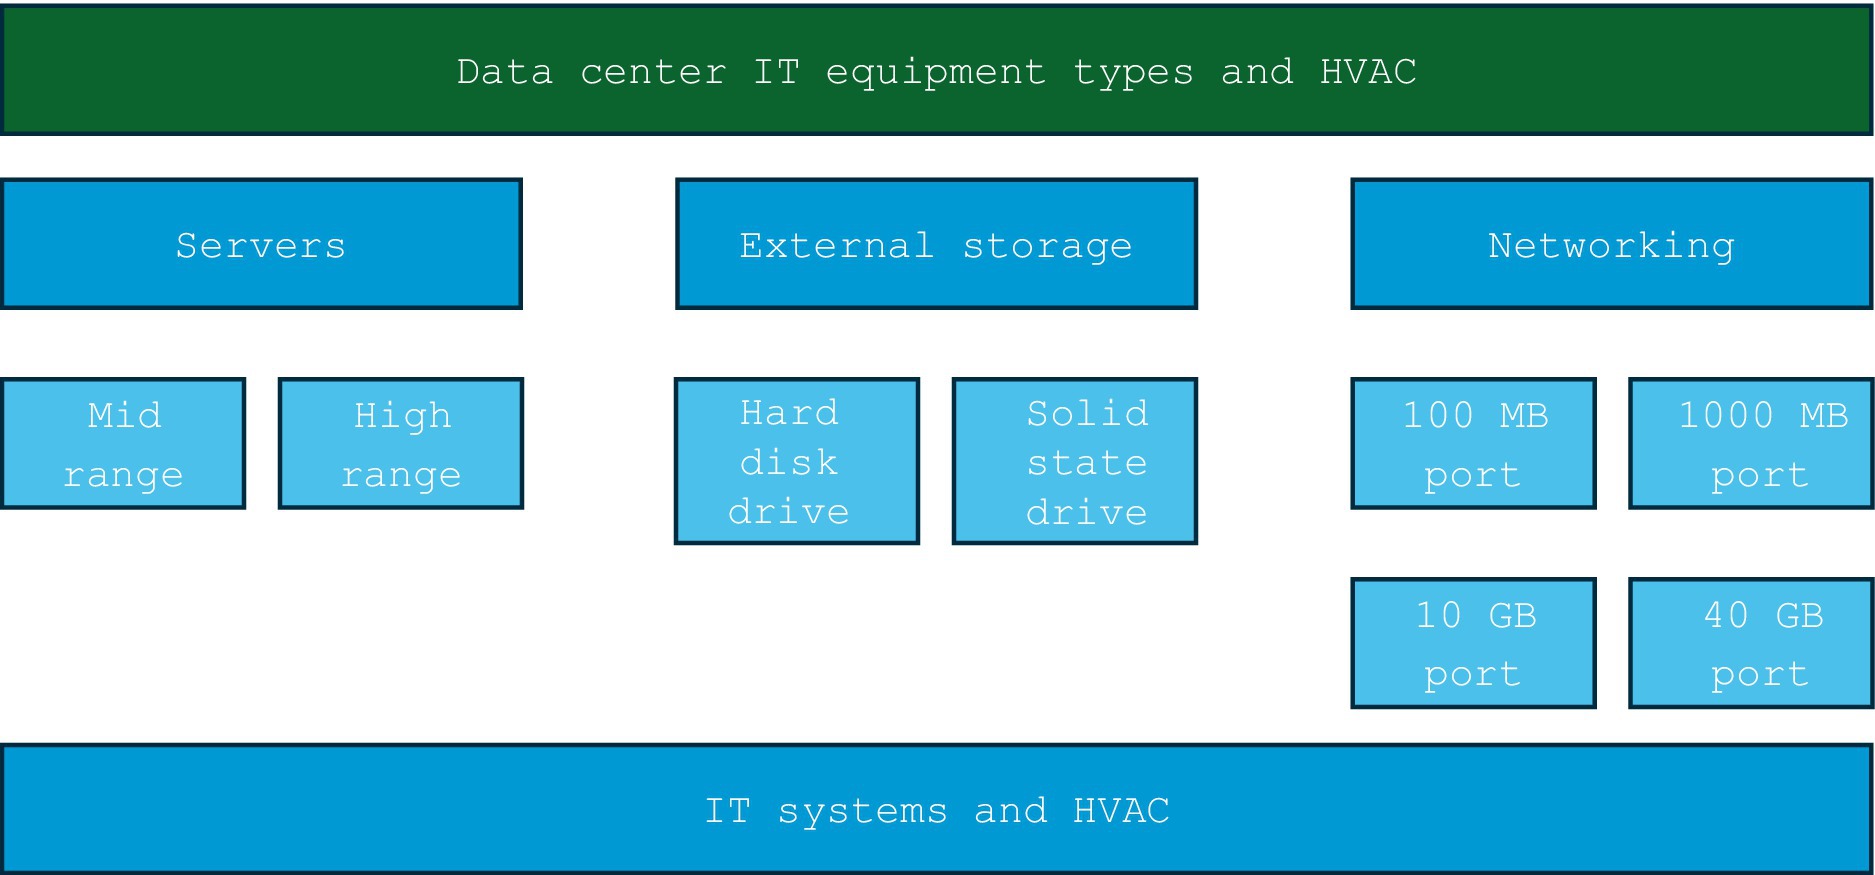
Figure 1. Schematic of data centers based on energy consumption.
There are three types of data centers: enterprise, co-location, and hyperscale. First, enterprise data centers are owned and operated by a single company. Second, co-location centers rent space to house servers and hardware in a shared energy and cooling environment. Third, hyperscale data centers are rapidly scaling up their operations to meet vast computing needs, including those companies such as Amazon, AWS, Google, and others. The co-location and hyperscale data centers account for 60–70% of the data center load (Strubell et al., 2019).
Data centers typically use only 40% of their electricity demand for computing and this requires continuous power supply for a base load. Of the remaining 60% used for non-computing usage, ~40% goes for heating, ventilation, and air conditioning (HVAC), and ~ 20% is for power supply systems, fans and drivers of the IT equipment (Monserrate, 2022). Computation is needed at two levels namely training the AI model and its subsequent use. Cryptocurrencies also need power at two stages: the first involves proof of work or stake known as mining and the second involves adding blocks of transactions to a blockchain by solving complex cryptographic puzzles (EIA, 2024). The energy used in training an OpenAI’s GPT-4 model could have powered 50 American homes for 100 years (Economist, 2024). Historically, as Moore’s law predicted, chip sizes shrank, became faster and consumed less power. However, the situation has reversed with AI. First, it takes only 4 months to double in computational demand, which significantly increases power consumption. The AI model complexity does not help either. For example, the GPT-1 needed 1.7 MWh to train a model, GPT-3 needed 1,287 MWh, and GPT-4 needs 51,773 MWh (EIA, 2024).
The power demand for subsequent use is significant as well. Due to the rise of AI, cloud, and crypto, the Boston Consulting Group (BCG) (Tarasov, 2024) estimates that the amount of data centers needed will grow annually at a rate of ~15–20% until 2030. By then, power consumption will exceed five times the total US power used in 2022, the year ChatGPT was created. AI fuels this growth. The prominence and rapid adoption of AI cause the amount of data contained by data centers to grow at a much faster rate since AI stores and processes a lot more data. For example, a ChatGPT search takes up 10 times as much data as a Google search (Goldman Sachs, 2024). Training a handful of artificial intelligence models can emit over 626,000 pounds of carbon dioxide, which is equivalent to nearly five-times the lifetime emissions of the average American car (Hao, 2020). Moreover, data center growth is much greater in the US. Currently, the US has around 50% of the world’s data centers, whereas just 3 years ago, the US had only one-third (Statista, 2023). Thus, in the absence of proportional growth of renewable sources, this can lead to a lot of fossil fuels being burned to run these centers. Consequently, this will in turn cause worsened carbon emissions. These emissions will trap the sun’s heat in the atmosphere resulting in increased global warming. This trend would hinder the Biden Administration goals of carbon free electricity by 2035 (National Climate Task Force, 2024). Therefore, the expansion of power needed to operate these data centers will need to be responsibly organized, or else the environment will struggle.
Various researchers have investigated and learned about the environmental impact of data centers, and how they would solve this issue. Data centers use more than 1% of global energy consumption (Masanet et al., 2020). This is expected to increase as much as 8% in 2030 (Anders et al., 2015). Regardless of improvements in energy efficiency, aggregate energy usage has been increasing in the last 15 years (Bashir et al., 2023). Moreover, efficiency improvements have slowed down significantly in recent years (Taylor, 2024).
Masanet et al. (2020) examined the overall environmental impact and key trends for data centers. They reported that increasing demand in terms of storage, IP traffic, data center workload and base servers is growing at a much faster rate than energy efficiency gains from power usage effectiveness, server power intensity, and other metrics. Monserrate (2022) explored how cloud computing emits substantial carbon emissions primarily through data centers. They found staggering results. For example, one data center takes up the same amount of energy as around 50,000 homes. In addition, they found that most of the energy is not even used for computation but is instead consumed by cooling systems and backup systems. This highlights that the potential for the power efficiency of these centers can be vastly improved. Shehabi et al. (2011) analyzed how greenhouse gas emissions from the increasing amount of data centers can be reduced. They found that they could reduce the power requirements by recycling energy through economizers. In addition, they suggested that these companies should consider the geographic location and efficiency to further lessen the power used. The paper primarily considers energy efficiency to reduce emissions. Similarly, Doland (2024) examined how to reduce the carbon footprint of data centers by improving their infrastructure. They found that using solid state drives and optimizing servers can make the centers more energy efficient, thereby reducing the carbon footprint. Beyond improving energy efficiency, the carbon footprint of data centers can be reduced by using renewable energy to power them. Huisingh et al. (2014) examined this approach and found that using renewable energy is one of the most viable ways to reduce carbon emissions, although some infrastructure such as power grids are recommended, and societal change is necessary. Wilson (2023) investigated how renewable resources can benefit the emissions problem caused by data centers. He found that using fuel cells, hydropower, wind energy, or using solar panels can reduce data centers’ carbon footprint.
The scope of this paper is limited to CO2 emissions from data centers in the US. Accordingly, we estimate CO2 emissions from US data centers using their power demand. Although some of the insights could be applicable beyond the US, this is outside the scope of this paper.
In this section, we explain how we estimate CO2 emissions for different power demands, power mixes, and policy scenarios by offering a systematic approach for estimation, validation, selection, and forecasting of CO2 emissions from data centers. First, we describe the process of collecting input data for forecasted power demand and mix. Next, we outline how various AI methods were applied using historical data. Then, we validate model’s predicted forecasts and select the most suitable model for forecasting. Finally, we present the forecasting method and conclude by highlighting the criteria used for selecting optimal locations for data centers. A simple schematic of energy supply to CO2 emissions, electronic waste and water consumption along with applications is presented in Figure 2.
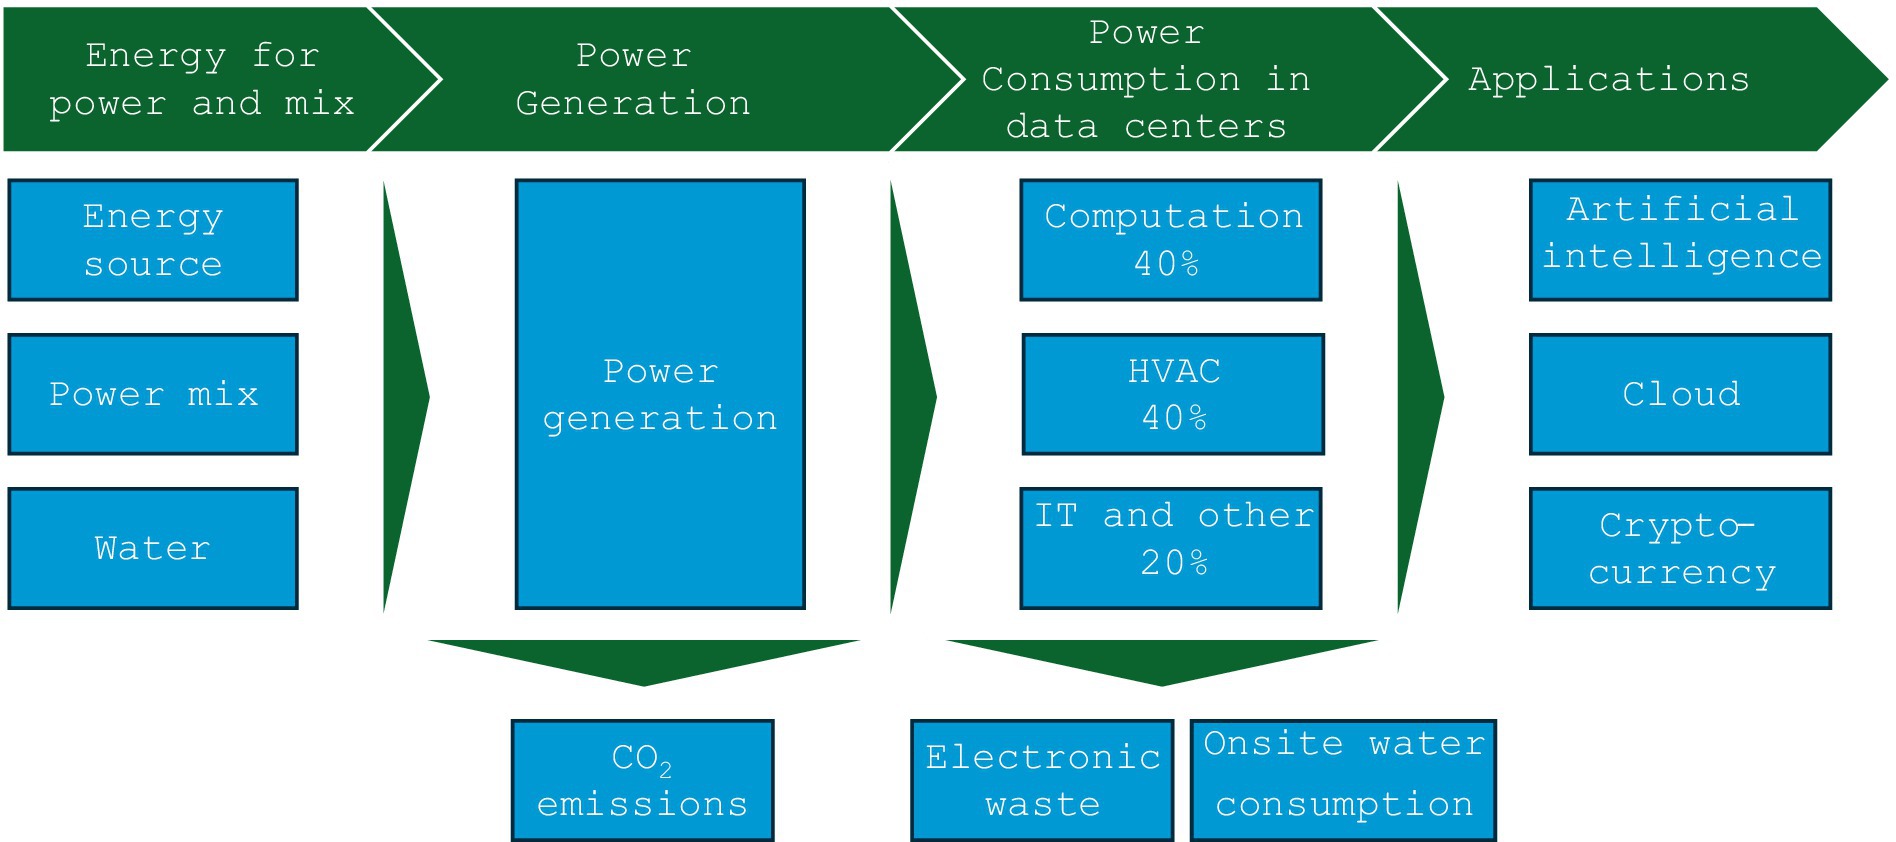
Figure 2. Schematic of power supply to CO2 emissions, electronic waste, and water consumption in data centers along with applications.
The power demand for data centers has a significant uncertainty. We thus used low, mid, and high cases using data from Electric Power Research Institute (EPRI) (Aljbour et al., 2024) and BCG (Lee, 2024). The range of power demand accounts for uncertainty with AI application demand, internet traffic, storage demand, computation intensity, and efficiency gains in computational and non-computational aspects of data centers. We used the low case considering moderate AI growth and limited efficiency gain (Aljbour et al., 2024) or high AI growth with alternative technology to reduce power demand. The low case considers a 5% annual growth rate in data centers’ power demand. The mid and high cases of this analysis are based on BCG (Lee, 2024). BCG’s low and high estimates of data centers power demand growth are 15 and 20% annually, respectively. They are considered as mid and high cases of power demand for data centers in this paper. BCG’s estimates are based on bottom up and top-down estimates of rapidly growing data center power consumption driven by AI, high performance computing and traditional business computing. This also aligns with the global data center capacity increase annually as ~20% (McKinsey, 2024). The launch of ChatGPT has been a monumental event and the generative AI can grow exponentially. In that case, the power demand growth rate from data centers could be even higher. BCG assumes that efficiency gain will not be able to overcome increasing power demand due to higher AI Model complexity and applicability. They based their statement on historical evidence of steam engines where technological progress increased a resource’s efficiency, but the lower relative cost promoted increased demand for the resource. In the case of AI, we could relate with our experience of increased usages of AI tool with its availability. For example, we use ChatGPT for mundane tasks such as drafting an email.
We have independent variables such as power demand and power mix, and the dependent variable is CO2 emissions. These models used quarterly historical power mix data from the Carnegie Mellon University’s emission index website (CMU, 2024). Descriptive statistics and correlation metrics are presented in Tables 1, 2, respectively. We use this historical data to develop a model to predict CO2 emissions for the forecasted power demand and mix.
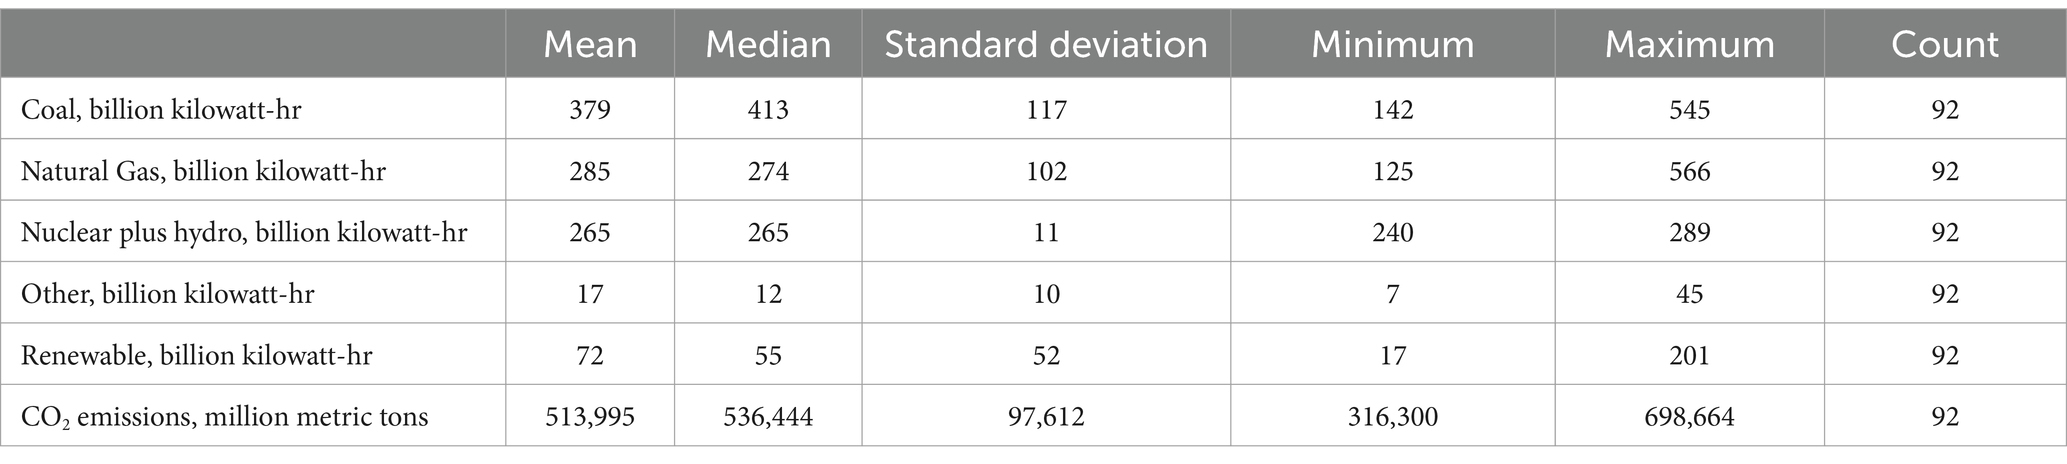
Table 1. Descriptive statistics for dependent and independent variables.
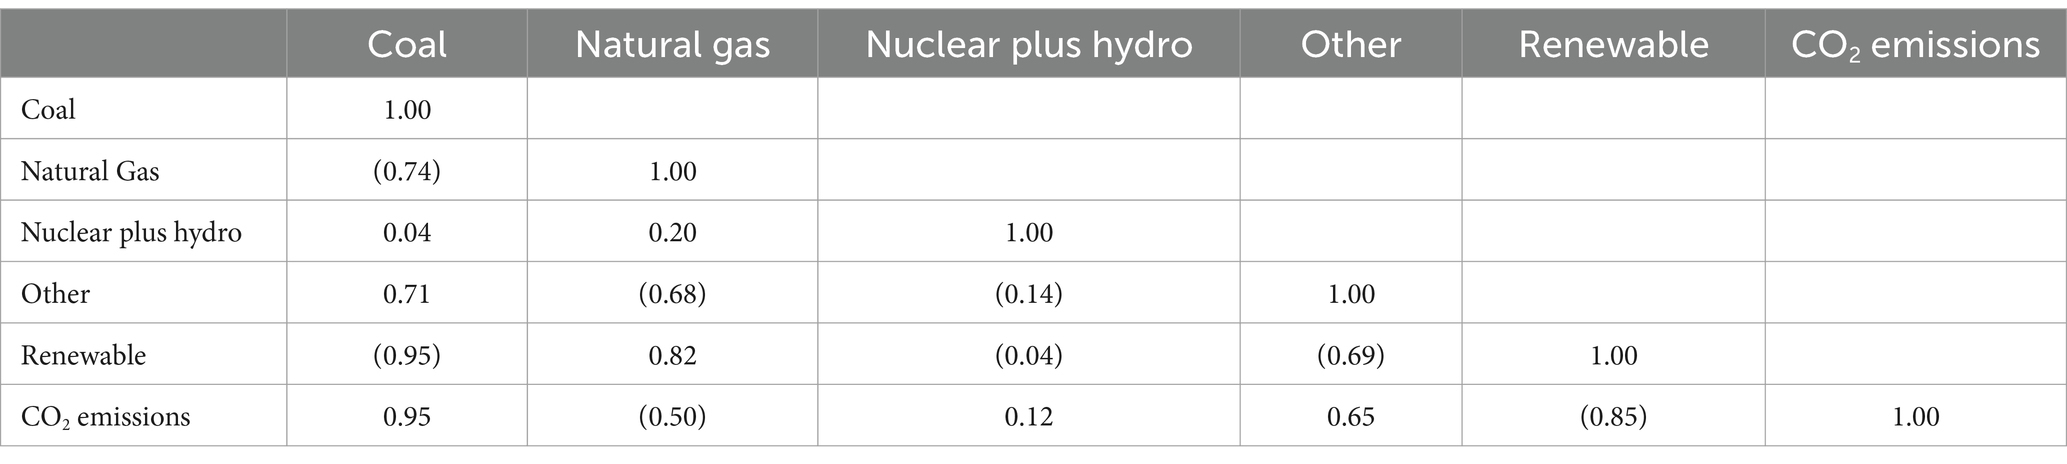
Table 2. Correlation metrics for dependent and independent variables.
We developed 11 AI models to forecast power sector CO2 emissions using quarterly historical power demand, power mix, and emissions data between 2001 and 2022 in Python. These 11 models allow for comprehensive versatility, wide usage in regression tasks, and the ability to handle diverse types to select the best-predictive power. They are from these four groups: Regression models, ensemble-based models, non-linear models, and iterative algorithms. They help in finding the best models to estimate CO2 emissions from data centers.
Linear regression models include:
• Linear regression: This linear regression model assumes a linear relationship between independent (input) variables and the dependent (target) variable.
• Elastic net regression: This linear regression model combines both Lasso and Ridge regression techniques to tackle multicollinearity and feature selection. It includes both Lasso and Ridge penalties.
• Ridge regression: This linear regression model adds an L2 regularization term to the loss function to prevent overfitting by penalizing large coefficients.
• Lasso regression: This linear regression model adds an L1 regularization term to the loss function, encouraging sparsity by driving some coefficients to zero, effectively performing feature selection.
• Huber regression: This linear regression model is less sensitive to outliers compared to standard linear regression. It leverages a combination of squared and absolute loss based on the size of the error.
Ensemble-based models are the following:
• Random Forest: An ensemble technique builds multiple decision trees (usually trained on different subsets of data) and averages their predictions to improve accuracy and reduce overfitting.
• Gradient Boosting: An ensemble method builds sequential decision trees, with each new tree attempting to correct the errors of the previous ones. It is commonly used for both regression and classification tasks.
• AdaBoost (Adaptive Boosting): An ensemble technique combines weak learners (often decision trees) by giving more weight to difficult-to-predict instances in each iteration.
• Non-linear models covered in this study include:
• Decision Tree: A non-linear model splits the data into subsets based on feature values, creating a tree-like structure to make forecasts.
• K-Nearest Neighbors (KNN): A non-parametric model forecasts the value of a target by averaging or using the most common value of the k-nearest data points (neighbors).
Iterative algorithm considered is Orthogonal Matching Pursuit (OMP): A greedy algorithm used for feature selection in linear models. It iteratively selects the most important feature that explains the residuals (errors) of the current model.
We first estimate CO2 emissions using 11 AI models using Python. We then select a model based on its forecast capability. We developed models using 80% of randomly selected data points and retained the remaining 20% data to validate their forecast capability. Using the developed models using 80% of data sets, we estimated the CO2 emissions and compared them with actual data in Figure 3. We found that the linear regression equation has the best prediction capability and also the highest R-square. The linear regression model predicted estimates were within 1% of the actual data. It is noteworthy to mention that the validation data set includes data from 2004, 2009, 2015, and 2023. This validation was tested for different splitting of data between model building and validation such as 2/3rd for building the model and 1/3rd for validation. They yielded the same result. Thus, the acceptable validation provided confidence in the developed regression equation to forecast CO2 emissions from the power sector. Also, the inherent linear nature of relationships between the power mix and emissions makes regression effective. Finally, we developed a linear regression model using 95% of data and kept 5% randomly selected data for testing. The final model also forecasted the actual emissions within 1% error margin. Coal, natural gas, nuclear & hydro, renewable, and others are statistically significant variables with p < ~0.05. The output of the regression has a multiple R as 0.99, an R square as 0.996, an adjusted R square as 0.996, and a standard error as 6.49. The resulting regression equation for the US power sector CO2 emissions is:
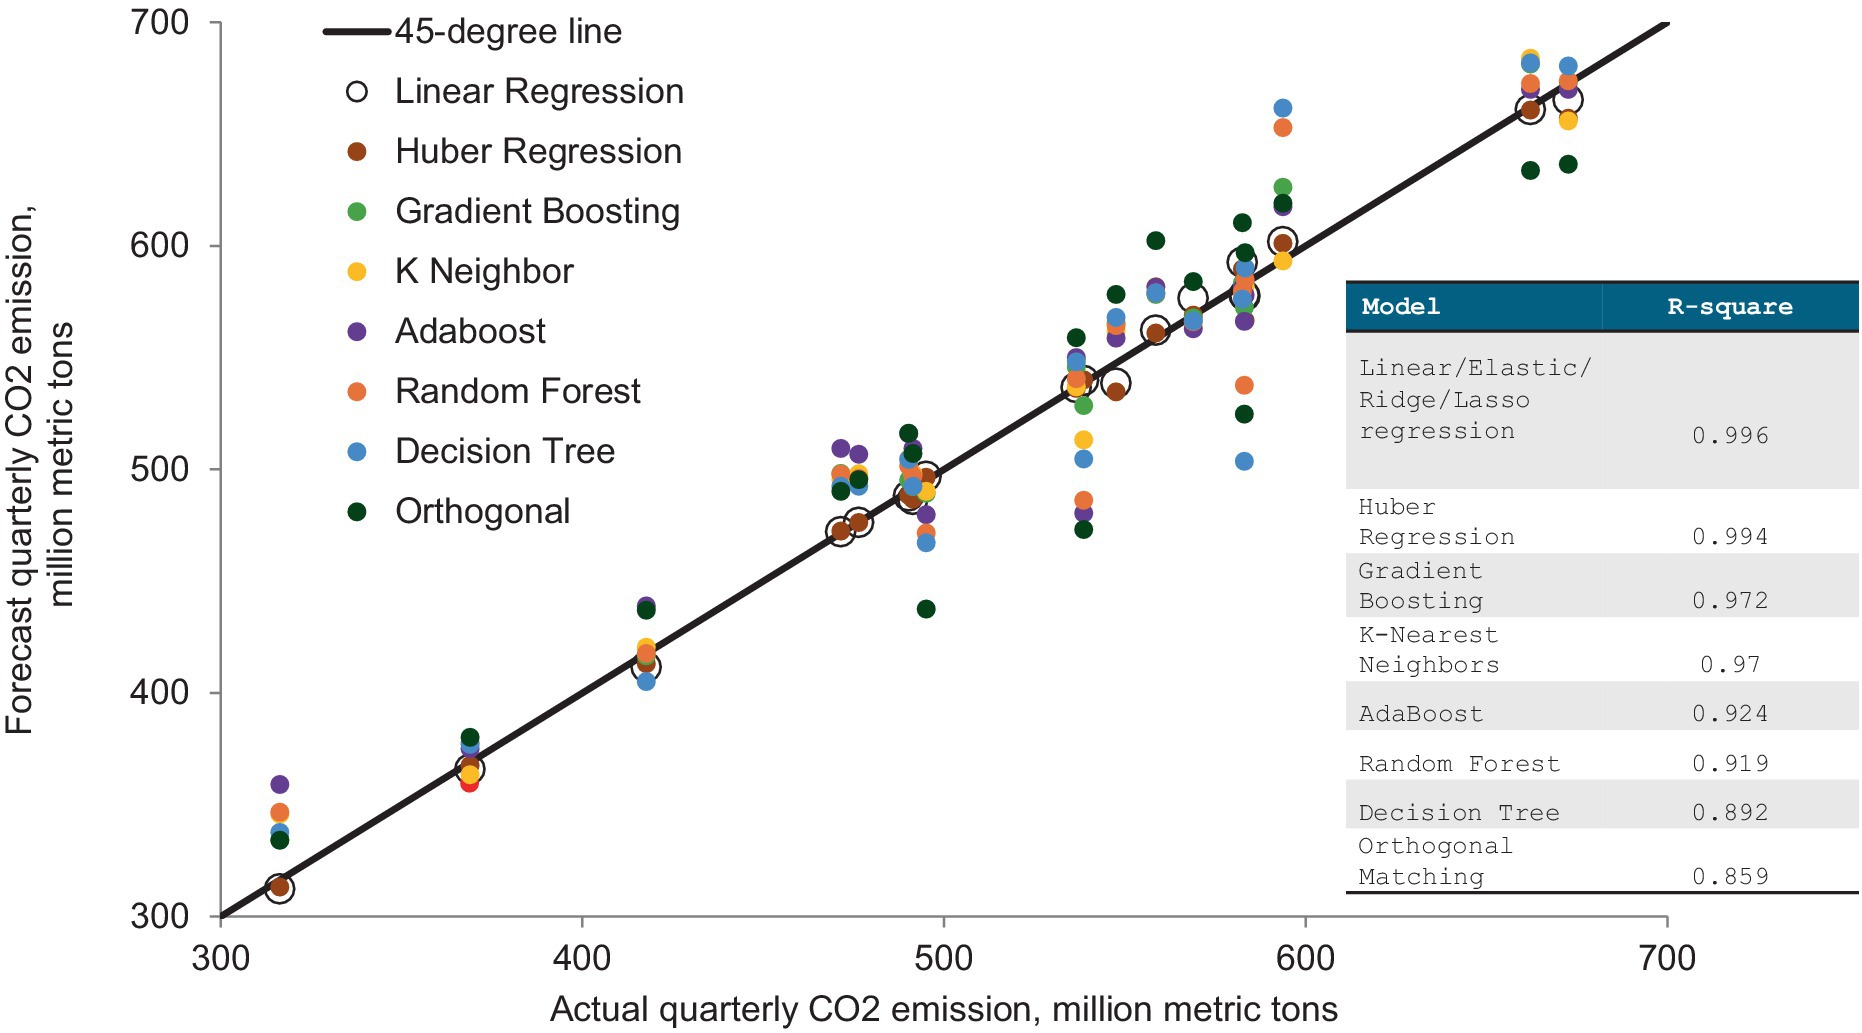
Figure 3. Actual and forecast quarterly US power sector CO2 emissions based on linear regression and other AI models with model R-squares. The data set includes data from 2004, 2009, 2015, and 2023. The solid line is a 45-degree line. Equations for the linear, Elastic, Ridge, Lasso regression are the same and thus only linear regression prediction is shown.
In Equation 1, coal, natural gas, renewable, nuclear & hydro and others are in billion kilowatt-hr. Other contains the remaining sources used in a generation. The details of regression Equation 1 are presented in Table 3. It is noteworthy to mention that Equation 1 is applicable in the range of power-mix and power demand, the regression model is developed. Based on Equation 1, if only renewable energy sources are used, the emissions will be negative, that is not realistic. This is a significant limitation, but that situation is very unlikely. Realistically, the power mix will be across existing sources and will increase CO2 emissions. Thus, we focused on estimation of emissions where CO2 emissions are increased in this paper.
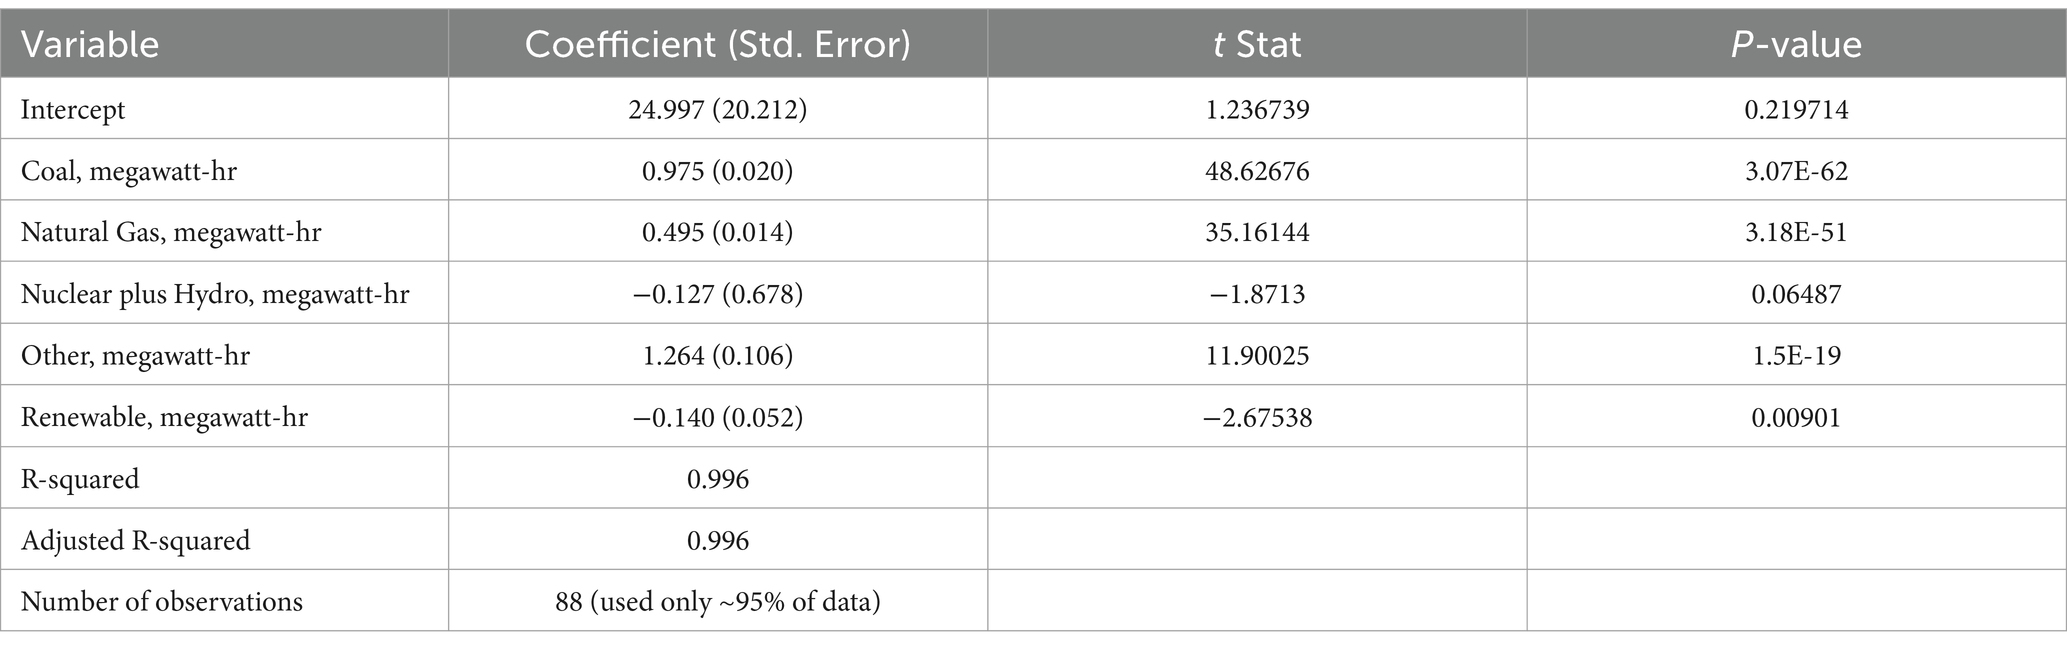
Table 3. Statistical details of the regression Equation 1 for emissions from US power sector.
Similar to this study, prior works also utilized regression analysis to estimate emissions (Keerthana et al., 2023; Jha and Jha, 2024). Jha and Jha (2024) used a linear regression equation similar to Equation 1 to assess how the US is progressing with its set goal for power sector emission reduction. In addition to statistical validation of the regression Equation 1 and being the best among AI models, the linear regression equation in emissions forecast is in alignment with NREL (Gagnon et al., 2023). We finally validate the CO2 emissions of ~0.6% of total US greenhouse emissions from data centers for 2022 with literature. This is in line with the bottom-up estimated emissions for 2021 of ~0.5% (Siddik et al., 2021). The small difference is attributed to a difference in year, and approximation and methodology in these two methodologies.
Linear regression provides a linear equation, which is easy to interpret, and works well with known relationship as the case herein. This is less prone to overfitting but cannot handle outliers well. The present problem does not have drastic variations in the power demand. Algorithms like Random forecast and gradient boosting excel in complex, non-linear relationships, but at a cost of increase computational cost and interpretability challenges. These two are also prone to overfitting but handle outliers well. Thus, a linear regression is a reasonable choice for the present problem.
We used Equation 1 to estimate power sector CO2 emissions forecast for a power mix and power demand. We sourced the base case power demand and mix data from the reference case Energy Information Administration (EIA) 2023 outlook (EIA, 2023). This assumes the growth rates as 0.4% for population, 1.9% for non-labor productivity, 0.4% for nonfarm employment, 1.7% for real disposal income, and 1.4% for GDP. Other assumptions are documented in the outlook (EIA, 2023). Using the base case power demand and power mix data in Equation 1, we estimate base case power sector CO2 emissions. We added a particular data center power demand and its power mixes using NREL scenarios (Gagnon et al., 2023) to the base case EIA power demand and mix data to estimate independent variables for Equation 1. In another words, we split the data center power demand using the power mix to estimate data center generation from different sources. We then use the regression Equation 1 to estimate power sector CO2 emissions for base case plus data centers. The difference in CO2 emissions with data centers and the base case power sector CO2 emissions provides the CO2 emissions from data centers. We present a simple schematic to estimate emissions in Figure 4 and based on the availability of data, we used 2022 as a base year. We used low, mid, and high data center power demand forecasts and 56 NREL scenarios (Gagnon et al., 2023) to estimate CO2 emissions from data centers for 168 different cases. This helps in generating a range of emissions. NREL generates power mixes based on cost of resources and their availability for different policy scenarios.
• Power mix: The NREL generates power mixes by considering natural gas price, renewable energy cost, and renewable resource availability. Three natural gas prices used are reference case gas prices where the low natural gas price driven by high oil & gas resource and technology, and high natural gas price driven by low oil & gas resource and technology. There are two renewable resource cases. The low case assumes a limited supply for wind and PV, and 50% reduction in other renewable energy supply. The reference case uses the NREL’s Regional Energy deployment system model (Ho et al., 2021). Several cost situations are considered such as conservative and advanced batter and CCUS cost and performance. They also used direct air capture constraints on its electricity usages to capture CO2.
• Policy scenarios: The NREL forecasts consider three policy scenarios: (i) progression of current policy of September 2023 to continue, (ii) 95% carbon free power by 2050, and (iii) carbon free electricity by 2035 (100% by 2035). The current policy and 95% carbon free power by 2050 generate similar power mixes and thus resulting in similar results. They did not explicitly use a particular policy for cases (ii) and (iii).
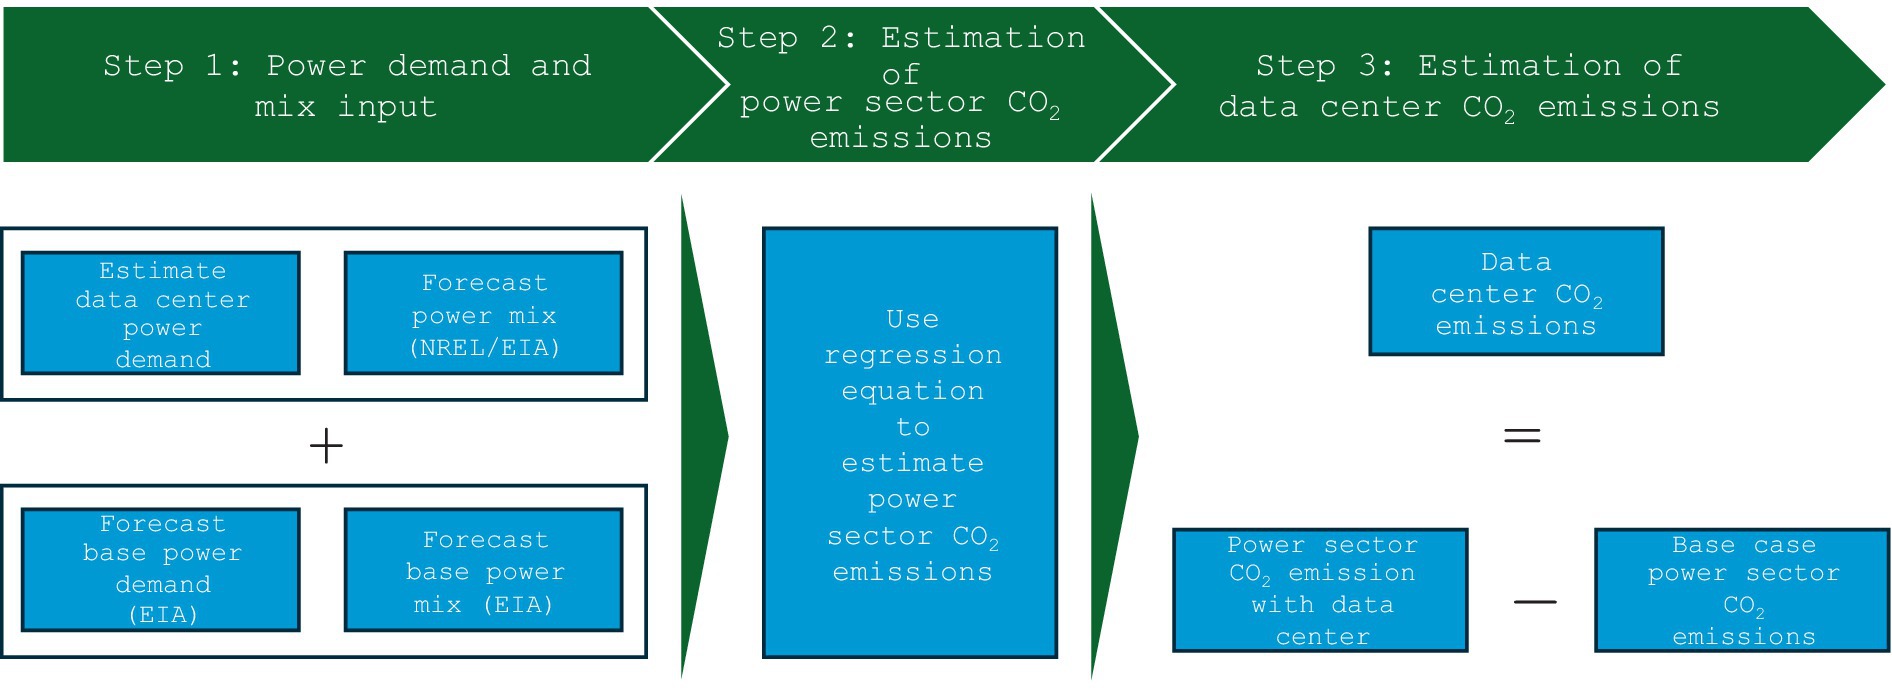
Figure 4. Schematic of estimation methodology for CO2 emissions from data centers.
It is noteworthy to mention that the estimation of emissions from data centers is based on the difference in emissions for power sector with and without data centers. This is a significant assumption but applied in this paper in the absence of the granular historical and forecast data for data centers. Thus, this should be stated or removed in future studies.
We identified five factors necessary for suitable data center locations to reduce emissions. These factors are (i) renewable energy, (ii) base load using natural gas or renewable sources, (iii) grid stability, (iv) energy storage, and (v) government policy. Along with energy sources, we need to focus on grid, storage, and policy. The ability of the local energy grid to handle fluctuations in power demand without disruptions, sufficient capacity for energy storage, such as battery systems, to balance intermittent renewable sources, and supportive state-level policies that incentivize renewable energy usage, emissions reduction, and sustainable infrastructure development. Due to variability and data availability, we limited the analysis to state-level granularity and identified states that are likely to support these factors in the future.
This section first establishes the power demand for data centers. Next, we estimate CO2 emissions for this power demand using the base case power mix for increasing CO2 emissions from data center cases. Following that, we assess the impact of power demand, power mixes, and policy scenarios on CO2 emissions. We then introduce the state-level power mix granularity to refine our emissions estimates based on regional energy sources to assess the state-level impact. Finally, we also highlight suitable states for data centers and additional environmental challenges caused by data centers, such as electronic waste and water consumption.
In this sub-section, we first present the power demand due to data centers. There is a significant uncertainty in power demand due to data centers and we thus provide low, mid, and high case power demand. We present increasing power demand due to data centers for low, mid, and high cases in Figure 5. In the low case, the data center demand increases up to ~200TWh by 2030. To put this in context, 226TWh is the annual electricity consumption of a medium size European country such as Spain in 2023 and ~ 1% of global electricity demand (Enerdata, 2024). The current power demand due to data centers of ~130TWh will increase to 400TWh for the mid case and goes up to ~560TWh by 2030 with a CAGR of 20% high case. 400TWh is the annual power demand of South Korea or Mexico (Enerdata, 2024). 560TWh is the annual power demand of counties like Canada in 2023 (Enerdata, 2024). The power demand due to data centers increases and is driven by increasing usages of AI, crypto mining, and cloud application. A significant difference in forecasted power demand is the extent of uptake in AI demand and efficiency gain. The wider range covers a range of possibilities in the future and highlights their impact in subsequent paragraphs.
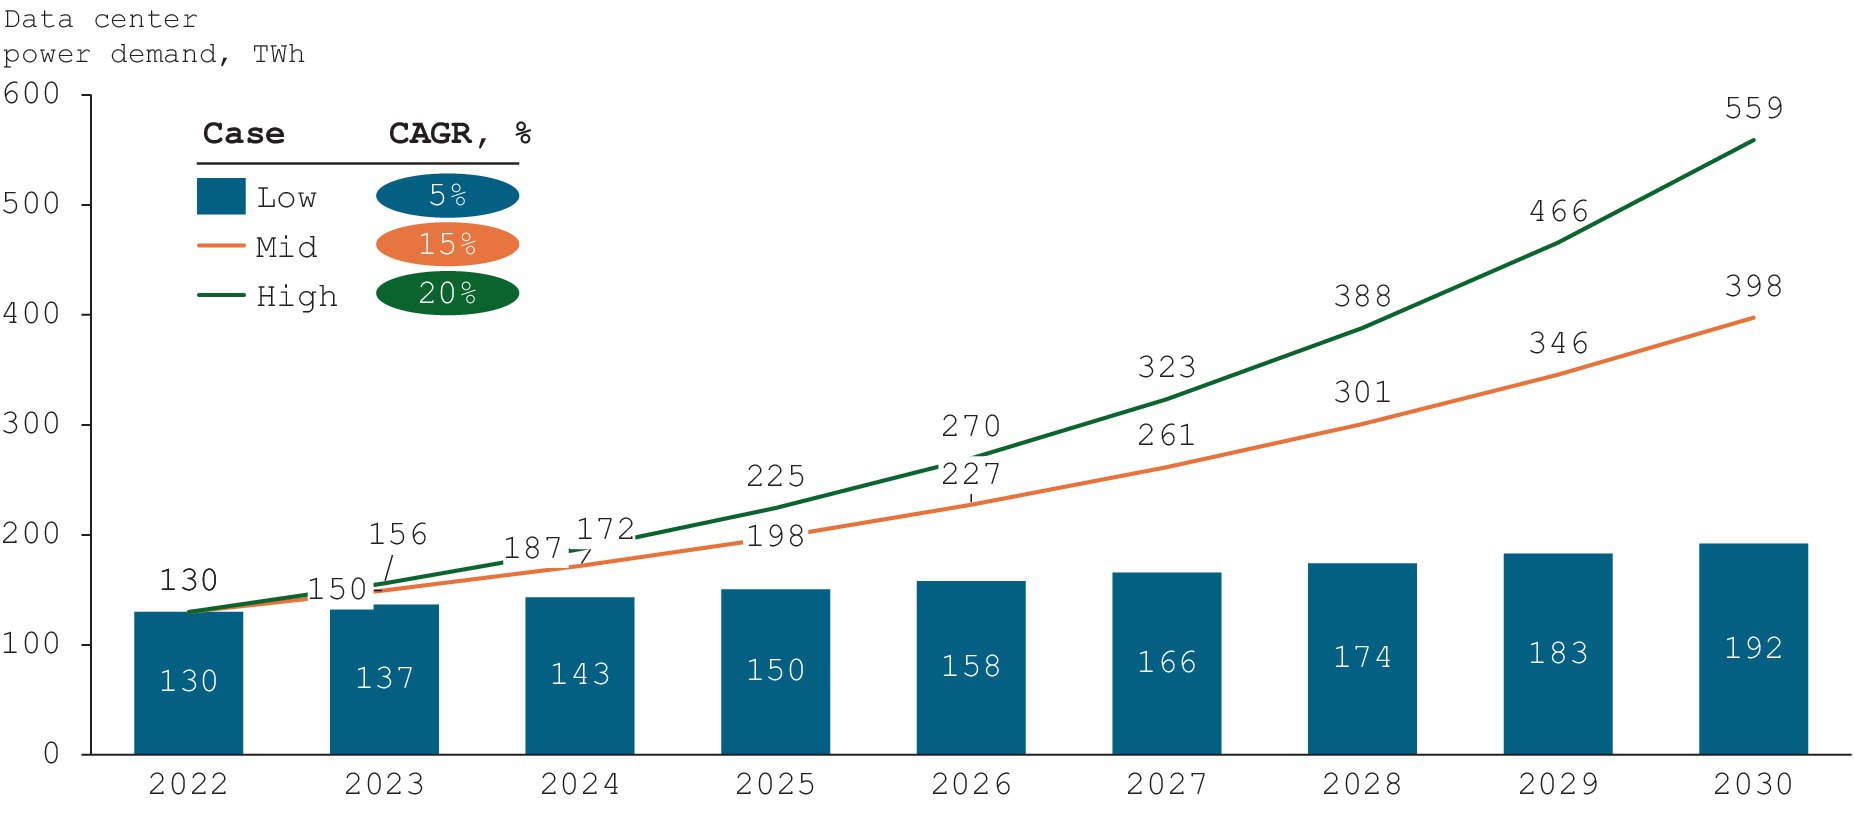
Figure 5. Projected low, mid, and high case power demand for data centers.
We present CO2 emissions for low, mid, and high cases of power demand from data centers considering the EIA forecasted power mix (EIA, 2023) in Figure 6. Currently, power for data centers mostly comes from the grid, and thus the overall power mix will impact data center emissions. We first observe that the CO2 emissions trend for all three power demand cases is similar in Figure 5. First, the curves have a similar trend since they use the same power mix. But for all three cases, the profile is not monotonically increasing, though the power demand in these cases increases. This is due to the variation in the power mix with time, particularly increasing contribution of renewable resources. By 2030, the CO2 emissions due to data centers are estimated to be in between 23 and 66 million metric tons of CO2 for the low and high cases, respectively. They are equivalent to 3.9 and 11.3% of emissions due to the US power demand and 0.5 and 1.6% of the total US emissions in 2030. This range is due to a variation in power demand alone, which is driven by adoption of AI and technological advancements. This estimate suggests that around 1% of US emissions will be from data centers if we use the currently forecasted power mix. We subsequently present the recent emissions increase for select companies such as Google, Microsoft, Meta, and Amazon focusing on data centers in Table 4. All these companies increased their emissions by 30–100% in the last 3 years and are expected to grow in the future (Meta, 2024).
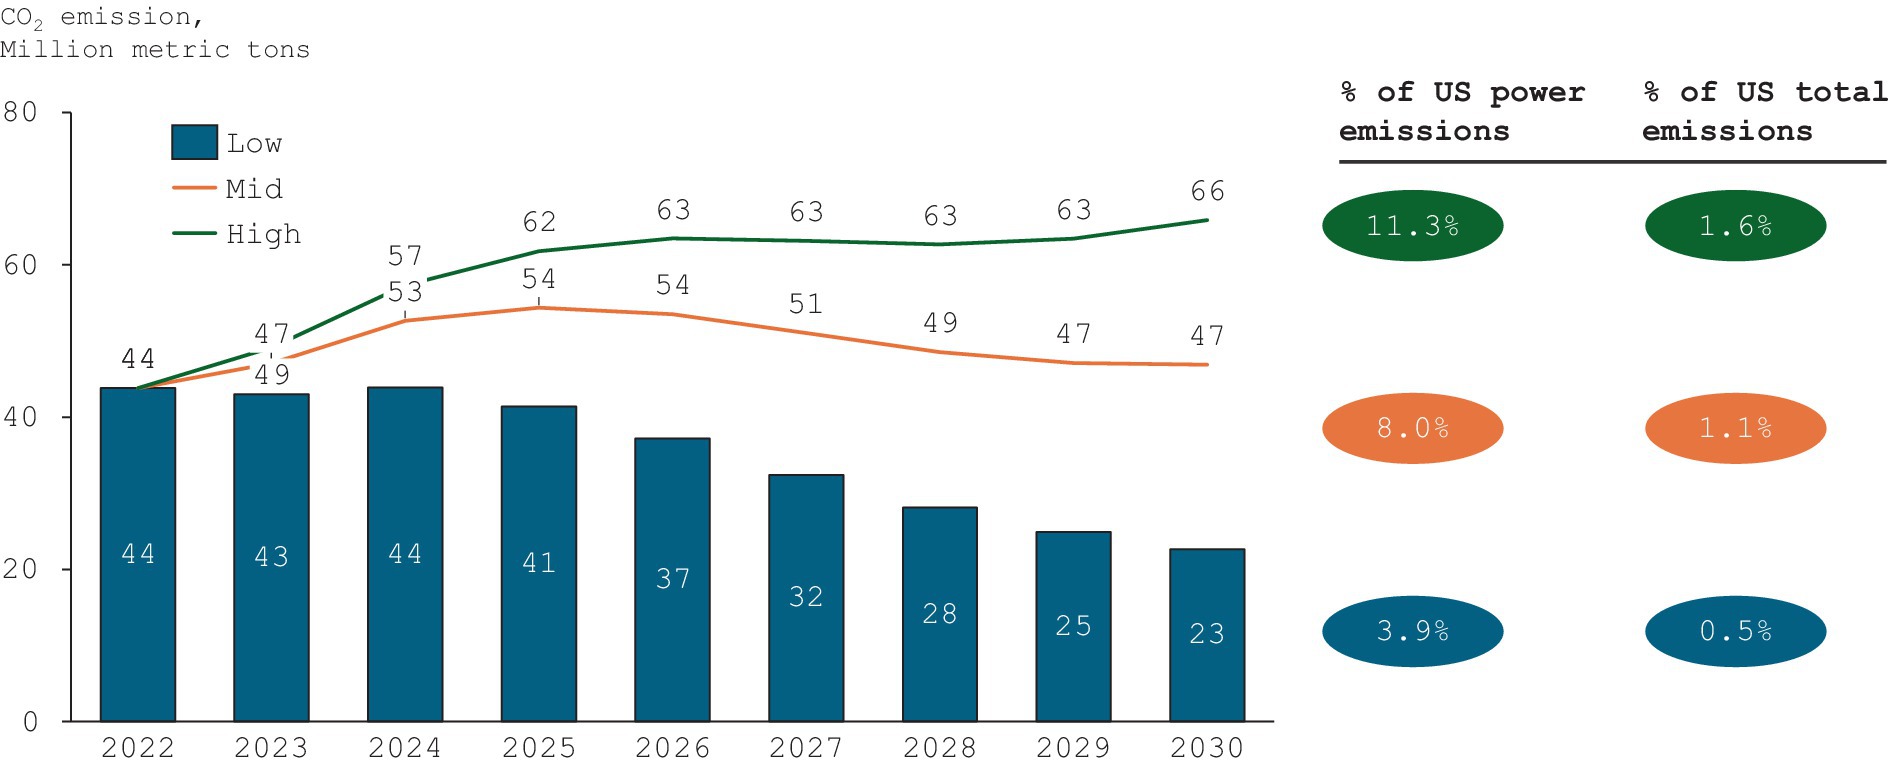
Figure 6. CO2 emissions from data centers for low, mid, and high cases along with % emissions with respect to the US power sector and total emissions in 2030. We used the EIA forecasted power mix (EIA, 2023).
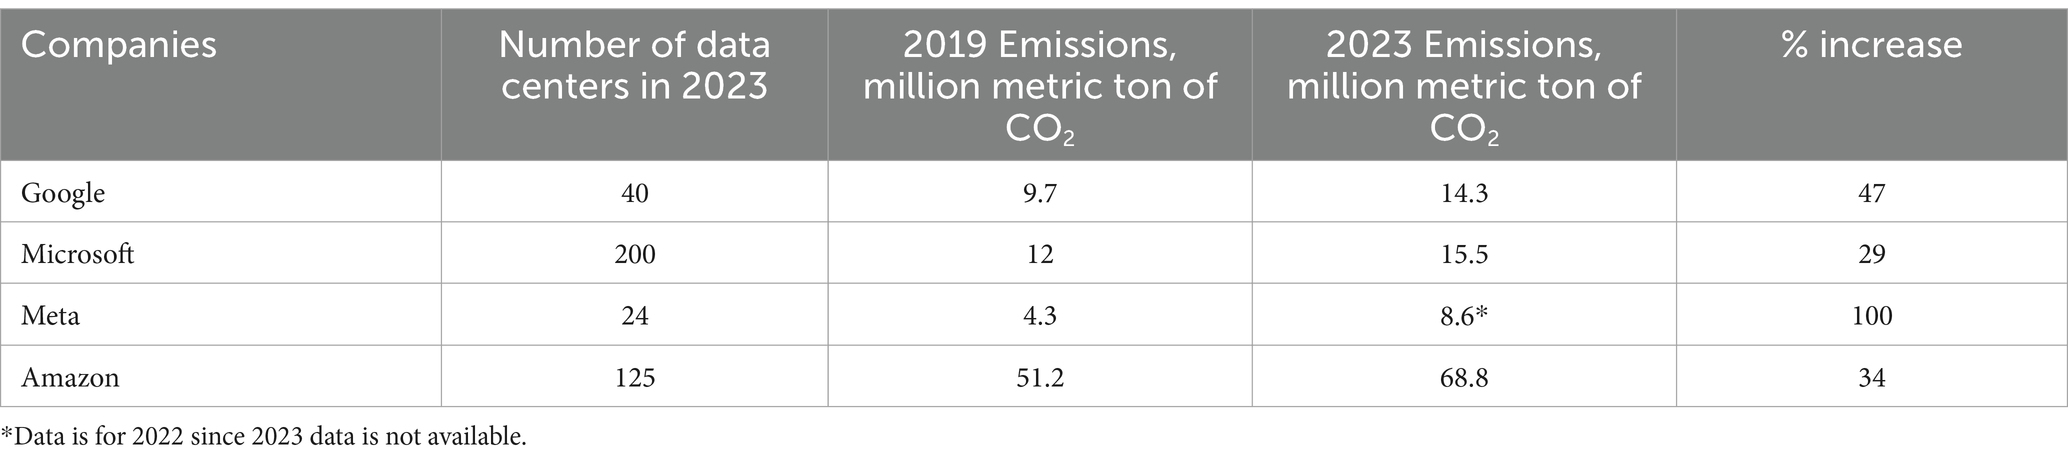
Table 4. CO2 emissions for select companies with data centers (Gstatic, 2024; Microsoft, 2024; Meta, 2024; Amazon, 2024).
We estimate CO2 emissions for 56 cases of power mix and policy variations, as outlined in NREL (Gagnon et al., 2023), for three different data center power demands and considered only increased CO2 emissions cases. However, we present the key cases to highlight factors driving emissions from data centers such as current policy and carbon free power by 2035 (100% by 2035). For each policy scenario and power demand, we show low, mid, and high CO2 emissions in Figure 7. The mid case corresponds to the mid case power mix of the particular policy scenario estimated by NREL (Gagnon et al., 2023) considering central or medial values of all input variables. However, the high and low represent the highest and lowest CO2 emissions for several power mixes for a particular policy scenario and power demand. In Figure 7, we found that the emissions from data centers vary between 3–14% of the 2030 power sector emissions. That is equivalent to 0.4–1.9% of the total US emissions in 2030.
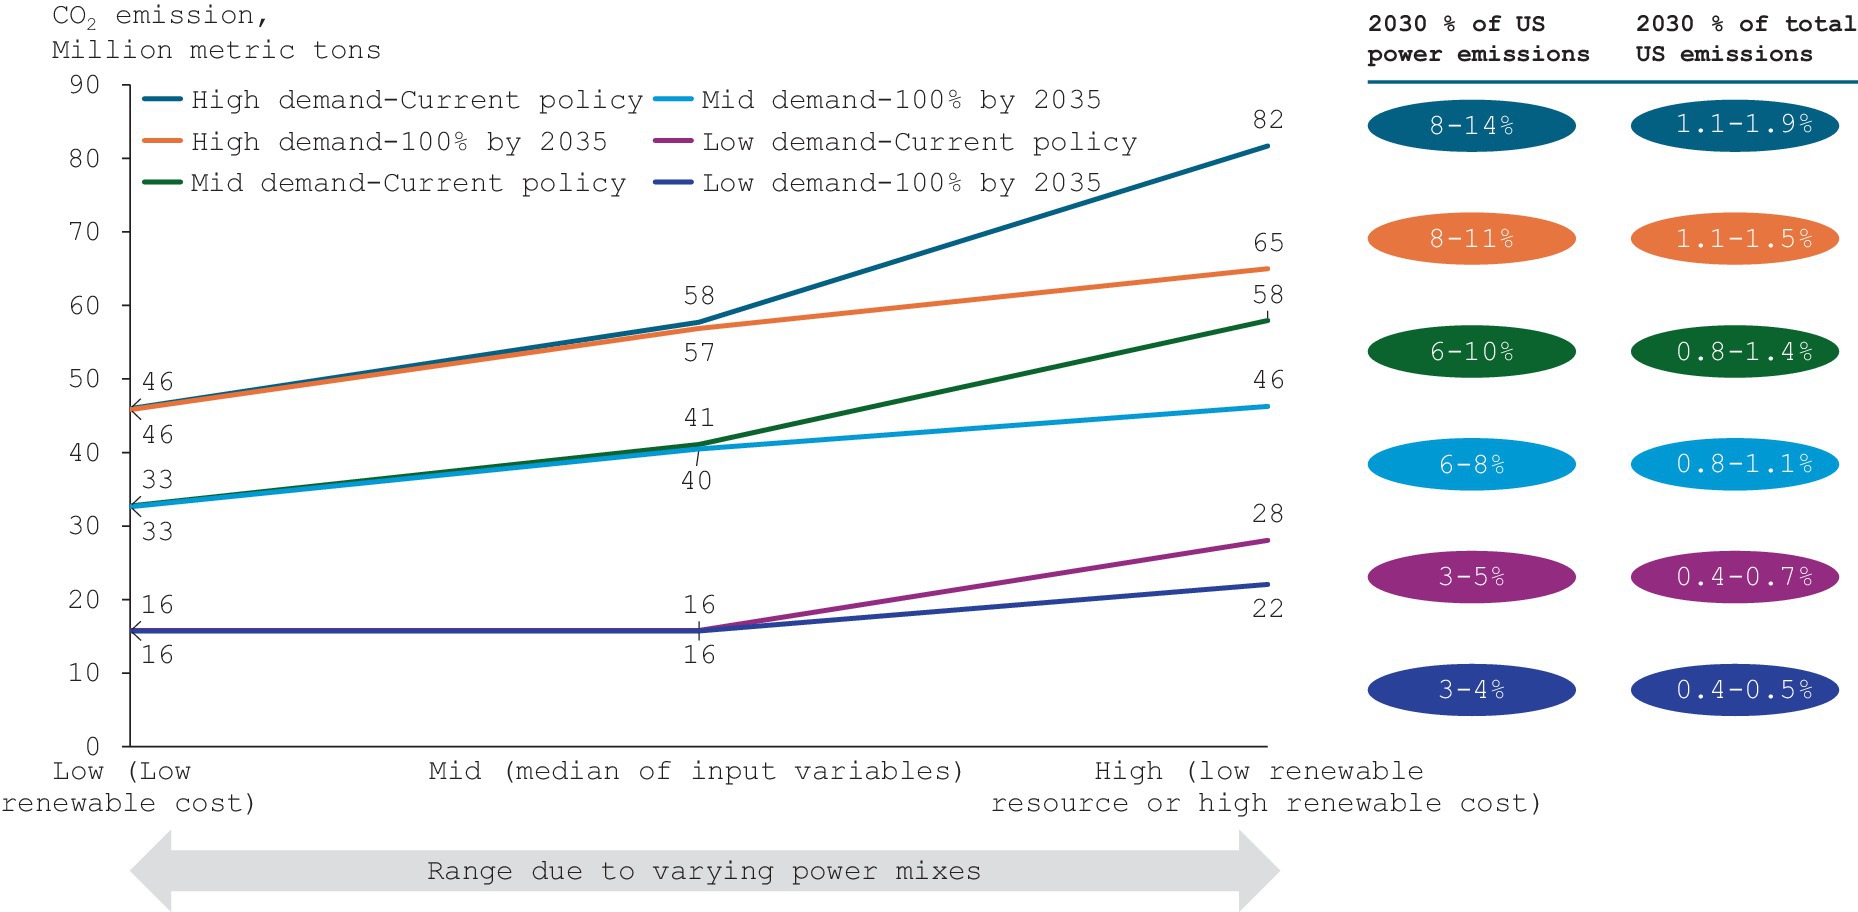
Figure 7. Range of CO2 emissions for different NREL policy scenarios and power mixes (Gagnon et al., 2023) and power demand in 2030. The bubbles on the right side have % emissions with respect to the US power sector and total US CO2 emissions in 2030.
The variability in the power demand has the highest impact on emissions. For the mid case with the current policy, the emissions vary from 16 to 58 CO2 million metric tons due to the power demand range between 192 and 559 TWh. The power demand variation is ~3 times. The variability in emissions due to a power mix change is significant as well. For the mid case, emissions range between 33 and 58 million metric tons for the current policy case. When only renewable resources are used, there will not be increased emissions from data centers. But this is a highly unlikely situation.
For the power mix, the low case corresponds to low renewable cost and availability of renewable resources in the future leading to a greater renewable contribution in the power mix. In contrast, the high case corresponds to high renewable cost or reduced availability of renewable resources leading to higher fossil-based resources in the power mix. The variation between the current policy and 100% by 2035 is not significant and for the mid case it varies between 40 and 41 CO2 million metric tons since the power mix difference is minimal for these two cases.
Across cases, the low and mid cases of the two policy scenarios have nearly similar emissions since low case corresponds to low renewable cost resulting in a similar power mix and the same is the case for the mid case. However, the high case corresponds to the high renewable cost, and this results in high coal usages for the current policy leading to a difference.
Using the NREL’s 56 forecasted scenarios (Gagnon et al., 2023), we estimate emissions using state-level power mixes for states containing a large number of data centers such as Virginia, Texas, California, New York, Washington, and Illinois. In this case, we use the state-level power mix for the national level aggregate power mix to use Equation 1 while estimating the impact of a particular state-level power mix on CO2 emissions and consider only cases with increased CO2 emissions. We divide these states into three categories compared to the estimate using the US power mix: (i) the power mix will reduce emissions, (ii) the power mix will keep emissions similar to US average, (iii) the power mix will increase emissions.
States like Texas, Illinois, and Washington fall into the first category due to significant renewable resources to the power mix in 2030. However, only Texas seems to have surplus power for data centers usages in 2030 (Gagnon et al., 2023). The highest among all scenarios for the Texas power mix increases the US power CO2 emissions by only 2.2%, which is 0.4% of the total US emissions. This is much lower than estimated using the US average power mix. The lower case has minimal increased emissions due to abundance of renewable resources for power. Virginia is in the second category. We found the highest CO2 emissions is 15.7% of the US power emissions, which is 2.2% of the total US emissions. This is slightly higher than the estimate based on the average US power mix, but the low case emissions are lower because Virginia does not use coal, and with a high natural gas price, they are predicted to use mostly renewables in 2030 (Gagnon et al., 2023). New York and California fall into the third category. Using their power mixes, CO2 emissions from data centers will be higher than estimates based on the US average power mix due to their reliance on natural gas in 2030 (Gagnon et al., 2023). California imports ~90% of gas from New Mexico, Texas, Colorado, and Oklahoma using several pipelines such as Northwest Pipeline, Kern River Pipeline, Transwestern Pipeline, El Paso Pipeline, Ruby Pipeline, Mojave Pipeline, and Tuscarora (Natural Gas and California, 2024). Similarly, New York state also imports gas from neighboring Pennsylvania Marcelus, Gulf Coast, Western Canada, and other regions using pipelines such as Algonquin, Spectra, Rockway, Millenium, and others. Given it is easier to transport gas than renewable energy sources, these two states may continue to use natural gas resulting in higher emissions from data centers (Natural Gas | Department of Public Service, 2024). California and New York also do not seem to have surplus power in 2030 (Gagnon et al., 2023). These states have plans to reduce emissions, but they need further efforts and renewable resources. Thus, an effective solution to reduce emissions is to reduce power demand by efficient computing and cooling. When only renewable resources are used, there will not be increased CO2 emissions from data centers. The next step should be the application of renewable resources where cost and technology or availability are key factors. Notably, the data center companies have capital to spend and thus the cost should not be impactful for them. Instead, the availability of renewable resources is the critical driver to reduce emissions.
Cleaner data centers need availability of cleaner power, base load using natural gas or nuclear to balance intermittent renewable supply, grid stability, energy storage, and government policy. The intersection of renewable power and base load offers a suitable location for data centers such as Texas, New Mexico, Colorado, and North Dakota.
Texas is a suitable location for data centers based on the availability of wind, solar, and natural gas. Similarly, New Mexico and Colorado have solar and natural gas, and North Dakota has wind and natural gas. Solar potential is in the South-West USA across California, Arizona, New Mexico, and a part of Texas (EIA Solar, 2024). Wind potential is in the middle of the US from North to South across Texas, Kansas, Wyoming, North and South Dakota (EIA Wind, 2024). Natural gas with proximity to shale basins and nuclear can offer the base load. Abundance of shale gas is across Texas through Barnett, Eagle Ford, Haynesville-Bossier and Permian basins, North Dakota using Bakken basin, and significantly in Pennsylvania and Ohio using Appalachian basin with some in Colorado and New Mexico (UT Library, 2011). Nuclear is across the East coast and in Illinois (NRC, 2020). With respect to grid stability, energy storage, and government policy, all these states are investing in energy storage, but North Dakota may be lagging. States like Colorado and New Mexico are aggressively pursuing renewable energy targets and Texas and North Dakota have a more balanced approach. The Texas grid is vulnerable due to its independence, but other grids are connected to other ISO (independent system operators). Thus, Colorado and New Mexico could be a better alternative for data centers to reduce emissions. Both states have supporting power mixes in 2030 (Gagnon et al., 2023), but do not seem to have much generation. Thus, the data center companies need to invest and generate more power in the future in these states.
Apart from CO2 emissions, data centers generate other environmental wastes such as e-waste and consume water (Figure 2). Typical data center servers, storage, network equipment have a life of 3–5 years (Shehabi et al., 2016). Frequent servers and equipment updates lead to a vast accumulation of obsolete hardware. Data centers generate significant e-waste annually and are expected to increase in the future. This e-waste often contains hazardous materials like lead, mercury, and cadmium, which can contaminate the environment if not properly disposed of or recycled. Adopting circular economy principles (Hoosain et al., 2023; Velenturf and Purnell, 2021) such as recycling hardware components and optimizing cooling systems may help in reducing electronic waste.
Data centers consume significant water at two stages, namely electricity generation and cooling (The Green Grid, 2011), as shown in Figure 2. Water consumption for electricity generation is 7.6 liters per kWh power and that for on-site water cooling is estimated to be 1.8 liters per kWh of total data center site power usage except for closet and room data centers (Osibo and Adamo, 2023). Using these, we estimate water consumption for different power demands and are presented in Figure 8. The data center is currently using around 234 billion liters of water. 234 billion liters of water could supply about 8 million people’s (equivalent of New York City) daily water needs annually. Depending on the power demand, it is expected to grow to 3 to 4 times with water consumption as high as 1,006 billion liters resulting in a significant water consumption in the future in data centers by 2030. It is noteworthy that this is on-site water consumption and the water usage in electricity generation is around 3 times of the on-site usages. These estimates are in line with the previous estimation (Siddik et al., 2021). Google’s data centers in the U.S. used on-site over 3.3 billion gallons of water in 2019 and another 1 billion gallons of water globally (Google Data Center Water Usages, 2023). For example, in states like Arizona and Nevada, data centers are often criticized for their high-water consumption, which exacerbates local water scarcity shortage (Tulsa, 2004).
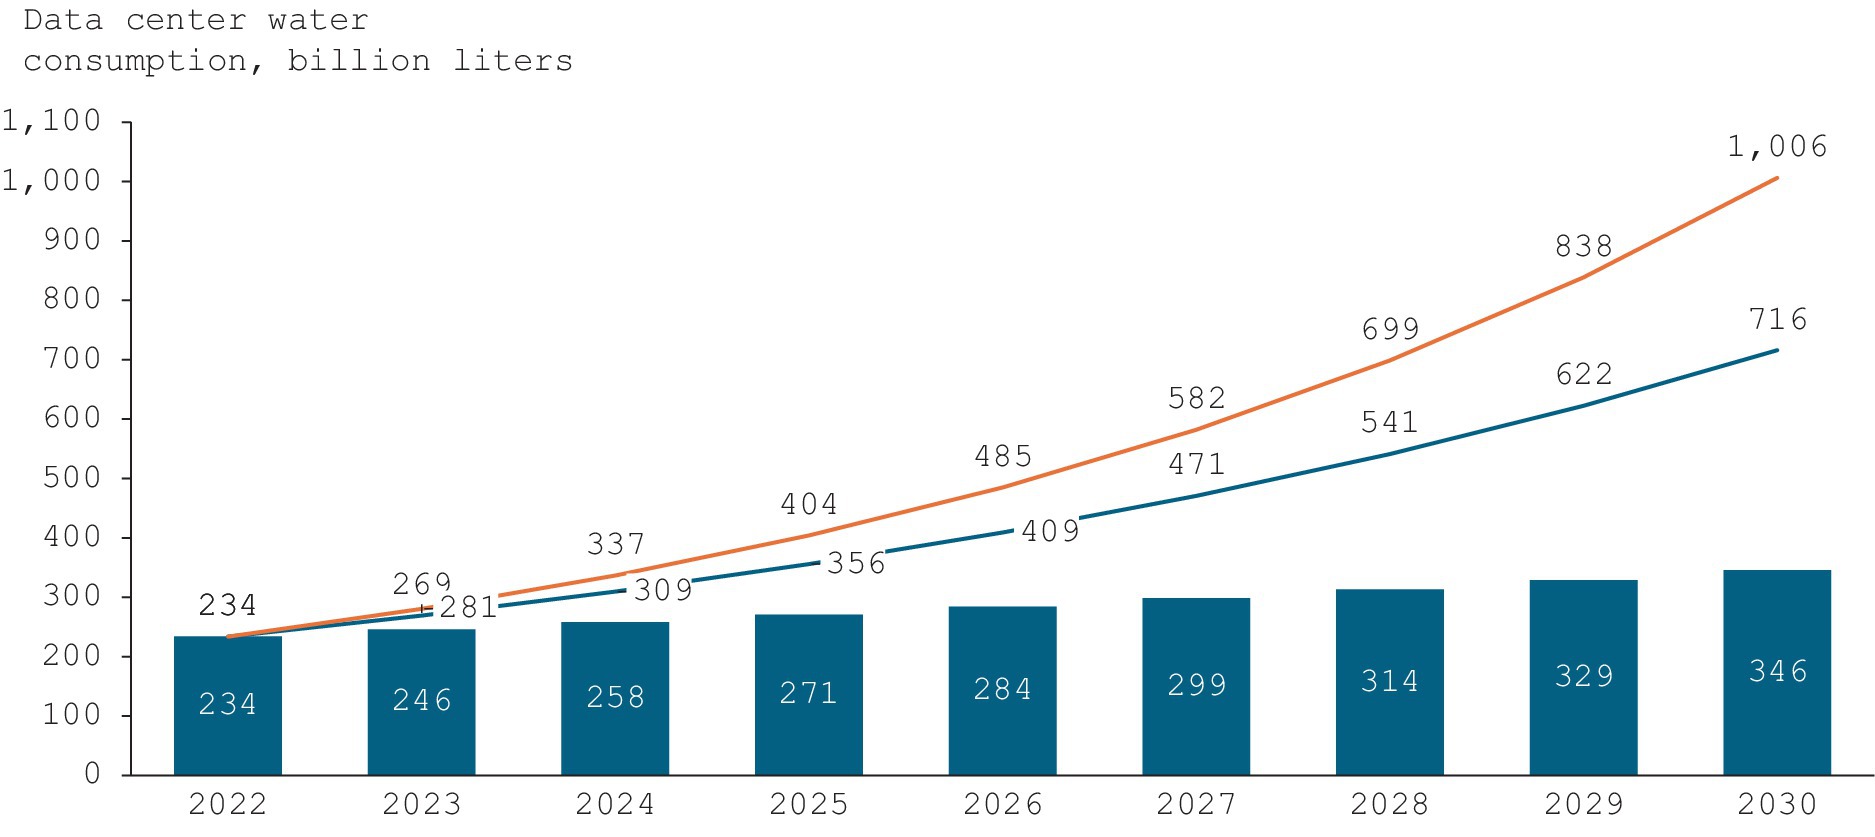
Figure 8. Projected low, mid, and high case water consumption in data centers.
This section first summarizes the results of CO2 emissions from data centers by responding to key research questions established in the introduction section. Following that, we propose mitigation strategies to reduce CO2 emissions from data centers. We then share facilitating policies to address these issues. Finally, we conclude by outlining areas for future work to further refine and improve data center emissions management.
This paper assessed CO2 emissions from data centers by leveraging forecasted data centers’ power demand (Aljbour et al., 2024; Lee, 2024), power mix and policy scenarios (Gagnon et al., 2023), and 11 AI models. We estimated the increased CO2 emissions for the US power sector to assess the impact of data centers using a regression equation, which has the best prediction capabilities among 11 models and highest R-square (CMU, 2024). Thus, the limitations and assumptions associated with the regression model may impact the results. The model outcome and associated analyses helped in answering four research questions as below:
• CO2 emissions from data centers increase between up to ~0.4% and ~ 1.9% of the total US emissions by 2030. The highest variability in data center CO2 emissions stems from AI-driven demand and improvements in data center efficiency and is followed by the power mix. The lower ~0.4% is a result of scaling the currently forecasted power mix in 2030 and conservative AI application demand along with higher application of renewable resources for power. However, the emissions increase can be as high as ~1.9% when AI application demand is high, efficiency gain in chips is limited, cost for renewable is high and/or availability for renewables is limited. When only renewable resources are used for data center power demand, there will not be increased emissions from data centers. But this is a highly unlikely situation.
• Using the state-level power mix forecast for 2030 for cases with increasing CO2 emissions from data centers, Virginia’s power mix is expected to keep emissions estimated in line with the US average power mix. Texas, Illinois, and Washington power mixes are expected to reduce CO2 emissions relative to the average US power mix with only Texas having surplus power. The New York and California power mixes may increase CO2 emissions relative to the average US power mix, and they do not have surplus power for data centers in 2030.
• Based on five factors necessary for suitable data center locations to reduce emissions such as renewable energy, base load using natural gas or renewable sources, grid stability, energy storage, and policy, we found that Colorado and New Mexico could be a better alternative for data centers to reduce emissions. Both states have supporting power mixes in 2030 (Gagnon et al., 2023) but need to invest and generate more power in the future for data centers.
• Along with CO2 emissions, the data center is using 234 billion liters of water currently and is expected to be as high as over 1,000 billion liters of water by 2030. It also generates e-waste and adopting circular economy principles may be helpful.
It is noteworthy that the data centers need high capacity and reliability to maintain power for information technology (IT) and computing whereas renewable sources are not reliable. A practical solution could be energy storage using batteries coupled with renewable power. Thus, our hypothesis is not fully correct that the data centers will increase emissions since it depends on the power mix. The situation with reduced or lower emissions, particularly with only renewable sources, is not captured in the results Equation 1 due to its inherent limitation of being applicable for historical power mixes. We thus focused on the situation with increased CO2 emissions from data centers. When only renewable resources are used, there will not be increased CO2 emissions from data centers. However, this is a highly unlikely situation. Other options to reduce emissions from data centers could include scalability, monitoring and analytics, and research & development.
Based on the findings of the work, we propose the mitigation options for CO2 emissions namely improve power supply mix with a greater renewable content, reduce data center power demand, and carbon capture at generation, as shown in Figure 9.
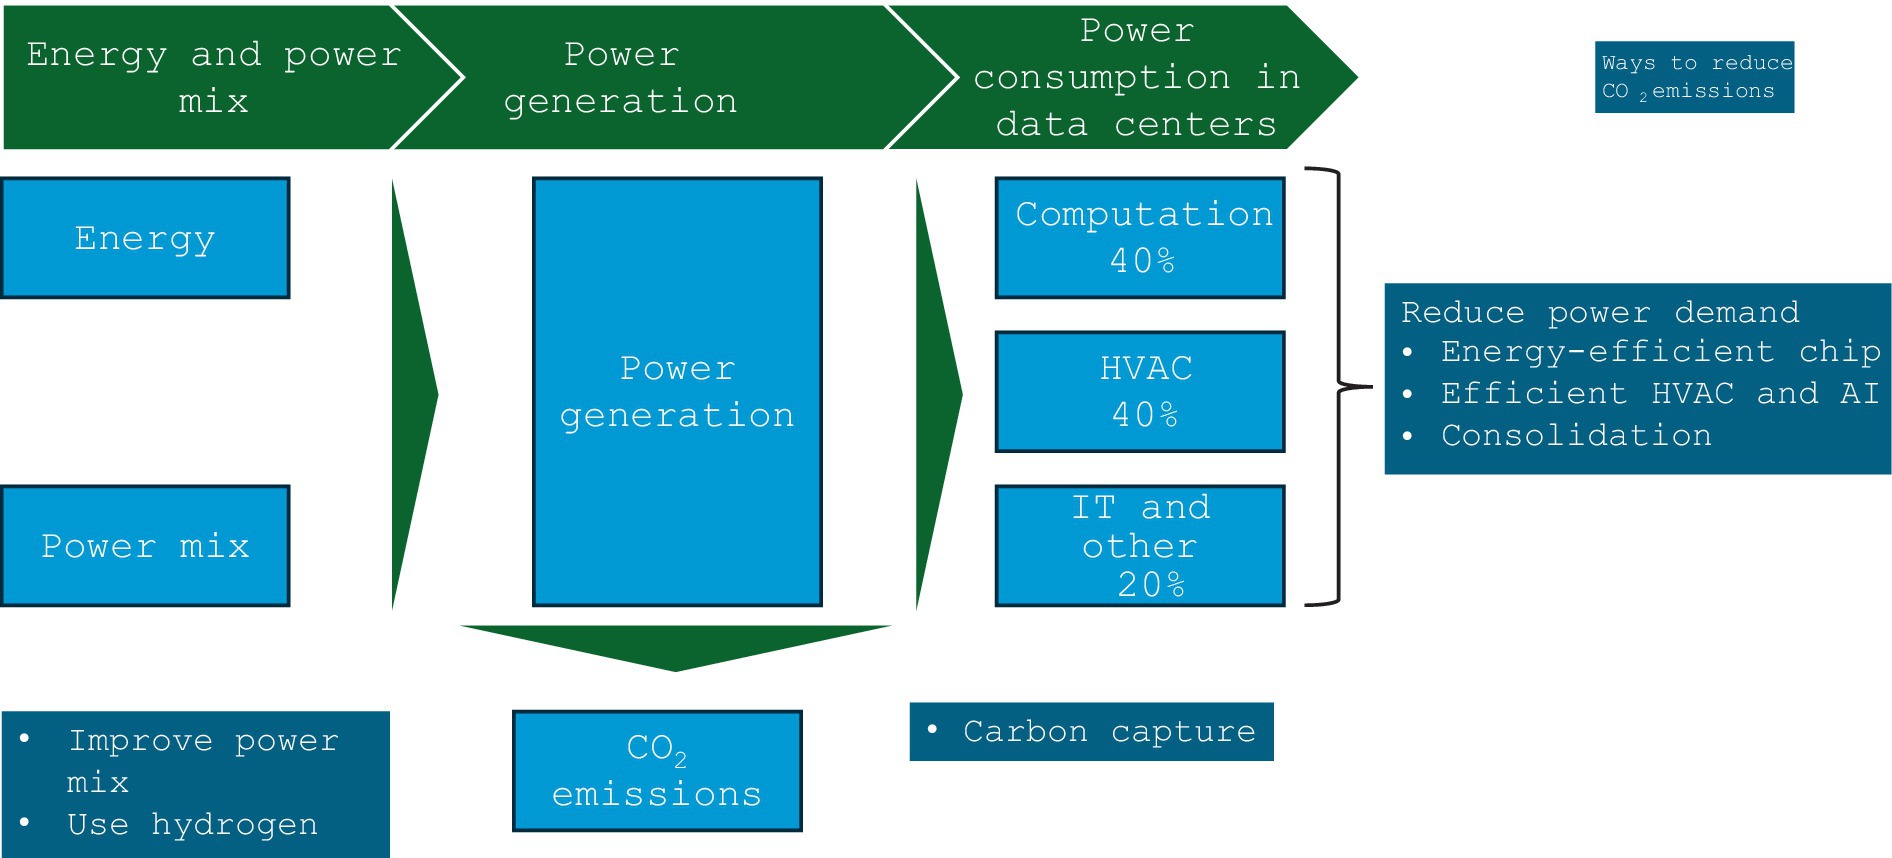
Figure 9. Schematic of energy source to power usage in data centers with highlighting CO2 emission reduction options.
First, we should strive for clean power for data centers using renewable power sources such as solar and wind or hydrogen in the power mix for power plants. Some of the thought leaders are thinking along these lines. For example, Sam Altman from OpenAI (ChatGPT) is targeting solar energy as a solution for this problem (WSJ, 2024). Renewable sources come with limitations such as intermittent supply, need of energy storage, large land and environmental impact, transmission infrastructure, availability of raw materials, and supply chain constraint, recycle and waste management, and economic and policy uncertainty (Duarte and Fan, 2023; Osibo and Adamo, 2023). Solar and wind are intermittent by nature. Along with intermittent supply, this also impacts grid reliability and congestion. Thus, there is a need for large storage or onsite renewable resources (Duarte and Fan, 2023; Acun et al., 2023). Along with large land requirement for wind and solar, they also impact local biodiversity. Renewable sources also require critical materials like lithium, cobalt, and others, and these are concentrated in a few countries like China and Chile thereby posing supply-chain challenges. Finally, recycling of these materials is not fully established. While solar and wind energy are essential for transitioning to a cleaner energy future, their long-term viability is tied to overcoming these technological, environmental, and policy challenges. Solutions like improved energy storage, advanced grid management, and sustainable material sourcing are critical for scaling up renewable energy in the long term. The use of hydrogen in a power mix is promising (Hwang et al., 2023). However, we need further technological and commercial maturity to produce hydrogen using renewable resources before it can be applied.
Second, we should reduce power demand driven by data centers using efficient computational technology, cooling mechanisms, and reducing back up demand. As mentioned earlier, cooling accounts for 40% of power and that can be reduced using liquid cooling such as direct-to-chip and immersion, AI-driven cooling optimization, renewable energy-driven cooling, and heat reuse. For liquid cooling, we use liquid with higher heat capacity to cool chips and also submerge the servers into non-dielectric liquid. For AI-driven cooling, there are examples such as Google DeepMind which analyzes real-time data from sensors resulting in reduced power and autonomous HVAC which utilizes AI algorithms to reduce overall energy footprint. With high solar potential states such as Arizona and Nevada, Apple data centers are mostly powered by solar, and they also use solar for cooling applications. Application of waste heat for community and other purposes eventually reduces power demand. Another 40% of power goes into computation and storage. This can be reduced using energy-efficient hardware, improved power usage effectiveness, intelligent power management (Liu et al., 2012), server lifecycle management, and effective cloud and edge computing. For energy efficient hardware, we should consolidate servers, use newer ARM-based processors, and adopt solid-state drivers. For improved power usage, we should optimize power distribution to reduce power loss and use uninterruptible power suppliers thereby reducing loss due to power back-ups. For intelligent power management, we should use software to scale power based on real-time demand. We should manage server lifecycle effectively to reduce power and other electronic waste. For effective cloud and edge computing, we should migrate to cloud to take advantage of economy of scale and process data closer to source to reduce data transfer.
Third, recent advancements in carbon capture for both scale and technology at power plants could offer a solution (Tollefson, 2023; IEA, 2020). Currently, two large-scale CCUS facilities (Petra Nova Carbon Capture project and the Boundary Dam Carbon Capture project) are in operation in the power sector. Both are CCUS retrofits to existing coal-fired power plants (IEA, 2020).
NREL considered three book ends of policies while estimating the power mix. We used them to generate a range of estimates. However, they were generic and not specific in nature. Thus, we will present next how specific policies will help in reduction of emissions.
Facilitating policies will play a crucial role in reducing emissions from data centers and ensuring a more sustainable future for industry. To reduce emissions from data centers, we need supportive policies for energy, emissions, waste, R&D, and grid infrastructure. We need federal regulation and policy incentives along with the state’s support. Given the diversity across state in terms of the renewable resources, power mix, grid stability, and storage potential and plan, the state’s support with federal will be important. For renewable energy, we should have standards for energy efficiency, incentives for energy efficient technologies and encourage renewable usage using tax incentives and minimum requirements. For emissions, we should implement carbon tax or cap-and-trade and set limits for large data centers. For waste, we should promote reuse, recycle, and refurbishment of hardware and implement ERP laws for life cycle management. We should promote R&D through grants for technology development, private-public partnership, and incentives for startups to reduce power demand for cooling, computation and improvement in grid reliability. We should offer incentives for grid modernization and energy storage through investment or tax credit. In addition, we should establish a certification program for data centers based on emissions and mandate reporting of emissions including third-party audit for transparency. These will help us in accomplishing reduced emissions from data centers in the near future and will be sustainable.
This work quantifies CO2 emissions from data centers and suggests mitigation options, including identifying suitable locations for minimizing emissions. However, this can be expanded greatly by removing assumptions and some of them are listed next.
• Model: The current model is at the US level power sector and applicable in the range of power mixes used for developing the model. The historical power mix used all power resources. First, we should have more granular analysis at the state or county level, with specific historical and forecast data for the power demand and power mix without any limitations. Second, in the absence of granular data for data centers, the current methodology estimates the CO2 emissions for the power sector with and without data centers and the difference between these two cases is attributed to the data centers emissions. In the future, one could model only data centers without considering other applications of power. Third, the selection of data center locations could be further localized to optimize placement based on environmental, power demand & mix, and policy factors. Fourth, the model can also be expanded to dynamically simulate policy changes such as carbon tax and renewable incentives. That is currently handled using the fixed NREL power mix.
• Lifecycle emissions from data centers: The current work only highlights the CO2 emissions due to the power demand from data centers. Applications of AI and cloud computing improve efficiency and productivity, leading to a reduction in CO2 emissions (Luers et al., 2024). Some examples of reducing emissions using AI include predictive maintenance (Hamdan et al., 2024; Bello et al., 2024), efficient manufacturing systems (Mohammad et al., 2025) real-time power allocation, and load optimization (Biswas et al., 2024). These are significant factors. It is outside the scope of the current work and should be incorporated and addressed while estimating CO2 emissions from data centers in future research. Also, one should perform lifecycle emissions from data centers such as including server manufacturing, infrastructure set up and other (Kezhuo and Zhou, 2024).
• Global expansion: The current analysis is restricted to the US only. Expanding the analysis to include global data center emissions and activities, along with a global policy framework for addressing emissions, would be valuable since emissions impact globally and are not restricted to regional boundaries.
• Case studies example: The paper does not list real examples. The future work may analyze case studies examples to reduce emissions from data centers such as co-locating hyperscale data centers with renewable energy farms (Data centers on-site renewable energy, 2023).
• Future technology impact on energy landscape: Future technologies may change the energy landscape such as quantum computing (Sood and Chauhan, 2024). They need to be considered while estimating emissions.
The original contributions presented in the study are included in the article/supplementary material, further inquiries can be directed to the corresponding author.
RoJ: Conceptualization, Data curation, Formal analysis, Investigation, Methodology, Validation, Visualization, Writing – original draft, Resources. RiJ: Conceptualization, Data curation, Investigation, Validation, Visualization, Writing – original draft. MI: Project administration, Supervision, Writing – original draft, Writing – review & editing, Resources, Validation.
The author(s) declare that no financial support was received for the research, authorship, and/or publication of this article.
The authors acknowledge Raghunath Singh Rao of the Marketing Department, University of Texas at Austin, Ajay Kumar of Oklahoma State University, Sudeshna Pabi of EPRI (Electric Power Research Institute), Piyush Choudhary of ONGC Green Limited, and Abhinav Jha of Stanford University for their input and suggestions. They are also thankful to reviewers for their insightful comments to improve the quality of the paper.
The authors declare that the research was conducted in the absence of any commercial or financial relationships that could be construed as a potential conflict of interest.
The author(s) declare that no Gen AI was used in the creation of this manuscript.
All claims expressed in this article are solely those of the authors and do not necessarily represent those of their affiliated organizations, or those of the publisher, the editors and the reviewers. Any product that may be evaluated in this article, or claim that may be made by its manufacturer, is not guaranteed or endorsed by the publisher.
Acun, B., Lee, B., Kazhamiaka, F., Maeng, K., Gupta, U., and Chakkaravarthy, M. (2023). “Carbon Explorer: A Holistic Framework for Designing Carbon Aware Datacenters,” in Proceedings of the 28th ACM International Conference on Architectural Support for Programming Languages and Operating Systems, Volume 2 (ASPLOS 2023). Association for Computing Machinery, New York, NY, USA, 118–132.
Aljbour, J., Wilson, T., and Patel, P. (2024). Powering intelligence: analyzing artificial intelligence and data center energy consumption. EPRI White Paper no. 3002028905.
Amazon. (2024). What Is Cloud Computing?. Available at: https://aws.amazon.com/what-is-cloud-computing/ (Accessed October 2, 2024).
Anders, S., Andrae, G., and Edler, T. (2015, 2015). On Global Electricity Usage of Communication Technology: Trends to 2030. Challenges 1, 117–157. doi: 10.3390/challe6010117
Bashir, N., Irwin, D., Shenoy, P., and Souza, A. (2023). Sustainable computing-without the hot air. ACM SIGENERGY Energy Inform. Rev. 3, 47–52. doi: 10.1145/3630614.3630623
Bello, S., Wada, I., Ige, O., Chianumba, E., and Adebayo, S. (2024). AI-driven predictive maintenance and optimization of renewable energy systems for enhanced operational efficiency and longevity. Int. J. Sci. Res. Arch. 13, 2823–2837. doi: 10.30574/ijsra.2024.13.1.1992
Best, R. (2023). Crypto Users Worldwide 2016-2023. Available at: www.statista.com/statistics/1202503/global-cryptocurrency-user-base/#:~:text=The%20global%20user%20base%20of,platforms%20and%20on%2Dchain%20wallets (Accessed October 20, 2024).
Biswas, P., Rashid, A., Biswas, A., Nasim, M. A. A., Chakraborty, S., Gupta, K. D., et al. (2024). AI-driven approaches for optimizing power consumption: a comprehensive survey. Discover Artificial Intelligence 4:116. doi: 10.1007/s44163-024-00211-7
Chui, M. (2022). The State of AI in 2022-and a Half Decade in Review. New York, NY: McKinsey & Company.
Cisco. (2024). What Is a Data Center?. Available at: www.cisco.com/c/en/us/solutions/data-center-virtualization/what-is-a-data-center.html (Accessed October 2, 2024).
CMU. (2024). US Power Sector Emissions. CMU Power Sector Carbon Index. Available at: emissionsindex.org/#chart-3-view-2 (Accessed June 4, 2024.
Doland (2024). Sustainable Data Center Infrastructure: Reducing the Carbon Footprint of Hardware. London: Data Center Systems, Data Center Systems.
Duarte, J. L. R., and Fan, N. (2023). Operations of data centers with onsite renewables considering greenhouse gas emissions. Sust. Comput. Inf. Syst. 40:100903. doi: 10.1016/j.suscom.2023.100903
EIA. (2023). Annual Energy Outlook 2023- U.S. Energy Information Administration (EIA), March 2023, Annual Energy Outlook 2023: Case Descriptions.
EIA. (2024). Tracking electricity consumption from U.S. cryptocurrency mining operations - U.S. Energy Information Administration (EIA). Available at: https://www.eia.gov/todayinenergy/detail.php?id=61364 (Accessed October 29, 2024).
EIA Solar. (2024). U.S. Energy Information Administration-EIA-Independent Statistics and Analysis. Where Solar Is Found - U.S. Energy Information Administration (EIA). Available at: www.eia.gov/energyexplained/solar/where-solar-is-found.php
EIA Wind. (2024). “U.S. Energy Information Administration-EIA-Independent Statistics and Analysis.” Where Wind Power Is Harnessed - U.S. Energy Information Administration (EIA). Available at: www.eia.gov/energyexplained/wind/where-wind-power-is-harnessed.php.
Elahi, M., Afolaranmi, S. O., Lastra, J. L. M., and Garcia, J. A. P. (2023). A comprehensive literature review of the applications of AI techniques through the lifecycle of industrial equipment. Discov. Artif. Intell. 3:89. doi: 10.1007/s44163-023-00089-x
Enerdata. (2024). Available at: https://www.enerdata.net/estore/country-profiles/canada.html#:~:text=Non%2Dconventional%20oil%20provides%20more,and%2060%25%2C%20respectively) (Accessed December 2, 2024).
Gagnon, P., Pham, A., Cole, W., Awara, S., Barlas, A., Brown, M., et al. (2023). Standard scenarios report: a US electricity sector outlook. No. NREL/TP-6A40-87724. National Renewable Energy Laboratory (NREL), Golden, CO (United States), 2023.
Goldman Sachs. (2024). AI Is Poised to Drive 160% Increase in Data Center Power Demand. Available at: www.goldmansachs.com/insights/articles/AI-poised-to-drive-160-increase-in-power-demand (Accessed November 12, 2024).
Google Data Center Water Usages. (2023). Available at: https://watercalculator.org/news/news-briefs/google-data-center-water/ (Accessed November 2, 2024).
Gstatic. (2024). 2024 Environmental Report. Available at: https://www.gstatic.com/gumdrop/sustainability/google-2024-environmental-report.pdf (Accessed November 23, 2024).
Hamdan, A., Ibekwe, K., Ilojianya, V., Sonko, S., and Etukudoh, E. (2024). AI in renewable energy: A review of predictive maintenance and energy optimization. Int. J. Sci. Res. Archive 11, 718–729. doi: 10.30574/ijsra.2024.11.1.0112
Hao, K. (2020). Training a Single AI Model Can Emit as Much Carbon as Five Cars in Their Lifetimes. New York, NY: MIT Technology Review.
Ho, J., Becker, J., Brown, M., Brown, P., Chernyakhovskiy, I., Cohen, S., et al. (2021). Regional Energy Deployment System (ReEDS) Model Documentation: Version 2020. NREL/TP-6A20-78195. Golden, CO: National Renewable Energy Laboratory.
Hoosain, M. S., Paul, B. S., Kass, S., and Ramakrishna, S. (2023). Tools towards the sustainability and circularity of data centers. Circ. Econ. Sustain. 3, 173–197. doi: 10.1007/s43615-022-00191-9
Huisingh, D., Zhang, Z., Moore, J. C., Qiao, Q., and Li, Q. (2014). Special volume on ‘carbon emissions reduction: policies, technologies, monitoring, assessment and modeling. J. Clean. Prod. 64, 6–8. doi: 10.1016/j.jclepro.2013.07.025
Hwang, J., Maharjan, K., and Cho, H.-J. (2023). A review of hydrogen utilization in power generation and transportation sectors: Achievements and future challenges. Int. J. Hydrog. Energy 48, 28629–28648. doi: 10.1016/j.ijhydene.2023.04.024
IEA (2020). ‘Timely advances in carbon capture, utilisation and storage’ Timely advances in carbon capture, utilisation and storage – The role of CCUS in low-carbon power systems – Analysis-IEA.
Islam, R., Patamsetti, V., Gadhi, A., Gondu, R. M., Bandaru, C. M., Kesani, S. C., et al. (2023). The Future of Cloud Computing: Benefits and Challenges. Int. J. Commun. Netw. Syst. Sci. 16, 53–65. doi: 10.4236/ijcns.2023.164004
Jha, R., and Jha, R. (2024). Evaluating US CO2 emissions targets: statistical models and strategic solutions. Intersect: The Stanford Journal of Science, Technology, and Society. 18.
Keerthana, K. B., Wu, S.-W., Wu, M.-E., and Kokulnathan, T. (2023). The United States energy consumption and carbon dioxide emissions: A comprehensive forecast using a regression model. Sustain. For. 15:7932. doi: 10.3390/su15107932
Kezhuo, M., and Zhou, Y. (2024). A comprehensive quantitative lifecycle cost and environmental impact analysis model for computing infrastructure. Methods X 13:103009. doi: 10.1016/j.mex.2024.103009
Liu, Z., Chen, Y., Bash, C., Wierman, A., Gmach, D., and Wang, Z. (2012). “Renewable and cooling aware workload management for sustainable data centers, Association for Computing Machinery,” in Proceedings of the 12th ACM SIGMETRICS/PERFORMANCE Joint International Conference on Measurement and Modeling of Computer Systems, 175–186.
Luers, A., Koomey, J., Masanet, E., Gaffney, O., Creutzig, F., Ferres, J. L., et al. (2024). Will AI accelerate or delay the race to net-zero emissions? Nature 628, 718–720. doi: 10.1038/d41586-024-01137-x
Masanet, E., Shehabi, A., Lei, N., Smith, S., and Koomey, J. (2020). Recalibrating global data center energy-use estimates. Science 367, 984–986. doi: 10.1126/science.aba3758
McKinsey (2024). AI power: Expanding data center capacity to meet growing demand | McKinsey. Available at: https://www.mckinsey.com/industries/technology-media-and-telecommunications/our-insights/ai-power-expanding-data-center-capacity-to-meet-growing-demand?cid=soc-web (Accessed December 12, 2024).
Meta. (2024). 2023 Sustainability Report Available at: sustainability.atmeta.com/wp-content/uploads/2023/07/Meta-2023-Sustainability-Report-1.pdf
Microsoft (2024). How Can We Advance Sustainability? Available at: query.prod.cms.rt.microsoft.com/cms/api/am/binary/RW1lMjE (Accessed December 2, 2024).
Mohammad, M. A., Liu, C., Zhang, M., Hu, Y., and Xu, Y. (2025). Leveraging AI for energy-efficient manufacturing systems: Review and future prospectives. J. Manuf. Syst. 78, 153–177. doi: 10.1016/j.jmsy.2024.11.017
Monserrate, S. G. (2022). The Staggering Ecological Impacts of Computation and the Cloud. New York, NY: The MIT Press Reader.
NRC. (2020). Map of Power Reactor Sites. Available at: www.nrc.gov/reactors/operating/map-power-reactors.html (Accessed October 9, 2024).
Osibo, B., and Adamo, S. (2023). Data Centers and Green Energy: Paving the Way for a Sustainable Digital Future. Int. J. Latest Technol. Eng. Manage. Appl. Sci. XII, 15–30. doi: 10.51583/IJLTEMAS.2023.121103
Shehabi, A., Masanet, E., Price, H., Horvath, A., and Nazaroff, W. W. (2011). Data Center design and location: Consequences for electricity use and greenhouse-gas emissions. Build. Environ. 46, 990–998. doi: 10.1016/j.buildenv.2010.10.023
Shehabi, A., Smith, S., Sartor, D., Brown, R., Herrlin, M., Koomey, J., et al. (2016). United States Data Center Energy Usage Report. Berkeley, CA: Ernest Orlando Lawrence Berkeley National Laboratory.
Siddik, M. A. B., Shehabi, A., and Marston, L. (2021, 2021). The environmental footprint of data centers in the United States. Environ. Res. Lett. 16:064017. doi: 10.1088/1748-9326/abfba1
Sood, V., and Chauhan, R. P. (2024). Expert systems with applications. Part A 255:124401. doi: 10.1016/j.eswa.2024.124401
Statista (2023). Data Center Market in the United States-Statistics & Facts. New York, NY: Statista.
Strubell, E., Ganesh, A., and McCallum, A. (2019). “Energy and Policy Considerations for Deep Learning in NLP,” in Proceedings of the 57th Annual Meeting of the Association for Computational Linguistics, 3645–3650.
Tambe, N., and Jain, A.. (2024) “Advantages and Disadvantages of Cryptocurrency in 2024.” Forbes, Forbes Magazine. Available at: www.forbes.com/advisor/in/investing/cryptocurrency/advantages-of-cryptocurrency/ (Accessed June 10, 2024).
Tarasov, K. (2024). Generative AI Requires Massive Amounts of Power and Water, and the Aging U.S. Grid Can’t Handle the Load. Englewood Cliffs, NJ: CNBC.
Taylor, P. (2024). Data center average annual power usage effectiveness (PUE) worldwide 2007–2024. Available at: https://www.statista.com/statistics/1229367/data-center-average-annual-pue-worldwide/ (Accessed December 12, 2024).
The Green Grid. (2011). Water Use Effectiveness: A Green Grid Data Center Sustainability Metric. White Paper. Available at: doi: https://www.thegreengrid.org/en/resources/library-and-tools/238-Water-Usage-Effectiveness-%28WUE%29%3A-A-Green-Grid-Data-Center-Sustainability-Metric- (Accessed September 23, 2024).
Tollefson, J. (2023). Carbon capture key to Biden's new power-plant rule: is the tech ready? Nature 617, 658–660. doi: 10.1038/d41586-023-01595-9
Tulsa. (2004). The University of Tulsa, Data centers draining resources in water-stressed communities.
Velenturf, A. P. M., and Purnell, P. (2021). Principles for a sustainable circular economy. Sust. Prod. Consumpt. 27:1437. doi: 10.1016/j.spc.2021.02.018
Wilson, M. (2023). Reducing Data Centers’ Carbon Footprint: Strategies and Tools for Sustainability. London: Nlyte.
WSJ. (2024). Sam Altman Invests in Energy Startup Focused on AI Data Centers. Available at: https://www.wsj.com/tech/ai/sam-altman-investment-exowatt-energy-startup-ai-data-centers-eeeca766
Keywords: data center, AI, CO2 emissions, renewable power, solar, wind
Citation: Jha R, Jha R and Islam M (2025) Forecasting US data center CO2 emissions using AI models: emissions reduction strategies and policy recommendations. Front. Sustain. 5:1507030. doi: 10.3389/frsus.2024.1507030
Edited by:
Andrei Sleptchenko, Khalifa University, United Arab EmiratesReviewed by:
Syed Tauseef Hassan, Nanjing University of Information Science and Technology, ChinaCopyright © 2025 Jha, Jha and Islam. This is an open-access article distributed under the terms of the Creative Commons Attribution License (CC BY). The use, distribution or reproduction in other forums is permitted, provided the original author(s) and the copyright owner(s) are credited and that the original publication in this journal is cited, in accordance with accepted academic practice. No use, distribution or reproduction is permitted which does not comply with these terms.
*Correspondence: Rohan Jha, cm9oYW5zdW1hbjA1MjFAZ21haWwuY29t
Disclaimer: All claims expressed in this article are solely those of the authors and do not necessarily represent those of their affiliated organizations, or those of the publisher, the editors and the reviewers. Any product that may be evaluated in this article or claim that may be made by its manufacturer is not guaranteed or endorsed by the publisher.
Research integrity at Frontiers
Learn more about the work of our research integrity team to safeguard the quality of each article we publish.