 Xiangdong Liang
 Chunhui Dong
- Department of Urology, The Fourth Hospital of Hebei Medical University, Shijiahzuang, China
Background: Prostate cancer (PCa) is one of the most popular cancer types in men. Nevertheless, the pathogenic mechanisms of PCa are poorly understood. Hence, we aimed to identify the potential genetic biomarker of PCa in the present study.
Methods: High-throughput data set GSE46602 was obtained from the comprehensive gene expression database (GEO) for screening differentially expressed genes (DEGs). The common DEGs were further screened out using The Cancer Genome Atlas (TCGA) dataset. Functional enrichment analysis includes Gene Ontology (GO) and Kyoto Encyclopedia of Genes and Genomes (KEGG) to study related mechanisms. The Cox and Lasso regression analyses were carried out to compress the target genes and construct the high-risk and low-risk gene model. Survival analyses were performed based on the gene risk signature model. The CIBERSORT algorithm was performed to clarify the correlation of the high- and low-risk gene model in risk and infiltration of immune cells in PCa.
Results: A total of 385 common DEGs were obtained. The results of functional enrichment analysis show that common DEGs play an important role in PCa. A three-gene signature model (KCNK3, AK5, and ARHGEF38) was established, and the model was significantly associated with cancer-related pathways, overall survival (OS), and tumor microenvironment (TME)-related immune cells in PCa.
Conclusion: This new risk model may contribute to further investigation in the immune-related pathogenesis in progression of PCa.
Introduction
Prostate cancer is regarded as the second foremost reason of death from cancer in men that affects men's health worldwide (1–3), especially in European and American countries (4–6). Surgery and radiotherapy are considered to be the most effective treatment strategies at an early stage (7). Androgen deprivation therapy (ADT) is the main treatment for advanced prostate cancer (8). Although the incidence rate of prostate cancer is low in China, the life span and the dietary structure change are also increasing year by year, with poor differentiation, high malignancy, and poor prognosis (9). Metastatic events are the main cause of death for men with prostate cancer for the reason that PCa can spread to multiple organs in the body (10). The 5 year survival ratio of metastatic prostate cancer is only about 30%. Nevertheless, androgen-deprivation therapy, in general, is not curative. Patients can develop to castration-resistant prostate cancer, which is lethal (10, 11). Therefore, timely diagnosis of PCa is of great importance for treatment and prognosis.
As a heterogeneous disease, the progression of PCa is closely associated with genome instability (12). Studies have indicated that PCa includes a complicated pathogenesis driven by multiple molecular pathways that are highly associated with the survival, metabolic, and metastatic characteristics of aggressive cancers (13). The genes are considered as loci of susceptibility to tumorigenesis in humans (14). Alterations in expression of genetic biomarker have been reported in various tumors (15, 16). However, in the current study, the development and progression of PCa are poorly understood at molecular and genetic levels.
Tumor immunotherapy is becoming a pillar of the cancer therapy armamentarium (17, 18). A growing number of studies suggest that immune responses may be involved in the clinical outcome of prostate cancer (19–21). As we know, tumor-infiltrating immune cells play a very important regulatory role in the tumor microenvironment and are an attractive therapeutic target (22). PCa has been shown to be significantly associated with immune infiltration in several clinical and genomic trials (23, 24). Multiple genes, such as COL3A1, RAC1, FN1, SDC2, and TNB-585, have been proved to be associated with high infiltration immune cells in prostate cancer (25, 26).
Bioinformatics analysis based on high-throughput next-generation sequencing technology enhances our understanding of gene expression function in cancer (27). In addition, transcriptomic data analysis is a useful method to identify DEGs at the genome-wide level, which is beneficial for our better understanding of the potential molecular mechanisms of the regulatory role of gene expression (28). Hence, the application of bioinformatics is useful for the investigation into the underlying mechanism of molecular cell biology in PCa.
In this study, through the integrated analysis of PCa data from the public databases, we screened out the potential genetic biomarkers that play a vital role in PCa. Functional enrichment analysis was performed to study the related underlying mechanism and signaling pathways, including gene ontology (GO) and Kyoto Encyclopedia of Genes and Genomes (KEGG). The Cox regression and Lasso regression analyses were conducted to construct the high- and low-risk gene model. The CIBERSORT algorithm was utilized to clarify the correlation of high-risk and low-risk gene model in risk and infiltration of immune cells in PCa. Integrated analysis for identifying novel biomarkers might be beneficial to PCa treatment and has a better understanding of the pathological mechanism.
Materials and Methods
Data Preparation and Processing
The high-throughput datasets GSE46602 (29) of PCa was acquired from the public GEO database (https://www.ncbi.nlm.nih.gov/geo). The GSE46602 dataset contains 36 tumor tissues and 14 normal prostate biopsies. In addition, the RNA-sequencing data of PCa and normal control tissues were obtained from the The Cancer Genome Atlas (TCGA) database (https://portal.gdc.cancer.gov/). The PCa samples were analyzed using integrated bioinformatics methods, and samples without complete clinical information were excluded. In addition, the RNA-seq data and clinical information of 492 PCa samples were obtained from the TCGA database.
Identification of Differential Expression Genes (DEGs) in PCa
The RNA expression profile carried out normalization with the Affy package. The RNA expression profile was analyzed by the limma R package (30). The DEGs were displayed in the form of the volcano plot and heat maps and identified old change of log2 > 1.5 and p-value < 0.05. The R ggplot2 package in the R analysis platform was plotted to present the heat maps and clustering of DEGs.
Functional Enrichment Analysis
To evaluate the potential role of common DEGs in PCa development, GO functional enrichment analyses were used to analyze the biological process (BP), cellular component (CC), and molecular function (MF) of DEGs. In the current study, GO analysis of DEGs was performed by DAVID (31, 32) (https://david.ncifcrf.gov/conversion.jsp). Functional enrichment analysis of KEGG was mainly used to analyze the signaling/metabolic pathway through which differentially expressed genes may perform their biological functions (33). P-value < 0.05 was considered as the critical value for screening the significant enrichment pathway.
Cox Regression and Lasso Regression Analysis
Lasso regression was performed to characterize the high frequency features (34). Then, the univariate Cox regression analysis was performed to screen out the genes with significant correlation (p < 0.05). Next, the least absolute shrinkage and selection operator (lasso) regression was carried out to further reduce the number of genes. We used the glmnet3 package (35) to conduct Lasso cox regression analysis based on machine learning to identify the optimal prognostic signature. In the next step, multivariate regression analysis was carried out, step function was used for stepwise regression screening, and finally, the model constructed by the three genes was obtained. Based on the expression of 3 genes in the constructed model, a new risk scoring model was constructed by multivariate Cox regression evaluation. The risk score was then determined, and the sample was stratified into high- and low-risk groups according to the median risk score to verify whether the risk score was an independent predictor.
Immune Infiltration by the Cibersort Analysis
CIBERSORT algorithm (36) was a mean to discriminate a signature between twenty-two human immune cell phenotypes, including memory B cells, activated CD4+ T cells, neutrophils, and so on. The CIBERSORT algorithm was used to quantify the proportion of immune cells in PCa. PCa gene expression profiles from the TCGA database were uploaded to the CIBERSORT, and 1,000 permutations were run. Data with p-value < 0.05 after the CIBERSORT were performed for the analysis to improve the accuracy of the deconvolution method. The CIBERSORT software package in R software was used for data analysis. Wilcox test was used to compare the relative abundance of the TIIC between high- and low-risk groups.
Survival Analysis
Correlation between 3 genes and the overall survival of patients with PCa were analyzed utilizing the GEPIA database (37). According to each hub gene's best-separation cutoff value, samples of patients with PCa within the dataset were divided into two groups to obtain the Kaplan–Meier (K–M) survival curves. ROC curves were carried out to investigate the prognostic value in 1, 3, and 5 years by utilizing the survival ROC package (v1.0.34) based on the GSE46602 dataset.
Gene Set Enrichment Analysis (GSEA) of High- and Low-Risk Patients With Pc
GSEA (Version 4.1.0) was used to screen for gene clusters associated with risk score phenotypes, which were overrepresented in large groups of genes. Enriched P-values were calculated based on 1,000 permutations; FDR values were calculated using the Benjamini–Hochberg multiple test correction program (p < 0.05). In addition, the enrichment pathways of each phenotype were classified by nominal P-value and standard enrichment score (NES) (38).
Results
Identification of Differentially Expressed Genes
Firstly, in order to find out the difference in genetic expression between PC tissue and normal tissue, DEGs were identified based on the RNA-Seq dataset (GSE46602) (p < 0.05 and log2 FC > 1.5). As seen in Figure 1A, a total of 841 DE-pcRNAs were identified, which include 269 upregulated DEGs and 572 downregulated DE-pcRNAs. What is more, to have a clearer understanding of the expression distribution of differential genes in the ischemic stroke group and the normal group, we performed heat map cluster analysis on DEGs (Figure 1B). Besides, we also screened out the TCGA database for DEGs in PCa and took the intersection with DEGs in the GEO database. A total of 385 common DEGs were obtained.
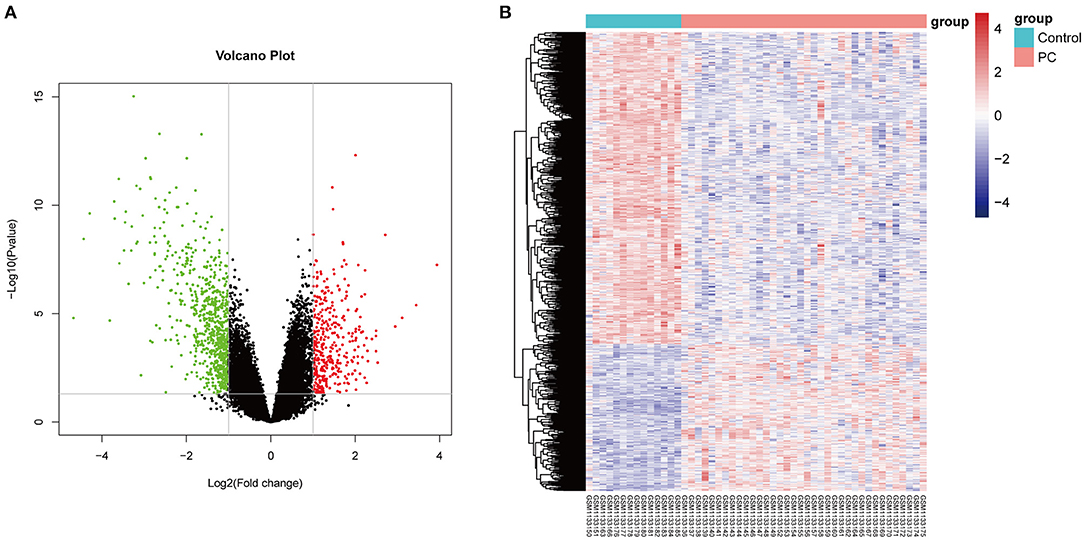
Figure 1. The differentially expressed genes (DEGs) in prostate cancer. (A) The Volcano plot shows the differentially expressed genes in the dataset GSE46602. The red color indicates the upregulated genes in prostate cancer, and the green color indicates the downregulated genes in prostate cancer. (B) The heat map shows the DEGs between prostate cancer tissue and normal controls.
Functional Enrichment Analysis of Common DEGs
Thereafter, to further uncover the function and pathways of common DEGs in PCa, functional enrichment analysis, including GO and KEGG functional enrichment analysis, was conducted. The top 10 significantly enriched terms of biological processes (BP), cell component (CC), and molecular function (MF) were shown. As seen in Figure 2A, terms like response to oxidative stress and epithelial cell morphogenesis were significantly enriched in BP (Figure 2A), collagen–containing extracellular matrix and basement membrane were significantly enriched in CC (Figure 2B), extracellular matrix structural constituent and peroxidase activity were significantly enriched in CC (Figure 2C). What is more, the results of the KEGG pathways analysis of DEGs showed that signaling pathways like glutathione metabolism, histidine metabolism, and so on were significantly enriched (Figure 2D). The functional enrichment results revealed that the common DEGs are vital to the progress of PCa.
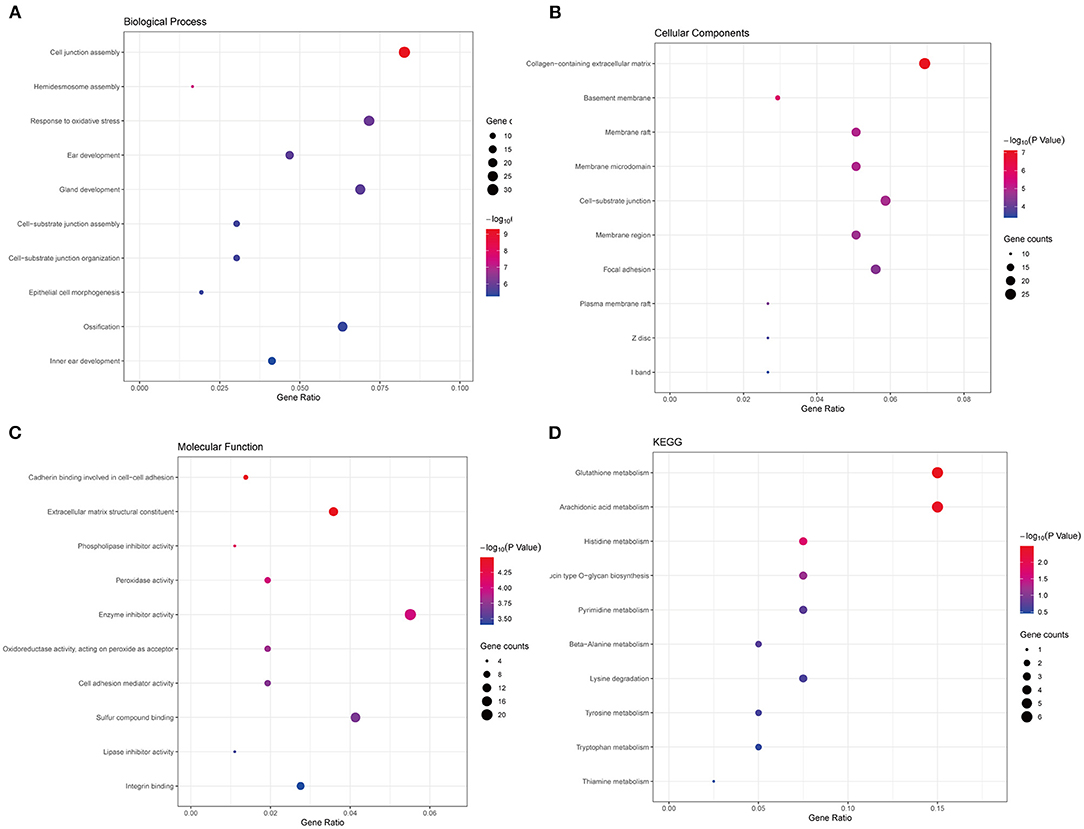
Figure 2. Functional enrichment analyses of the common DEGs. (A) The top 10 significantly enriched biological process terms. (B) The top 10 significantly enriched cellular component terms. (C) The top 10 significantly enriched molecular function terms. (D) The KEGG pathway analysis of the common DEGs.
Cox Regression and Lasso Regression Analysis
In the next step, to further compress the target gene and construct immune gene models, Cox regression analysis was carried out with a threshold of p < 0.05. Lasso regression, a kind of compression estimation (39), was further compressed to reduce the number of genes (Figures 3A,B), and six genes were obtained. Then, multivariate regression analysis was performed. Step function was used to screen by the stepwise regression method, and finally, the risk model constructed by three genes (KCNK3, AK5, and ARHGEF38) was obtained. Next, the samples were divided into high-risk and low-risk groups based on the risk model for the following analysis. The expression level of KCNK3, AK5, and ARHGEF38 in primary tumor and solid normal tissue is shown in Figure 3C. AK5 and ARHGEF38 have lower expression in the solid normal tissue compared to primary tumor. The expression of KCNK3 is higher in the primary tumor. Besides, the relative expression of KCNK3, AK5, and ARHGEF38 in low-risk and high-risk samples is presented in Figure 3D. The sensitivity and specificity of the risk score model were demonstrated by constructing an ROC curve. The area under the curve (AUC) was calculated to be 0.6 at 1 year, 0.87 at 3 years, and 0.88 at 5 years (Figure 3E).
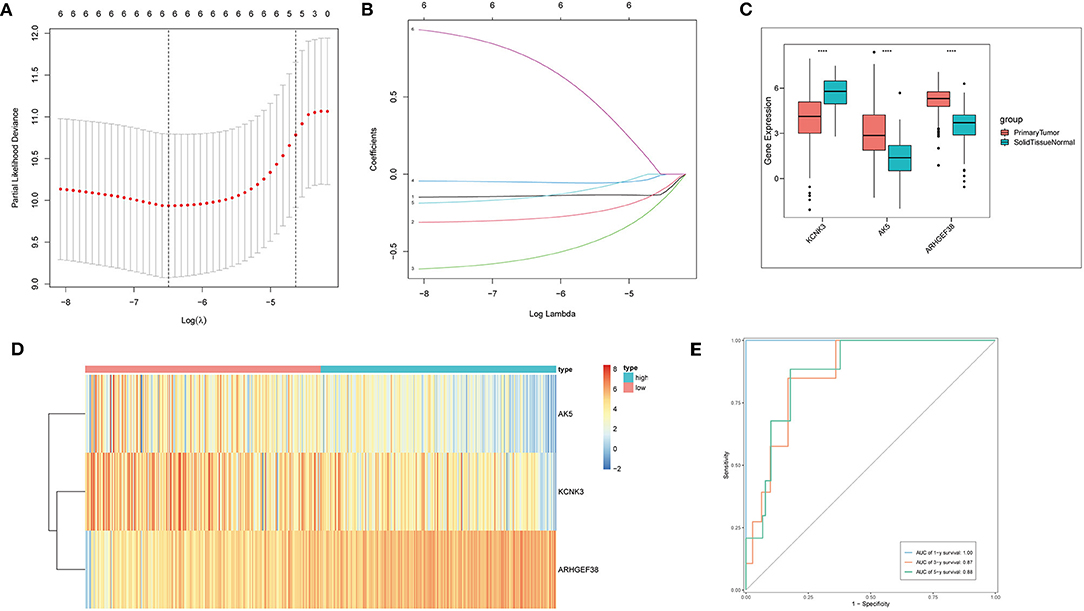
Figure 3. Cox regression and lasso regression analysis. (A,B) Cox regression and Lasso regression were performed to obtain six genes. (C) The relative expression of AK5, KCNK3, and ARHGEF38 in primary tumor and normal solid tissue. (D) The heat map of AK5, KCNK3, and ARHGEF38 expression profiles. (E) Time-dependent ROC curves.
Survival Analysis of the Risk Model
To investigate the clinical significance of the risk model, the survival analyses were performed. Overall survival (OS) analysis was conducted to assess the effectiveness of the KCNK3, AK5, and ARHGEF38. As seen in Figures 4A–C, the high expression of ARHGEF38 was associated with a lower survival probability (p = 0.00226), while the high expression of KCNK3 (p = 0.0339) and AK5 (p = 0.0382) was related to a better survival probability. The results indicated that gene changes of KCNK3, AK5, and ARHGEF38 were significantly related to the OS of patients with PCa. What is more, patients with high-risk (red line) PCa presented remarkably worse OS than low-risk ones (blue line). As shown in the survival risk heat map, patients with PCa with higher risk scores had higher mortality (Figures 4E,F).
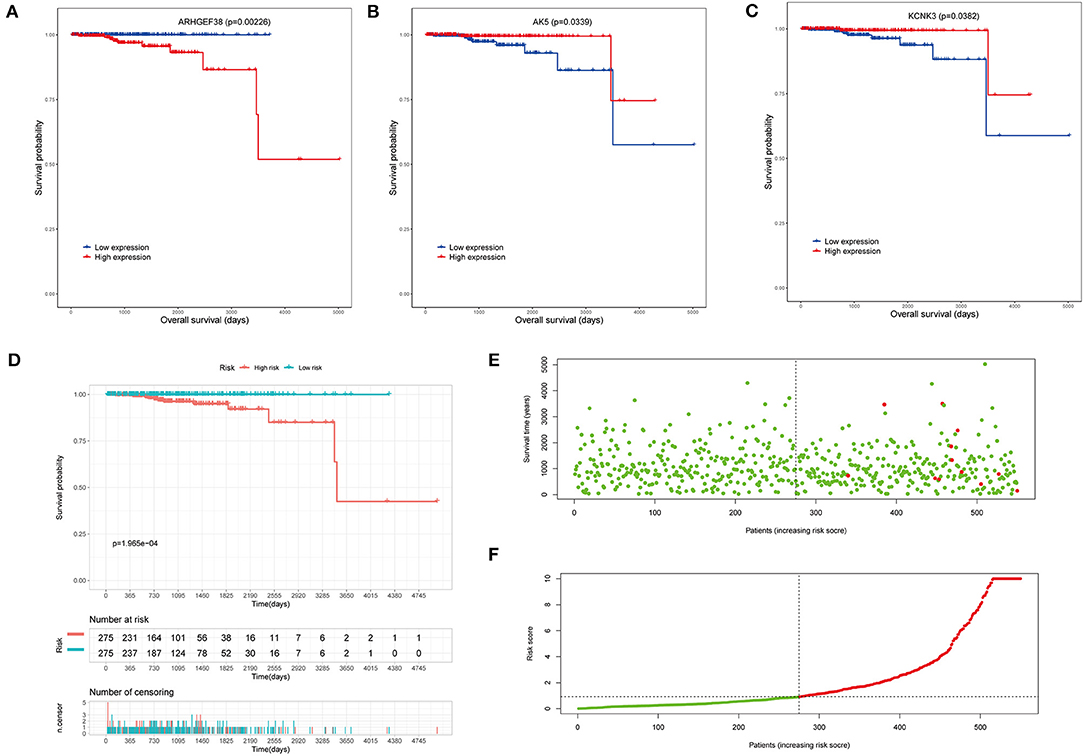
Figure 4. Survival analysis of the risk model. (A–C) The overall survival (OS) analysis in high and low AK5, KCNK3, and ARHGEF38 expression samples. (D) Kaplan–Meier survival analyses show the OS of patients in the high-risk score and the low-risk score groups. (E,F) The risk plot between the high- and low-risk score groups.
Immune Cell Infiltration Analysis
The immune microenvironment is highly correlated with its overall survival (40). In order to study the correlation between immune microenvironment and the risk model, CIBERSORT algorithm, to evaluate the infiltration of twenty-two kinds of immune cells in PCa tissues, was performed (Figure 5A). Infiltration of plasma cells, mast cells resting, M0 macrophages, B cells memory, NK cells activated, M2 macrophages, dendritic cells activated, eosinophils was remarkably different in the high-risk and low-risk groups (Figure 5B). Other types of immune cells did not differ significantly between the two groups. The above results demonstrated that macrophages may be significant in the development and progression of PCa. The estimated method was utilized to predict tumor purity, stromal score, and immune. Significantly different in the high-risk and low-risk groups were shown in in Figures 5C–E. What is more, in order to distinguish the gene expression profiles between high-risk and low-risk PCa samples, GSEA analysis was performed to characterize important functional phenotypes and different gene sets between the high-risk and low-risk score groups. GSEA indicated enrichment of gene sets associated with aminoacyl-tRNA biosynthesis, chemical carcinogenesis—DNA adducts, drug metabolism-cytochrome P450, Fanconi anemia pathway, glycosphingolipid biosynthesis-ganglio series, histidine metabolism, nucleocytoplasmic transport, Ribosome biogenesis in eukaryotes, RNA degradation, staphylococcus aureus infection (Figure 5F).
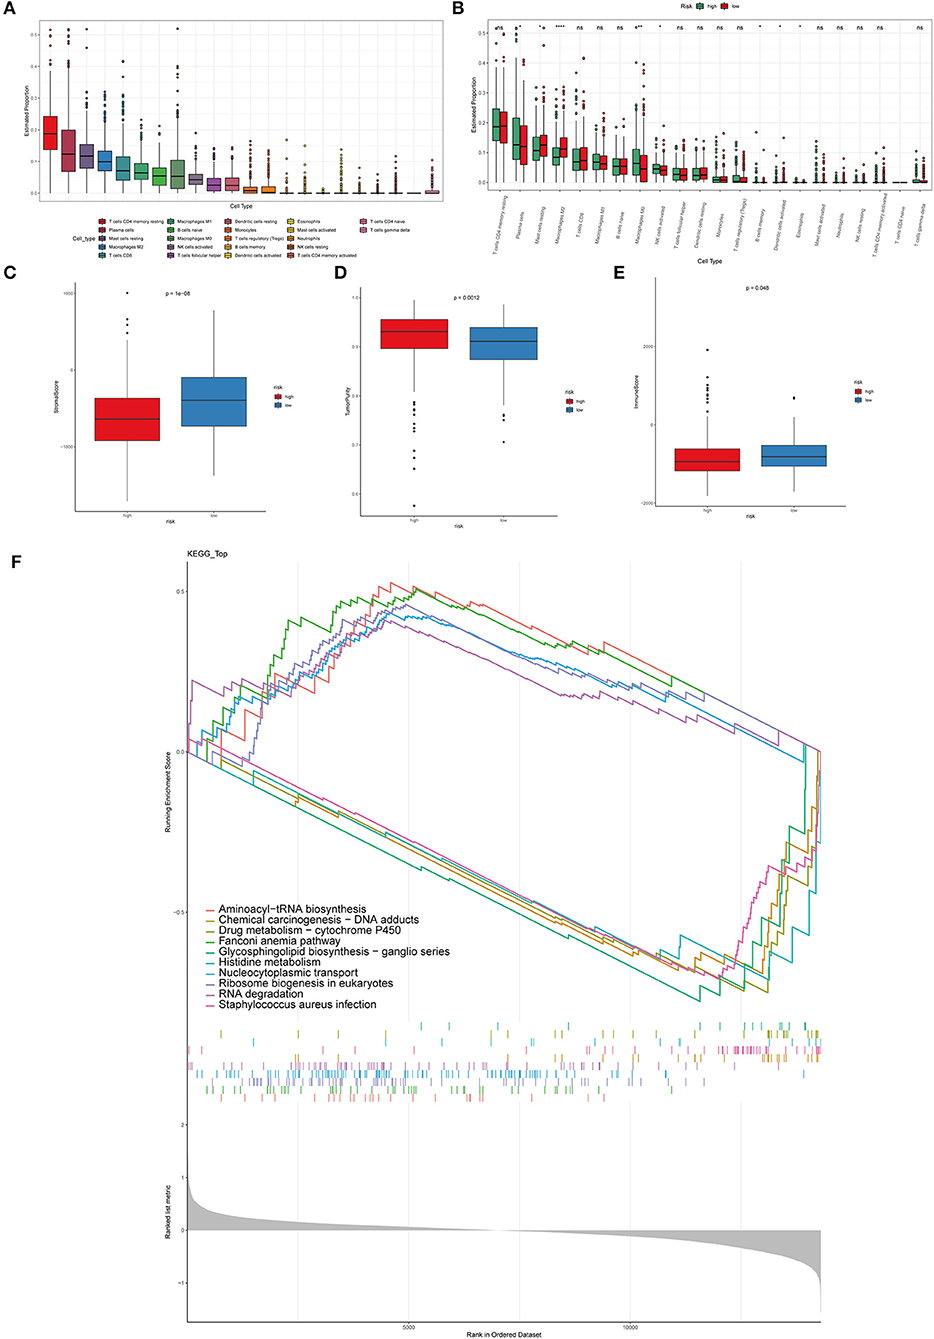
Figure 5. Immune cell infiltration in PCa tissues of high- and low-risk patients. (A) The distribution of 22 types of immune cells between primary and metastatic PCa tissues. (B) Comparisons between immune cells in the high- and low-risk groups in TCGA. *p < 0.05, **p < 0.01, ****p < 0.0001. The stromal score (C), tumor purity (D), immune score (E) in the high- and low-risk groups. (F) The GSEA analysis was performed to characterize important functional phenotypes and different gene sets between the high-risk and low-risk score groups.
Discussion
Prostate cancer (PCa) is one of the pervasive carcinoma occurring in men and a large health burden worldwide (41). The lethality of PCa is due to the lack of treatment options that can produce a lasting response at the genetic and cellular biological levels (42, 43). The progression and pathogenic mechanisms of PCa remain unclear. Currently, analysis used for gene expression has benefit analysis for oncological research with the development in sequencing technologies. In this study, the high-throughput dataset of PCa (GSE46602) was obtained from the GEO database for further comprehensive bioinformatics analyses.
The PCa-related DEGs were screened out and explored, and the related biological processes and signaling pathways that make a better understanding of their functions were also studied. Terms like response to oxidative stress were significantly enriched in BP. Oxidative stress referred to the increase in the formation of reactive oxygen species, which destroys the body's antioxidant protection and causes a variety of diseases, including various cancers (44). Mukha et al. indicated that PCa cells can be radiosensitized by glutamine deprivation, resulting in DNA damage, oxidative stress, and epigenetic modifications (45). Glutathione-related metabolism is the main mechanism of cellular resistance to oxidative stress factors (46). The results of the KEGG analysis of DEGs demonstrated that glutathione metabolism and histidine metabolism were significantly enriched. The functional enrichment results suggest that the common DEGs were a vital regulator in the procession of PCa.
About 15% of patients with PCa are diagnosed with high-risk disease (47). Therefore, through utilizing univariate Cox and iterative lasso Cox regression analyses, a 3-gene (KCNK3, AK5, and ARHGEF38) risk signature model in PCas was constructed. The ROC curves further approved the accuracy of our risk model. It is reported that KCNK3 influenced physiological processes, ranging from vascular tone to metabolic diet through inflammation (48). Also, KCNK3 was correlated with prolonged survival after surgery in colorectal cancer (49). AK5 was reported as a new prognosis marker that promotes autophagy and proliferation in human gastric cancer (33). Interestingly, ARHGEF3 was proved to be an oncogene and may be a novel biomarker for predicting invasive PCa (50).
The 3-gene risk signature model emerges clinical significance. The results indicated that gene changes of KCNK3, AK5, and ARHGEF38 were remarkedly associated with the overall survival of patients with PCa. What is more, patients with high-risk PCa have remarkably worse OS than low-risk ones. Dysregulated expression of ARHGEF38 is associated with poor prognosis in nasopharyngeal carcinoma (51). Currently, immunotherapy has not been utilized in advanced PCa, and more novel methods are needed to overcome immune rejection and suppressive tumor microenvironment (52). As for the immune microenvironment, 8 kinds of immune related cells were remarkably various between the high-risk and low-risk score groups, including plasma cells, mast cells resting, M0 macrophages, M2 macrophages, NK cells activated, B cells memory, dendritic cells activated, and eosinophils. The risk model could further illuminate the immune-related pathogenesis of the therapeutic method by permitting early diagnosis and prognosis of PCa.
Conclusion
In this study, we unraveled the DEGs in PCa from GEO datasets, which were further verified by TCGA data and identified the common DEGs. The functional enrichment results suggest that the common DEGs play an important role in the progress of PCa. A three-gene signature model (KCNK3, AK5, and ARHGEF38) was constructed, and the model was significantly related to cancer-related pathways, overall survival, and TME cells in PCa. This new risk model might benefit the further elucidation about the immune-related progression in PCa.
Data Availability Statement
The original contributions presented in the study are included in the article/supplementary material, further inquiries can be directed to the corresponding author.
Author Contributions
XL and CD designed the research. YW and LP carried out the analyses. XT performed visualization. XT and CD wrote the manuscript. All the authors reviewed and approved the final manuscript.
Funding
This project was supported by the Youth Science and Technology Project of Hebei Provincial Health Commission (No. 20201098).
Conflict of Interest
The authors declare that the research was conducted in the absence of any commercial or financial relationships that could be construed as a potential conflict of interest.
Publisher's Note
All claims expressed in this article are solely those of the authors and do not necessarily represent those of their affiliated organizations, or those of the publisher, the editors and the reviewers. Any product that may be evaluated in this article, or claim that may be made by its manufacturer, is not guaranteed or endorsed by the publisher.
References
1. Zeng XZ, Huang ZS, Fang HP, Wu JY, Huang QX, Zhuang CB, et al. Coexpression of TLR9 and VEGF-C is associated with lymphatic metastasis in prostate cancer. Asian J Androl. (2021). doi: 10.4103/aja202167
2. Nguyen-Nielsen M, Borre M. Diagnostic and therapeutic strategies for prostate cancer. Semin Nucl Med. (2016) 46:484–90. doi: 10.1053/j.semnuclmed.2016.07.002
3. Zuo W, Wang ZZ, Xue J. Artesunate induces apoptosis of bladder cancer cells by miR-16 regulation of COX-2 expression. Int J Mol Sci. (2014) 15:14298. doi: 10.3390/ijms150814298
4. Kenfield SA, Van Blarigan EL, Panchal N, Bang A, Zhang L, Graff RE, et al. Chan, feasibility, safety, and acceptability of a remotely monitored exercise pilot CHAMP: a clinical trial of high-intensity Aerobic and resistance exercise for Metastatic castrate-resistant Prostate cancer. Cancer Med. (2021) 10:8058–70. doi: 10.1002/cam4.4324
5. Vetrichelvan O, Gorjala P, Goodman O Jr, Mitra R. Bergamottin a CYP3A inhibitor found in grapefruit juice inhibits prostate cancer cell growth by downregulating androgen receptor signaling and promoting G0/G1 cell cycle block and apoptosis. PloS ONE. (2021) 16:e0257984. doi: 10.1371/journal.pone.0257984
6. Zou Z, Liu R, Liang Y, Zhou R, Dai Q, Han Z, et al. Identification and validation of a PPP1R12A-related five-gene signature associated with metabolism to predict the prognosis of patients with prostate cancer. Front Genet. (2021) 12:703210. doi: 10.3389/fgene.2021.703210
7. Liu B, Jiang HY, Yuan T, Luo J, Zhou WD, Jiang QQ, et al. Enzalutamide-induced upregulation of PCAT6 promotes prostate cancer neuroendocrine differentiation by regulating miR-326/HNRNPA2B1 axis. Front Oncol. (2021) 11:650054. doi: 10.3389/fonc.2021.650054
8. Azad AA, Eigl BJ, Murray RN, Kollmannsberger C, Chi KN. Efficacy of enzalutamide following abiraterone acetate in chemotherapy-naive metastatic castration-resistant prostate cancer patients. Eur Urol. (2015) 67:23–9. doi: 10.1016/j.eururo.2014.06.045
9. Xu H, Mo F, Zhou J, Hao Z, Chen X, Liang C. Lack of Association between Common Polymorphisms in Selenoprotein P Gene and Susceptibility to Colorectal Cancer. Breast Cancer, and Prostate Cancer: A Meta-Analysis. BioMed Res Int. (2021) 2021:6525449. doi: 10.1155/2021/6525449
10. Wang Y, Wu N, Jiang N. Autophagy provides a conceptual therapeutic framework for bone metastasis from prostate cancer. Cell Death Dis. (2021) 12:909. doi: 10.1038/s41419-021-04181-x
11. Miller DR, Ingersoll MA, Teply BA, Lin MF. Combination treatment options for castration-resistant prostate cancer. In: Bott SRJ, Ng KL, editors. Prostate Cancer, Brisbane (AU). (2021). doi: 10.36255/exonpublications.prostatecancer.combinationtreatment.2021
12. Hawley JR, Zhou S, Arlidge C, Grillo G, Kron KJ, Hugh-White R, et al. Reorganization of the 3D genome pinpoints non-coding drivers of primary prostate tumors. Cancer Res. (2021) 81:5833–48. doi: 10.1158/0008-5472.CAN-21-2056
13. Bai B, Chen Q, Jing R, He X, Wang H, Ban Y, et al. Molecular basis of prostate cancer and natural products as potential chemotherapeutic and chemopreventive agents. Front Pharmacol. (2021) 12:738235. doi: 10.3389/fphar.2021.738235
14. Pezeshki S, Hashemi P, Salimi A, Ebrahimi S, Javanzad M, Monfaredan A. NUF2Evaluation of and expression in prostate cancer: potential biomarkers for prostate cancer screening. Rep Biochem Mol Biol. (2021) 10:224–32. doi: 10.52547/rbmb.10.2.224
15. Sun Z, Mao Y, Zhang X, Lu S, Wang H, Zhang C, et al. Identification of ARHGEF38, NETO2, GOLM1, and SAPCD2 associated with prostate cancer progression by bioinformatic analysis and experimental validation. Front Cell Develop Biol. (2021) 9:718638. doi: 10.3389/fcell.2021.718638
16. Ye Z, Zheng M, Zeng Y, Wei S, Wang Y, Lin Z, et al. Bioinformatics analysis reveals an association between cancer cell stemness, gene mutations, and the immune microenvironment in stomach adenocarcinoma. Front Genet. (2020) 11:595477. doi: 10.3389/fgene.2020.595477
17. Shi Y, Lammers T. Combining nanomedicine and immunotherapy. Acc Chem Res. (2019) 52:1543–54. doi: 10.1021/acs.accounts.9b00148
18. Boone CE, Wang L, Gautam A, Newton IG, Steinmetz NF. Combining nanomedicine and immune checkpoint therapy for cancer immunotherapy. Wiley Interdiscip Rev Nanomed Nanobiotechnol. (2021) 14:e1739. doi: 10.1002/wnan.1739
19. Adamaki M, Zoumpourlis V. Immunotherapy as a precision medicine tool for the treatment of prostate cancer. Cancers. (2021) 13:173. doi: 10.3390/cancers13020173
20. Bansal D, Reimers MA, Knoche EM, Pachynski RK. Immunotherapy and Immunotherapy Combinations in Metastatic Castration-Resistant Prostate Cancer. Cancers (Basel). (2021) 13:334. doi: 10.3390/cancers13020334
21. Antonarakis ES. Combining active immunotherapy with immune checkpoint blockade for the treatment of advanced prostate cancer. Asian J Androl. (2012) 14:520–1. doi: 10.1038/aja.2012.45
22. Zhang S, Zhang E, Long J, Hu Z, Peng J, Liu L, et al. Immune infiltration in renal cell carcinoma. Cancer Sci. (2019) 110:1564–72. doi: 10.1111/cas.13996
23. Xu N, Dong RN, Lin TT, Lin T, Lin YZ, Chen SH, et al. Development and validation of novel biomarkers related to M2 macrophages infiltration by weighted gene co-expression network analysis in prostate cancer. Front Oncol. (2021) 11:634075. doi: 10.3389/fonc.2021.634075
24. Andersen LB, Nørgaard M, Rasmussen M, Fredsøe J, Borre M, Ulhøi BP, et al. Immune cell analyses of the tumor microenvironment in prostate cancer highlight infiltrating regulatory T cells and macrophages as adverse prognostic factors. J Pathol. (2021) 255:155–65. doi: 10.1002/path.5757
25. Dang K, Castello G, Clarke SC, Li Y, Balasubramani A, Boudreau A, et al. Attenuating CD3 affinity in a PSMAxCD3 bispecific antibody enables killing of prostate tumor cells with reduced cytokine release. J Immunother Cancer. (2021) 9:e002488. doi: 10.1136/jitc-2021-002488
26. Meng F, Han X, Min Z, He X, Zhu S. Prognostic signatures associated with high infiltration of Tregs in bone metastatic prostate cancer. Aging (Albany NY). (2021) 13:17442–61. doi: 10.18632/aging.203234
27. Zeng X, Sanalkumar R, Bresnick EH, Li H, Chang Q, Keleş S. jMOSAiCS: joint analysis of multiple ChIP-seq datasets. Genome Biol. (2013) 14:R38. doi: 10.1186/gb-2013-14-4-r38
28. To KY. Identification of differential gene expression by high throughput analysis. Comb Chem High Throughput Screen. (2000) 3:235–41. doi: 10.2174/1386207003331616
29. Mortensen MM, Hoyer S, Lynnerup AS, Orntoft TF, Sorensen KD, Borre M, Dyrskjot L. Expression profiling of prostate cancer tissue delineates genes associated with recurrence after prostatectomy. Sci Rep. (2015) 5:16018. doi: 10.1038/srep16018
31. Huang da W, Sherman BT, Lempicki RA. Systematic and integrative analysis of large gene lists using DAVID bioinformatics resources. Nat Protoc. (2009) 4:44–57. doi: 10.1038/nprot.2008.211
32. Huang da W, Sherman BT, Lempicki RA. Bioinformatics enrichment tools: paths toward the comprehensive functional analysis of large gene lists. Nucleic Acids Res. (2009) 37:1–13. doi: 10.1093/nar/gkn923
33. Ogata H, Goto S, Sato K, Fujibuchi W, Kanehisa M. KEGG: kyoto Encyclopedia of Genes and Genomes. Nucleic Acids Res. (1999) 27:29–34. doi: 10.1093/nar/27.1.29
34. Xu C, Chen H. A ferroptosis-related gene model predicts prognosis and immune microenvironment for cutaneous melanoma. Front Genet. (2021) 12:697043. doi: 10.3389/fgene.2021.697043
35. Li N, Zhan X. Identification of pathology-specific regulators of mA RNA modification to optimize lung cancer management in the context of predictive, preventive, and personalized medicine. EPMA J. (2020) 11:485–504. doi: 10.1007/s13167-020-00220-3
36. Chen B, Khodadoust MS, Liu CL, Newman AM, Alizadeh AA. Profiling tumor infiltrating immune cells with CIBERSORT. Methods Mol Biol. (2018) 1711:243–59. doi: 10.1007/978-1-4939-7493-1_12
37. Tang Z, Li C, Kang B, Gao G, Li C, Zhang Z. GEPIA: a web server for cancer and normal gene expression profiling and interactive analyses. Nucleic acids Res. (2017) 45:W98–102. doi: 10.1093/nar/gkx247
38. Subramanian A, Tamayo P, Mootha VK, Mukherjee S, Ebert BL, Gillette MA, et al. Gene set enrichment analysis: a knowledge-based approach for interpreting genome-wide expression profiles. Proc Natl Acad Sci USA. (2005) 102:15545–50. doi: 10.1073/pnas.0506580102
39. Sunil L. A least absolute shrinkage and selection operator (LASSO) for nonlinear system identification. Syst Identification (2006).
40. Wang Z, Wu Y, Zhao Z, Liu C, Zhang L. Study on transorgan regulation of intervertebral disc and extra-skeletal organs through exosomes derived from bone marrow mesenchymal stem cells. Front Cell Dev Biol. (2021) 9:741183. doi: 10.3389/fcell.2021.741183
41. Hou Y, Hu J, Zhou L, Liu L, Chen K, Yang X. Integrative analysis of methylation and copy number variations of prostate adenocarcinoma based on weighted gene co-expression network analysis. Front Oncol. (2021) 11:647253. doi: 10.3389/fonc.2021.647253
42. Wang G, Zhao D, Spring D, DePinho R. Genetics and biology of prostate cancer. Genes Develop. (2018) 32:1105–40. doi: 10.1101/gad.315739.118
43. Yu C, Niu, Li L, Li T, Duan L, He Z, et al. Identification of the metabolic signatures of prostate cancer by mass spectrometry-based plasma and urine metabolomics analysis. Prostate. (2021) 81:1320–1328. doi: 10.1002/pros.24229
44. Jomova K, Valko M. Advances in metal-induced oxidative stress and human disease. Toxicology. (2011) 283:65–87. doi: 10.1016/j.tox.2011.03.001
45. Mukha A, Kahya U, Dubrovska A. Targeting glutamine metabolism and autophagy: the combination for prostate cancer radiosensitization. Autophagy. (2021) 17:3879–81. doi: 10.1080/15548627.2021.1962682
46. Hayes JD, McLellanLI. Glutathione and glutathione-dependent enzymes represent a co-ordinately regulated defence against oxidative stress. Free Radical Res. (1999) 31:273–300. doi: 10.1080/10715769900300851
47. Chang AJ, Autio K, Roach M, Scher H. High-risk prostate cancer-classification and therapy. Nat Rev Clin Oncol. (2014) 11:308–23. doi: 10.1038/nrclinonc.2014.68
48. West JD, Austin ED, Rizzi EM, Yan L, Tanjore H, Crabtree AL, et al. KCNK3 mutation causes altered immune function in pulmonary arterial hypertension patients and mouse models. Int J Mol Sci. (2021) 22:5014. doi: 10.3390/ijms22095014
49. Cavalieri D, Dolara P, Mini E, Luceri C, Castagnini C, Toti S, et al. Analysis of gene expression profiles reveals novel correlations with the clinical course of colorectal cancer. Oncol Res. (2007) 16:535–48. doi: 10.3727/096504007783438376
50. Liu QW, Li JY, Zhang XC, Liu Y, Liu QY, Xiao L, et al. Human amniotic mesenchymal stem cells inhibit hepatocellular carcinoma in tumour-bearing mice. J Cell Mol Med. (2020) 24:10525–41. doi: 10.1111/jcmm.15668
51. Liu TH, Zheng F, Cai MY, Guo L, Lin HX, Chen JW, et al. The putative tumor activator ARHGEF3 promotes nasopharyngeal carcinoma cell pathogenesis by inhibiting cellular apoptosis. Oncotarget. (2016) 7:25836–48. doi: 10.18632/oncotarget.8283
Keywords: prostate cancer (PCa), bioinformatics analysis, immune cell infiltration, survival analysis, ARHGEF38, KCNK3, AK5
Citation: Liang X, Wang Y, Pei L, Tan X and Dong C (2022) Identification of Prostate Cancer Risk Genetics Biomarkers Based on Intergraded Bioinformatics Analysis. Front. Surg. 9:856446. doi: 10.3389/fsurg.2022.856446
Received: 17 January 2022; Accepted: 09 February 2022;
Published: 17 March 2022.
Edited by:
Songwen Tan, Central South University, ChinaReviewed by:
Shenghui Yang, Hainan Provincial People's Hospital, ChinaMeifeng Lv, Jinan Second Maternal and Child Health Hospital, China
Copyright © 2022 Liang, Wang, Pei, Tan and Dong. This is an open-access article distributed under the terms of the Creative Commons Attribution License (CC BY). The use, distribution or reproduction in other forums is permitted, provided the original author(s) and the copyright owner(s) are credited and that the original publication in this journal is cited, in accordance with accepted academic practice. No use, distribution or reproduction is permitted which does not comply with these terms.
*Correspondence: Chunhui Dong, chunhuizheyu@163.com