 Alexis Barbry
 Lucie Lerebourg
 Ghazi Racil
 Mohamed Chedly Jlid
 Jérémy Coquart
- 1Centre d’Études des Transformations des Activités Physiques et Sportives, Normandie University, UNIROUEN, Rouen, France
- 2Univ. Lille, Univ. Artois, Univ. Littoral Côte d'Opale, ULR 7369 - URePSSS - Unité de Recherche Pluridisciplinaire Sport Santé Société, Lille, France
- 3LAMHESS Lab, Université Côte d’Azur, Nice, France
- 4Orthodynamica Center, Mathilde Hospital 2, Rouen, France
- 5Higher Institute of Sport ansd Physical Education of Ksar Saïd, University of Manouba, Tunis, Tunisia
Introduction: Predict running performances is very important for athletes and trainers. Sport researchers have therefore developed certain tools to predict running performances, but only in non-obstacle races. This study aimed to develop and test the validity and accuracy of an equation for predicting 3,000-m steeplechase performance (PerfSteeple).
Methods: The official rankings of French runners for the 3,000-m track-running (Perf3000) and 3,000-m steeplechase events were examined. Age, height and body mass were collected. From 146 included athletes, two groups were randomly composed: one comprising 80% of the sample (n = 117) to develop a simple equation to predict PerfSteeple (i.e., development group) and the other comprising the remaining 20% (n = 29) to test the validity and accuracy of the developed prediction equation (i.e., cross-validation group).
Results: The simple prediction equation included Perf3000 and age: . No significant difference was noted between the actual and predicted performances. Predicted performances were significantly correlated with the actual ones, with a very high correlation coefficient (p < 0.001; r = 0.929). Bias and 95% limits of agreement were −5 ± 24 s, i.e., −0.8 ± 7.6%. In 95 of 100 new predictions, the difference between actual and predicted performance would be less or equal to—5 ± 24 s.
Discussion: The study confirms the validity and accuracy of the equation for predicting PerfSteeple. Predictions using this simple equation may be used in training and competitions for athletes and coaches. PerfSteeple = −57,165 + 1,147 X Perf3000 + 0,955 X age.
Introduction
The prediction of running performances is very important for athletes and trainers (1–3). Predictions might be used to detect talents, select a speed for specific pace training sessions, and even evaluate the effect of a training program (1–4). Sports researchers have therefore long sought ways to accurately predict running performances. Several authors have developed certain methods and tools (e.g., power law, critical speed or nomograms) (5–8). These different tools are used to predict middle- and long-distance track-running performances, but only in non-obstacle races. Consequently, the studies on predicting the track-running performances of the steeplechase remain very limited.
The 3,000-m steeplechase is a technical middle-distance running event with the athletes crossing 28 barriers and 7 barriers followed by a water pit (water-jumps). The main technical/regulatory difference between the sexes is the height of the barriers (i.e., 0.914 m and 0.762 m for men and women, respectively).
Some predictive variables of a 3,000-m steeplechase might be the same variables as for flat middle- and long-distance running. Maximal oxygen uptake (O2max), endurance capacity or running economy are key physiological factors of running performances (9). These factors known to be dependent on age, sex, height, body mass and/or body mass index (BMI) (10, 11). For age, few studies have investigated it relationship with performance among steeplechase runners. One study has nevertheless shown that the age of elite athletes at peak performance on the 3,000-m steeplechase is around 25–27 years old (12). Sex also appears to be a variable to consider in predicting performance in the 3,000-m steeplechase. Differences in the technique used to cross the steeplechase barriers have been identified between the sexes (13), probably due to the lower barrier height for women. Therefore, the same equation cannot be used for men and women. These differences in hurdling technique may also be due to the approach velocity and body height (14). Sánchez Muñoz et al. (15) showed that runners of long-distance events (including the 3,000-m steeplechase) are taller than runners of shorter distances (800-m and 1,500-m). Being taller is often associated with longer legs, which would facilitate barrier crossing. Moreover, it is well established that a lower BMI positively impacts running performances (16). Consequently, due to the technical aspect and the energy cost of crossing barriers (17), height, body mass and BMI appear to be other predictive variables of steeplechase performance.
The purpose of the current study was to develop and test the validity and accuracy of a simple equation in predicting 3,000-m steeplechase performance (PerfSteeple) from individual variables (e.g., age, height, body mass and BMI) in men.
Methods
Subjects
All official French rankings from the French athletics federation (FFA for Fédération Française d'Athlétisme) in 2019 for the 3,000-m track (n = 5,385) and 3,000-m steeplechase (n = 1,333) events were retrospectively scrutinized. From these rankings, all adult athletes (≥18 years) who had participated in the two races were retained (n = 387). Runners who had not self-reported their body mass and/or height were then removed from the analysis (n = 211). Thus, 176 athletes were included in this stage. Because of the small sample of women (n = 25) and to avoid possible sex bias (different height of the barriers between men and women), only men were included (n = 151). Runners who had maintained a higher speed in the 3,000-m steeplechase than in the 3,000-m race were also eliminated (n = 5).
Design
From the 146 remaining male athletes, two groups were randomly composed using statistical package for the social sciences (SPSS) software. One comprising 80% of the sample (n = 117) to develop a simple prediction equation (i.e., development group) and a second comprising the remaining 20% (n = 29) to test the validity and accuracy of the developed simple prediction equation (i.e., cross-validation group). To prevent problems with the normality of the distribution, approximately 30 runners were included in the cross-validation group (18, 19).
Methodology
For each athlete, the birth date (to calculate the age), height and body mass (to calculate the BMI), as well as the race times on the PerfSteeple and 3,000-m race (i.e., Perf3000) were recorded. This study was approved by the national ethics committee for research in sports sciences (CERSTAPS 2019-22-02-31). The protocol for this study was legally declared, in accordance with the European general data protection regulations.
Statistical analysis
Standard statistical methods were used to calculate the means and standard deviations (SD). The normal Gaussian distribution was verified by the Shapiro-Wilk test.
To investigate whether an equation could be developed to predict PerfSteeple, a Pearson product moment correlation was used to evaluate the association between the dependent (i.e., PerfSteeple) and several independent variables (i.e., Perf3000, age, height, body mass and BMI).
A simple prediction equation was then developed from the significantly correlated variables using stepwise multiple linear regression analysis.
The variance inflation factor (VIF) was used to detect the severity of multicollinearity among the independent variables in the regression model. Multicollinearity was considered very low when VIF < 5 (20, 21).
Fisher's tests were used to examine the contribution of each variable to the model, and confirmation was based on the analysis of standardized β coefficients.
The relationship between PerfSteeple estimated by the simple prediction equation and actual PerfSteeple was analyzed using the Bravais-Pearson method and quantified using Pearson's correlation coefficient. The autocorrelation in the residuals was examined with the Durbin-Watson test.
Student's paired samples t-test was used to compare the actual and predicted PerfSteeple. The magnitude of the differences was assessed by the effect size (ES) using cohen's d (22). ES was considered as small (d = 0.20), medium (d = 0.50) or large (d = 0.80) (22).
The association between the actual and predicted PerfSteeple was tested using the Bravais-Pearson method and quantified by Pearson's correlation coefficient. It was considered a correlation of r = 0,90 or more as very high, between 0,70 and 0,89 as high, between 0,50 and 0,69 as moderate, and between 0,26 and 0,49 as low (23, 24).
The bias (i.e., difference between actual and predicted PerfSteeple) and 95% limits of agreement (95% LoA, i.e., ± 1.96 SD) were computed according to the Bland-Altman method (25).
Statistical significance was set at p < 0.05 and all analyses were performed with the SPSS (release 20.0, Chicago, IL, USA).
This statistical method was realised by several authors to predict running performances (20, 24, 26).
Results
The characteristics of the athletes in both groups are presented in Table 1.
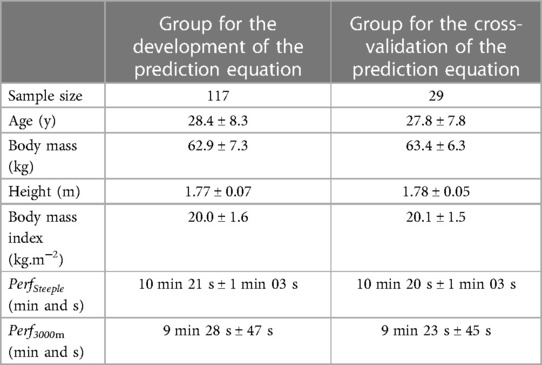
Table 1 Descriptive data and variables used to develop the simple equation of prediction (mean values ± SD).
Significant bivariate correlations were found between Perf3000 (p < 0.001, r = 0.896), age (p < 0.001, r = 0.474), body mass (p = 0.049, r = 0.154), BMI (p = 0.001, r = 0.279) and PerfSteeple.
Stepwise multiple linear regression analysis using Perf3000 and age as potential independent variables yielded the simple prediction equation.
This equation was as follows:
PerfSteeple = −57,165 + 1,147 ×
PerfSteeple = −57,165 + 1,147 × Perf3000 + 0,955 × age
with PerfSteeple and Perf3000 in seconds, and age in years.
VIF was 1.206 for both Perf3000 and age.
The increases in r2 by adding a second predictor (i.e., age) into the prediction equation were significant with F(1,114) = 8.083 (p = 0.005). Moreover, Fisher's test revealed a p < 0.05.
The performance estimated by the simple prediction equation (including the 2 independent variables: Perf3000 and age) was significantly correlated with the actual PerfSteeple (r = 0.903 and r2 = 0.8162).
The standardized β coefficients and p-values on the Student's t-test were 0.844 (p < 0.001), and 0.126 (p = 0.005) for Perf3000 and age, respectively.
The Durbin-Watson test indicated no autocorrelation in the residuals, with a value of 1.725. The standardized residuals followed a straight line, showing that no residual was too high, so the prediction was valid for all performances.
No significant difference was noted between the actual and predicted PerfSteeple (p = 0.263), and the magnitude of the difference was considered trivial (ES = –.08) (22).
Predicted PerfSteeple was significantly correlated with actual PerfSteeple (p < 0.001). A very high correlation coefficient was found according to Munro's scale (23) (r = 0.929, Figure 1).
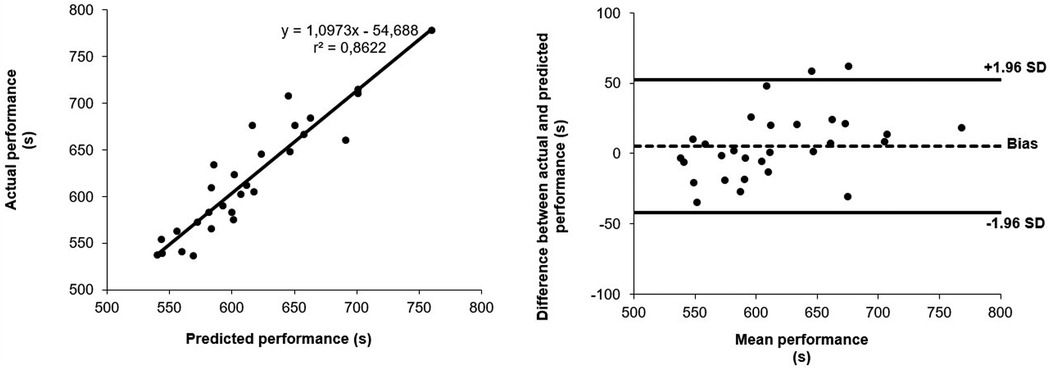
Figure 1 Top panel: association between actual and predicted performance from a simple equation to predict the 3,000-m steeplechase event. The solid line is the linear regression. r2 is the coefficient of determination. Bottom panel: Bland and Altman plots for the comparison between actual and predicted performance in the 3,000-m steeplechase event. Dashed line is the bias, solid lines are the 95% limits of agreement (25).
The bias and 95% LoA were −5 ± 24 s, i.e., −0.8 ± 7.6% of mean PerfSteeple (Figure 1). In 95 of 100 new predictions, the difference between actual and predicted performance would be less or equal to −5 ± 24 s.
Discussion
The purpose of this study was to develop and test the validity and accuracy of a simple equation to predict PerfSteeple. The main result suggests that a simple equation (i.e., PerfSteeple = −57.165 + 1.147 × Perf3000 + 0.955 × age) is a valid and accurate method for predicting PerfSteeple. Although no study has focused on predicting PerfSteeple from a simple equation, a few studies have validated predictive methods for the flat 3,000-m with results comparable (i.e., from low bias and 95% LoA) to our own (3, 27). This confirms the validity of the present simple equation for the 3,000-m steeplechase. This simple equation can complement other methods/tools. A long-distance runner (who wanted to predict PerfSteeple without reference in Perf3000) could use the methods and tools available in the literature to firstly estimate Perf3000 (5–8). Next, use this estimated Perf3000 to predict his PerfSteeple with the simple equation.
The present results suggest that the main predictor of PerfSteeple is Perf3000. The duration in these two events is relatively close (i.e., 8%–10% prolonged effort in the 3,000-m steeplechase, having little impact on the importance of the O2max) (17, 28, 29). The 3,000-m steeplechase generally produces a deceleration during the takeoff step for both hurdling and water-jumps (30). In addition to requiring a high level of O2max (29), PerfSteeple requires a high technical ability to cross the barriers. This high technical ability (e.g., more efficiency over barriers) might be developed by plyometric training (17). The inclusion of plyometric training could support runners to be more efficient over barriers (17). These types of exercises increased muscular fitness which can be useful to decelerating, landing and exiting steeplechase barriers (31).
Based on the statistical method used (20, 24, 26), this study shows that age contributes to performance prediction in the PerfSteeple. Its inclusion provides only a small gain in accuracy. It can be explained by the observation that most steeplechasers are between 20 and 35 years old (Table 1). This is not surprising, given that a peak age of around 25 years old has been noted for men (12). However, the inclusion of age could be explained by the age-related physiological modifications with adult aging (32). A progressive reduction in O2max appears to be the primary mechanism associated with performance declines (33).
The current study suggests that height, body mass and BMI are not predictive variables of PerfSteeple. This result might be explained by the inclusion of Perf3000 in the equation. Although height is slightly associated with speed in running events, body mass and BMI seems to be a better indicator of Perf3000 (16). The impact of height, body mass and BMI on Perf3000 would explain why these variables were not included in the equation (i.e., they are already included in Perf3000 and would therefore be redundant).
The main limitation of this study is that the running performances were not executed in similar conditions (i.e., environmental, physical and psychological). Another limitation was the self-declaration of body height and mass and thus the calculation of the BMI. However, runners are known to self-report accurately for this type of data (34). Finally, this equation is a valid and accurate method only in male athletes. The height of the barriers with a 0.152-m difference between sexes, can lead to differences in the running-hurdling (13). The lower barrier height relative to body height for women might help them to maintain race pace when crossing the barriers (14). However, they are more affected by the water-jump (e.g., lower approach velocity, shorter jump) than those of the men (13). This is probably because they need a longer stride to cross the water due to their generally shorter leg length. Thus, a future perspective might be to develop a specific prediction equation to predict PerfSteeple for women.
Conclusion
The results of the present study indicate the validity and accuracy of a simple equation to predict PerfSteeple. This tool could be useful for athletes and coaches to predict a 3,000-m steeplechase. It can enable them to adapt their training and to select the optimum speed for the athlete's performance. It can be use for national directors in charge of performance in athletics federations to detect talent in the 3,000-m steeplechase and thus orient young athletes more easily.
Data availability statement
The raw data supporting the conclusions of this article will be made available by the authors, without undue reservation.
Ethics statement
The studies involving humans were approved by Comité d'Ethique pour la Recherche en Sciences et Techniques des Activités Physiques et Sportives (CERSTAPS)—Avis favorable—numéro de l'avis: 2019-22-02-31. The studies were conducted in accordance with the local legislation and institutional requirements. The participants provided their written informed consent to participate in this study.
Author contributions
AB: Writing – original draft, Writing – review & editing. LL: Writing – original draft, Writing – review & editing. GR: Validation, Writing – review & editing. MJ: Validation, Writing – review & editing. JC: Conceptualization, Data curation, Formal Analysis, Funding acquisition, Investigation, Methodology, Project administration, Resources, Software, Supervision, Validation, Visualization, Writing – review & editing.
Funding
The author(s) declare financial support was received for the research, authorship, and/or publication of this article. This publication has been supported by Lille University in the context of its open science support policy.
Acknowledgments
The authors are grateful to the Fédération Française d'Athlétisme for data collection, the Institut de Recherche Interdisciplinaire Homme et Société (IRIHS) and the Orthodynamica Center at Mathilde Hospital 2, as well as the Institut des Rencontres de la Forme, for funding.
Publisher's note
All claims expressed in this article are solely those of the authors and do not necessarily represent those of their affiliated organizations, or those of the publisher, the editors and the reviewers. Any product that may be evaluated in this article, or claim that may be made by its manufacturer, is not guaranteed or endorsed by the publisher.
References
1. Coquart JB, Eston RG, Noakes TD, Tourny-Chollet C, L'hermette M, Lemaître F, et al. Estimated time limit: a brief review of a perceptually based scale. Sports Med Auckl NZ. (2012) 42:845–55. doi: 10.1007/BF03262298
2. Coquart JBJ, Alberty M, Bosquet L. Validity of a nomogram to predict long distance running performance. J Strength Cond Res. (2009) 23:2119–23. doi: 10.1519/JSC.0b013e3181b3dcc3
3. Coquart JBJ, Bosquet L. Precision in the prediction of middle distance-running performances using either a nomogram or the modeling of the distance-time relationship. J Strength Cond Res. (2010) 24:2920–6. doi: 10.1519/JSC.0b013e3181c69278
4. Berndsen J, Smyth B, Lawlor A. Pace my race: recommendations for marathon running. In: Proceedings of the 13th ACM Conference on Recommender Systems. 2019, pp. 246–50.
5. Kennelly AE. An approximate law of fatigue in the speeds of racing animals. Proceedings of the American Academy of Arts and Sciences. (1906). Available online at: http://archive.org/details/jstor-20022230
6. Hughson RL, Orok CJ, Staudt LE. A high velocity treadmill running test to assess endurance running potential. Int J Sports Med. (1984) 5:23–5. doi: 10.1055/s-2008-1025875
7. Mercier D, Léger L, Desjardins M. Nomogramme pour prédire la performance, le VO2max et l’endurance relative en course de fond. Médicine Sport. (1984) 58:181–7.
8. Vandewalle H. A nomogram of performances in endurance running based on logarithmic model of péronnet-thibault. Am J Eng Res. (2017) 6:78–85.
9. Kenney WL, Hodgson JL. Variables predictive of performance in elite middle-distance runners. Br J Sports Med. (1985) 19:207. doi: 10.1136/bjsm.19.4.207
10. Trappe SW, Costill DL, Vukovich MD, Jones J, Melham T. Aging among elite distance runners: a 22-yr longitudinal study. J Appl Physiol Bethesda Md 1985. (1996) 80:285–90. doi: 10.1152/jappl.1996.80.1.285
11. Vickers AJ, Vertosick EA. An empirical study of race times in recreational endurance runners. BMC Sports Sci Med Rehabil. (2016) 8:26. doi: 10.1186/s13102-016-0052-y
12. Haugen TA, Solberg PA, Foster C, Morán-Navarro R, Breitschädel F, Hopkins WG. Peak age and performance progression in world-class track-and-field athletes. Int J Sports Physiol Perform. (2018) 13:1122–9. doi: 10.1123/ijspp.2017-0682
13. Hunter I, Lindsay BK, Andersen KR. Gender differences and biomechanics in the 3000M steeplechase water jump. J Sports Sci Med. (2008) 7:218–22.24149452
14. Hunter I, Bushnell TD. Steeplechase barriers affect women less than men. J Sports Sci Med. (2006) 5:318–22.24260005
15. Sánchez Muñoz C, Muros JJ, López Belmonte Ó, Zabala M. Anthropometric characteristics, body composition and somatotype of elite male young runners. Int J Environ Res Public Health. (2020) 17(2):674. doi: 10.3390/ijerph17020674
16. Sedeaud A, Marc A, Marck A, Dor F, Schipman J, Dorsey M, et al. BMI, a performance parameter for speed improvement. PloS One. (2014) 9:e90183. doi: 10.1371/journal.pone.0090183
17. Earl S, Hunter I, Mack GW, Seeley M. The relationship between steeplechase hurdle economy, mechanics, and performance. J Sport Health Sci. (2015) 4:353–6. doi: 10.1016/j.jshs.2015.03.009
18. Jekel JF. Epidemiology, Biostatistics, and Preventive Medicine. United Kingdom: Saunders/Elsevier (2007).
19. Krithikadatta J. Normal distribution. J Conserv Dent JCD. (2014) 17:96. doi: 10.4103/0972-0707.124171
20. Coquart JB. Prediction of performance in a 100-km run from a simple equation. PLoS One. (2023) 18:e0279662. doi: 10.1371/journal.pone.0279662
21. Kim JH. Multicollinearity and misleading statistical results. Korean J Anesthesiol. (2019) 72:558–69. doi: 10.4097/kja.19087
22. Cohen J. Statistical Power Analysis for the Behavioral Sciences. Hillsdale, N.J.: L. Erlbaum Associates (1988).
23. Munro BH. Statistical Methods for Health Care Research. Philadelphia: Lippincott Williams & Wilkins (2000). Available online at: http://archive.org/details/statisticalmetho00munr
24. Lerebourg L, Saboul D, Clémençon M, Coquart JB. Prediction of marathon performance using artificial intelligence. Int J Sports Med. (2023) 44:352–60. doi: 10.1055/a-1993-2371
25. Bland JM, Altman DG. Statistical methods for assessing agreement between two methods of clinical measurement. Lancet Lond Engl. (1986) 1:307–10. doi: 10.1016/S0140-6736(86)90837-8
26. Okura T, Tanaka K. A unique method for predicting cardiorespiratory fitness using rating of perceived exertion. J Physiol Anthropol Appl Human Sci. (2001) 20:255–61. doi: 10.2114/jpa.20.255
27. Coquart JB, Mercier D, Tabben M, Bosquet L. Influence of sex and specialty on the prediction of middle-distance running performances using the mercier et al.’s nomogram. J Sports Sci. (2015) 33:1124–31. doi: 10.1080/02640414.2014.986499
29. Slawinski J, Chiron F, Millot B, Taouji A, Brocherie F. Effect of a 16-day altitude training camp on 3,000-m steeplechase running energetics and biomechanics: a case tudy. Front Sports Act Living. (2019) 1:63. doi: 10.3389/fspor.2019.00063
30. Kipp S, Taboga P, Kram R. Ground reaction forces during steeplechase hurdling and waterjumps. Sports Biomech. (2017) 16:152–65. doi: 10.1080/14763141.2016.1212917
31. Kons RL, Orssatto LBR, Ache-Dias J, De Pauw K, Meeusen R, Trajano GS, et al. Effects of plyometric training on physical performance: an umbrella review. Sports Med—Open. (2023) 9(1):4. doi: 10.1186/s40798-022-00550-8
32. Lerebourg L, Coquart JB. Changes in performances/characteristics of French female runners over the last 12 years. Res Sports Med. (2021) 29(2):185–95. doi: 10.1080/15438627.2020.1725009
33. Tanaka H, Seals DR. Endurance exercise performance in masters athletes: age-associated changes and underlying physiological mechanisms. J Physiol. (2008) 586:55–63. doi: 10.1113/jphysiol.2007.141879
Keywords: validity, running, hurdling, athlete, athletics
Citation: Barbry A, Lerebourg L, Racil G, Jlid MC and Coquart J (2024) Valid and accurate simple equation to predict 3,000-m steeplechase performance. Front. Sports Act. Living 6: 1402792. doi: 10.3389/fspor.2024.1402792
Received: 18 March 2024; Accepted: 10 July 2024;
Published: 24 July 2024.
Edited by:
Hassane Zouhal, University of Rennes 2—Upper Brittany, FranceReviewed by:
Hugo Cerda-Kohler, Innovation Center, MEDS Clinic, ChileCristiano Maria Verrelli, University of Rome Tor Vergata, Italy
© 2024 Barbry, Lerebourg, Racil, Jlid and Coquart. This is an open-access article distributed under the terms of the Creative Commons Attribution License (CC BY). The use, distribution or reproduction in other forums is permitted, provided the original author(s) and the copyright owner(s) are credited and that the original publication in this journal is cited, in accordance with accepted academic practice. No use, distribution or reproduction is permitted which does not comply with these terms.
*Correspondence: Alexis Barbry, YWxleGlzLmJhcmJyeUB5YWhvby5jb20=
†These authors have contributed equally to this work