- 1Electric Power Research Institute of Hainan Power Grid Co., Ltd., Haikou, China
- 2Smart Grid and Island Microgrid Joint Laboratory, Haikou, China
To address the degradation of grid quality and charging efficiency associated with the large-scale integration of electric vehicles (EVs), a multi-stage balanced flexible load scheduling method is proposed. This approach is designed to facilitate peak shaving and valley filling, balance intermittent energy fluctuations, and provide auxiliary services, thereby significantly altering system load characteristics, smoothing energy fluctuations, reducing operational costs, and enhancing the regulatory capabilities of power grid dispatching operations. A multi-objective optimization mathematical model is developed, focusing on key indicators that impact the scheduling process, including network loss, operational cost, and user satisfaction. A multi-stage flexible load scheduling framework is introduced within the competitive swarm optimization (CSO) algorithm, resulting in the design of an advanced CSO algorithm. This algorithm is distinguished from traditional methods by the implementation of advanced learning based on grouping after a random competitive learning phase, which enhances the efficiency of particle swarm learning while ensuring stable population convergence throughout the optimization process. Furthermore, the CSO framework is maintained to ensure effective population diversity, greatly improving the optimization performance. Simulation results indicate that the voltage fluctuation index of the proposed algorithm is 1.8% lower than that of the standard CSO algorithm, while network loss and operational costs are reduced by 2.83 and 5.81%, respectively, thereby validating the effectiveness and efficiency of the proposed approach.
1 Introduction
With the proposal of the double carbon goal, China has begun to reform large-scale energy production and energy consumption (Zhang et al., 2024). Electric vehicles have the characteristics of low carbon, environmental protection, low operating cost and good quiet performance, so the number of electric vehicles is greatly increasing. However, a large number of electric vehicles connected to the grid will lead to instability of the grid voltage and degradation of the grid quality, resulting in a sharp increase in network loss and operation cost, and the operation efficiency will also decrease. In response to the above problems, the flexible load scheduling technology of electric vehicles realizes the normal operation of the power grid by means of peak and valley filling, balancing intermittent energy fluctuations and providing auxiliary services (Wang et al., 2014). However, when dealing with large-scale scheduling tasks, the existing flexible load scheduling methods of electric vehicles have problems such as low efficiency of the scheduling process and poor fitness, which greatly affects the stable operation of the power grid. Therefore, how to solve the flexible load scheduling problem of large-scale electric vehicles is an important problem to be solved urgently.
At present, the related research can be divided into two aspects: improving the quality of the power grid and reducing the operation cost. The analysis of the influence of natural charging of large-scale electric vehicles on the variation law of power grid load based on Monte Carlo simulation was presented in Sun et al. (2014). A genetic algorithm was used to optimize the charging and discharging time, and the orderly charging and discharging management of electric vehicles was achieved by adjusting the starting times and charging durations. The whole-process behavior boundary model of electric vehicles was proposed in Duan et al. (2018), where set parameters were used to characterize the charging and driving behavior. It was shown that orderly charging and discharging can alleviate the pressure of grid infrastructure expansion over a long-time scale. An uncertain set optimization method aimed at minimizing the overall cost was introduced in Liang et al. (2017), and it was demonstrated that this approach effectively coordinates both robustness and economy in the scheduling plan. However, the above methods are all studied from the generation end, without fully considering the relevant needs of users, resulting in the optimization and transformation of flexible load scheduling only from the perspective of the generation end, which cannot meet the needs of users.
In response to the above problems, a large number of scholars have proposed improvements. A time-of-use peak-valley charging pricing method for orderly charging control within charging stations was proposed in Xu et al. (2014), where users autonomously respond. This method effectively smooths the charging load of electric vehicles within the station, reduces the electricity purchase cost for the charging station, and lowers the average charging cost for users. A multi-criteria evaluation model, incorporating load peaks, peak-valley differences, and user overall satisfaction, was introduced in Wang et al. (2019) based on traditional time-of-use pricing. It was demonstrated that the use of peak-flat-valley time-of-use pricing not only reduces load fluctuations more effectively and achieves peak shaving and valley filling but also enhances overall user satisfaction. A method was proposed in Wang et al. (2018) to increase the number of electric vehicles capable of reactive charging to the grid based on user preferences. In Mastoi et al. (2022), schedulable space constraints are proposed, and an improved optimal scheduling model is established by referring to the schedulable space constraints. A hybrid particle swarm algorithm is formed by combining the standard particle swarm algorithm to avoid the particle swarm algorithm falling into the local optimal solution defect and improve the solving accuracy of the model. In Literature (Zhou et al., 2021) in view of the lag of manual scheduling and the poor dispersion power of traditional Alternating Direction Method of Multipliers (ADMM) control, this paper adopted the predicted power generation and power consumption as the decomposition function and expansion function of SADMM, and the predicted power at each period was taken as the fixed value of the calculation value of the next iteration, effectively improving the efficiency of power scheduling. Jiao (2022) proposes a new energy power system unit combination decision-making method, which can effectively extract deep features of unit combination data, reduce unit output prediction errors, and improve solution efficiency while ensuring solution accuracy. Sun et al. (2023) proposes a data-driven optimization method based on the bluebar, which is more reliable and less conservative than the simple scenario-based stochastic optimization method when applied to multi-period economic scheduling problems. These vehicles are selected using an optimization model and controlled by operators to manage charging and discharging, thus achieving peak load transfer and ensuring grid stability. However, the above methods do not take into account the impact on load power and total operating cost, and the quality of the solution algorithm is low, resulting in the whole flexible load scheduling process is partially out of control.
Because of the above requirements and problems, this paper proposes a multi-stage balanced scheduling method for a flexible load of large-scale electric vehicles. The innovation points are as follows:
1) The mathematical model constructed is more suitable for the background of flexible load scheduling of large-scale electric vehicles. Compared with Wang et al. (2019) and Wang et al. (2018), the operating cost index and user evaluation index are added, and load balancing constraints are considered.
2) In a single stage, the respective settings are used to ensure that the voltage is basically stable and the loss is moderately reduced. In different stages, the optimization algorithm is used to comprehensively coordinate each objective, so that the optimization results are further optimized.
3) The scheduling effect is greatly improved compared with other algorithms, and the improvement of each index is balanced, and the overall improvement effect is significant.
2 Multi-stage flexible load scheduling optimization model for large-scale electric vehicles
In this paper, the flexible load scheduling problem of electric vehicle charging stations is analyzed in a residential area of a certain city. It is assumed that there is a total of z centralized charging stations in the area, each equipped with m charging piles, with each pile able to serve two electric vehicles. Each charging station is also fitted with k energy storage devices, and there are approximately n electric vehicles in the area, where n≫2m. It is assumed that all charging piles and electric vehicles have identical parameters. This study focuses on the scheduling of all centralized charging stations in the area, setting the rated charging time for electric vehicles as T. If there are n1 vehicles being charged at the station, and if n1 ≤ 2m, the various coefficients and summation terms in subsequent calculations are recorded as n1. If n1≥2m, they are recorded as 2m.
In the problem scenario mentioned, electric vehicles exhibit characteristics of large-scale integration and significant scheduling delays. Based on the practical experience of engineering and reference Sun et al. (2020) and Xu et al. (2018), four indicators of network loss, operation cost, stable operation and user satisfaction are set as the core optimization indicators.
1) Grid loss model: In the process of transmission and distribution from the grid to the electric vehicle, the loss of the control grid has an important impact on the feasibility of the dispatch process, and the loss of the grid also determines whether the dispatch largely is successful. According to the statistical principle, the loss is estimated, assuming that there is an electric vehicle charging currently, and the calculation expression of the loss is:
where represents the charging loss of the charging pile, denotes the loss of the energy storage device, is the loss coefficient when the number of charging electric vehicles is n1, with a value ranging between [0, 1], and are the loss coefficients for the charging pile and energy storage device, respectively.
2) Total operating cost: total operating cost reflects the effectiveness and operability of the scheduling process, and the total operating cost of the scheduling process is considered to be calculated, and its expression is:
where Ct denotes the transformer operation cost, Ce denotes the operating cost of energy storage, Cl denotes he line operation cost, Cω denotes the loss cost, Cti denotes the time cost, , , , denote the cost coefficient of charging an EV is between [0,1].
3) The minimization of load standard deviation: the minimization of load standard deviation reflects the stability of distribution in the dispatching process and reflects the stable state of power supply. The calculation formula is based on the load of electric vehicles, and the calculation formula of its standard deviation is given below:
where Lk denotes the load of distribution network, denotes the arithmetic average value of loads everywhere at this time.
4) The largest user satisfaction: considering that users in different regions and different time periods have different demand for electric vehicle charging, the user experience brought by charging in different regions and different times is scored, and its expression is:
where Mij denotes the score of customers, the subscript i represents the time period of electricity consumption evaluated by the customer, and the subscript j represents the area of electricity consumption evaluated by the user. Aj denotes the regional weighting coefficient, Ti denotes the time-weighted coefficient.
To meet the actual engineering needs, the scheduling process needs to combine the charging parameters of electric vehicles, their own restrictions, grid balancing and other related requirements to complete the scheduling process. According to the above requirements, this paper selects the most important constraints, which are voltage, charging time, electric vehicle energy storage capacity, load balance, power balance and other constraints.
1) Node voltage constraint: in the process of charging the electric vehicle, the voltage of each node cannot exceed the specified maximum voltage and minimum voltage. The constraint is expressed as follows.
where Umin and Umax indicate the minimum and maximum allowable node voltage, respectively, Uk represents the voltage value of node k.
2) Charging time: in the whole scheduling process, the charging time of the scheduled electric vehicle cannot exceed its charging limit, otherwise the user experience will decline sharply. The constraint is expressed as follows:
where Tmax represents the maximum charging time allowed and T represents the charging time of the EV.
3) Battery charging capacity: as electric vehicles are energy storage devices, their reserve capacity is limited, so they should be constrained as follows:
where Qmin and Qmax represent the minimum and maximum allowable capacity of EV, and Q denotes the EV capacity.
4) Load balance: for the charging station, its load should not exceed its limit, otherwise it may be dangerous, and in the scheduling process, in order to make the load of each charging pile relatively balanced, a minimum load is specified, and the constraint is expressed as:
where PLmin is the minimum load. Minimum load refers to the minimum charging capacity required by the charging pile, rather than each charging pile must send power to the outside at every moment.
5) Power balance: in the process of electric energy flow, the generated power should be balanced with the charging power and loss power of electric vehicles. The constraint is expressed as follows:
where PG is the generated power, Pin is the EV charging power, and PL is the loss power.
Combining the above decision variables, optimization index functions and constraints, the mathematical model of scheduling optimization is as follows
where c1, c2, c3 and c4 are the weight coefficients of each objective function. In the whole optimization calculation process, the above multiple objectives are comprehensively calculated to obtain the result, which is the comprehensive calculation of loss, cost, load stability and user experience under the conditions of voltage, time, energy storage capacity, load balance and power balance. A smaller result indicates that the scheduling process is more as expected.
3 EVs charge and discharge optimization scheduling model
3.1 Proposed ACSO algorithm
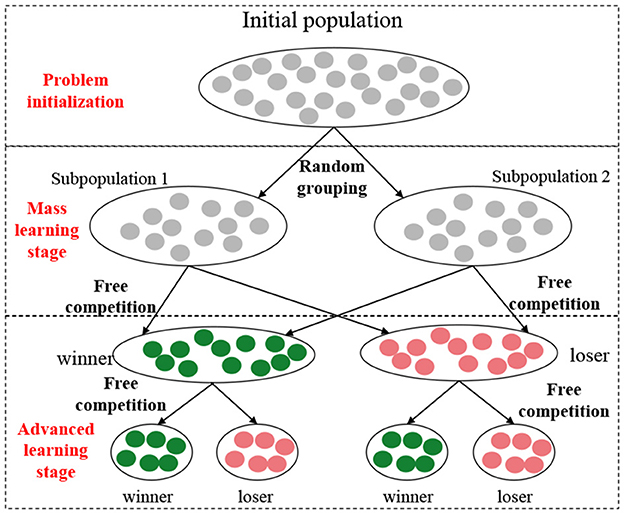
In the above optimization mathematical model, the optimization objective is associated with f2, f1 and the optimization objective is associated with f1, f2 and f3, which leads to multiple peaks in the function and a large number of local optimal solutions. Secondly, the existence of a large number of discrete constraints makes the solution space discontinuous, which makes it impossible to quickly optimize with the help of gradient information (Liu, 2023). Therefore, optimization algorithms are introduced to solve the problem. The Competitive Swarm Optimizer (CSO) (Ran and Jin, 2014; Lan et al., 2020) is one of the most efficient algorithms for large-scale intelligent swarm optimization. It is widely used in large-scale scheduling problems, but it always adopts the basic evolutionary unit composed of two particles. This results in the decrease of particle swarm diversity in the late optimization period. According to this feature, an Advanced Competitive Swarm Optimizer (ACSO) based on dynamic group structure is proposed in this paper, as shown in Figure 1.
First, we generate a swarm containing n particles, each with a single-line encoding [a1, a2, ...ak], where k = 3m. Each encoded value is within the range [0, 1]. The first m encoded values, multiplied by 1,000, represent the maximum voltage of m charging stations. The middle m encoded values, also multiplied by 1,000, denote the maximum allowed charging time for these m charging stations. Finally, the last m encoded values, multiplied by 1,000, indicate the capacity of the m charging stations. Each encoding represents a flexible scheduling scheme pi, and each scheme is mapped to a particle's fitness value based on Equation 10. The fitness function is expressed as:
where flagi represents the logical value corresponding to the constraint. If the scheduling scheme satisfies the constraints, it is set to 0; otherwise, it is set to 1. The value of 10 serves as the penalty. Considering that the first four terms are normalized, the sum ranges from [−4, 4]. Thus, the penalty is relatively on the same scale but maintains a certain gap, providing both optimization space and the effect of penalty terms.
In each subpopulation, we iterate through the particles, randomly pairing them for competition. The particle with the lower fitness value is designated as the winner ω, while the particle with the higher fitness value is labeled as the loser l. The winner passes its fitness value to the next generation of the population, while the loser learns from the winner, updating its velocity and position. The evolution equation is expressed as:
where denotes the position of the winning particle, while and represent the velocity and position of the losing particle, respectively. r0 and r1 are random values uniformly distributed between [0, 1]. After reaching the maximum number of iterations, the optimization results are output. It is important to note that the public learning phase encompasses the entire process of the basic CSO algorithm (Qin et al., 2019).
Advanced learning stage: When all particles undergo a round of updates, some high-quality particles with low fitness value will be generated, which have not undergone any update, but have spent a certain amount of computing resources when they are screened out, so if the next iteration is carried out directly, the evolutionary efficiency of the whole particle swarm will be too low. To improve the learning efficiency, the winning and failing particles in the mass stage are gathered together respectively, and the free competition process is repeated. The evolution principle is also referred to formula, and finally, four groups of small-scale winning particles and failing particles are obtained, among which the particle with the lowest fitness is the optimal solution in this complete iteration.
The above three stages are repeated, and when the maximum number of iterations is reached, the optimal particle, minimum fitness value, and corresponding flexible coincidence scheduling scheme are output. According to the ACSO algorithm, each optimization target should have its flexible load scheduling scheme defined during the optimization process. In this process, charging stations exhibiting abnormally high voltage, loss, and operational costs are prioritized for intervention. The charging of electric vehicles belonging to users who voluntarily participate in scheduling within the supply area is suspended first, allowing for the redistribution of excess electric energy. Simultaneously, the electric energy from users participating in scheduling is utilized as an energy storage source to supply electric energy to vehicles in the abnormal area, as dictated by the algorithm. Following the optimization of various objectives within the area, the charging behavior for electric vehicles belonging to users who voluntarily participate in scheduling is gradually resumed.
3.2 Multi-phase trigger scheduling mechanism
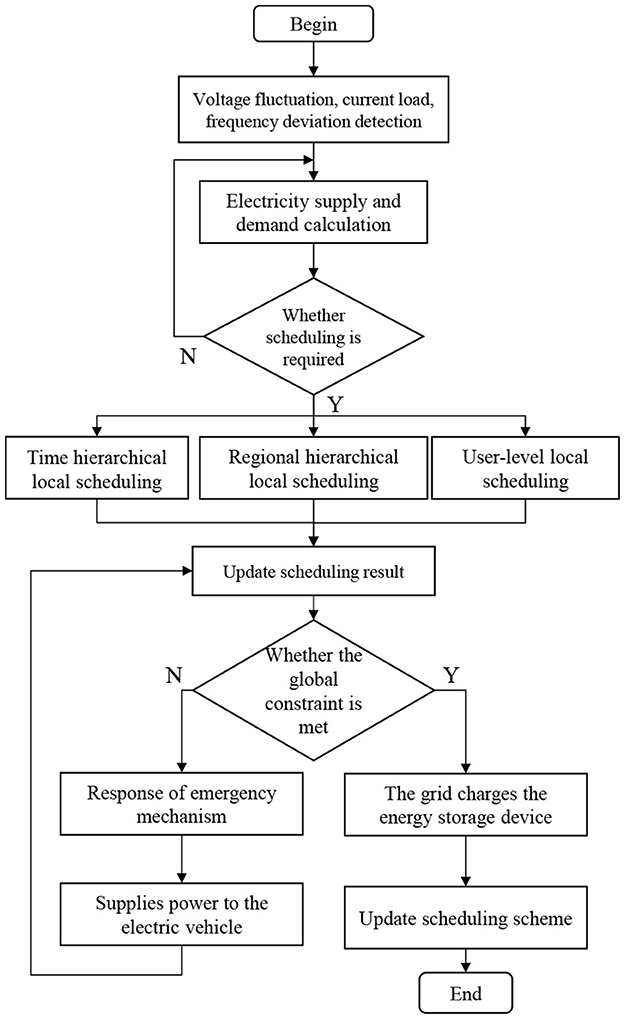
The above solution method can only be scheduled according to the overall situation in a short period at a certain time. Considering that flexible load scheduling is a long period and highly dynamic process, the adaptability of the short-term scheduling scheme is poor, and it is easy to reduce the overall scheduling benefit due to the sudden change of voltage peak caused by weather and man-made accidents in the later period of regulation. Therefore, it is necessary to design an emergency trigger mechanism to turn on the energy storage device in real-time to deal with sudden power imbalances (Hu et al., 2017).
In this paper, a multi-stage trigger scheduling mechanism based on three levels is designed to realize the effect of peak load valley load, and voltage stability. The specific process of ACSO is shown in Figure 2.
Time level trigger scheduling is to predict the charging power in multiple time periods and adjust the power supply of charging station according to the prediction results. Regional level trigger scheduling divides the whole charging station into independent stations, and all the electricity in the stations is uniformly allocated. When the charging location of electric vehicles is unbalanced, the power is transmitted from the loose power stations to the high-power frequency stations (Feng et al., 2022; Bertineti et al., 2020). The user participation level triggers the scheduling, and the charging time of the participants is appropriately adjusted to meet the scheduling effect through the voluntary participation of users in the scheduling, and the time price is set to guide users to take the initiative to participate in the scheduling and avoid the peak (Ding et al., 2023).
4 Simulation experiment and analysis
The actual historical electrical data of electric vehicle charging stations in a regional charging station of Hainan Power Grid were used for simulation experiments. The hardware condition is Intel(R) Core (TM) i5-7300HQ CPU; the software environment is MATLAB R2019a and the operating system is Windows 10. Monte Carlo simulation is used in each condition to ensure reliability, and the number of shots is 1,000 times. There are 76 centralized charging stations in the user area, with a total of 23,000 electric vehicle users. The weight coefficients are set as c1 = c2 = 0.4, c3 = c4 = 0.6. The loss coefficient is . The cost coefficients are set as follows: , , , .
The constraint conditions are set as follows: the charging station's voltage level is selected to be 380 V, with Umin = 353.4V, Umax = 406.6V The charging time for electric vehicles at rated power is T = 0.42h, and the maximum charging duration is Tmax = 0.6h; The electric vehicle battery capacity is calculated based on the battery pack capacity, with a maximum charging capacity Qev = 75kWh and a minimum charging capacity Qmin = 65kWh. The maximum and minimum load power of the charging station are PLmax = 3000kW and PLmin = 1200kWh. The ACSO optimization algorithm is used to solve the results, with a particle swarm size set to 300. The comparative algorithms include PSO (Pan et al., 2018), A-PSO (Wang, 2022), and CSO (Sun et al., 2023). The particle swarm size for the PSO algorithm is also 300, with an inertia weight that decreases from 0.9 to 0.4, and both acceleration coefficients set to 1.8. The particle swarm size for the A-PSO algorithm is 300, with a constant inertia weight of 0.5 and both acceleration coefficients set to 1.3. In the CSO algorithm, the inertia weight is defined as ω = 2 − 1.8r1−1.8r2, where are random numbers in the range [0, 1], and the learning rate ϕ = 0.2.
4.1 Data preprocessing
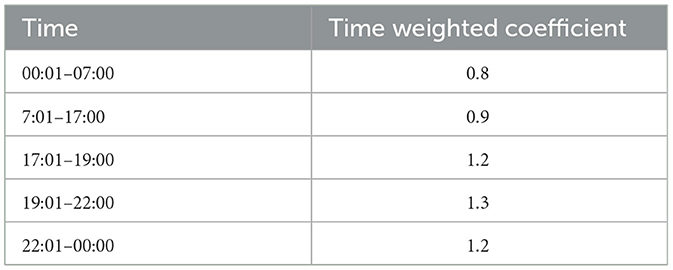
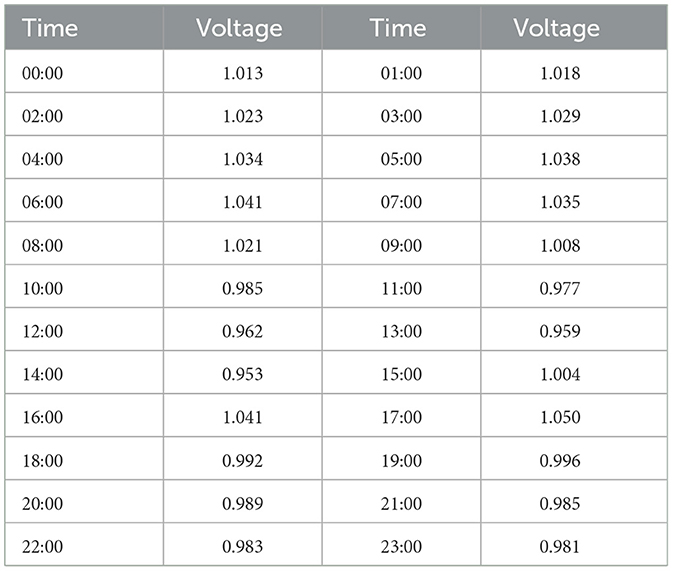
Firstly, the time weighting coefficient and area weighting coefficient are clarified. The larger the weighting coefficient is, the larger and more concentrated the number of charging users in the area or time period, so their evaluation has a more significant impact on the overall effect. These 76 charging stations are divided into four, and the regional weighting coefficients are: 1.3, 1.1, 0.95, 0.8, respectively, and the time weighting coefficients of the four regions in the same period are the same, as shown in Table 1. Since the user satisfaction score cannot be given directly, this paper simulates the user satisfaction at different times and different regions according to the charging time and charging convenience, to simulate the influence of the real score on the flexible load scheduling. The day with the most complex voltage variation before and after a certain legal holiday was selected and its whole-hour voltage was recorded, as shown in Table 2.
4.2 Simulation results
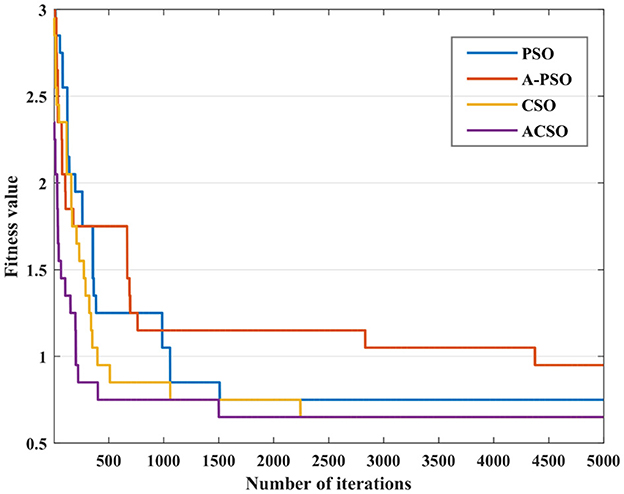
The total number of electric vehicles in this region is about 23,000. According to charging every 2–3 days, an average of 11,000 electric vehicles needs to be charged in a day. The experiment is carried out according to the historical data of the whole year 2023, and compared with PSO, A-PSO and CSO algorithms. All algorithms are terminated by 5,000 iterations, and the optimization process is shown in Figure 3. It can be seen from Figure 3 that ACSO algorithm has enhanced the global search ability compared with other algorithms, and its adaptability and rapidity have been greatly improved. In the same way, its search results are more accurate, and the optimal solution can be found more quickly.
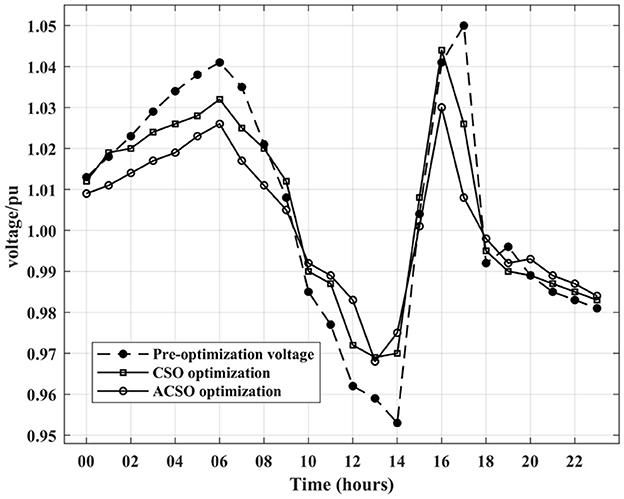
The charging station nodes are selected to compare the voltage before and after the optimization within a day compared with the CSO algorithm. The unit voltage system is selected for comparison, as shown in Figure 4. It can be seen from Figure 4 that the maximum voltage of the node in a day is 1.050 pu, the minimum voltage is 0.953 pu, and the maximum voltage variation is 5%. After optimization, the maximum voltage variation is 1.030 pu, the minimum voltage is 0.968 pu, and the maximum voltage variation is 3.2%, which is 1.8% lower than the maximum voltage variation before optimization. After optimization by the ACSO algorithm, the variation range of node voltage is reduced, and the maximum and minimum values of voltage are close to the reference voltage, to meet the role of maintaining stable voltage in the scheduling process, which has a very large role in reducing the impact of electric vehicles connected to the grid.
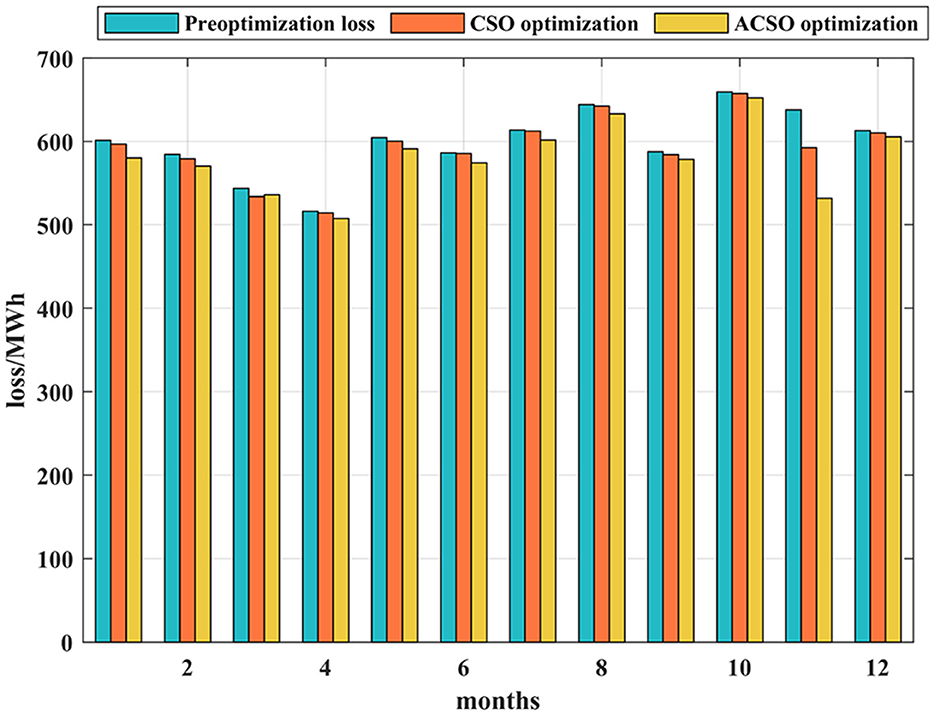
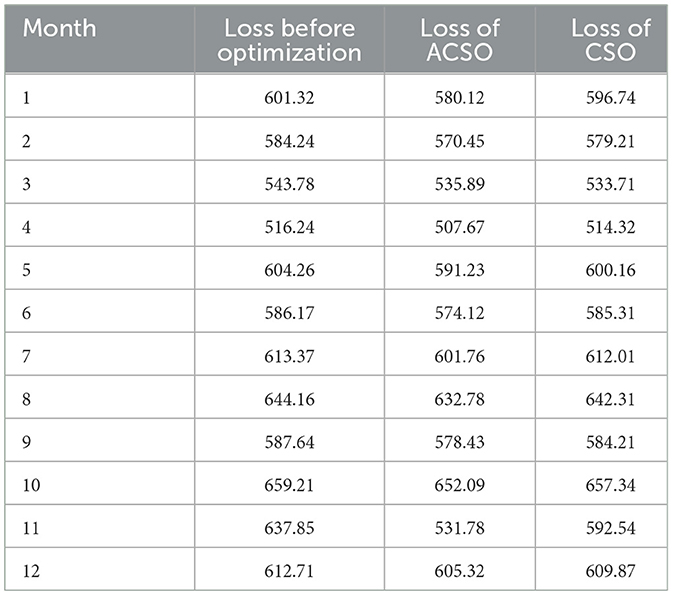
The monthly load of 2023 is used to compare with the simulation experiment. For the network loss, the calculation of this part is more complex. This paper adopts a simplified calculation method and uses the daily root mean square. The average square root of daily current in each month was calculated from the data of f5 days selected from each month, and the monthly calculated loss was obtained. By comparing with the loss obtained from simulation results, Figure 5 and Table 3 show that the maximum difference of monthly loss appeared in November, the calculated loss was 637.85 MWh, the optimized loss was 531.78 MWh, and the difference was 106.07 MWh. The calculated loss of the whole year is 7,320.42 MWh, and the optimized loss is 7,071.54 MWh, while the loss of the CSO algorithm is 7,277.42 MWh. The optimized loss of the proposed method is about 3.4% less than the total loss and about 2.83% less than the optimized result of the CSO algorithm. It reduces the loss of electric energy in the long grid so that the whole loss is slightly reduced, so the loss control meets the requirements.
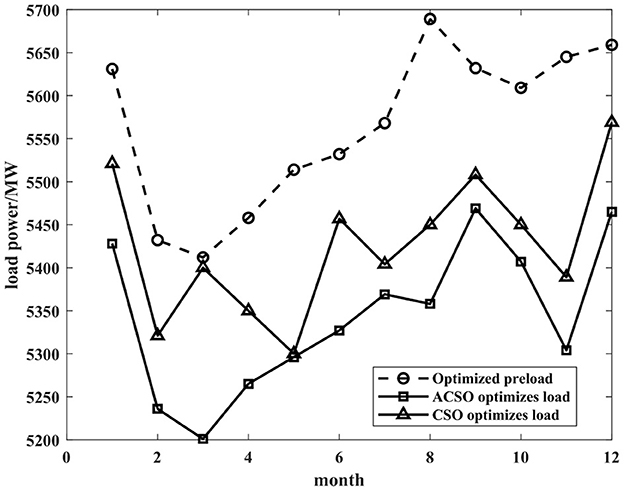
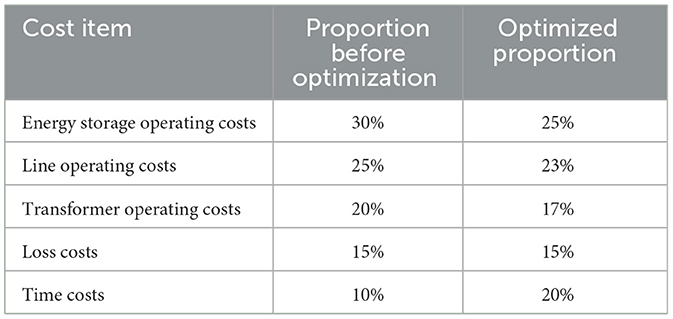
It can be seen from Figure 6 that after ACSO algorithm optimization, the load power is reduced relative to the actual load power, and the optimization result of the ACSO algorithm is better than that of the CSO algorithm. For multi-objective optimization, it is not only necessary to meet the peak load-shaving task in the process of flexible load scheduling but also to effectively reduce the overall operating cost. The proportions of various types of operating costs before and after optimization are shown in Table 4.
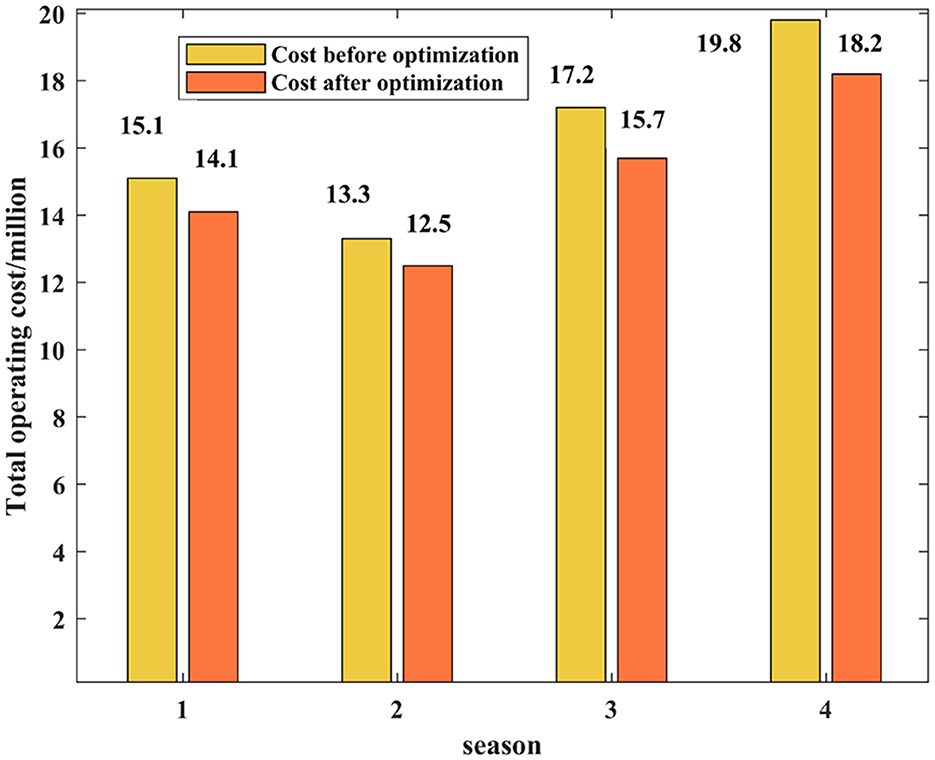
As can be seen from Table 4, the most obvious change is the timetable. The proportion of time cost increases from 10 to 20%, which is due to the adjustment of charging electric vehicles in the process of ensuring flexible load scheduling, which increases the charging time, but decreases the total operating cost. Figure 7 shows the operating cost diagram.
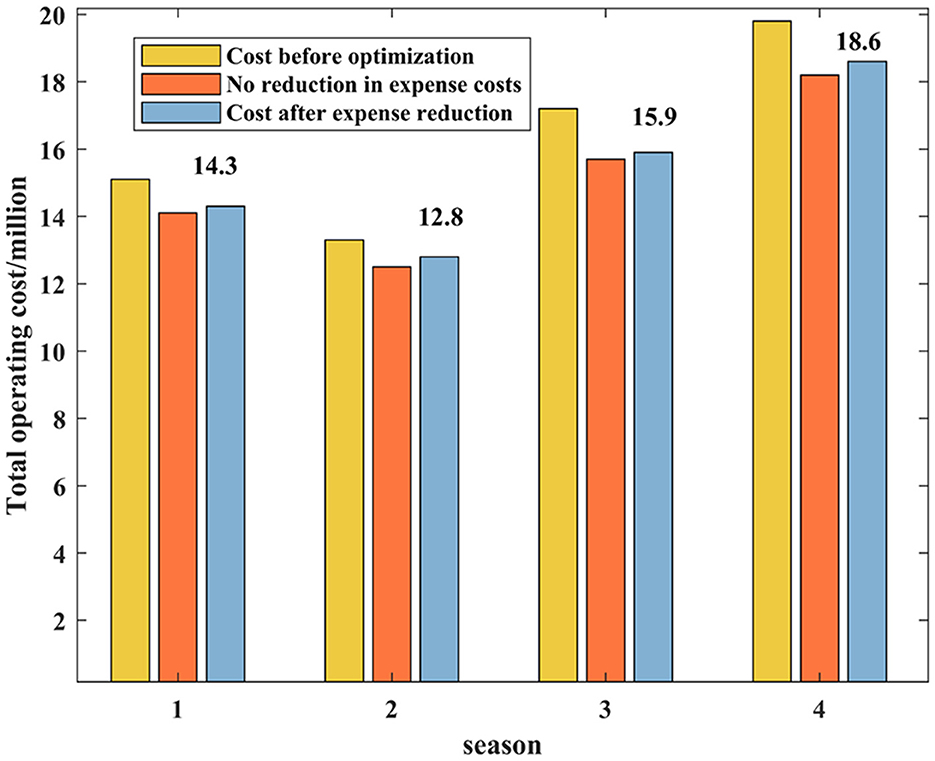
It can be seen from Figure 7 that the total operating cost has been reduced compared with that before optimization. The annual operating cost before optimization is about 65,400 RMB, and the cost after optimization is about 60,500 RMB. By reducing the charging cost per unit time involved in scheduling, users can reduce the charging cost, so as to make up for the adverse effects caused by the increase of time. Figure 8 shows the comparison of the total cost after reducing the charging cost per unit time.
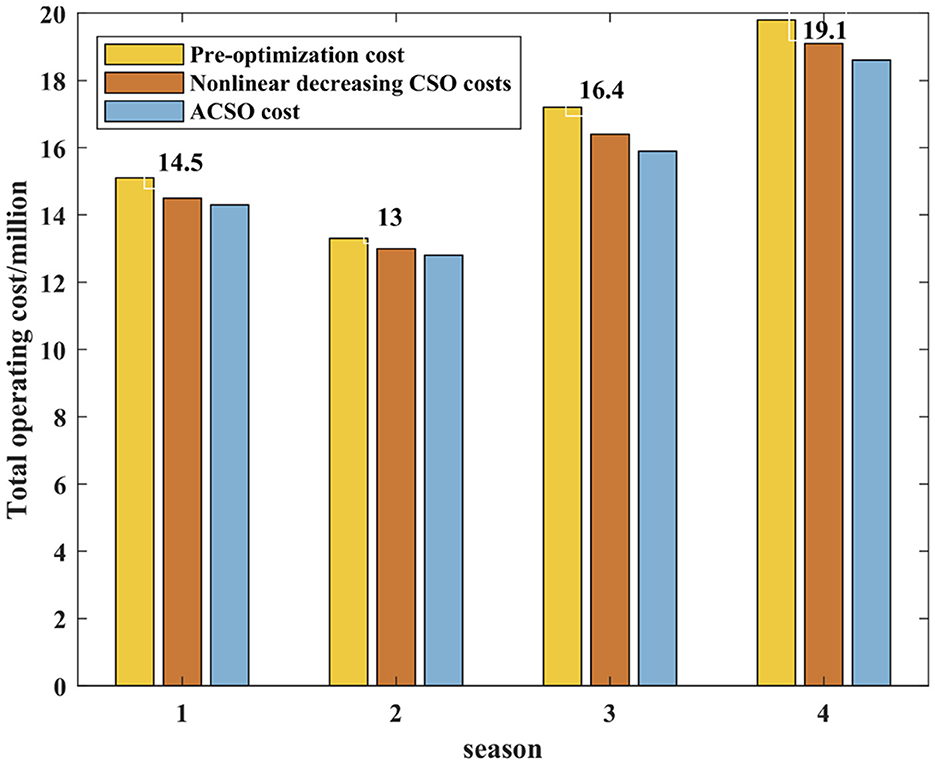
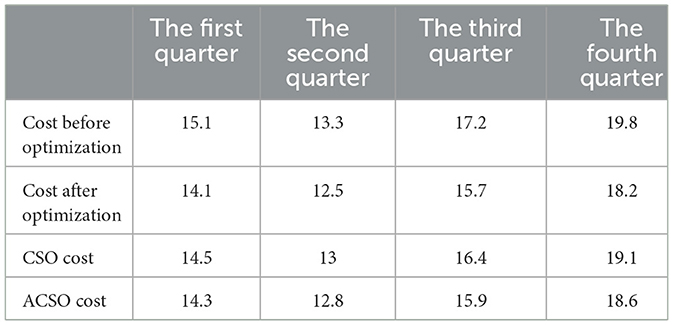
It can be seen from Figure 8, although the operation cost increases after reducing the charge per unit charging time, it is smaller than the actual total operation cost. The cost after reducing the charge is about 61,600 RMB, which is 5.81% lower than the actual cost. In this way, the total operation cost is reduced, and the electric vehicle users participating in the scheduling can also reduce the corresponding charging cost. Then, the ACSO optimization results are compared with the CSO optimization results, as shown in Figure 9 and Table 5. As can be seen from Figure 9, CSO optimization cost is lower than that before optimization, but the ACSO algorithm used in this paper is lower than that of CSO optimization algorithm, which verifies that the ACSO algorithm described in this paper is more applicable to large-scale flexible conformance scheduling of electric vehicles.
5 Conclusion
In this paper, a multi-stage balanced scheduling method of large-scale flexible load of electric vehicles based on ACSO algorithm is proposed. Through the particle swarm optimization calculation of the adverse factors generated by large-scale electric vehicle charging and the factors that need to be optimized again, the adverse factors in the whole group are suppressed, and the factors that need to be optimized are optimized to different degrees. The results show that on the basis of considering user experience, multi-stage flexible conformant scheduling can meet peak load clipping, maintain stable voltage, reduce operating costs, reduce losses, and reduce grid end impact.
Data availability statement
The datasets presented in this article are not readily available since the data is provided by China Southern Power Grid Technology Project, there is a confidentiality agreement. If you want to obtain the data, please contact the corresponding author of this article at ZzE4MjEwNjYwODdAMTYzLmNvbQ==.
Author contributions
PS: Formal analysis, Funding acquisition, Methodology, Software, Writing – original draft. ZH: Investigation, Resources, Supervision, Validation, Visualization, Writing – review & editing. HM: Conceptualization, Data curation, Methodology, Validation, Visualization, Writing – original draft.
Funding
The author(s) declare financial support was received for the research, authorship, and/or publication of this article. This work was supported by the Science and Technology Project of China Southern Power Grid Co., Ltd. (No. 073000KK52220001). The funder was not involved in the study design, collection, analysis, interpretation of data, the writing of this article, or the decision to submit it for publication.
Conflict of interest
PS, ZH, and HM were employed by Electric Power Research Institute of Hainan Power Grid Co., Ltd.
Publisher's note
All claims expressed in this article are solely those of the authors and do not necessarily represent those of their affiliated organizations, or those of the publisher, the editors and the reviewers. Any product that may be evaluated in this article, or claim that may be made by its manufacturer, is not guaranteed or endorsed by the publisher.
References
Bertineti, D. P., Canha, L. N., Brignol, W., Medeiros, A. P., de Azevedo, R. M., and Nadal, Z. L. I. (2020). “Flexible energy management strategy for electric vehicles charging stations,” in 2020 55th International Universities Power Engineering Conference (Turin), 1–6. doi: 10.1109/UPEC49904.2020.9209763
Ding, Y., Zhu, Y., Wang, Q. C., Tian, Z., Yan, R., Yan, Z., et al. (2023). A comprehensive scheduling model for electric vehicles in office buildings considering the uncertainty of charging load. Int. J. Electr. Power Energy Syst. 151:109154. doi: 10.1016/j.ijepes.2023.109154
Duan, X. Y., Hu, Z. C., Cui, Y., Guo, Z. Z., Cao, X., Ding, N., et al. (2018). Optimal charging and discharging strategy for electric vehicles in large timescales. Power Syst. Technol. 42, 4037–4044. doi: 10.13335/j.1000-3673.pst.2018.1682
Feng, J. W., Yang, J. Y., Wang, H. X., Wang, K., Ji, H., Yuan, J., et al. (2022). Flexible optimal scheduling of power system based on renewable energy and electric vehicles. Energy Rep. 8, 1414–1422. doi: 10.1016/j.egyr.2021.11.065
Hu, L., Wang, X. M., and Lu, Z. P. (2017). “Research on Bidirectional High-Power Factor and Low Harmonic Electric Vehicle Chargers,” in Excellent Proceedings of the 25th East China Electrical Engineering (Electric Power) Society Transmission and Distribution Technology Seminar, 157–162.
Jiao, Y. (2022). Data-driven New Energy Power system Scheduling Method. Beijing: North China Electric Power University.
Lan, R., Zhu, Y., Lu, H., and Luo, X. (2020). A two-phase learning-based swarm optimizer for large-scale optimization. IEEE Trans. Cybern. 51, 6284–6293. doi: 10.1109/TCYB.2020.2968400
Liang, Z. P., Chen, H. Y., Wang, Y. C., Zhang, C., Zheng, X. D., and Wan, C. I. (2017). Robust economic dispatch of microgrids containing electric vehicles. Power Syst. Technol. 41, 2647–2658 doi: 10.13335/j.1000-3673.pst.2016.3100
Liu, B. (2023). Optimization strategy of distribution network energy storage system based on ACO and CSO algorithm. J. Electr. Appl. 42, 9–15.
Mastoi, M. S., Munir, H. M., Zhuang, S., Hassan, M., Usman, M., Alahmadi, A., et al. (2022). A comprehensive analysis of the power demand–supply situation, electricity usage patterns, and the recent development of renewable energy in China. Sustainability 14:3391. doi: 10.3390/su14063391
Pan, Y. J., Qiu, X. Y., Xiao, J. K., and Wu, J. W. (2018). Optimal temporal and spatial bi-layer scheduling strategy of electric vehicles charging load. South. Power Syst. Technol. 12, 62–70. doi: 10.13648/j.cnki.issn1674-0629.2018.05.010
Qin, Y. B., Cao, B. Q., and Deng, C. H. (2019). A data clustering method based on competitive population optimization. Comput. Modern. 75–79, 100.
Ran, C., and Jin, Y. C. (2014). A competitive swarm optimizer for large scale optimization. IEEE Trans. Cybern. 45, 191–204. doi: 10.1109/TCYB.2014.2322602
Sun, G. Q., Xu, G. K., Shen, P. F., Wei, Z. N., Chen, S., Lu, S., et al. (2020). Coordinated economic dispatch of flexible district for large-scale electric vehicle load. Power System Technol. 44, 4395–4404. doi: 10.13335/j.1000-3673.pst.2019.2453
Sun, J. W., Wan, Y. F., Zheng, P. W., and Lin, X. (2014). Coordinated charging and discharging strategy for electric vehicles based on demand side management. Trans. China Electrotechnical Soc. 29, 64–69.
Sun, Z. F., Li, B., and Wang, L. (2023). Power system data-driven Blu rod optimization scheduling considering wind power dependence. China J. Test. 49, 93–103.
Wang, K., Yao, J. G., Yao, L. Z., Yong, S., and Yong, T. (2014). Survey of research on flexible loads scheduling technologies. Autom. Electr. Power Syst. 38, 127–135. doi: 10.7500/AEPS20140422005
Wang, L., Yang, H. J., Ma, Y. H., and Zhang, D. B. (2019). Optimization model of multi-period time of use strategy considering multiple assessment indices. Electr. Power 52, 54–59.
Wang, S. Q. (2022). Consider the operation and scheduling optimization of the regional integrated energy system of V2G. Sci. Technol. Innov. 34, 30–34.
Wang, X., Zhou, B. X., and Tang, H. (2018). A coordinated charging/discharging strategy for electric vehicles considering customers' factors. Power Syst. Prot. Control 46, 129–137.
Xu, W., Rian, X. L., and Zhang, R. (2018). Research on optimization scheduling strategy of flexible load response involving electric vehicles. Electr. Meas. Instrum. 55, 8–12.
Xu, Z. W., Hu, Z. C., Song, Y. H., Zhang, H., and Chen, X. (2014). Coordinated charging strategy for PEV charging stations based on dynamic time-of-use tariffs. Proc. CSEE 34, 3638–3646. doi: 10.13334/j.0258-8013.pcsee.2014.22.008
Zhang, Y., Ji, Z. X., and Pan, J. H. (2024). Systemic socio-economic transformation under the goals of carbon peakand carbon neutrality: characteristics, requirements and paths. J. Beijing Univ. Technol. 24, 101–115. doi: 10.12120/bjutskxb202401101
Keywords: electric vehicles, charging pile, flexible load scheduling, optimization algorithm, CSO
Citation: Pang S, Zhao H and Huo M (2024) A multi-stage balancing scheduling method for flexible loads of large-scale electric vehicles. Front. Smart Grids 3:1505351. doi: 10.3389/frsgr.2024.1505351
Received: 02 October 2024; Accepted: 30 October 2024;
Published: 03 December 2024.
Edited by:
Van-Hai Bui, University of Michigan-Dearborn, United StatesReviewed by:
Ali Hassan, University of Michigan–Dearborn, United StatesQuang Manh Hoang, University of Michigan–Dearborn, United States
Copyright © 2024 Pang, Zhao and Huo. This is an open-access article distributed under the terms of the Creative Commons Attribution License (CC BY). The use, distribution or reproduction in other forums is permitted, provided the original author(s) and the copyright owner(s) are credited and that the original publication in this journal is cited, in accordance with accepted academic practice. No use, distribution or reproduction is permitted which does not comply with these terms.
*Correspondence: Songling Pang, ZzE4MjEwNjYwODdAMTYzLmNvbQ==
 Songling Pang
 Hailong Zhao1,2