- 1State Grid Shanghai Municipal Electric Power Company, Shanghai, China
- 2State Grid Hangzhou Power Supply Company, Hangzhou, China
- 3College of Electric Power Engineering, Shanghai University of Electric Power, Shanghai, China
The wound-field doubly salient machine (WFDSM) is a generating system core assembly. Its condition monitoring and early fault diagnosis are key to improving system reliability. This study proposes a fault diagnosis method based on multi-signal mixed domain fusion at the feature level and genetic algorithm improved XGBoost (GA-XGBoost). First, low-pass noise reduction, singular value decomposition noise reduction, and other signal pre-processing are applied to the current and vibration signals of early inter-turn short-circuit faults. Second, the time domain, frequency domain, and entropy features of the current signal, along with the time domain features of the vibration signal, are extracted, together forming a diagnostic feature set. Then, the feature set is put into the GA-XGBoost model. The results show that the proposed method of feature fusion achieves an accuracy of 99.3%. Thus, the multi-signal mixed domain fusion has stronger signal characteristic expression ability. In addition, the GA-XGBoost model achieves better generalizability and higher accuracy in the small-scale samples of WFDSM faults. The experimental results demonstrate that this method can effectively diagnose various conditions and also has strong anti-interference capability under extreme conditions.
1 Introduction
The wound-field doubly salient machine (WFDSM) has the characteristics of simple structure and high reliability. Therefore, it is suitable for electric vehicles and other extreme-condition applications (Zhou et al., 2020; Zhang et al., 2018; Chen et al., 2020). However, irreversible short-circuit faults in the armature windings, influenced by external magnetic fields, high temperatures, and natural aging, occur frequently. When an inter-turn short-circuit fault occurs, it is difficult to distinguish using traditional diagnosis methods due to the slight changes in current and vibration. Such short-circuit faults, if not monitored in time, can cause significant heating and bearing vibration, which can endanger the operation of the motor and even the safety of the airplane. Therefore, early-stage condition monitoring and fault diagnosis of WFDSM are significant and necessary. Signal analysis methods are generally divided into two categories: 1) model-based and 2) data-driven-based.
Model-based methods mathematically formulate the fault evolution process to facilitate the diagnosis of abnormal conditions (Namdar, 2022; Bebars et al., 2022). These methods typically analyze and model a single signal, with current and vibration being the most widely used detection characteristic quantities. A novel method is proposed by modeling the current in Chen et al. (2021), whose fault can be deduced by comparing the measured and estimated currents. The short-circuit fault of 8–6 pole switched reluctance motors has been detected by analyzing the current compensation coefficient (Zhang et al., 2021). In 12–8 switched reluctance motors, a fault-diagnosis strategy has been investigated for transistor faults, where a current coefficient is adopted to identify the fault position (Han and Zhu, 2021). The loop model can analyze the current slope and measurement symbol, and its effectiveness has been verified through a variety of experiments on different fault types (Fang et al., 2021). Vector space decomposition and double three-phase space vector modulation have been adopted to extract feature information, combined with current trajectories to select more accurate fault feature information from a permanent magnet synchronous motor (Wang et al., 2019). The Wavelet transform has been applied to extract fault features from the cost function in the model predictive control system, and the inter-turn fault has been diagnosed by monitoring the normalized energy-related feature vector (Hang et al., 2019). Zhang et al. (2020) proposed a method based on zero-sequence voltage vector decomposition to solve inter-turn short-circuit fault problems. The voltage vector whose phase angle is closest to the fault phase angle was extracted from the zero-sequence voltage vector, which improved the sensitivity of fault phase identification. A model of a phase winding with inter-turn short circuit was built, and the fault characteristics were analyzed. The frequency signature of the motor was extracted by Fourier analysis when operating in normal conditions. When a fault occurred, the symmetry of the phase currents was broken, and both the negative and zero sequence components of the phase currents appeared. According to the asymmetry, an index—the ratio of negative to positive sequence components of the phase currents—was defined to identify whether the motor was operating normally (Chen et al., 2022). Zhang Y. et al. (2022) used the general current deviations between the dq-axis feedback currents and dq-axis predicted currents from different faulty models to locate the faulty phase. Then, an intervention-based diagnosis was developed to identify the specific fault. Although this method can achieve instantaneous and high efficiency, accurate mathematical models are difficult to obtain. In addition, this method was designed to solve specific faults and therefore is not directly applicable to other systems.
Data-driven-based methods use a variety of signal processing and statistical analysis techniques to extract the key features of anomalies for diagnosis. A large number of fault features contained in the stator current are used, and the stator phase current in vector form is put into CNN to judge the fault condition accurately; this has been verified in a real synchronous motor (Skowron et al., 2022). S-transform is performed on the induction electromotive force of the synchronous motor to extract parameter characteristics from the time–frequency curve. By comparing the standard deviation values and similarity of different parameters, the characteristic vectors are established and fed into a particle swarm optimization least-squares support vector machine model for fault identification (Song et al., 2020). Time–time-transform has been applied to extract the pixel rate of its diagonal element contour surfaces as the fault feature, and an extreme learning machine was utilized as a classifier to obtain the unique fault labels that can represent the positions at which demagnetization occurred (Song et al., 2019). Adaptive secondary sampling of the fundamental period was introduced to fit for the variable-phase current data, which exhibits high accuracy, strong robustness, and especially good generalization capability for different kinds of multiphase drive systems (Song et al., 2019). Shih et al. (2022) developed a mathematical model to assist with feature selection associated with inter-turn short-circuit faults and help identify suitable variables to regulate in the experiments for data collection. The diagnosis model was then trained with the support vector machine (SVM) algorithm using the labeled data obtained by measurements on a permanent magnet synchronous motor. The theoretical excitation current was estimated by artificial intelligence. The algorithm estimates the field current, which was compared with the real current. The fault severity level was calculated from this comparison (Guillén et al., 2022). A data-driven mechanical fault diagnosis method for induction motors using stator current signals was proposed in Sun et al. (2022). Through the automatic feature extraction and classification of the residual current envelope spectrum, high diagnosis accuracy could be obtained even if some differences existed among samples. Although the data-driven method is relatively simple and requires no prior knowledge of the system’s internal mechanisms, the model’s solution still needs to be optimized in most cases, and the speed of model solution is limited.
Both data-driven and non-data-driven approaches tend to be based on a single detection which is affected by sensor faults and complex working conditions. Therefore, data fusion is gradually applied in fault diagnosis. The data fusion refers to automatic analysis and synthesis of multiple detection signals such as current, vibration, and magnetic signals under certain criteria. The types of faults in reluctance motors under variable speed conditions are identified by fusing the current and vibration signals, based on features such as the resampled envelope spectrum (Wang et al., 2021). Sensitive harmonics are extracted from multiple flux sensors near the motor, and data from multiple sensor locations are analyzed by confidence function theory fusion (Irhoumah et al., 2017). A color symmetrized dot pattern method has been newly designed to infuse three multi-sensor signals to image, where a coarse and refined diagnosis framework is designed. In the coarse part, the color histogram features and a SVM are utilized, and a threshold is selected to decide the coarse diagnostic samples. Meanwhile, in the refined part, the SVM is used to diagnose remaining samples (Tang et al., 2022). A novel multiclass wind turbine method bearing-fault diagnosis strategy has been proposed based on the conditional variational generative adversarial network model combining multisource signals fusion. This strategy converts multisource 1-D vibration signals into 2-D, and the multisource 2-D signals are fused by using wavelet transform. The results show that the proposed strategy can increase wind turbine bearing fault diagnostic accuracy in complex scenarios (Zhang L. et al., 2022). 1D-GAPCNN-SVM was proposed to address the early anomaly diagnosis problem. A 1-D global average pooling layer has been designed to substitute the fully connected layer with two or three layers to reduce the number of parameters (Gong et al., 2021). A multi-sensor-based framework has been proposed for the fault diagnosis of rotating machinery based on deep learning and data fusion techniques, integrating thermal imaging with vibration measurements. The results demonstrate that the proposed data fusion method presents high diagnostic performance in identifying machine health conditions in a complex working environment. Therefore, the data fusion method can overcome the traditional single-detection analysis methods that are susceptible to external signal interference and are widely used in the field of diagnosis. However, the traditional fusion algorithm is usually based on the fusion of several calculations. Although it can reduce computation and make the fault tolerance ability stronger, some features will inevitably be lost. Therefore, this study adopts a feature-fusion method to reduce the amount of fused data while preserving most of the fault features.
As a reluctance motor, WFDSM has a complex harmonic content and often operates in a variable environment, making it difficult to fully characterize the motor fault process using a single detection quantity or single-domain characteristics. Existing methods commonly rely on either a single detection quantity or single-domain features, which may not adequately capture the intricate fault processes of WFDSM. To address these limitations, this study introduces a fusion method that integrates both mechanical and electrical signals for fault diagnosis. By combining multi-source, mixed-domain information, the proposed approach offers a more comprehensive representation of the motor’s operating conditions, leading to better diagnostic accuracy than traditional methods. Furthermore, a genetic algorithm (GA) is employed for its strong global search capabilities, enabling the identification of optimal hyperparameters for model construction and ensuring effective feature selection for fault diagnosis. This combination of signal fusion and GA-based optimization enhances the robustness and performance of the diagnostic model.
The rest of this article is organized as follows. Section 2 describes the effect of short-circuit faults on current and vibration signals. Section 3 introduces the composition of the mixed domain. Section 4 contains the GA-XGBoost recognition model. Section 5 shows the results of simulations and experiments. Section 6 concludes the paper.
2 Theoretical fault analysis of 8–10 WFDSM
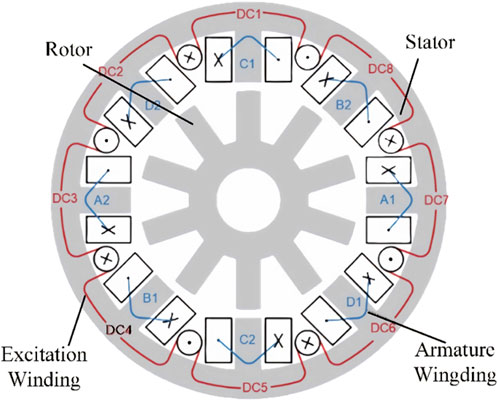
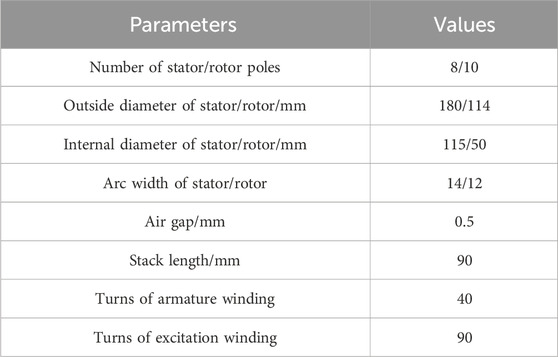
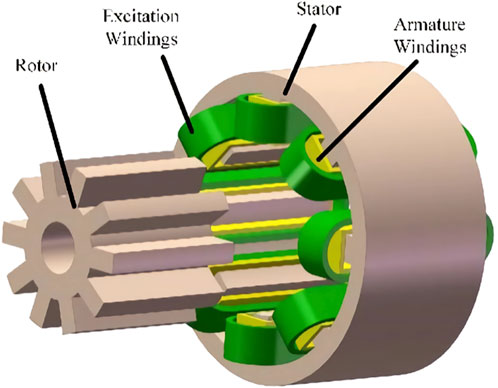
A four-phase 8–10-pole WFDSM was designed with a structure that included a 4N/5N configuration (where N is a positive integer) (Figure 1 and Table 1). Compared with traditional three-phase motors, this four-phase motor features a smaller pole-arc coefficient and offers more flexible multi-element unit structure selection, making it adaptable to various conditions (Zhao et al., 2021). Additionally, its simple design enhances fault tolerance. Figure 2 illustrates the 3D model of the motor, showcasing a radial structure with uniformly distributed stator slots, along with evenly distributed armature and excitation windings in each slot.
2.1 Short-circuit fault setting
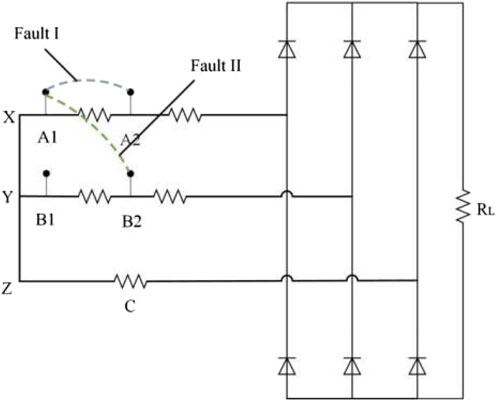
In order to study the inter-turn short circuit fault of 8–10 pole WFDSM, the armature windings of the motor are shown in Figure 3. For phase A, there are 40 turns of armature winding per phase. The first and tenth turns of the winding are defined as A1 and A2, respectively, dividing the winding of phase A into two parts: 10 turns named A1 and 30 named A2. Different types of inter-turn short circuit faults are researched, with Faults I and II marked in Figure 3.
2.2 Short circuit fault
When Fault I occurs in phase A, the four-phase currents are expressed thus:
where
where
where
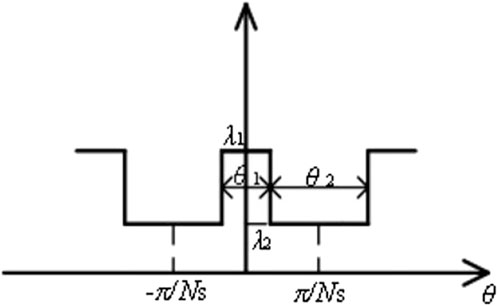
According to the stator structure of the WFDSM motor, the air-gap permeance waveform is shown in Figure 4. The corresponding air gap permeance
where
The
During the operation of the motor, the generated electromagnetic force will cause electromagnetic vibration. According to Maxwell’s law, the radial electromagnetic force of the stator surface is positively correlated with the flux density. The radial magnetic density is much higher than the tangential magnetic density, so the electromagnetic vibration is mainly determined by the radial magnetic tension:
The generated torque
where
where
The corresponding
Therefore, the changes of vibration characteristics and torque are caused by the variable magnetic field. The vibration quantity can be used as the characteristic quantity for fault diagnosis.
In summary, fault diagnosis of WFDSM in early extreme conditions can be realized by current and vibration quantity.
3 Noise reduction and feature selection
Due to different magnitudes and noise interference, the unprocessed data cannot be directly used for fault diagnosis, so signal pre-processing is required. The interference will be caused in the actual signal by the noise. Thus, noise reduction is the most important part of signal pre-processing. Feature extraction should be conducted after noise reduction.
3.1 Feature extraction
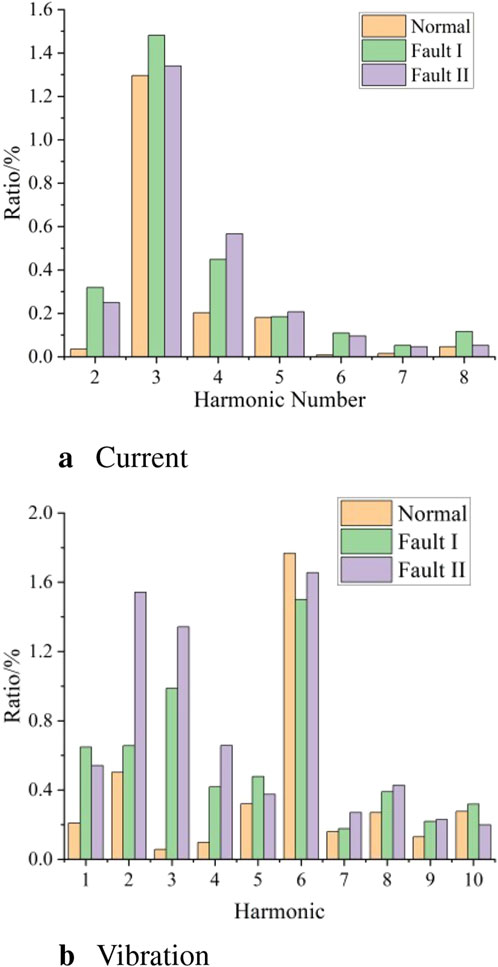
The FFT decomposition results of the current and vibration signals are shown in Figure 5.
First, the input signal requires noise reduction, and the noise reduction methods are determined by the frequency distribution. Figure 5A shows that the fault characteristics for harmonic components of the fifth order and above are not significant, and the current signal is concentrated in the lower-frequency range. Therefore, Butterworth low-pass filtering is applied to remove these higher-order harmonic components, focusing on the relevant lower-frequency signal features for fault detection.
While the vibration signal is more dispersed in Figure 5B, the low-pass filtering method cannot be applied. Singular value decomposition (SVD) is an effective method of signal processing. The signal is decomposed into different components, and the significant components are selected based on the singular value difference method. The effective components are retained after SVD while other noises are removed. The vibration signal is scattered in various frequency bands, which is suitable for SVD noise reduction.
Therefore, low-pass filtering is adopted for the noise reduction of current signal, and SVD is adopted for the noise reduction of vibration signal.
3.2 Noise reduction
When the pre-processing is completed, the feature should be extracted from the signal. The feature consists of three parts: time domain, frequency domain, and signal entropy.
3.2.1 Time domain features
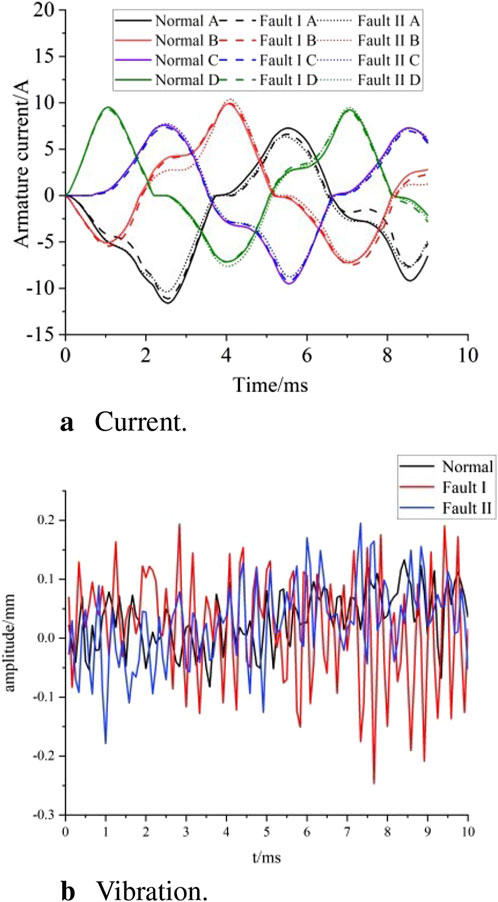
When a fault occurs, the amplitude, variance, and probability distribution of the time domain will change. Figure 6 compares the four-phase current signals and A-phase vibration signal of the time domain under different conditions: normal, Fault I, and Fault II. The x-axis represents time (ms), while the y-axis represents amplitude, with current measured in amperes (A) and vibration in millimeters (mm).
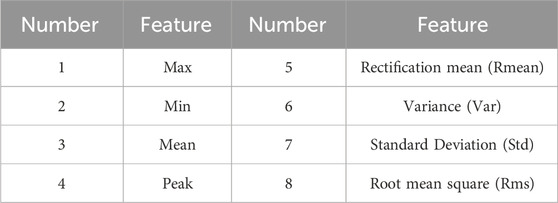
The changes in current and vibration signals are reflected in various time-domain features when a fault occurs. Key statistical values such as the maximum, minimum, mean, peak, rectification mean, variance, standard deviation, and root mean square are used to characterize these changes. Table 2 provides a summary of these time-domain features, which are essential for fault diagnosis as they capture signal behavior under different conditions.
The current time domain features and vibration time domain features are recorded as A1 and B1, with the composition of the two sets as follows:
3.2.2 Frequency domain features
Although the time domain feature is the most direct feature extraction method, it cannot fully display the fault features of WFDSM for the limitations of the fault information. The frequency domain also contains a lot of information for fault diagnosis, so it is necessary to extract the features of the frequency domain.
As can be seen from Figure 5, the current signal is mainly concentrated in the low frequency band, generating more low harmonics; thus, its variation in the frequency domain is obvious. Consequently, the frequency domain features of the current signal can be used as evidence for fault diagnosis. In comparison, the distribution of vibration signals under different working conditions is more uniform: after the SVD, a lot of noise is removed, and thus the difference in frequency domain is smaller. Therefore, only the frequency domain features of the current are analyzed.
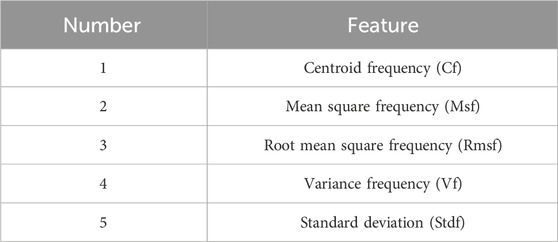
The frequency domain features extracted from the power spectrum analysis include centroid frequency, mean square frequency, root mean square frequency, variance frequency, and standard deviation. These features, summarized in Table 3, reflect the distribution and position of the main frequency components of the power signal, effectively capturing the signal’s variations in the frequency domain.
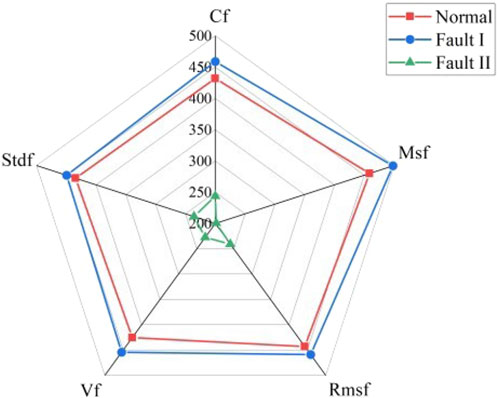
According to the frequency domain comparisons depicted in Figure 7, when Fault I occurs, there is a slight increase in various frequency indices of the WFDSM compared to the normal operational state. Conversely, during Fault II, all frequency indices experience a significant decrease. These observations demonstrate that changes in the current frequency domain features can effectively reflect variations in motor conditions. The features under consideration are grouped under the label A2, with the set comprising the following components:
3.2.3 Entropy domain features
Although the above time and frequency domain features can provide important evidence for WFDSM’s condition analysis, it is difficult to obtain complete fault features for current signals with a low signal noise ratio (SNR). Entropy can quantify the uncertainty of information and describe the information quantity of signal, which can provide an important basis for system complexity and dependence. The value of information entropy is influenced by the probability distribution—the larger the uncertainty of the system probability distribution, the higher the information entropy, and vice versa.
So as to improve the accuracy of diagnosis, the current signal entropy is combined with some feature extraction methods, including energy entropy obtained by empirical mode decomposition, singular spectrum entropy obtained by singular spectrum decomposition, and power spectrum entropy obtained by energy distribution calculation.
Energy entropy combines information entropy with time-frequency domain analysis methods to indicate the complexity of signal energy. This study combines information entropy with empirical mode decomposition, a common method for processing nonlinear signals. The intrinsic mode function components of signals, obtained after empirical mode decomposition, contain energy information from different frequency bands. When the operating state of a WFDSM changes, the energy distribution of the IMF signals will also change. Therefore, signal energy entropy can be used to assess the operating state of a WFDSM.
Power spectrum entropy is the combination of energy distribution calculation and information entropy to express the uncertainty of signal energy under power spectrum division. When the power spectrum is concentrated in part of the frequency components, the number corresponding frequency spectrum lines is small, and the probability of the components is also small, resulting in a smaller value of the power spectrum entropy. Therefore, the power spectrum entropy is a quantitative description of the complexity of signal energy distribution of the frequency domain to complement the current frequency domain features.
Singular spectrum entropy combines entropy and singular spectrum analysis through a dynamic analysis method, which can realize a quantitative description of the signal in the time domain. Since SVD noise reduction has been performed on the vibration signal, singular spectrum entropy is not calculated for the vibration data. Instead, it is used to complement the time-domain features of the current. Table 4 summarizes the entropic features of the current, including energy entropy, power spectrum entropy, and singular spectrum entropy.
The current entropy domain features are recorded as A3, and then the composition of the set is as follows:
3.2.4 Feature summary
The different domain features of the current signal and the time domain features of the vibration signal are summarized thus:
A total of 24 dimensional mixed domain features are extracted.
4 Improved XGBoost diagnosis method based on genetic algorithm optimization
4.1 Improved XGBoost fundamentals
The mixed domain feature set consists of a large amount of data. As an integrated machine learning algorithm based on decision tree, XGBoost has the advantages of high classification accuracy and intuitiveness in the prediction of structural data, while, as a non-deterministic naturalistic algorithm, the genetic algorithm (GA) has a positive global optimization ability. Therefore, GA-improved XGBoost (GA-XGBoost) can diagnose a large amount of data and optimize the hyperparameters for mixed-domain feature sets efficiently.
XGBoost is a parallel regression tree model combined with boosting algorithm. Compared with the gradient-boosted decision tree, it adds the idea of regularization to the loss function in order to prevent overfitting. To ensure accuracy, XGBoost performs second-order Taylor expansion on the loss function, thus breaking the limits on accuracy and speed. The objective function of XGBoost can be expressed as follows:
where the loss function
4.1.1 Genetic algorithm optimization
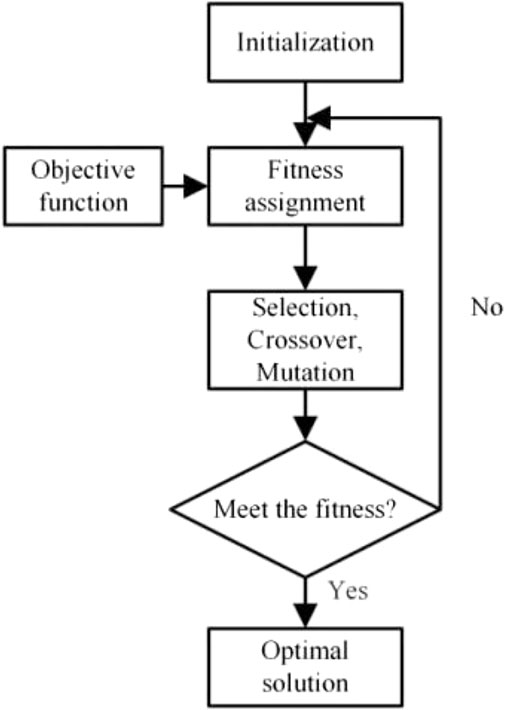
GA is a model of biological evolution that simulates the mechanisms of natural selection and genetics of Darwinian biological evolution [22–23]. It is an adaptive method used in parameter and network optimization. GA is applied to the XGBoost model to make up for its global search ability and prevent the local optima. The main steps of GA model establishment are shown in Figure 8.
1. Parameter initialization: determination of chromosome coding, population size, crossover probabilities, variation probabilities, etc.
2. Population initialization: randomly generate the first-generation population.
3. Fitness assignment: calculate the fitness function to determine the precision and the length of chromosome coding.
4. Population iteration: perform selection, crossover, and mutation operations on the population to obtain the next-generation population.
5. Result evaluation: if the fitness function is met, stop and output the result; otherwise, continue to repeat step 4 until the condition is met.
In this paper, GA is adopted to optimize the hyperparameters of the model. The superior global search ability of the GA can compensate for the weakness of XGboost, which can easily fall into local optimum when multi-features are used. At the same time, the preliminary screening of features can also help XGboost quickly converge.
4.1.2 Feature validation
GA performs an initial screening of features, while XGBoost uses the initially screened features for fault diagnosis and scores the features.
In order to demonstrate the effectiveness of feature selection, the different sets of selected features obtained from multiple independent experiments are counted and ranked on the basis of the usage frequency. According to the importance of features, each feature is gradually added to the XGBoost model for training, obtaining each diagnosis accuracy.
Since the testing and training sets are randomly divided, independent experiments can be achieved by changing the seed number.
4.2 Diagnosis process based on GA-XGBoost
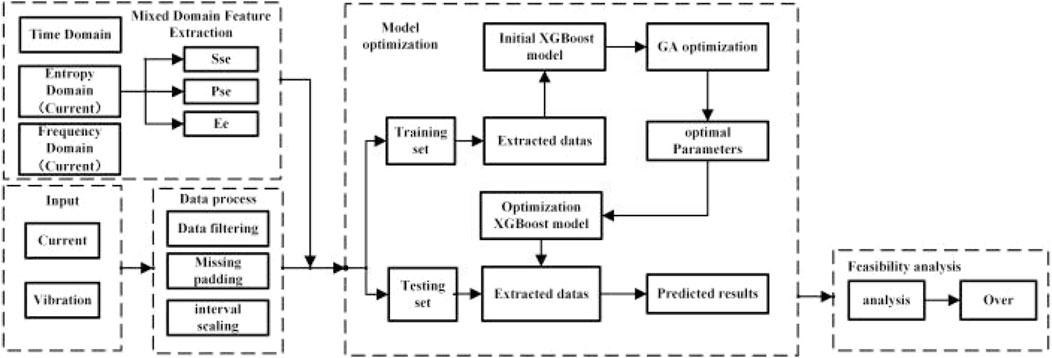
The flowchart of the GA-XGBoost diagnosis method is shown in Figure 9.
1. Data processing: pre-process on the input current and vibration signals, including data filtering, missing value filling, interval scaling, noise reduction, and other components.
2. Mixed domain feature extraction: construct a data matrix for the pre-processed data, extract feature sets A1, A2, A3, and B1 from signal, and divide the constructed matrix into a training and a test set.
3. Model optimization: the GA is used to iteratively optimize the hyperparameters of XGBoost. The feature importance of the mixed domain features is ranked by multiple independent repetitions of the experiment, and the number of input feature dimensions is gradually increased to verify the validity of multi-source mixed domain features.
4. Feasibility analysis: The feasibility of the feature fusion method is analyzed and the impact of noise in extreme environments on the detection method mentioned is also analyzed.
5 Experimental validation analysis
5.1 Improved XGBoost fundamentals
The data of the experimental platform are collected from the actual 8–10 WFDSM motor. The experimental environment is Anaconda and MATLAB 2021a, the version of Python is 3.9.1, and the libraries used include Sklearn, XGBoost, Pandas, and Numpy. Data processing and model optimization are implemented in the above environment.
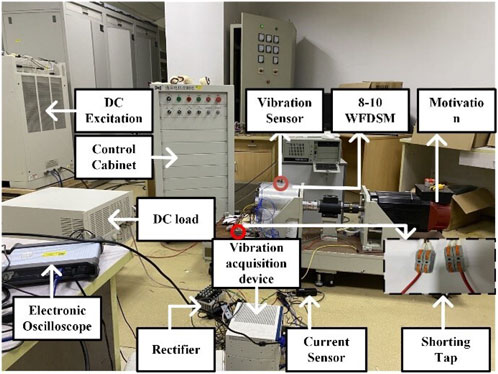
The experimental platform is shown in Figure 10. The data sampled are the four-phase current signals and vibration signals of the 8–10 WFDSM under different operating conditions. The four-phase armature currents are obtained by a current transformer at the sampling frequency of 50 kHz. The vibration signals are obtained by acceleration sensors installed on different positions and directions. The acceleration sensors are used to collect the motor vibration amplitude, which is converted into the voltage signal. The frequency of the vibration signal is 12 kHz.
In order to simulate different types of conditions, the speeds are 800, 1000, and 1200 rpm, and the loads are 0.5, 1, and 5
The current is collected for 5 s for each operating condition, from which 75 periods are extracted for diagnosis. Each period of the current and corresponding vibration signals is used to calculate time and frequency domain features. Since the current data contain four phases, this results in 300 sets of data for each working condition, along with the corresponding vibration signals. Finally, the training and test sets are divided on a random 4:1 basis.
5.2 Experimental data validation
5.2.1 Verification of effectiveness of fault diagnosis for mixed domain features
In order to test the validity and advancement of the proposed method, a comparison with a single domain feature set is performed.
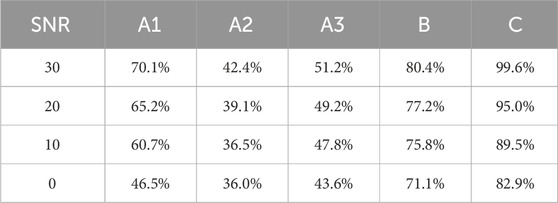
It is difficult for WFDSM to ignore the interference of extra noise in extreme conditions, which makes the vibration signal easy to distort. In order to test the accuracy of the method in extreme conditions, different degrees of white noise between 0 and 30 are added. The diagnostic accuracy is obtained as per Table 5, and the effect of using mixed-domain features is much better than using single-domain features. When SNR is 30 dB, the accuracies of time domain, frequency domain, and signal entropy of current signal are 70.1%, 42.4%, and 51.2%, and even the vibration time domain is 80.4%. In contrast, the accuracy of the mixed-domain feature reaches almost 100%, reflecting the superiority of the multi-source mixed-domain feature. With the addition of noise, the accuracy of each domain decreases, and only the mixed domain can still maintain above 95% when the signal-to-noise ratio is greater than 20 dB. Even in extreme conditions, this method performs better than the others and has better resistance to interference. In summary, the fault diagnosis method based on mixed domain features has better anti-interference ability whose features are almost not hidden by noise, and its generalizability is better.
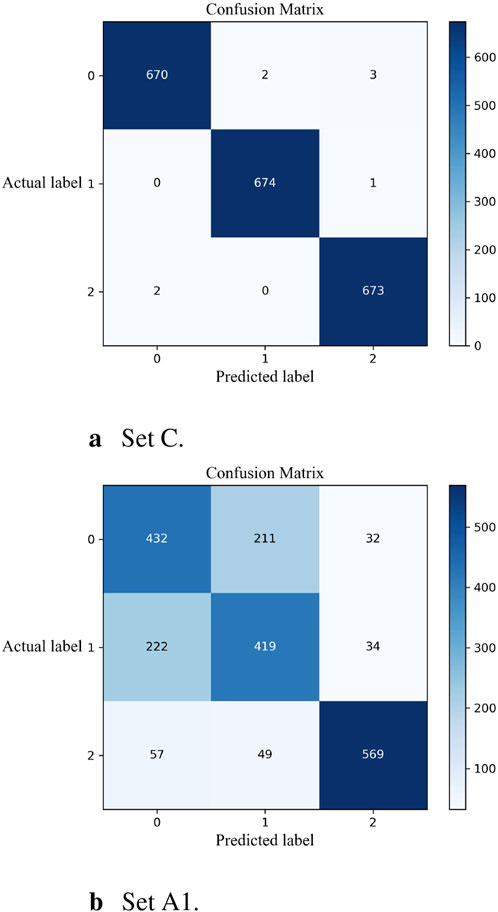
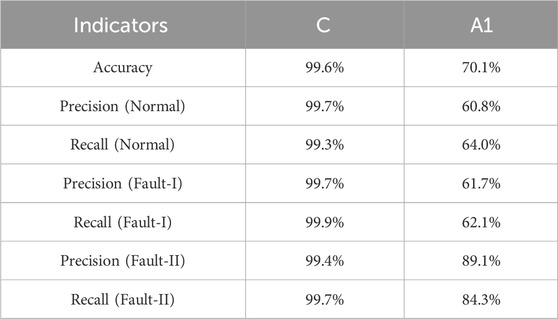
Taking SNR = 30 db as an example, Figure 11 shows the confusion matrices for the mixed-domain feature set C and the current time-domain feature set A1, respectively. The prediction performance index of each model is solved according to the confusion matrix. As can be seen from Table 6, all indicators of mixed domain fault diagnosis have been greatly improved compared with single signal. The precision rate is used to reflect the degree of misreporting while the recall rate reflects the degree of underreporting. In depth for these two indicators, it can be found that mixed domain features perform better in both Fault I failures and normal conditions. However, the precision and recall rate of the single current signal for Fault II can also reach 80%. Therefore, it can be shown that the with the single-current feature, it is easy to confuse the normal situation with Fault I, and that the addition of the vibration feature can reduce this probability.
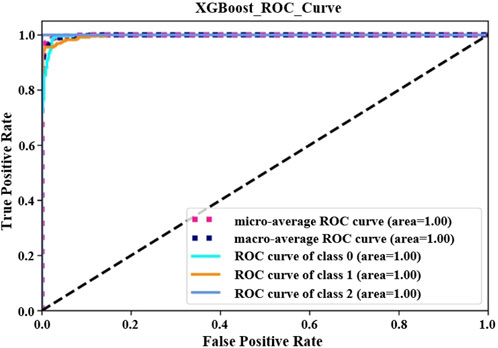
Figure 12 shows the receiver operating characteristic (ROC) curve of the model. This curve is plotted with a true positive rate on the vertical axis and false positive rate on the horizontal axis. The space enclosed between the curve and the coordinate axes is referred to as the area under the ROC curve, indicating the classification performance of the model. From Figure 14, it is evident that the area under the ROC curve can reach 100%, demonstrating excellent classification performance and significant practical value.
5.2.2 Verification of effectiveness of fault diagnosis for GA optimization
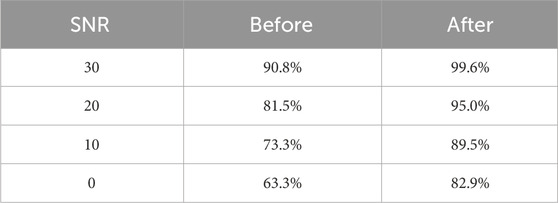
A comparison of the XGBoost model before and after GA optimization of different SNRs is shown in Table 7. The results show that the accuracy of the GA-optimized models has significantly improved: the lower the SNR, the higher the accuracy improvement. The prediction ability of the model has been greatly improved, indicating that the GA can effectively optimize the model hyperparameters.
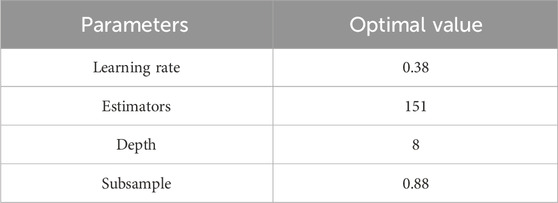
The hyperparameters of the XGBoost model significantly impact its training effect, so the hyperparameters are optimized using GA after the pre-training. GA parameters are set as follows: real coding; the population is 40; the fitness function is the diagnostic accuracy of model. The accuracy variation and iterative convergence curves of the 30 db model are shown in Figure 13. It can be seen from the figure that the accuracy increases rapidly in the early stage of iteration and then increases slowly. After reaching 99%, accuracy gradually reaches convergence at approximately 20 generations. Compared with the initial model, diagnostic accuracy has improved by 8.8%. The optimal parameters of the XGBoost model are shown in Table 8.
5.2.3 The SVM comparison
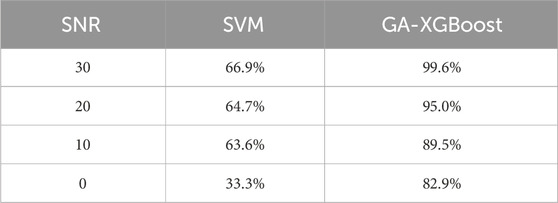
SVM is the most commonly used method in fault diagnosis. To directly compare it with the performance of GA-XGBoost, data from different SNRs are diagnosed using SVM. The findings are presented in Table 9. This table shows that GA-XGBoost significantly outperforms SVM at any SNR level. When the SNR is 0, SVM becomes overfitted, whereas GA-XGBoost still maintains high accuracy, demonstrating the model’s superior anti-interference capabilities.
5.2.4 Feature validation
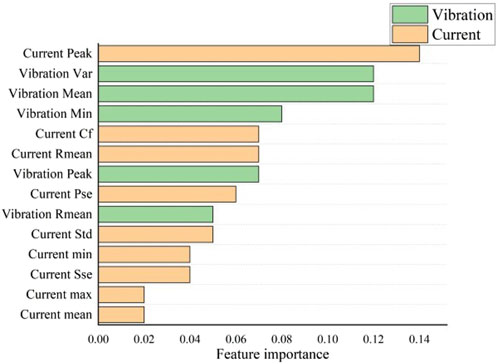
Taking SNR = 30 dB as an example, Figure 14 shows the scores of each feature of multi-source mixed domain (due to limited space, only the scores above 0.02 were selected). It can be seen that the 14-dimensional features selected include current peak, vibration var, and vibration mean. It can be determined that the features with high ratings belong to different domains, which proves the effectiveness of multi-source mixed domain. Second, the seven-dimensional features with the highest score come from the time domain of the two types of signal, which also shows that the time domain features of the two signals are of great significance for the model.
Because a single experiment may be contingent, ten independent experiments were performed. In order to avoid serendipity, features adopted less than three times were removed. The numbers of feature adoptions are shown in Table 10.
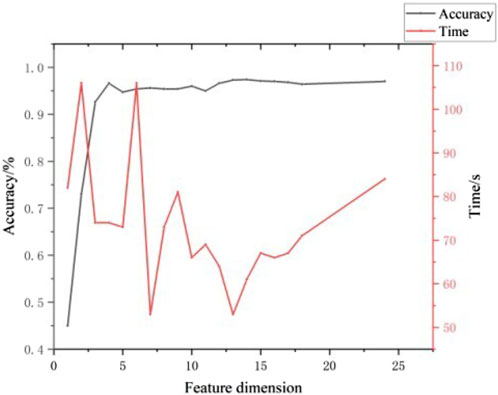
To demonstrate the effectiveness of feature selection, the XGBoost model was tested by gradually increasing the dimensions of the features according to their importance. In order to simulate the actual situation, only 2700 sets of data were selected for testing, which sacrificed the integrity of the data but optimized the duration. The accuracy and time for each output are shown in Figure 15. As can be seen from the figure, even when reducing a large number of features, accuracy can be maintained at more than 95% with more than five-dimensional features. The model’s accuracy reaches a stable value of 97% with 13-dimensional features, while the training time is 53 s. It can be seen that the efficiency is significantly improved while model performance is guaranteed.
6 Conclusion
For the feature extraction and intelligent diagnosis in WFDSM fault diagnosis, an intelligent diagnosis method based on multi-signal feature fusion and GA-XGBoost is proposed. We also found different signal fault features which provide new ideas for WFDSM fault detection. By analyzing the fault, collecting, extracting, and classifying the data of different working conditions, the following conclusions have been reached.
1. The magnetic field of WFDSM will be distorted with additional
2. Compared with the single domain, mixed-domain features have significantly improved accuracy and anti-interference ability; thus, the multi-source mixed-domain model is effective for diagnosis. Moreover, this method still has higher accuracy and stronger anti-interference ability in extreme conditions.
3. Compared with other methods like SVM, the proposed method not only improves the accuracy of fault diagnosis but can also identify optimal features.
The proposed intelligent diagnosis method based on multi-signal feature fusion and GA-XGBoost has demonstrated promising improvements in the accuracy and robustness of WFDSM fault detection. However, there are several potential directions for future research. One possibility is to explore additional data sources, such as thermal or acoustic signals, to further enhance diagnostic accuracy. Furthermore, integrating deep learning techniques, such as convolutional neural networks or recurrent neural networks, could improve feature extraction and fault classification capabilities.
Data availability statement
The datasets presented in this article are not readily available because the data utilized in this study are derived from experiments conducted as part of the research project. Requests to access the datasets should be directed tobmloYW96aGFveWFvQDE2My5jb20=.
Author contributions
RC: project administration, supervision, and writing–original draft. CS: supervision, validation, and writing–review and editing. TS: data curation, formal analysis, and writing–review and editing. YZ: conceptualization, project administration, and writing–review and editing.
Funding
The authors declare that financial support was received for the research, authorship, and/or publication of this article. This work was supported in part by a technological project of the State Grid Corporation of China, with project identification number 52094022001G.
Conflict of interest
Author RC was employed by State Grid Shanghai Municipal Electric Power Company. Author CS was employed by State Grid Hangzhou Power Supply Company.
The remaining authors declare that the research was conducted in the absence of any commercial or financial relationships that could be construed as a potential conflict of interest.
Publisher’s note
All claims expressed in this article are solely those of the authors and do not necessarily represent those of their affiliated organizations, or those of the publisher, the editors, and the reviewers. Any product that may be evaluated in this article, or claim that may be made by its manufacturer, is not guaranteed or endorsed by the publisher.
References
Bebars, A. D., Eladl, A. A., Abdulsalam, G. M., and Badran, E. A. (2022). Internal electrical fault detection techniques in dfig-based wind turbines: a review. Prot. Control Mod. Power Syst. 7, 18–22. doi:10.1186/s41601-022-00236-z
Chen, H., Fang, C., Dong, J., Lu, S., Pires, V., Martins, J., et al. (2022). Diagnosis of inter-turn short-circuit of srm based on ratio of current components. IEEE Trans. Transp. Electrification 9, 3319–3327. doi:10.1109/tte.2022.3224596
Chen, H., Fang, C., Guan, G., and Parspour, N. (2021). Fault diagnosis for power converter in srm drives based on current prediction. IEEE Trans. Industrial Electron. 69, 13576–13585. doi:10.1109/tie.2021.3137607
Chen, X., Zhang, Z., Yu, L., and Bian, Z. (2020). An improved direct instantaneous torque control of doubly salient electromagnetic machine for torque ripple reduction. IEEE Trans. Industrial Electron. 68, 6481–6492. doi:10.1109/tie.2020.3003596
Fang, C., Chen, H., Torkaman, H., Anuchin, A., and Li, X. (2021). Fault diagnosis for power transistors in a converter of switched reluctance motors based on current features. IEEE Sensors J. 22, 1414–1423. doi:10.1109/jsen.2021.3128487
Gong, W., Wang, Y., Zhang, M., Mihankhah, E., Chen, H., and Wang, D. (2021). A fast anomaly diagnosis approach based on modified cnn and multisensor data fusion. IEEE Trans. Industrial Electron. 69, 13636–13646. doi:10.1109/tie.2021.3135520
Guillén, C. E. G., de Porras Cosano, A. M., Tian, P., Diaz, J. C., Zarzo, A., and Platero, C. A. (2022). Synchronous machines field winding turn-to-turn fault severity estimation through machine learning regression algorithms. IEEE Trans. Energy Convers. 37, 2227–2235. doi:10.1109/TEC.2022.3159772
Han, G., and Zhu, B. (2021). Virtual current coefficients based power transistors fault diagnosis for small power ev-srm drives. IEEE Trans. Transp. Electrification 7, 2881–2891. doi:10.1109/tte.2021.3082146
Hang, J., Zhang, J., Xia, M., Ding, S., and Hua, W. (2019). Interturn fault diagnosis for model-predictive-controlled-pmsm based on cost function and wavelet transform. IEEE Trans. Power Electron. 35, 6405–6418. doi:10.1109/tpel.2019.2953269
Irhoumah, M., Pusca, R., Lefevre, E., Mercier, D., Romary, R., and Demian, C. (2017). Information fusion with belief functions for detection of interturn short-circuit faults in electrical machines using external flux sensors. IEEE Trans. Industrial Electron. 65, 2642–2652. doi:10.1109/tie.2017.2745408
Namdar, A. (2022). A robust principal component analysis-based approach for detection of a stator inter-turn fault in induction motors. Prot. Control Mod. Power Syst. 7, 48–24. doi:10.1186/s41601-022-00269-4
Shih, K.-J., Hsieh, M.-F., Chen, B.-J., and Huang, S.-F. (2022). Machine learning for inter-turn short-circuit fault diagnosis in permanent magnet synchronous motors. IEEE Trans. Magnetics 58, 1–7. doi:10.1109/tmag.2022.3169173
Skowron, M., Orlowska-Kowalska, T., and Kowalski, C. T. (2022). Detection of permanent magnet damage of pmsm drive based on direct analysis of the stator phase currents using convolutional neural network. IEEE Trans. Industrial Electron. 69, 13665–13675. doi:10.1109/tie.2022.3146557
Song, J., Zhao, J., Dong, F., Zhao, J., Xu, L., and Yao, Z. (2019). A new demagnetization fault recognition and classification method for dpmslm. IEEE Trans. Industrial Inf. 16, 1559–1570. doi:10.1109/tii.2019.2928008
Song, X., Zhao, J., Song, J., Dong, F., Xu, L., and Zhao, J. (2020). Local demagnetization fault recognition of permanent magnet synchronous linear motor based on s-transform and pso–lssvm. IEEE Trans. Power Electron. 35, 7816–7825. doi:10.1109/tpel.2020.2967053
Sun, M., Wang, H., Liu, P., Long, Z., Yang, J., and Huang, S. (2022). A novel data-driven mechanical fault diagnosis method for induction motors using stator current signals. IEEE Trans. Transp. Electrification 9, 347–358. doi:10.1109/tte.2022.3163612
Tang, Y., Zhang, X., Huang, S., Qin, G., He, Y., Qu, Y., et al. (2022). Multisensor-driven motor fault diagnosis method based on visual features. IEEE Trans. Industrial Inf. 19, 5902–5914. doi:10.1109/tii.2022.3201011
Wang, X., Lu, S., Chen, K., Wang, Q., and Zhang, S. (2021). Bearing fault diagnosis of switched reluctance motor in electric vehicle powertrain via multisensor data fusion. IEEE Trans. Industrial Inf. 18, 2452–2464. doi:10.1109/tii.2021.3095086
Wang, X., Wang, Z., Xu, Z., He, J., and Zhao, W. (2019). Diagnosis and tolerance of common electrical faults in t-type three-level inverters fed dual three-phase pmsm drives. IEEE Trans. Power Electron. 35, 1753–1769. doi:10.1109/tpel.2019.2920400
Zhang, L., Zhang, H., and Cai, G. (2022a). The multiclass fault diagnosis of wind turbine bearing based on multisource signal fusion and deep learning generative model. IEEE Trans. Instrum. Meas. 71, 1–12. doi:10.1109/tim.2022.3178483
Zhang, P., Li, K., Yu, S., and Yu, D. (2021). A novel fault diagnosis technique of interturn short-circuit fault for srm in current chopper mode. IEEE Trans. Industrial Electron. 69, 3037–3046. doi:10.1109/tie.2021.3066917
Zhang, T., Wei, J., Liu, P., Tao, W., and Zhou, B. (2018). An integrated motor-drive and battery-charging system based on split-field-winding doubly salient electromagnetic machine. IEEE Trans. Magnetics 54, 1–6. doi:10.1109/tmag.2018.2853630
Zhang, Y., Liu, G., Zhao, W., Zhou, H., Chen, Q., and Wei, M. (2020). Online diagnosis of slight interturn short-circuit fault for a low-speed permanent magnet synchronous motor. IEEE Trans. Transp. Electrification 7, 104–113. doi:10.1109/tte.2020.2991271
Zhang, Y., Mao, Y., Wang, X., Wang, Z., Xiao, D., and Fang, G. (2022b). Current prediction-based fast diagnosis of electrical faults in pmsm drives. IEEE Trans. Transp. Electrification 8, 4622–4632. doi:10.1109/tte.2022.3195225
Zhao, Y., Teng, D., Li, D., and Zhao, X. (2021). Comparative research on four-phase dual armature-winding wound-field doubly salient generator with distributed field magnetomotive forces for high-reliability application. IEEE Access 9, 12579–12591. doi:10.1109/access.2021.3051310
Keywords: Wound-field doubly salient machine, fault diagnosis, extreme conditions, signal fusion, XGBoost
Citation: Chen R, Shen C, Sheng T and Zhao Y (2024) Inter-turn short-circuit diagnosis of wound-field doubly salient machine using multi-signal fusion and GA-XGBoost. Front. Sig. Proc. 4:1433831. doi: 10.3389/frsip.2024.1433831
Received: 16 May 2024; Accepted: 29 November 2024;
Published: 20 December 2024.
Edited by:
Arun Kumar Tangirala, Indian Institute of Technology Madras, IndiaReviewed by:
Kenneth E. Okedu, Melbourne Institute of Technology, AustraliaSaadane Rachid, École Hassania des Travaux Publics, Morocco
Copyright © 2024 Chen, Shen, Sheng and Zhao. This is an open-access article distributed under the terms of the Creative Commons Attribution License (CC BY). The use, distribution or reproduction in other forums is permitted, provided the original author(s) and the copyright owner(s) are credited and that the original publication in this journal is cited, in accordance with accepted academic practice. No use, distribution or reproduction is permitted which does not comply with these terms.
*Correspondence: Yao Zhao, bmloYW96aGFveWFvQDE2My5jb20=
 Ran Chen
 Chong Shen2
 Tianming Sheng