- Information Technologies Institute (ITI), Centre for Research and Technology, Hellas (CERTH), Thessaloniki, Greece
In this paper, we propose an integrated framework for multi-granular explanation of video summarization. This framework integrates methods for producing explanations both at the fragment level (indicating which video fragments influenced the most the decisions of the summarizer) and the more fine-grained visual object level (highlighting which visual objects were the most influential for the summarizer). To build this framework, we extend our previous work on this field, by investigating the use of a model-agnostic, perturbation-based approach for fragment-level explanation of the video summarization results, and introducing a new method that combines the results of video panoptic segmentation with an adaptation of a perturbation-based explanation approach to produce object-level explanations. The performance of the developed framework is evaluated using a state-of-the-art summarization method and two datasets for benchmarking video summarization. The findings of the conducted quantitative and qualitative evaluations demonstrate the ability of our framework to spot the most and least influential fragments and visual objects of the video for the summarizer, and to provide a comprehensive set of visual-based explanations about the output of the summarization process.
1 Introduction
The current practice in the Media industry for producing a video summary requires a professional video editor to watch the entire content and decide about the parts of it that should be included in the summary. This is a laborious task and can be very time-consuming in the case of long videos or when different summaries of the same video should be prepared for distribution via multiple video sharing platforms (e.g., YouTube, Vimeo, TikTok) and social networks (e.g., Facebook, Twitter, Instagram) with different specifications about the optimal or maximum video duration (Apostolidis et al., 2024). Video summarization technologies aim to generate a short summary by selecting the most informative and important frames (key-frames) or fragments (key-fragments) of the full-length video, and presenting them in temporally-ordered fashion. The use of such technologies by Media organizations can drastically reduce the needed resources for video summarization in terms of both time and human effort, and facilitate indexing, browsing, retrieval and promotion of their media assets (Apostolidis et al., 2025). Despite the recent advances in the field of video summarization, which are tightly associated with the emergence of modern deep learning network architectures (Apostolidis et al., 2021b), the outcome of a video summarization method still needs to be curated by a video editor, to make sure that all the necessary parts of the video were included in the summary. This content production step could be further facilitated if the video editor is provided with explanations about the suggestions made by the used video summarization technology. The provision of such explanations would allow a level of understanding about the functionality of this technology, thus increasing the editor’s trust in it and facilitating content curation.
Over the last years there is an increasing interest in explaining the outcomes of deep networks processing video data. Nevertheless, most works are related with network architectures for video classification (Bargal et al., 2018; Mänttäri et al., 2020; Li Z. et al., 2021), action classification and reasoning (Stergiou et al., 2019; Zhuo et al., 2019; Han et al, 2022), activity recognition (Aakur et al., 2018; Roy et al., 2019) and anomaly detection (Wu et al., 2022; Singh et al., 2023; Guo et al., 2022; Szymanowicz et al., 2022; Hinami et al., 2017). With respect to explainable video summarization, a first attempt to formulate the task and evaluate various attention-based explanation signals was initially reported in Apostolidis et al. (2022a) and extended in Apostolidis et al. (2023). Another approach that relies on the use of causality graphs between input data, output scores, summarization criteria and data perturbations, was presented in Huang et al. (2023). However, the produced graphs require interpretation by a human expert, while the performance of these explanations was not evaluated through quantitative or qualitative analysis.
In this paper, we build on our previous efforts on explainable video summarization (Apostolidis et al., 2022a; Apostolidis et al., 2023) and extend them, in order to: 1) investigate the use of a model-agnostic approach [adaptation of the LIME method (Ribeiro et al., 2016)] for fragment-level explanation of the video summarization results, 2) develop a new method for producing more fine-grained explanations at the visual object level that provide more insights about the focus of the summarizer, and 3) build an integrated framework for multi-granular (and thus more informative) explanation of the video summarization results. Our contributions are the following:
• We investigate the use of a model-agnostic explanation method for fragment-level explanation of video summarization: We adapt the LIME method (Ribeiro et al., 2016) to operate on sequences of video frames (rather than on a single frame/image, which is the typical approach) and produce a fragment-level explanation of the video summarization results, which indicates the temporal fragments of the video that influenced the most the decisions of the summarizer.
• We introduce the generation of fine-grained object-level explanations for video summarization: We combine the state-of-the-art Video K-Net method for video panoptic segmentation (Li et al., 2022) with another adaptation of the LIME method (Ribeiro et al., 2016) that also operates on frame sequences, to build a method that performs object-oriented perturbations over a sequence of frames and produces explanations at the level of visual objects.
• We build an integrated framework for multi-granular explanation of video summarization: We integrate the methods for fragment- and object-level explanation into a framework for multi-granular explanation of video summarization, and assess their performance based on quantitative and qualitative evaluations using a state-of-the-art method [CA-SUM (Apostolidis et al., 2022b)] and two datasets for video summarization [SumMe (Gygli et al., 2014) and TVSum (Song et al., 2015)].
2 Related work
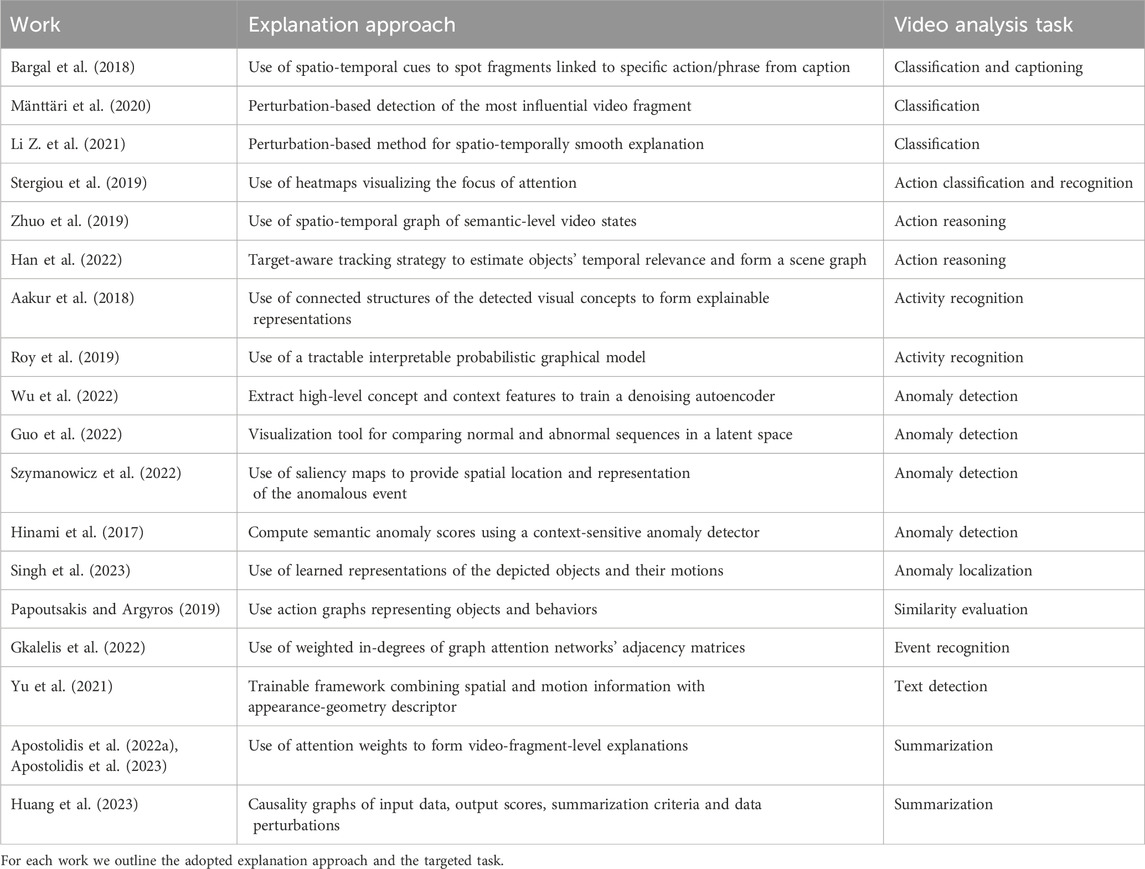
Over the last years there is a rapidly growing interest of researchers on building methods that provide explanations about the working mechanism or the decisions/predictions of neural networks. Nevertheless, in contrast to the notable progress in the fields of explainable pattern recognition (Bai et al., 2021), image classification (Gkartzonika et al., 2023; Ntrougkas et al., 2024), and NLP (Zini and Awad, 2022), currently there are only a few works on producing explanations for networks that process video data (listed in Table 1). Working with network architectures for video classification, Bargal et al. (2018) visualized the spatio-temporal cues contributing to the network’s classification/captioning output using internal representations and employed these cues to localize video fragments corresponding to a specific action or phrase from the caption. Mänttäri et al. (2020) utilized the concept of meaningful perturbation to spot the video fragment with the greatest impact on the video classification results. Li Z. et al. (2021) extended a generic perturbation-based explanation method for video classification networks by introducing a loss function that constraints the smoothness of explanations in both spatial and temporal dimensions. Focusing on methods for action classification and reasoning, Stergiou et al. (2019) proposed the use of cylindrical heat-maps to visualize the focus of attention at a frame basis and form explanations of deep networks for action classification and recognition. Zhuo et al. (2019) defined a spatio-temporal graph of semantic-level video states (representing associated objects, attributes and relationships) and applied state transition analysis for video action reasoning. Han et al. (2022) presented a one-shot target-aware tracking strategy to estimate the relevance between objects across the temporal dimension and form a scene graph for each frame, and used the generated video graph (after applying a smoothing mechanism) for explainable action reasoning. Dealing with networks for video activity recognition, Aakur et al. (2018) formulated connected structures of the detected visual concepts in the video (e.g., objects and actions) and utilized these structures to produce semantically coherent and explainable representations for video activity interpretation, while Roy et al. (2019) fed the output of a model for activity recognition to a tractable interpretable probabilistic graphical model and performed joint learning over the two. In the field of video anomaly detection, Wu et al. (2022) extracted high-level concept and context features for training a denoising autoencoder that was used for explaining the output of anomaly detection in surveillance videos. Guo et al. (2022) constructed a sequence-to-sequence model (based on a variational autoencoder) to detect anomalies in videos and combined it with a visualization tool that facilitates comparisons between normal and abnormal sequences in a latent space. Szymanowicz et al. (2022) designed an encoder-decoder architecture to detect anomalies, that is based on U-Net (Ronneberger et al., 2015), thereby generating saliency maps by computing per-pixel differences between actual and predicted frames. Based on the per-pixel squared errors in the saliency maps, Szymanowicz et al. introduced an explanation module that can provide spatial location and human-understandable representation of the identified anomalous event. Hinami et al. (2017) employed a Fast R-CNN-based model to learn multiple concepts in videos and extract semantic features, and applied a context-sensitive anomaly detector to obtain semantic anomaly scores which can be seen as explanations for anomalies. Singh et al. (2023) developed an explainable method for single-scene video anomaly localization, which uses learned representations of the depicted objects and their motions to provide justifications on why a part of the video was classified as normal or anomalous. Working with network architectures that tackle other video analysis and understanding tasks, Papoutsakis and Argyros (2019) presented an unsupervised method that evaluates the similarity of two videos based on action graphs representing the detected objects and their behavior, and provides explanations about the outcome of this evaluation. Gkalelis et al. (2022) used the weighted in-degrees of graph attention networks’ adjacency matrices to provide explanations of video event recognition, in terms of salient objects and frames. Yu et al. (2021) built an end-to-end trainable and interpretable framework for video text detection with online tracking that captures spatial and motion information and uses an appearance-geometry descriptor to generate robust representations of text instances. With respect to explainable video summarization, a first attempt was made in Apostolidis et al. (2022a), Apostolidis et al. (2023), where we formulated the task as the production of an explanation mask indicating the parts of the video that influenced the most the estimates of a video summarization network about the frames’ importance. In terms of implementation, we utilized a state-of-the-art network architecture [CA-SUM (Apostolidis et al., 2022b)] and two datasets for video summarization [SumMe (Gygli et al., 2014) and TVSum (Song et al., 2015)], and evaluated the performance of various attention-based explanation signals by investigating the network’s input-output relationship (according to different input replacement functions), and using a set of tailored evaluation measures. Following a different approach, Huang et al. (2023) described a method for explainable video summarization that leverages ideas from Bayesian probability and causation modeling. A form of explanation about the outputs of this method is provided through causality graphs that show relations between input data, output importance scores, summarization criteria (e.g., representativeness, interestingness) and applied perturbations. Finally, several works that deal with various video classification tasks have discussed the use of different types of visual representations [e.g., activation (Dhiman et al., 2024) or residue (Dhiman et al., 2021) maps] to get insights about the classification mechanism of the relevant model. Nevertheless, these representations were neither presented as explanation methods nor evaluated as such; thus, such works are out of the scope of this literature review.
Differently to most of the above discussed works that deal with the explanation of network architectures trained for various video analysis tasks (e.g., classification, action and activity recognition, anomaly detection), in this work, we focus on networks for video summarization. Contrary to the work of Huang et al. (2023), our framework produces visual-based explanations indicating the parts of the video (temporal video fragments and visual objects) that influenced the most the decisions of the summarizer, rather than providing causality graphs that need interpretation by a human expert. Moreover, the performance of our framework is assessed through a set of quantitative and qualitative evaluations. As stated in the introduction, our work builds on our previous efforts for explaining video summarization (Apostolidis et al., 2022a; Apostolidis et al., 2023) and extends them by: 1) examining the use of a model-agnostic approach for producing fragment-level explanations (rather than requiring access to the internal layers and weights of the summarization network), 2) proposing a novel methodology for producing object-level explanations (thus providing more clues about the content of the video that is more important for the summarizer), and 3) combining the different explanation approaches under an integrated framework that offers a multi-granular, and thus more comprehensive explanation for the output of the video summarization process.
3 Proposed approach
A high-level overview of the developed framework for multi-granular explainable video summarization is given in Figure 1. In the core of this framework there is an XAI method that gets as input the full-length video, the used summarizer and the produced video summary (formed by the three top-scoring video fragments by the summarizer). The XAI method can be either model-agnostic [LIME (Ribeiro et al., 2016)] or model-specific [attention-based (Apostolidis et al., 2022a)]; thus, our framework supports the explanation of summarization models that rely, e.g., on Generative Adversarial Networks (GANs) (Rochan and Wang, 2019; Apostolidis et al., 2021a) or structures of Recurrent Neural Networks (RNNs) (Zhao et al., 2018; Zhao et al., 2020), as well as on the use of attention mechanisms (Fajtl et al., 2019; Li P. et al., 2021; Apostolidis et al., 2022b). Our framework produces three different types of explanations: 1) a fragment-level explanation that indicates the temporal video fragments that influenced the most the decisions of the summarizer, 2) an object-level explanation that highlights the most influential visual objects within the aforementioned fragments, and 3) another object-level explanation that points out the visual objects within the fragments that have been selected for inclusion in the summary, that influenced the most this selection. More details about the processing steps and the employed XAI method for producing each type of explanation, are provided in the following sections.
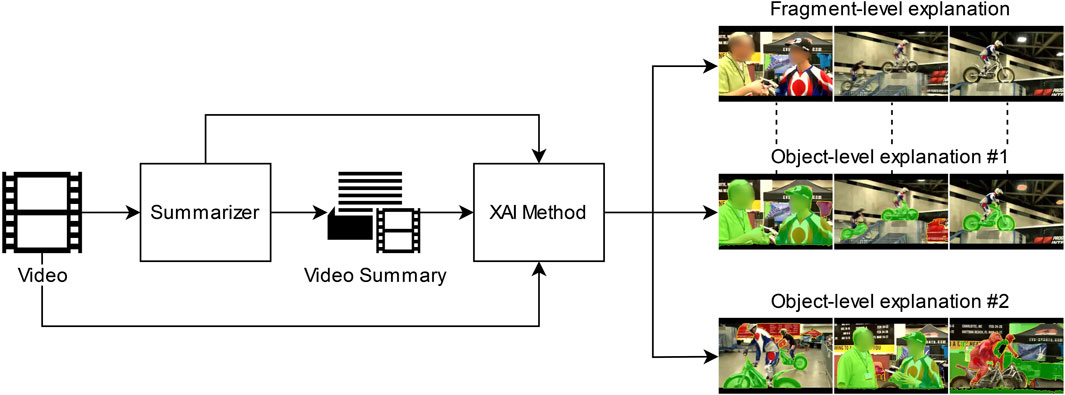
Figure 1. High-level overview of our framework for explaining video summarization. The XAI method can be either model-agnostic (LIME) or model-specific (attention-based). Based on the applied analysis, our framework produces: i) a fragment-level explanation indicating the most influential video fragments; ii) an object-level explanation (#1) highlighting the most influential objects within the most influential fragments; and iii) an object-level explanation (#2) highlighting the visual objects within the fragments that have been selected for inclusion in the summary, that influenced the most this selection.
3.1 Fragment-level explanation
The processing pipeline for producing fragment-level explanations is depicted in Figure 2. As shown, the input video is temporally fragmented into consecutive and non-overlapping fragments. To perform this process, we employ a pre-trained model of the TransNetV2 method for shot segmentation from Souček and Lokoč (2024). This method relies on a 3D-CNN network architecture with two prediction heads; one predicting the middle frame of a shot transition and another one predicting all transition frames and used during training to improve the network’s understanding of what constitutes a shot transition and how long it is. The used model has been trained using synthetically-created data from the TRECVID IACC.3 dataset (Awad et al., 2017) and the ground-truth data of the ClipShots dataset (Tang et al., 2019). If the number of video fragments is equal to one (thus, the input video is a single-shot user-generated video) or less than ten (thus, the selection of three fragments for building the summary would not lead to a significantly condensed synopsis of the video), we further fragment the input video using the method for sub-shot segmentation from Apostolidis et al. (2018). This method segments a video into visually coherent parts that correspond to individual video capturing activities (e.g., camera pan and tilt, change in focal length and camera displacement) by extracting and evaluating the region-level spatio-temporal distribution of the optical flow over sequences of neighbouring video frames. The defined video fragments based on the aforementioned methods, along with the input video, the summarizer and the produced video summary, are then given as input to the XAI method. This method can be either model-agnostic (i.e., it does not require any knowledge about the summarization model) or model-specific (i.e., it utilizes information from the internal layers of the model). In this work, we considered the LIME explanation method from Ribeiro et al. (2016) and the best-performing configuration of the attention-based explanation method from Apostolidis et al. (2022a), respectively.

Figure 2. The proposed processing pipeline for producing fragment-level explanations. The XAI method can be either model-agnostic (LIME) or model-specific (attention-based). The video is temporally fragmented into shots (using TransNetV2) or sub-shots (using motion data). The produced explanation indicates the most influential video fragments for the output of the summarizer.
LIME (Ribeiro et al., 2016) is a perturbation-based method that approximates the behavior of a model locally by generating a simpler, interpretable model. More specifically, LIME examines the predictions of the model for variations of the input data. For this, it generates a new dataset consisting of perturbed samples and the corresponding predictions of the original model. On this new dataset LIME then trains an interpretable model, which is weighted by the proximity of the sampled instances to the instance of interest. The learned model should be a good approximation of the original model’s predictions locally. Local surrogate models with interpretability constraint can be mathematically expressed as shown in Equation 1 (Ribeiro et al., 2016):
The explanation model for the sampled instance
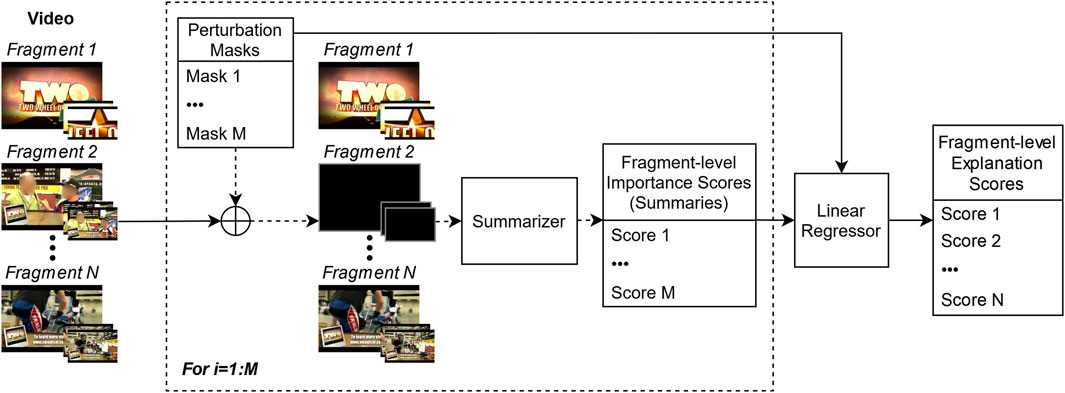
Figure 3. The applied method for producing fragment-level explanations using LIME. The part within the dashed bounding box is repeated for every perturbation.
The attention-based method of Apostolidis et al. (2022a) can be applied on network architectures for video summarization that estimate the frames’ importance with the help of an attention mechanism, such as the ones from Apostolidis et al. (2022b), Fajtl et al. (2019), Li P. et al. (2021). The typical processing pipeline of such networks is depicted in the upper part of Figure 4. For a video of
3.2 Object-level explanation
The processing pipeline for creating object-level explanations is shown in Figure 5. The selected video fragments for creating such explanations can be either the most influential ones according to the fragment-level explanation or the top-scoring ones by the summarizer that were selected for inclusion in the video summary. The utilized XAI method in this case is LIME (Ribeiro et al., 2016), and the goal is to apply perturbations at the visual object level in order to identify the objects within the selected fragments, that influence the most the output of the summarizer. Once again, we use an adaptation of the LIME method, that takes into account the applied spatial perturbations in the visual content of a sequence of video frames (and not on a single frame). To make sure that a perturbation is applied on the same visual object(s) across the frames of a video fragment, we spatially segment these frames using a model of the Video K-Net method for video panoptic segmentation (Li et al., 2022), trained on the VIP-Seg dataset (Miao et al., 2022). This method builds on the foundation of K-Net (Zhang et al., 2024), which unifies image segmentation through a collection of adaptable kernels. Video K-Net capitalizes on the kernels’ ability to encode object appearances and contextual information, combining segmentation and tracking of both semantically meaningful categories and to individual instances of countable objects across a sequence of video frames.
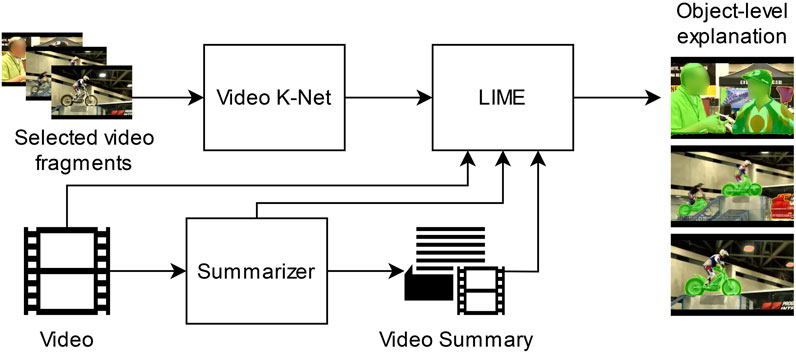
Figure 5. Processing pipeline for producing object-level explanations using Video K-Net (for panoptic segmentation) and LIME. The selected video fragments are the most influential according to the fragment-level explanation, or the top-scoring by the summarizer. The produced explanation indicates the most influential visual objects for the output of the summarizer.
As shown in Figure 6, the top-scoring frame (by the summarizer) within a selected video fragment (by the fragment-level explanation or the summarizer) is picked as the keyframe. Once all the frames of this fragment have been spatially segmented by Video K-Net, the appearing
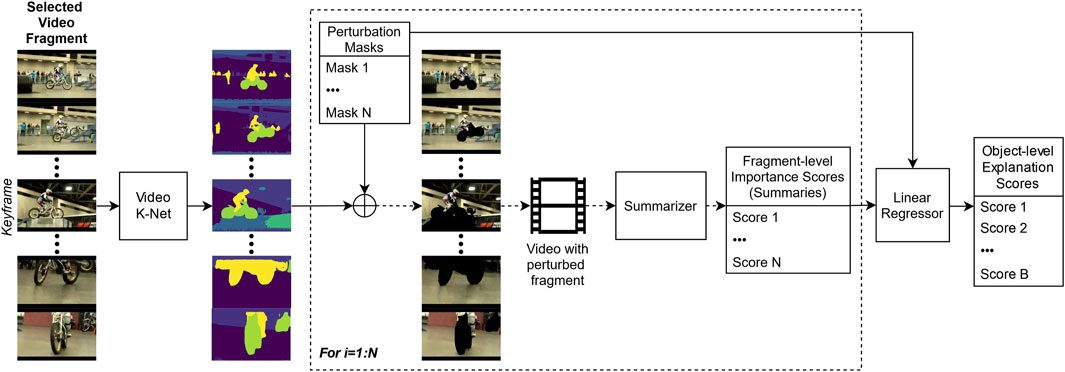
Figure 6. The applied method for producing object-level explanations using Video K-Net and LIME. The perturbations are performed on spatial regions of the video frames, that relate to the
4 Experiments
We evaluated our framework based on the used datasets and proposed evaluation protocol in Apostolidis et al. (2022a), Apostolidis et al. (2023), and compared the newly suggested LIME-based fragment-level explanations with the ones obtained using the attention-based method from the aforementioned works. Performance comparisons with the method of Huang et al. (2023) for explainable video summarization (discussed in Section 2) were not possible, as this method produces a different form of explanations (i.e., causality graphs) that need interpretation by a human expert and are not evaluated in a quantitative manner. In the following, we provide details about the utilized datasets and evaluation protocol for assessing the performance of the produced explanations. Then, we provide some implementation details and report the findings of the conducted quantitative and qualitative evaluations.
4.1 Datasets and evaluation protocol
In our experiments we employ the SumMe (Gygli et al., 2014) and TVSum (Song et al., 2015) datasets, which are the most widely used ones in the literature for video summarization (Apostolidis et al., 2021b). SumMe is composed of 25 videos up to 6 min long, with diverse video contents, captured from both first-person and third-person view. Each video has been annotated by 15–18 users in the form of key-fragments, and thus is associated to multiple fragment-level user summaries that have a length between
To measure the influence of a selected video fragment or visual object by an explanation method, we mask it out (using black frames or pixels, respectively) and compute the difference in the summarization model’s output, as
• Discoverability+ (Disc+) evaluates if the top-3 scoring fragments/objects by an explanation method have a significant influence to the model’s output. For a given video, it is calculated by computing
• Discoverability- (Disc-) evaluates if the bottom-3 scoring fragments/objects by an explanation method have small influence to the model’s output. For a given video, it is calculated by computing
• Sanity Violation (SV) quantifies the ability of explanations to correctly discriminate the most from the least influential video fragments or visual objects. It is calculated by counting the number of cases where the condition (Disc+
4.2 Implementation details
Videos are downsampled to 2 fps and deep feature representations of the frames are obtained by taking the output of the pool5 layer of GoogleNet (Szegedy et al., 2015), trained on ImageNet (Deng et al., 2009). The number of applied perturbations
4.3 Quantitative results
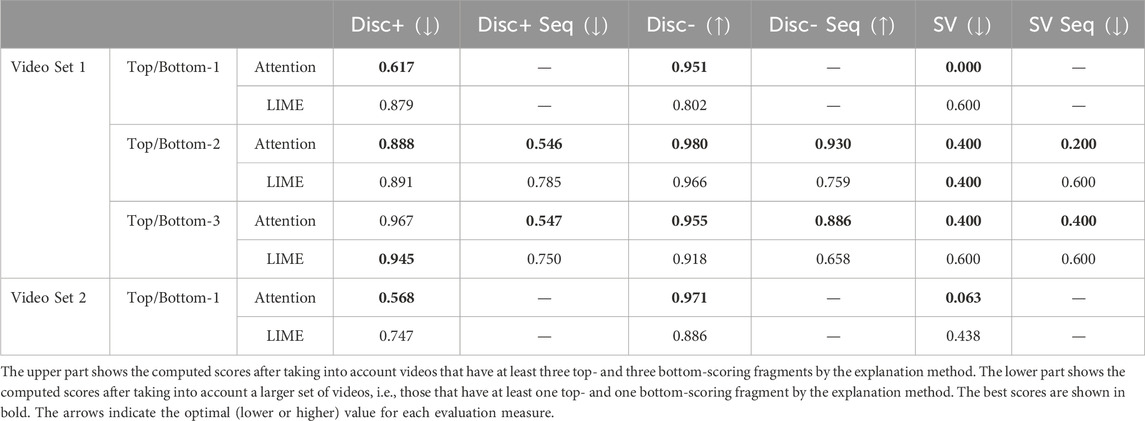
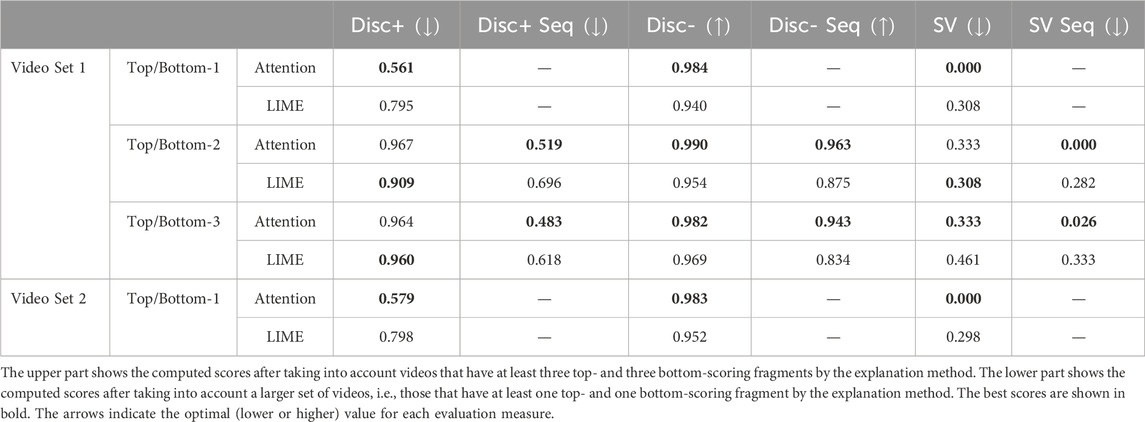
The results about the performance of the examined fragment-level explanation methods on the videos of the SumMe and TVSum datasets, are presented in Tables 2, 3, respectively. The upper part of these Tables reports the computed Disc+, Disc+ Seq, Disc-, Disc- Seq, SV and SV Seq scores, after taking into account videos that have at least three top- and three bottom-scoring fragments by the explanation method (Video Set 1). The lower part of these Tables reports the Disc+, Disc- and SV scores for a larger set of videos (Video Set 2), i.e., those that have at least one top- and one bottom-scoring fragment by the explanation method, computed based on the obtained
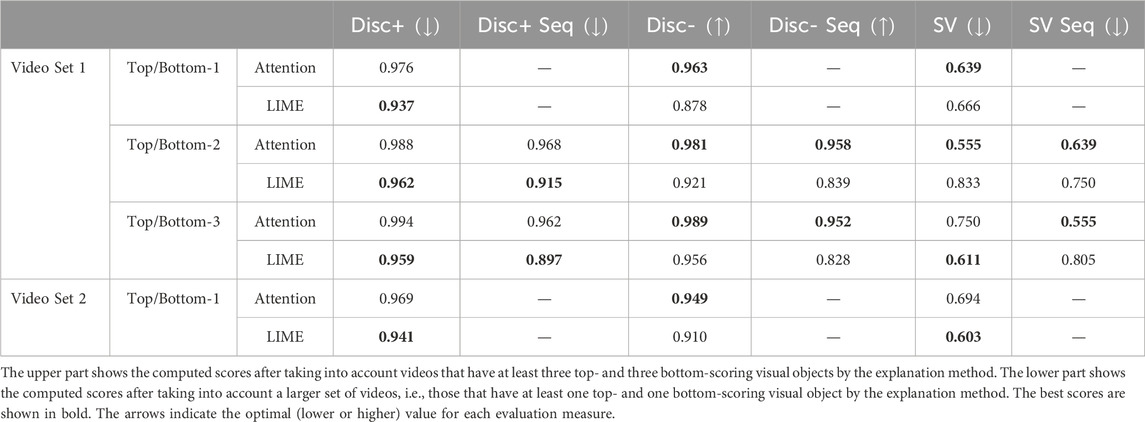
Table 4. Performance of the object-level explanation method on the SumMe dataset using the selected video fragments by the attention-based and LIME explanation methods.
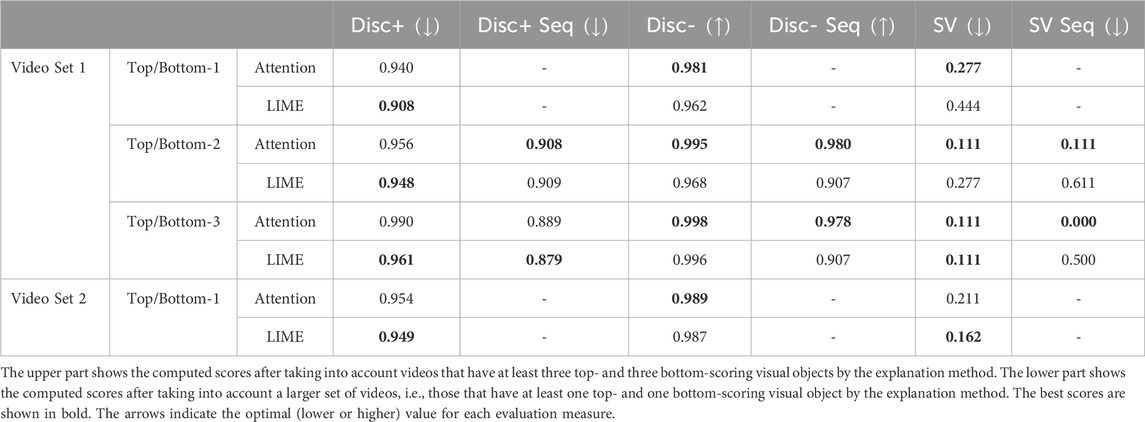
Table 5. Performance of the object-level explanation method on the TVSum dataset using the selected video fragments by the attention-based and LIME explanation methods.

Table 6. Performance of the object-level explanation method on the SumMe dataset using the selected video fragments by the summarization method.

Table 7. Performance of the object-level explanation method on the TVSum dataset using the selected video fragments by the summarization method.
To assess the competency of the examined fragment-level explanation methods to correctly rank the most and least influential video fragments on the summarization model’s output, we took into account the computed Disc+ and Disc- scores for the videos of the SumMe and TVSum datasets with at least three top- and three bottom-scoring fragments by the explanation method, after masking out these fragments, in a one-by-one and sequential manner. With respect to the top-scoring fragments, we anticipate a higher drop in Disc+ for the top-1 fragment (which should have the highest influence on the summarizer) and progressively lower drops for the top-2 and top-3 fragments, when masking out is performed in a one-by-one manner. Moreover, we expect to see a major drop in Disc+ Seq for the top-1 fragment and additional more minor drops for the remaining two top-scoring fragments, when masking out is performed in a sequential manner. With regards to the bottom-scoring fragments, we foresee a lower drop in Disc- for the bottom-1 fragment (which should have the lowest influence on the summarizer) and larger drops for the remaining two, when masking out is performed in a one-by-one manner. In addition, we expect to observe a minor drop in Disc- Seq for the bottom-1 fragment and additional more noticeable drops for the remaining two fragments, when masking out is performed in a sequential manner. The obtained scores for the videos of the SumMe and TVSum, presented in Figures 7, 8, respectively, show that both methods are able to correctly rank the most influential fragments, as in most cases they lead to Disc+ scores that are gradually increasing when moving from the top-1 to the top-3 scoring fragment (as expected). More specifically, the attention-based method seems to be more appropriate at spotting the fragment with the highest influence to the summarization model (as indicated by the significantly lower Disc+ value for the top-1), while its performance is comparable with the one of LIME when finding the second and third most influential fragment. Moreover, the effectiveness of both methods to rank the most influential fragments is also illustrated by the observed values when masking out these fragments in a sequential manner. The inclusion of additional fragments in the explanation leads to lower Disc+ values (as expected), while the impact of the second and third top-scoring fragments is quantifiable but clearly smaller than the one of the top-1 scoring fragment. Overall, the attention-based explanation method performs better on both datasets, as it leads to significantly lower Disc+ scores compared to LIME (especially on the SumMe dataset). With respect to video fragments that influence the least the output of the summarization model, both methods seem to be less effective at spotting them. The obtained Disc- scores show that, in most cases, the bottom-scoring fragment has a higher impact on the summarization model, compared to the impact of the second and third bottom-scoring fragment (contrary to the expected behavior). Nevertheless, this weakness is less pronounced for the attention-based method, as the produced explanations lead to similar Disc- scores for the bottom-1, bottom-2 and bottom-3 fragment on both datasets. On the contrary, the LIME method indicates a fragment with clearly higher impact than the other two, as the least influential one (especially on the SumMe dataset). The competitiveness of the attention-based method is also highlighted by the generally higher Disc- scores compared to LIME, after masking out more than one of the least influential video fragments (i.e., sequentially) on the videos of both datasets. “Disc- Seq” scores around 0.9 even after masking out even three fragments of the video, point out the competency of this method to spot fragments with very small influence on the output of the summarization model.
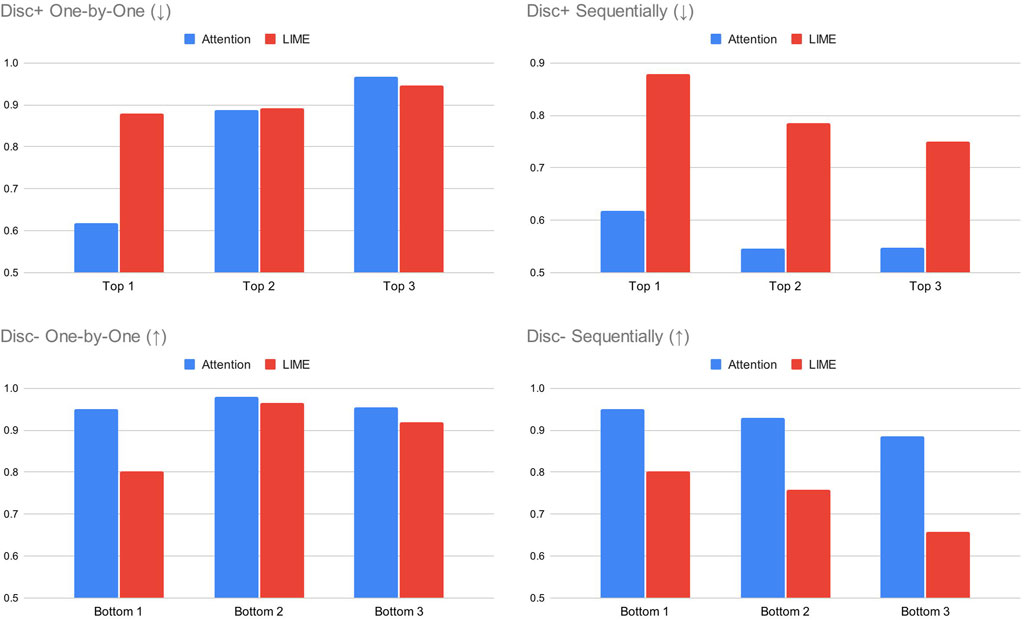
Figure 7. The computed Disc+ and Disc- scores for the examined fragment-level explanation methods on the videos on the SumMe dataset, after masking out the three top- and bottom-scoring fragments in a one-by-one and sequential manner. We anticipate a higher/lower drop in Disc ± for the top/bottom-1 scoring fragment, and lower/higher drops in Disc ± for the remaining top/bottom-scoring fragments.
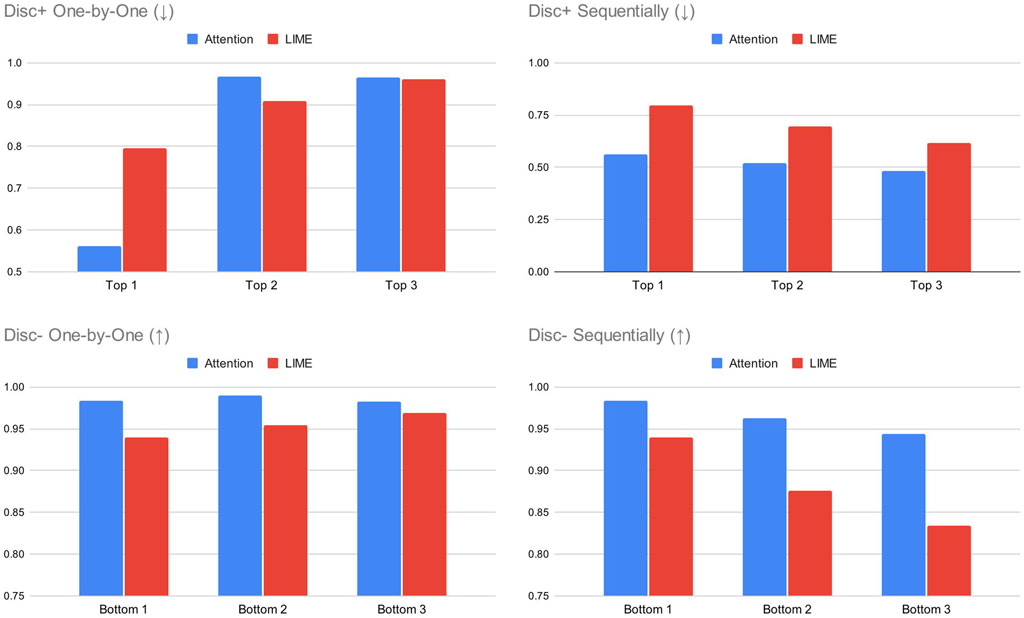
Figure 8. The computed Disc+ and Disc- scores for the examined fragment-level explanation methods on the videos on the TVSum dataset, after masking out the three top- and bottom-scoring fragments in a one-by-one and sequential manner. We anticipate a higher/lower drop in Disc ± for the top/bottom-1 scoring fragment, and lower/higher drops in Disc ± for the remaining top/bottom-scoring fragments.
The performance of the developed method for object-level explanation was initially evaluated using video fragments that were found as the most influential ones by the considered fragment-level explanation methods. The results of our experimental evaluations on the videos of the SumMe and TVSum datasets are presented in Tables 4, 5, respectively. Once again, the upper part of these Tables reports the computed Disc+, Disc+ Seq, Disc-, Disc- Seq, SV and SV Seq scores, after taking into account videos that have at least three top- and three bottom-scoring visual objects by the explanation method (Video Set 1). The lower part of these Tables reports the Disc+, Disc- and SV scores for a larger set of videos (Video Set 2), i.e., those that have at least one top- and one bottom-scoring visual object by the explanation method, computed based on the obtained
The performance of the developed object-level explanation method on the aforementioned sets of videos of the SumMe and TVSum datasets, when using the three top-scoring fragments by the summarization method, is reported in Tables 6, 7, respectively. As a note, in this case, the Disc ± evaluation measures are computed by taking into account only the importance scores of the frames within the selected fragments. A pair-wise comparison of the Disc+ and Disc- scores shows that our method distinguishes the most from the least influential object in most cases, a fact that is also documented by the obtained sanity violation scores. Moreover, it is able to spot objects that have indeed a very small impact on the output of the summarization process, as demonstrated by the significantly high Disc- scores. Finally, a cross-dataset comparison shows that our method is more effective on the videos of the TVSum dataset, as it exhibits constantly lower sanity violation scores for both evaluation settings (one-by-one and sequential).
4.4 Qualitative results
Our qualitative analysis is based on the produced explanations for two videos of the SumMe and TVSum datasets. The top part of Figures 9, 10 provides a keyframe-based representation of the visual content of the original and the summarized version of the video, while the bottom part shows the produced explanations by the proposed framework. The green- and red-coloured regions in the frames of the object-level explanations, indicate the most and least influential visual objects, respectively. To avoid confusion, these regions are demarcated also in segmentation masks, right below.
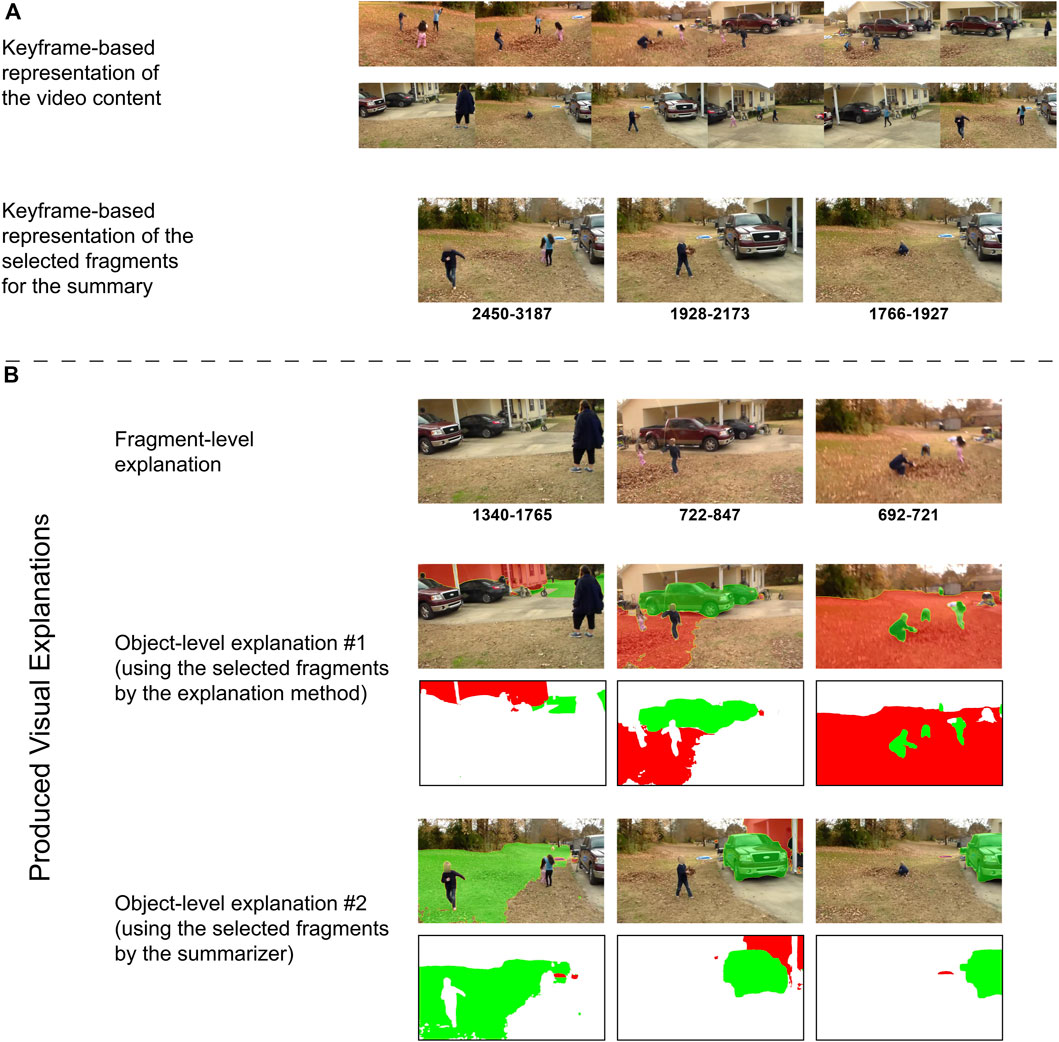
Figure 9. (A) A keyframe-based representation of the visual content of the original and the summarized version of a SumMe video, titled “Kids playing in leaves.” (B) The produced explanations by the proposed framework. Green- and red-coloured regions in object-level explanations indicate the most and least influential visual objects, respectively.
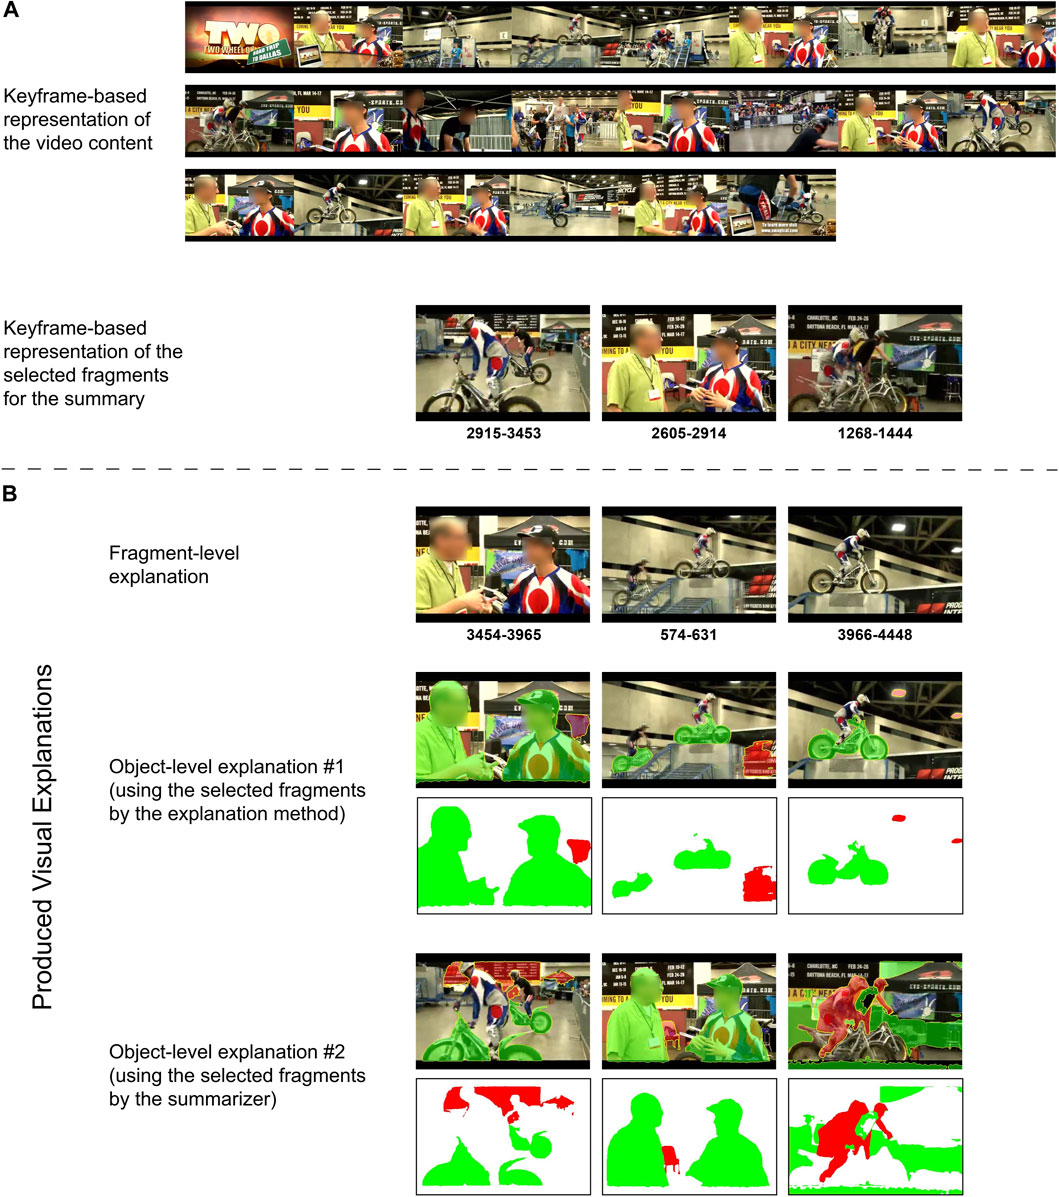
Figure 10. (A) A keyframe-based representation of the visual content of the original and the summarized version of a TVSum video, titled “Smage Bros. Motorcycle Stunt Show”. (B) The produced explanations by the proposed framework. Green- and red-coloured regions in object-level explanations indicate the most and least influential visual objects, respectively.
In the example video of Figure 9, which is titled “Kids playing in leaves,” the generated video summary contains parts of the video showing the kids playing with the leaves near a truck. The produced fragment-level explanation from the utilized attention-based method shows that the summarization model paid attention on instances of the kids playing with the leaves (second and third fragment), and the part of the scene where the event is mainly taking place (second fragment). The obtained object-level explanation using the selected fragments by the attention-based explanation method demonstrates that the summarizer concentrates on the truck (second fragment) and the kids (third fragment) - while it pays less attention on the house (first fragment) and the yard (second and third fragment) - thus further explaining why these parts of the video were selected for inclusion in the summary and why other parts of the video (showing the yard right in front of the house, the black car in the parking and the lady) were not. Finally, the produced object-level explanation using the selected fragments by the summarizer seems to partially overlap with the aforementioned one, as it shows that the truck and the house were again the most and least important visual objects for the summarizer (second and third fragment); though, it indicates that the summarizer paid attention to the yard where the kids are playing at.
In the example video of Figure 10, which is titled “Smage Bros. Motorcycle Stunt Show,” the created video summary shows the riders of the motorcycles and one of them being interviewed. The obtained fragment-level explanation from the employed method indicates that the summarizer concentrates on the riders (second and third fragment) and the interview (first fragment). Further insights are given by the object-level explanation of the aforementioned fragments, which demonstrates that the motorcycles (second and third fragment) and the participants in the interview (first fragment) were the most influential visual objects. Similar remarks can be made by observing the produced object-level explanation using the selected fragments from the summarizer (see the first and second fragment). These findings explain why the summarizer selected these parts of the video for inclusion in the summary and why other parts (showing the logo of the TV-show, distant views of the scene and close-ups of the riders) were found as less appropriate. These paradigms show that the produced multi-granular explanations by the proposed framework could allow the user to get insights about the focus of the summarization model, and thus, assist the explanation of the summarization outcome.
5 Conclusion and future steps
In this paper, we presented a framework for explaining video summarization results through visual-based explanations that are associated with different levels of data granularity. In particular, our framework can provide fragment-level explanations that show the temporal fragments of the video that influenced the most the decisions of the summarizer, using either a model-specific (attention-based) or a model-agnostic (LIME-based) explanation method. Moreover, it can produce object-level explanations that highlight the visual objects with the highest influence to the summarizer, taking into account the video fragments that were selected either by the fragment-level explanation method or the summarizer. The performance of the produced explanations was evaluated using a state-of-the-art method (CA-SUM) and two datasets (SumMe and TVSum) for video summarization. The conducted quantitative evaluations showed the effectiveness of our explanation framework to spot the parts of the video (fragments or visual objects) with the highest and lowest influence on the summarizer, while our qualitative analysis demonstrated its capacity to produce a set of multi-granular and informative explanations for the results of the video summarization process. In terms of future steps, we plan to test the performance of our framework using additional state-of-the-art methods for video summarization. Moreover, we aim to leverage advanced vision-language models [e.g., CLIP (Radford et al., 2021) and BLIP-2 (Li et al., 2023)] and extend our framework to provide a textual description of the produced visual-based explanations, thus making it more user-friendly for media professionals.
Data availability statement
Publicly available datasets were analyzed in this study. These datasets can be found in the VSum (www.vision.ee.ethz.ch/∼gyglim/vsum/) and TVSum (https://github.com/yalesong/tvsum) repositories.
Author contributions
KT: Investigation, Methodology, Software, Visualization, Writing–original draft, Writing–review and editing. EA: Conceptualization, Investigation, Methodology, Resources, Supervision, Writing–original draft, Writing–review and editing. VM: Methodology, Supervision, Writing–review and editing.
Funding
The author(s) declare that financial support was received for the research, authorship, and/or publication of this article. This work was supported by the EU Horizon 2020 programme under grant agreement H2020-951911 AI4Media.
Conflict of interest
The authors declare that the research was conducted in the absence of any commercial or financial relationships that could be construed as a potential conflict of interest.
Publisher’s note
All claims expressed in this article are solely those of the authors and do not necessarily represent those of their affiliated organizations, or those of the publisher, the editors and the reviewers. Any product that may be evaluated in this article, or claim that may be made by its manufacturer, is not guaranteed or endorsed by the publisher.
References
Aakur, S. N., de Souza, F. D. M., and Sarkar, S. (2018). “An inherently explainable model for video activity interpretation,” in The Workshops of the 32nd AAAI Conf. on Artificial Intelligence, New Orleans, Louisiana, February 2–7, 2018.
Apostolidis, E., Adamantidou, E., Metsai, A. I., Mezaris, V., and Patras, I. (2021a). AC-SUM-GAN: connecting actor-critic and generative adversarial networks for unsupervised video summarization. IEEE Trans. Circuits Syst. Video Technol. 31, 3278–3292. doi:10.1109/TCSVT.2020.3037883
Apostolidis, E., Adamantidou, E., Metsai, A. I., Mezaris, V., and Patras, I. (2021b). Video summarization using deep neural networks: a survey. Proc. IEEE 109, 1838–1863. doi:10.1109/JPROC.2021.3117472
Apostolidis, E., Apostolidis, K., and Mezaris, V. (2024). “Facilitating the production of well-tailored video summaries for sharing on social media,” in MultiMedia modeling. Editors S. Rudinac, A. Hanjalic, C. Liem, M. Worring, B. D. Jonsson, B. Liuet al. (Cham: Springer Nature Switzerland), 271–278.
Apostolidis, E., Balaouras, G., Mezaris, V., and Patras, I. (2022a). “Explaining video summarization based on the focus of attention,” in Proc. Of the 2022 IEEE int. Symposium on Multimedia (ISM), Naples, Italy, December 5–7, 2022, 146–150. doi:10.1109/ISM55400.2022.00029
Apostolidis, E., Balaouras, G., Mezaris, V., and Patras, I. (2022b). “Summarizing videos using concentrated attention and considering the uniqueness and diversity of the video frames,” in ICMR ’22: Proc. of the 2022 Int. Conf. on Multimedia Retrieval, Newark, NJ, June 27–30, 2022 (New York, NY: Association for Computing Machinery), 407–415. doi:10.1145/3512527.3531404
Apostolidis, E., Balaouras, G., Patras, I., and Mezaris, V. (2025). “Explainable video summarization for advancing media content production,” in Encyclopedia of information science and technology. Editor D. Mehdi Khosrow-Pour Sixth Edition (Hershey, PA: IGI Global), 1–24.
Apostolidis, E., Mezaris, V., and Patras, I. (2023). “A study on the use of attention for explaining video summarization,” in NarSUM ’23: Proc. of the 2nd Workshop on User-Centric Narrative Summarization of Long Videos, Ottawa ON, October 29, 2023 (New York, NY: Association for Computing Machinery), 41–49. doi:10.1145/3607540.3617138
Apostolidis, K., Apostolidis, E., and Mezaris, V. (2018). “A motion-driven approach for fine-grained temporal segmentation of user-generated videos,” in 24th Int. Conf. on MultiMedia Modeling, Bangkok, Thailand, February 5-7, 2018 (Springer), 29–41. Proceedings, Part I 24.
Awad, G., Butt, A. A., Fiscus, J. G., Joy, D., Delgado, A., Michel, M., et al. (2017). “TRECVID 2017: evaluating ad-hoc and instance video search, events detection, video captioning and hyperlinking,” in TREC video retrieval evaluation, TRECVID (Gaithersburg, MD: National Institute of Standards and Technology, NIST).
Bai, X., Wang, X., Liu, X., Liu, Q., Song, J., Sebe, N., et al. (2021). Explainable deep learning for efficient and robust pattern recognition: a survey of recent developments. Pattern Recognit. 120, 108102. doi:10.1016/j.patcog.2021.108102
Bargal, S. A., Zunino, A., Kim, D., Zhang, J., Murino, V., and Sclaroff, S. (2018). “Excitation backprop for rnns,” in Proc. Of the 2018 IEEE/CVF Conference on Computer Vision and Pattern Recognition (CVPR), Salt Lake City, UT, June 18–23, 2018, 1440–1449. doi:10.1109/CVPR.2018.00156
Deng, J., Dong, W., Socher, R., Li, L.-J., Li, K., and Fei-Fei, L. (2009). “Imagenet: a large-scale hierarchical image database,” in Proc. Of the 2009 IEEE conf. on computer vision and pattern recognition (CVPR), Miami, Florida, June 20–25, 2009, 248–255. doi:10.1109/CVPR.2009.5206848
Dhiman, C., Varshney, A., and Vyapak, V. (2024). AP-TransNet: a polarized transformer based aerial human action recognition framework. Mach. Vis. Appl. 35, 52. doi:10.1007/s00138-024-01535-1
Dhiman, C., and Vishwakarma, D. K. (2020). View-invariant deep architecture for human action recognition using two-stream motion and shape temporal dynamics. IEEE Trans. Image Process. 29, 3835–3844. doi:10.1109/TIP.2020.2965299
Dhiman, C., Vishwakarma, D. K., and Agarwal, P. (2021). Part-wise spatio-temporal attention driven CNN-based 3D human action recognition. ACM Trans. Multimedia Comput. Commun. Appl. 17, 1–24. doi:10.1145/3441628
Fajtl, J., Sokeh, H. S., Argyriou, V., Monekosso, D., and Remagnino, P. (2019). “Summarizing videos with attention,” in Asian conference on computer vision (ACCV) 2018 workshops. Editors G. Carneiro, and S. You (Cham: Springer International Publishing), 39–54.
Gkalelis, N., Daskalakis, D., and Mezaris, V. (2022). ViGAT: bottom-up event recognition and explanation in video using factorized graph attention network. IEEE Access 10, 108797–108816. doi:10.1109/ACCESS.2022.3213652
Gkartzonika, I., Gkalelis, N., and Mezaris, V. (2023). “Learning visual explanations for dcnn-based image classifiers using an attention mechanism,” in Proc. Of the 2022 European conference on computer vision (ECCV) workshops. Editors L. Karlinsky, T. Michaeli, and K. Nishino (Cham: Springer Nature Switzerland), 396–411.
Guo, S., Jin, Z., Chen, Q., Gotz, D., Zha, H., and Cao, N. (2022). Interpretable anomaly detection in event sequences via sequence matching and visual comparison. IEEE Trans. Vis. Comput. Graph. 28, 4531–4545. doi:10.1109/TVCG.2021.3093585
Gygli, M., Grabner, H., Riemenschneider, H., and Van Gool, L. (2014). “Creating summaries from user videos,” in Proc. Of the 2014 European conference on computer vision (ECCV). Editors D. Fleet, T. Pajdla, B. Schiele, and T. Tuytelaars (Cham: Springer International Publishing), 505–520.
Han, Y., Zhuo, T., Zhang, P., Huang, W., Zha, Y., Zhang, Y., et al. (2022). One-shot video graph generation for explainable action reasoning. Neurocomputing 488, 212–225. doi:10.1016/j.neucom.2022.02.069
Hinami, R., Mei, T., and Satoh, S. (2017). “Joint detection and recounting of abnormal events by learning deep generic knowledge,” in Proc. Of the 2017 IEEE international conference on computer vision (ICCV) (Los Alamitos, CA, USA: IEEE Computer Society), 3639–3647. doi:10.1109/ICCV.2017.391
Huang, J., Yang, C., Chen, P., Chen, M., and Worring, M. (2023). “Causalainer: causal explainer for automatic video summarization,” in Proc. of the 2023 IEEE/CVF Conference on Computer Vision and Pattern Recognition Workshops (CVPRW), Vancouver, BC, June 18–22, 2023, (Los Alamitos, CA: IEEE Computer Society), 2630–2636. doi:10.1109/CVPRW59228.2023.00262
Kendall, M. G. (1945). The treatment of ties in ranking problems. Biometrika 33, 239–251. doi:10.2307/2332303
Li, J., Li, D., Savarese, S., and Hoi, S. (2023). “Blip-2: bootstrapping language-image pre-training with frozen image encoders and large language models,” in ICML’23: Proc. of the 40th International Conference on Machine Learning (Amsterdam, Netherlands: Elsevier).
Li, P., Ye, Q., Zhang, L., Yuan, L., Xu, X., and Shao, L. (2021). Exploring global diverse attention via pairwise temporal relation for video summarization. Pattern Recognit. 111, 107677. doi:10.1016/j.patcog.2020.107677
Li, X., Zhang, W., Pang, J., Chen, K., Cheng, G., Tong, Y., et al. (2022). “Video k-net: a simple, strong, and unified baseline for video segmentation,” in Proc. Of the 2022 IEEE/CVF conference on computer vision and pattern recognition (CVPR), New Orleans, LA, June 18–24, 2022 (IEEE), 18825–18835. doi:10.1109/CVPR52688.2022.01828
Li, Z., Wang, W., Li, Z., Huang, Y., and Sato, Y. (2021). “Towards visually explaining video understanding networks with perturbation,” in 2021 IEEE winter conference on applications of computer vision (WACV), Waikoloa, HI, January 3–8, 2021, 1119–1128.
Mänttäri, J., Broomé, S., Folkesson, J., and Kjellström, H. (2020). “Interpreting video features: a comparison of 3D convolutional networks and convolutional LSTM networks,” in Asian conference on computer vision (ACCV) 2020. Editors H. Ishikawa, C.-L. Liu, T. Pajdla, and J. Shi (Cham: Springer International Publishing), 411–426.
Miao, J., Wang, X., Wu, Y., Li, W., Zhang, X., Wei, Y., et al. (2022). “Large-scale video panoptic segmentation in the wild: a benchmark,” in Proc. Of the 2022 IEEE/CVF conference on computer vision and pattern recognition (CVPR), New Orleans, LA, June 18–24, 2022, 21001–21011. doi:10.1109/CVPR52688.2022.02036
Ntrougkas, M. V., Gkalelis, N., and Mezaris, V. (2024). T-TAME: trainable attention mechanism for explaining convolutional networks and vision transformers. IEEE Access 12, 76880–76900. doi:10.1109/ACCESS.2024.3405788
Papoutsakis, K. E., and Argyros, A. A. (2019). “Unsupervised and explainable assessment of video similarity,” in 30th British Machine Vision Conference 2019, BMVC 2019, Cardiff, UK, September 9–12, 2019 (Durham, United Kingdom: BMVA Press), 151.
Radford, A., Kim, J. W., Hallacy, C., Ramesh, A., Goh, G., Agarwal, S., et al. (2021). “Learning transferable visual models from natural language supervision,” in Proc. Of the 38th international conference on machine learning. (PMLR), vol. 139 of proceedings of machine learning research. Editors M. Meila, and T. Zhang, 8748–8763.
Ribeiro, M. T., Singh, S., and Guestrin, C. (2016). ““Why should i trust you?” Explaining the predictions of any classifier,” in Proc. of the 22nd ACM SIGKDD International Conference on Knowledge Discovery and Data Mining, San Francisco, CA, August 13–17, 2016 (New York, NY: Association for Computing Machinery), 1135–1144. doi:10.1145/2939672.2939778
Rochan, M., and Wang, Y. (2019). “Video summarization by learning from unpaired data,” in Proc. of the 2019 IEEE/CVF Conf. on Computer Vision and Pattern Recognition (CVPR), Long Beach, CA, June 15–20, 2019 (IEEE), 7894–7903.
Ronneberger, O., Fischer, P., and Brox, T. (2015). “U-net: convolutional networks for biomedical image segmentation,” in Medical image computing and computer-assisted intervention – MICCAI 2015. Editors N. Navab, J. Hornegger, W. M. Wells, and A. F. Frangi (Cham: Springer International Publishing), 234–241.
Roy, C., Shanbhag, M., Nourani, M., Rahman, T., Kabir, S., Gogate, V., et al. (2019). “Explainable activity recognition in videos,” in ACM Intelligent User Interfaces (IUI) workshops, Los Angeles, CA, March 16–20, 2019.
Singh, A., Jones, M. J., and Learned-Miller, E. G. (2023). “Eval: explainable video anomaly localization,” in Proc. of the 2023 IEEE/CVF Conference on Computer Vision and Pattern Recognition (CVPR), Vancouver, BC, June 17–24, 2023, (Los Alamitos, CA, USA: IEEE Computer Society), 18717–18726. doi:10.1109/CVPR52729.2023.01795
Singh, K., Dhiman, C., Vishwakarma, D. K., Makhija, H., and Walia, G. S. (2022). A sparse coded composite descriptor for human activity recognition. Expert Syst. 39, e12805. doi:10.1111/exsy.12805
Song, Y., Vallmitjana, J., Stent, A., and Jaimes, A. (2015). “TVSum: summarizing web videos using titles,” in Proc. of the 2015 IEEE/CVF Conf. on Computer Vision and Pattern Recognition (CVPR), Boston, MA, June 7–12, 2015, 5179–5187. doi:10.1109/CVPR.2015.7299154
Souček, T., and Lokoč, J. (2024). “Transnet v2: an effective deep network architecture for fast shot transition detection,” in MM ’24: Proceedings of the 32nd ACM International Conference on Multimedia, Melbourne VIC, Australia (New York, NY: Association for Computing Machinery), 11218–11221. doi:10.1145/3664647.3685517
Stergiou, A., Kapidis, G., Kalliatakis, G., Chrysoulas, C., Veltkamp, R., and Poppe, R. (2019). “Saliency tubes: visual explanations for spatio-temporal convolutions,” in Proc. of the 2019 IEEE International Conference on Image Processing (ICIP), Taipei, Taiwan, September 22–29, 2019, 1830–1834. doi:10.1109/ICIP.2019.8803153
Szegedy, C., Liu, W., Jia, Y., Sermanet, P., Reed, S., Anguelov, D., et al. (2015). “Going deeper with convolutions,” in Proc. of the 2015 IEEE/CVF Conference on Computer Vision and Pattern Recognition (CVPR), Boston, MA, June 7–12, 2015, 1–9. doi:10.1109/CVPR.2015.7298594
Szymanowicz, S., Charles, J., and Cipolla, R. (2022). “Discrete neural representations for explainable anomaly detection,” in Proc. of the 2022 IEEE/CVF Winter Conference on Applications of Computer Vision (WACV), Waikoloa, Hi, January 3–8, 2022, (Los Alamitos, CA: IEEE Computer Society), 1506–1514. doi:10.1109/WACV51458.2022.00157
Tang, S., Feng, L., Kuang, Z., Chen, Y., and Zhang, W. (2019). “Fast video shot transition localization with deep structured models,” in Proc. of the 2018 Asian Conference on Computer Vision (ACCV). Editors C. V. Jawahar, H. Li, G. Mori, and K. Schindler (Cham: Springer International Publishing), 577–592.
Wu, C., Shao, S., Satam, P., and Hariri, S. (2022). An explainable and efficient deep learning framework for video anomaly detection. Clust. Comput. 25, 2715–2737. doi:10.1007/s10586-021-03439-5
Yu, H., Huang, Y., Pi, L., Zhang, C., Li, X., and Wang, L. (2021). End-to-end video text detection with online tracking. Pattern Recognit. 113, 107791. doi:10.1016/j.patcog.2020.107791
Zhang, W., Pang, J., Chen, K., and Loy, C. C. (2024). “K-Net: towards unified image segmentation,” in NIPS’21: Proc. of the 35th International Conference on Neural Information Processing Systems, December 6–14, 2021 (Red Hook, NY: Curran Associates Inc.).
Zhao, B., Li, X., and Lu, X. (2018). “HSA-RNN: hierarchical structure-adaptive RNN for video summarization,” in Proc. of the 2018 IEEE/CVF Conf. on Computer Vision and Pattern Recognition (CVPR), Salt Lake City, UT, June 18–23, 2018, 7405–7414.
Zhao, B., Li, X., and Lu, X. (2020). TTH-RNN: tensor-train hierarchical recurrent neural network for video summarization. IEEE Trans. Industrial Electron. 68, 3629–3637. doi:10.1109/TIE.2020.2979573
Zhuo, T., Cheng, Z., Zhang, P., Wong, Y., and Kankanhalli, M. (2019). “Explainable video action reasoning via prior knowledge and state transitions,” in MM ’19: Proc. of the 27th ACM International Conference on Multimedia, Nice France, October 21–25, 2019 (New York, NY: Association for Computing Machinery), 521–529. doi:10.1145/3343031.3351040
Keywords: explainable AI, video summarization, fragment-level explanation, object-level explanation, model-specific explanation method, model-agnostic explanation method, quantitative evaluation, qualitative evaluation
Citation: Tsigos K, Apostolidis E and Mezaris V (2024) An integrated framework for multi-granular explanation of video summarization. Front. Sig. Proc. 4:1433388. doi: 10.3389/frsip.2024.1433388
Received: 15 May 2024; Accepted: 02 December 2024;
Published: 24 December 2024.
Edited by:
Wenhan Yang, Peng Cheng Laboratory, ChinaReviewed by:
Chhavi Dhiman, Delhi Technological University, IndiaRadhey Shyam, Babu Banarasi Das University, India
Copyright © 2024 Tsigos, Apostolidis and Mezaris. This is an open-access article distributed under the terms of the Creative Commons Attribution License (CC BY). The use, distribution or reproduction in other forums is permitted, provided the original author(s) and the copyright owner(s) are credited and that the original publication in this journal is cited, in accordance with accepted academic practice. No use, distribution or reproduction is permitted which does not comply with these terms.
*Correspondence: Evlampios Apostolidis, YXBvc3RvbGlkQGl0aS5ncg==
 Konstantinos Tsigos
 Evlampios Apostolidis