 Ahashan Habib Niloy1
 S. M. Farah Al Fahim1
 Mohammad Zavid Parvez2*†
 Shammi Akhter Shiba1
 Faizun Nahar Faria1
 Md. Jamilur Rahman1Emtiaz Hussain1Tasmi Tamanna3
- 1Department of Computer Science and Engineering, Brac University, Dhaka, Bangladesh
- 2School of Computing, Mathematics and Engineering, Charles Sturt University, Bathurst, NSW, Australia
- 3Institute for Health and Sport (IHES), Victoria University, Melbourne, VIC, Australia
The world first came to know the existence of COVID-19 (SARS-CoV-2) in December 2019. Initially, doctors struggled to diagnose the increasing number of patients due to less availability of testing kits. To help doctors primarily diagnose the virus, researchers around the world have come up with some radiology imaging techniques using the Convolutional Neural Network (CNN). Previously some research methods were based on X-ray images and others on CT scan images. Few research methods addressed both image types, with the proposed models limited to detecting only COVID and NORMAL cases. This limitation motivated us to propose a 42-layer CNN model that works for complex scenarios (COVID, NORMAL, and PNEUMONIA_VIRAL) and more complex scenarios (COVID, NORMAL, PNEUMONIA_VIRAL, and PNEUMONIA_BACTERIA). Furthermore, our proposed model indicates better performance than any other previously proposed models in the detection of COVID-19.
1 Introduction
The ongoing COVID-19 pandemic was initially found in December 2019 (Hussain et al., 2021) and was declared a global pandemic by the World Health Organization (WHO) in March 2020 (Cucinotta and Vanelli, 2020). One of the major issues of this virus is its contamination from human contacts. To tackle this issue, different countries had to impose lockdown measures which ultimately affected the world economy severely (Shrestha et al., 2020). Since its inception in 2019, more than 641 million people got infected and more than 6.6 million people died (Sadeghi Mofrad et al., 2024).
Since its initial days, testing has remained one of the major problems. Because of several issues related to testing, the number of test cases was never enough compared to the total population which consequently worsened the situation hiding the actual number (Li R. et al., 2020).
To improve the situation by helping clinicians get initial ideas about patients, several research studies have been conducted across the globe using radiology imaging techniques for COVID-19 detection. Since X-ray machines and CT scan machines are available in almost every healthcare center around the world, researchers worked on these images so that doctors can start treatment at an early stage (Gharieb, 2022).
There is a lot of quality research for COVID-19 detection with great accuracy using X-ray images. In a research paper, Pereira et al. (2020) proposed a technique based only on X-ray images that can detect Pneumonia. They have developed their model and claimed their work to have the best accuracy among other published research works. In another study, Wang et al. (2020) suggested a customized Convolutional Neural Network (CNN) architecture for COVID-19 detection using X-ray images and also claimed that their work was the first of its type. They classified the X-ray images as COVID-19, normal and Pneumonia cases. In another study, Narin et al. (2020) proposed three models using X-ray images for COVID-19 detection and achieved an accuracy of 98% using the ResNet50. In another research, Cohen et al. (2020) suggested a model that predicted the severity of Pneumonia, and COVID-19 using X-ray images. Both COVID and non-COVID datasets have been preprocessed with images (recompressing, centering, rescaling), then processed using the extraction caps and network task prediction layer. In another study, Mahmud et al. (2020) suggested a deep neural network architecture capable of detecting COVID-19 and different types of Pneumonia. By merging features from diverse receptive areas, efficient depth convergence is used to analyze abnormalities in X-ray images from many perspectives. In addition, an additional performance stacking algorithm was also used. In another research, Ozturk et al. (2020) designed a model using X-ray images known as DarkCovidNet inspired by the DarkNet-19 model with fewer layers and filters. There are 17 convolution layers in the proposed model and performance is assessed using a five-fold cross-validation process. With 98.08% and 87.02% accuracy respectively, their developed system can perform binary class and multiclass tasks. In another research, Asif et al. (2020) proposed the use of the X-ray data and Inception V3 model using CNN for COVID-19 detection. They implemented their work with the Inception V3 model and TensorFlow. They increased the training set to 4,000 and obtained a 96 percent accuracy on the final test. They did, however, use transfer learning techniques to compensate for the lack of data and training time. Moreover, they claim that their proposed model Inception V3 architecture performs better than most recent architecture. In another research, Panwar et al. (2020a) conducted a study in which they employed their own built CNN-based model called nCOVnet, which comprises 24 layers. These layers are trained on the ImageNet dataset. They analyzed their model using both the conventional VGG16 model, which achieved 92.7 percent accuracy on ImageNet, and a transfer learning model. Additionally, they validated the model against Kaggle’s X-ray scans of the chest. As a result, they achieve up to 97.62 percent training accuracy. Finally, they assert that their suggested approach is capable of detecting patients who test positive for COVID-19 in less than 5 s. In another study, Khan et al. (2020) offered a technique using deep CNN to detect COVID-19 in Chest X-ray (CXR) images to diagnose three distinct forms of Pneumonia utilizing image data from an open-source GitHub repository. CoroNet is their suggested model, which is built on Xception CNN architecture with 71 layers. They employed fourfold cross-validation in conjunction with Keras’ CoroNet implementation. CoroNet averaged 89.6 percent accuracy. Lastly, in their study they were just talking about X-ray images. In another research, Sethy and Behera (2020) developed a model using DCNN where they used the dataset of X-ray images which are available on repositories of GitHub, Kaggle and Open-i. They used multiple architectures to detect COVID-19. They used SVM classifiers with features which are obtained from the CNN models. However, ResNet50 and SVM give better classification results in detecting COVID-19. Moreover, they claim that ResNet50 along with SVM achieved 95.38% accuracy which is statistically much better than the other existing models. In another research, Tuncer et al. (2020) proposed a model that generates features using ResExLBP. The method for automatically detecting COVID-19 consists of three stages. At first it processes the data. Then, it extracts the features from the data. After that it selects from the extracted features. For training and testing, tenfold cross-validation was used. In another research, Hussain et al. (2021) developed a novel CNN model called CoroDet. They used a 22-layer CNN model built with Keras and TensorFlow 2.0, as well as the ImageNet dataset for pre-training. They used different layered CNN models to determine which CNN model performs the best in terms of accuracy. However, they use their model to determine two-class, three-class, and four-class classifications.
Although all of them (Asif et al., 2020; Cohen et al., 2020; Khan et al., 2020; Mahmud et al., 2020; Narin et al., 2020; Ozturk et al., 2020; Panwar et al., 2020a; Pereira et al., 2020; Sethy and Behera, 2020; Tuncer et al., 2020; Wang et al., 2020; Hussain et al., 2021) are quite successful in the case of X-ray images, we cannot get any idea of CT scan images from their research. In a study, Li L. et al. (2020) demonstrated that a deep learning model, COVNet, can accurately distinguish COVID-19 from community-acquired pneumonia using chest CT images. The model achieved high sensitivity and specificity by leveraging a comprehensive retrospective analysis of CT scans from multiple hospitals, incorporating both 2D and 3D features of the CT images. This study underscores the potential of COVNet as an effective diagnostic tool for early and accurate detection of COVID-19 in clinical settings. In another study, Zheng et al. (2020) worked on 3D CT scan images to detect COVID-19 using weakly supervised deep learning. They proposed a model, DeCoVNet, which has three stages. However, data augmentation was used in this case to avoid overfitting issues. Testing a CT volume took only 1.93 s after training with 499 CT volumes. However, from both these research (Li L. et al., 2020; Zheng et al., 2020), we do not get any idea about the performance of X-ray images.
As far as we know, very few researches have been conducted so far using both X-ray images and CT scan images. In a research, Panwar et al. (2020b) developed a model for detecting COVID-19 where they used both image types. Their model works for COVID vs. normal for both the image types and COVID vs. Pneumonia only for X-ray images. In another research, Maghdid et al. (2021) developed deep learning and transfer learning algorithms for COVID-19 detection using both image types. Due to an insufficient number of images in the existing datasets, they created their dataset by combining images from different datasets so that their model could predict more accurately. Their model provides 98% accuracy for pre-trained AlexNet and 94.1% accuracy for modified CNN.
However, their research (Panwar et al., 2020b; Maghdid et al., 2021) doesn’t show anything regarding complex scenarios (e.g., viral or bacterial pneumonia). Therefore, in our study, we proposed a 42 layered CNN model that performs efficiently for both X-ray and CT scan images and it works better compared to the previously published CNN models for complex scenarios using both image types. Our proposed 42-layered model contains a Convolutional Layer, Max Pooling Layer, Average Pooling Layer, Batch Normalization Layer, Flatten Layer, Dense Layer, Dropout Layer, 5 CovRoot Blocks consisting of 4 Conv2D Layers and 1 Depthwise Conv2D Layer and two activation functions (Leaky ReLU and Sigmoid). To evaluate our proposed model, we used some metrics like Accuracy, Precision, Recall, F1 score, Specificity, Sensitivity, and Confusion Matrix.
The major contributions of our research include the development of a novel 42-layer CNN architecture for COVID-19 detection using X-ray and CT scan images, achieving significant milestones for more complex scenarios (i.e., COVID, NORMAL, PNEUMONIA_VIRAL and PNEUMONIA_BACTERIA). This marks the first comparative analysis between X-ray and CT scan images across these classifications. For X-ray images, CoroScan achieves notable accuracies of 93.33%, 97.77%, and 95% for two class, three class, and four class classifications, respectively, while for CT scan images, accuracies stand at 100%, 70%, and 60% for the same classifications. These accuracies surpass current state-of-the-art methods in COVID-19 detection. Additionally, our research effort culminated in assembling the largest dataset integrating both X-ray and CT scan images for COVID-19 detection to date.
We have structured our paper by discussing our proposed model in Section 2, analyzing results in Section 3, and finally concluding our study with a plan in Section 4.
2 Our proposed model
In this section, we have discussed our proposed 42-layered CNN model for COVID-19 detection using both X-ray and CT scan images for more complex scenarios (COVID, NORMAL, PNEUMONIA_VIRAL, and PNEUMONIA_BACTERIA). Initially, we developed a research workflow. Figure 1 illustrates the overall steps of our proposed model. Here 2 - Class Classification refers to COVID and NORMAL, 3 - Class Classification refers to complex scenarios (COVID, NORMAL, and PNEUMONIA_VIRAL) and 4 - Classification refers to more complex scenerios (COVID, NORMAL, PNEUMONIA_VIRAL, and PNEUMONIA_BACTERIA). Each step of this workflow is briefly described in the following subsections.
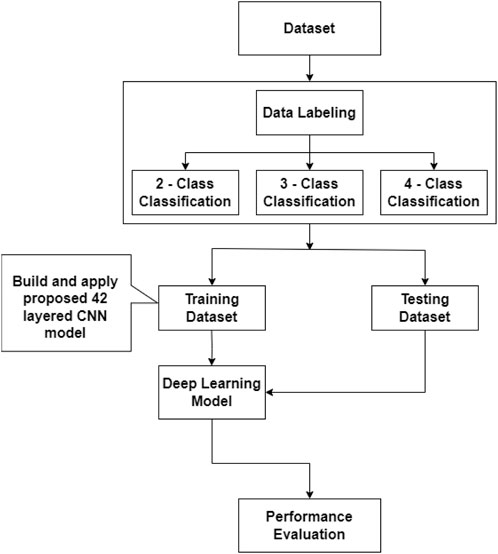
Figure 1. Block diagram of our proposed model (i.e., CovRoot).
2.1 Dataset (CovRecker)
We have started building our proposed model by collecting the dataset from six different data sources and named it CovRecker. It contains both X-ray and CT scan images (i.e., chest radiology images). Table 1 shows a summary of our collected dataset.

Table 1. A summary of our dataset, CovRecker.
Table 1 shows that our dataset contains 1385 COVID images, 1486 NORMAL images, 1530 PNEUMONIA_VIRAL images and 1430 PNEUMONIA_BACTERIA images. However, in our dataset, there are 5071 X-ray images and 760 CT scan images. So our dataset, CovRecker, consists of a total of 5,831 images. CovRecker has been created by collecting images from these six publicly available datasets. A brief description of these data sources is shown in Table 2.
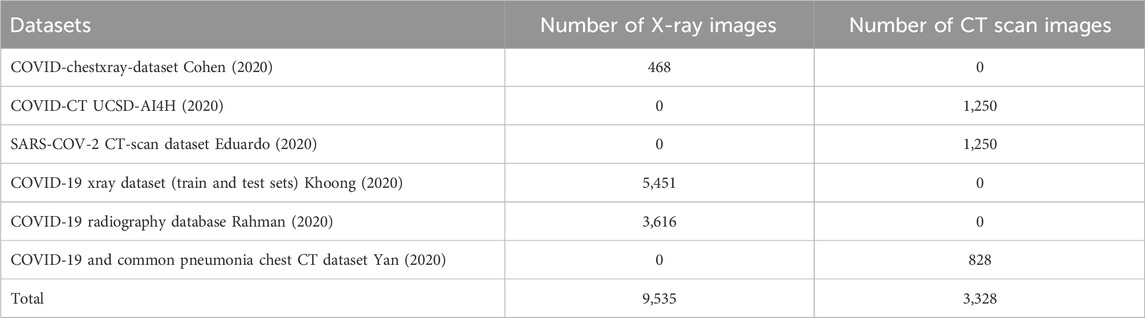
Table 2. Details of dataset (CovRecker).
By comparing Table 2 with our dataset, CovRecker, we can observe that our dataset contains less number of images. This is because the publicly available datasets contained images of some other classes such as SARS. But in our research, we are concerned about evaluating the results of COVID, NORMAL, PNEUMONIA_VIRAL, and PNEUMONIA_BACTERIA using both X-ray and CT scan images. So, all other images except the images of COVID, NORMAL, PNEUMONIA_VIRAL, and PNEUMONIA_BACTERIA were removed from the dataset.
From our dataset, CovRecker, four sample X-ray images have been presented in Figure 2. We have selected one X-ray image from each class to have an idea about our dataset. By comparing the images side by side, we can observe their differences. X-rays of normal or non-COVID patients show no greyish parts. The lungs’ image is clean and clear. On the contrary, X-ray images of both COVID-19 and pneumonia patients show hyper-lucent lung fields which indicate hyperinflation due to obstruction of airways. We can see patchy opacities which are caused by bacterial co-infection. Though COVID-19 patients do not develop pneumonia, their infection areas and symptoms could be similar. If we compare the X-ray image of COVID-19 and Pneumonia cases with that of normal cases, we can see that the chest wall is inflated in the case of COVID-19 and Pneumonia cases. The position of the heart, trachea and mediastinum is also different. In the case of COVID-19 cases, the X-ray image shows that the opacity of the chest wall and all other vital organs are more obscure compared to Pneumonia patients. Our task with this research is to differentiate these dissimilarities using CNN models.

Figure 2. X-ray images for more complex scenarios (COVID, NORMAL, PNEUMONIA_VIRAL, and PNEUMONIA_BACTERIA).
From our dataset, CovRecker, four sample CT scan images have been presented in Figure 3. We have selected one CT scan image from each class to have an idea about our dataset. From the images, we can identify the difference between a COVID-19 patient from a non-COVID patient. The affected or white areas are more pronounced and larger in COVID-19 patients compared to non-COVID and normal Pneumonia patients. Which is also seen in X-ray images.
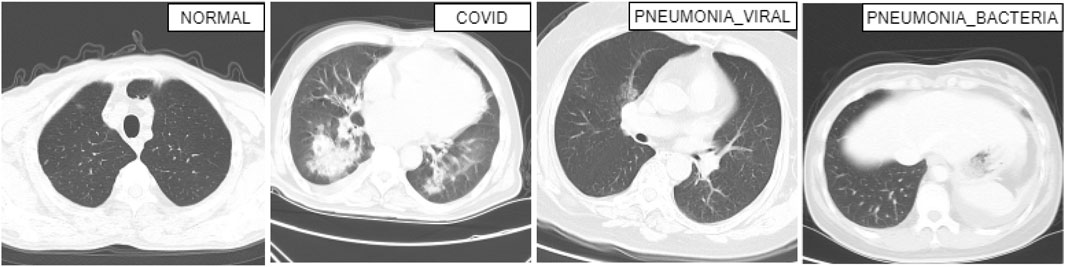
Figure 3. CT scan images for more complex scenarios (COVID, NORMAL, PNEUMONIA_VIRAL, and PNEUMONIA_BACTERIA).
2.2 Data labelling
We created three subsets from the CovRecker dataset for 2-class, 3-class, and 4-class classification of both X-ray and CT scan images, and labeled the images to train our 42-layered proposed model. We labeled COVID and NORMAL for 2 classes, COVID, NORMAL and PNEUMONIA_VIRAL for 3 classes, and COVID, NORMAL, PNEUMONIA_VIRAL and PNEUMONIA_BACTERIA for 4 class classification.
Two classes are shown in Table 3 where the number of COVID images is 1,185 for X-ray and 200 for CT scan images. There are also 1,326 X-ray images and 160 CT scan images in NORMAL scenario in Table 3. Table 4 shows the complex scenarios (i.e., COVID, NORMAL, PNEUMONIA_VIRAL) where the number of X-ray images and CT scan images remain the same for COVID and NORMAL scenarios, but for the PNEUMONIA_VIRAL scenario, the number of X-ray images is 1,330 and CT scan images is 200. Table 5 represents more complex scenarios such as COVID, NORMAL, PNEUMONIA_VIRAL, and PNEUMONIA_BACTERIA where the number of X-ray images and CT scan images remains the same as Table 4, but only for the PNEUMONIA_BACTERIA scenario, the number is 1,230 for X-ray images and 200 for CT scan images.
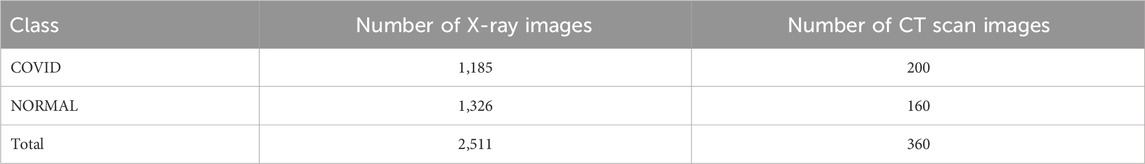
Table 3. Representing the number of X-ray and CT scan images for two-class (i.e., normal scenario) classification.
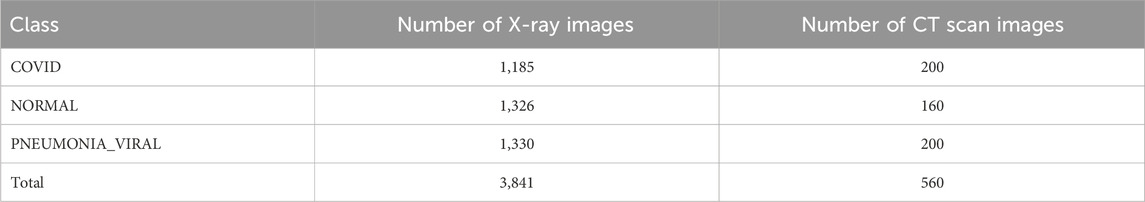
Table 4. Representing the number of X-ray and CT scan images for three-class classification (i.e., complex scenario) considering other viral infection such as PNEUMONIA_VIRAL.
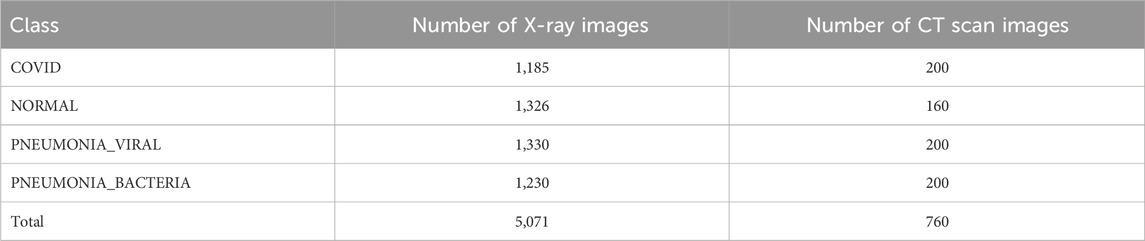
Table 5. Representing the number of X-ray and CT scan images for four-class classification (i.e., more complex scenario) considering other viral and bacterial infection such as PNEUMONIA_VIRAL and PNEUMONIA_BACTERIA.
2.3 Architecture of our proposed model
CNN, a multi-layered artificial neural network, can process large datasets with high accuracy (Shiri et al., 2023). The CNN consists of three basic layers which are Convolution Layer, Pooling Layer, and Dense Layer (Fully Connected Layer) (Ngan et al., 2024). However, in addition to these three basic layers, our proposed model contains three more widely used basic layers in CNN to make our proposed model more accurate. These are: Batch Normalization Layer, Flatten Layer, and Dropout Layer.
The first layer after receiving input is the Convolution Layer which acts as the building block of CNN. It mainly focuses on the extraction of high-level features (Zhao et al., 2024). After the convolutional layer usually comes the pooling layer. The pooling layer reduces the dimension of the input parameters and outputs a downsampled layer (Ngan et al., 2024). Then comes the batch normalization layers which is perhaps one of the most successful architectural innovations in deep learning (Segu et al., 2023). The main reasons for using this technique are to generate faster training and enable a higher learning rate (Wu et al., 2024). After that, the flatten layer is used to collapse the spatial dimensions of the input into the channel dimension. It converts the entire feature map matrix into a column and passes it down for further processing. Next comes the dense layer which is responsible for deciding which features match mostly with a specific class. The dense layer usually works with features with a specific weight and finally determines the class. CNN models sometimes overfit a training dataset due to an insufficient amount of data. This issue can be solved using a dropout layer. It acts as a regularization method and trains a lot of neural networks keeping different architectures in parallel (Salehin and Kang, 2023).
Our proposed model follows the architecture of an EfficientNet model with some modifications for working with COVID-19 detection. Figure 4 represents the architecture of our proposed model.
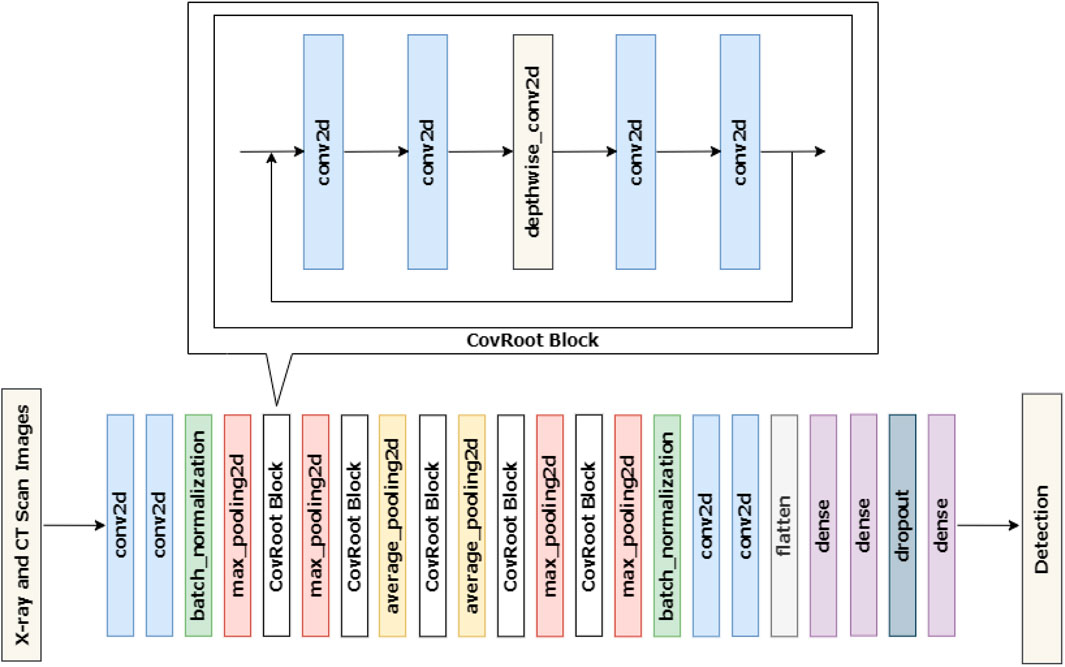
Figure 4. Architecture of our proposed 42-layer CNN model, CovRoot.
Figure 4 shows that CovRoot has 24 Conv2D layers, 4 MaxPooling2D layers, 2 AvgPooling2D layers, 2 BatchNormalization layers, 5 DepthWiseConv2D layers, 1 Flatten layer, 3 Dense layers and a Dropout layer.
To come up with our proposed model, we have tried different architectures such as VGG, ResNet, and so on. But our current architecture yields the best result and our proposed model’s training time has also been reduced. To build our proposed 42-layered CNN model, we followed a build-up process where we increased the layer count after each training session until we reached a scenario where increasing the layer count neither increased model accuracy nor decreased the training time. At first, we started with 4 conv2d layers, 2 MaxPooling layers (max_pooling2d), 1 flatten layer, 2 dense layers, and 1 CovRoot Block. Where each CovRoot Block is composed of 4 conv2d layers and 1 depthwise_conv2d layer. Afterward, we increased the number of CovRoot Blocks and Pooling layers to come up with our current CovRoot model. Here, batch_normalization and dropout layer have been used to stabilize our proposed model. The combination of max_pooling2d and avg_pooling2d layers increased the accuracy of our proposed model. We have used LeakyRelu as an activation function. We have tried with Relu and LeakyRelu and noticed better performance for LeakyRelu. So we opted for LeakyRelu. As a loss function, we have used Categorical-Cross-Entropy for 3 class and 4 class classification and Binary Cross Entropy for 2 class classification. As an optimizer, we have applied Adam for updating weight, calculating cross-entropy, and selecting the learning rate which is 0.001 in our case. We have used the callback function provided by Tensorflow API to reduce the learning rate depending on validation loss.
2.4 Training and testing dataset
Our Proposed model, CovRoot, has been trained using the labeled dataset (see in Figure 1). We have built and applied the proposed 42-layered CNN model on the training dataset. Then testing dataset was used on the deep-learning model trained and validated from the training dataset because we have used five-fold cross-validation to get a better deep-learning model. It is to be noted that we have used 5,071 X-ray and 760 CT scan images from the CovRecker dataset for training and validating our proposed model. For the evaluation of our proposed model, we have considered 15 chest X-ray images and 10 CT scan images for testing purposes for each class.
Our proposed model, CovRoot, was implemented using TensorFlow’s Keras API. Our proposed model follows the architecture of EfficientNet. This approach helped to reduce model training time and increase model accuracy. The training time for architectures such as VGG16, VGG19 and ResNetV3 was recorded as 122, 126, and 145 s respectively for each epoch. However, training time for our proposed model was recorded as 92–112 s depending on classification. This helped us to save up to 1 h on each training session.
2.5 Performance evaluation
For each class, we have discussed the performance of our proposed model for both X-ray and CT scan images by selecting some parameters in the following subsections.
2.5.1 Evaluation metrics
We have evaluated our proposed model based on well-known metrics such as specificity, sensitivity, accuracy (Parvez and Paul, 2014), precision and F1-Score (Hussain et al., 2021). These metrics are important for measuring most of the models available nowadays.
2.5.2 Performance on X-ray images
Table 6 illustrates the performance of X-ray images for 2 class, 3 class, and 4 class classification where the metrics for multi-class classification are computed using micro-averaging. It shows that in the case of X-ray images, the accuracy of our proposed model for three-class classification is 98% which is more than the accuracy for two-class and four-class images. That means given X-ray images, our model is capable of successfully detecting COVID, NORMAL and PNEUMONIA_VIRAL with a higher accuracy rate. Moreover, other metrics like Specificity, Precision and F1 score also illustrate that our 42-layered proposed model has a better performance in the case of three-class classification.
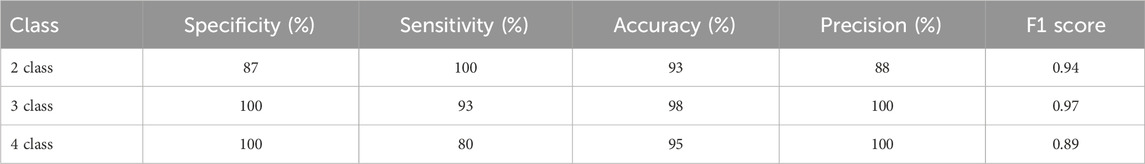
Table 6. Performance evaluation of X-ray images.
However, this is because, in the 4-class classification, there are two types of Pneumonia images. And these two images (PNEUMONIA_VIRAL and PNEUMONIA_BACTERIA) vary a little. That is why our model can not distinguish these two types of images as accurately as our model can distinguish COVID, NORMAL, and PNEUMONIA_VIRAL images.
The training and validation accuracy and the training and validation loss graphs of X-ray images for 3 class classification are shown in Figure 5. In the training and validation accuracy graph, X-axis represents the number of epochs which is 50 in our case. And the Y-axis represents accuracy. Here we can see that the accuracy fluctuated a bit for the first few epochs and then the accuracy started to increase gradually. And after 23 epochs, the value remains almost constant which is around 98%. And in the training and validation loss graph, epochs are presented in X-axis and the loss in Y-axis. Here we can see that the loss function has gradually decreased to become close to 0. As there is little difference between training loss and validation loss, it can be stated that our 42 layered proposed model is trained perfectly and it can predict better instead of being over-fitted or under-fitted.
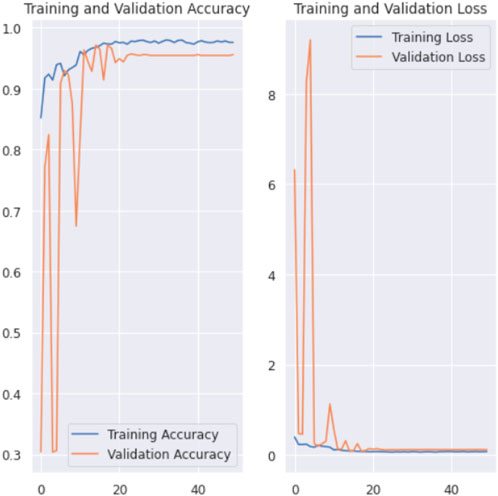
Figure 5. Training and validation accuracy and loss graph of X-ray images for 3 class classification.
2.5.3 Performance on CT scan images
Table 7 illustrates the performance of CT scan images for 2 class, 3 class and 4 class classification.
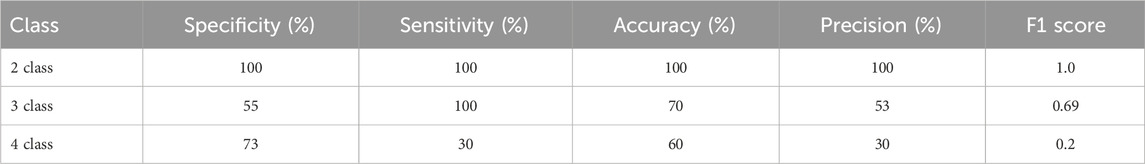
Table 7. Performance evaluation of CT scan images.
Our 42-layered proposed model performs best for two-class classification of CT scan images, achieving the highest values in each evaluation metric. However, the accuracy goes down as we add more classes to our model for CT scan images. This happens because there is little difference between the other 2 classes to be distinguished by our proposed model.
In Figure 6, the training and the validation accuracy and the training and the validation loss graphs of 3 class classification for CT scan images are shown. In case of training and validation curves, we can clearly see that there are huge fluctuations in between training accuracy and validation accuracy. And also the same result goes for training and validation loss graph.
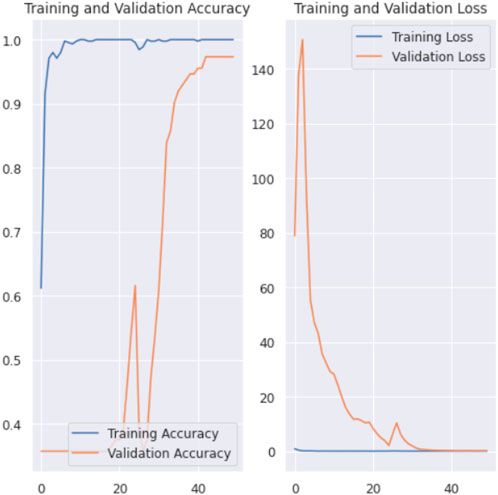
Figure 6. Training and validation accuracy and loss graph of CT scan images for 3 class classification.
3 Experimental results and discussion
In this section, we have discussed the experimental results of our proposed model CovRoot. We have compared it with some previously published models for each class for detecting COVID-19. For a more precise evaluation, we took help from a doctor.
3.1 Comparison with the existing models
As previously mentioned, other research in this area is also impressive. Many of them also tried to propose models which can also detect COVID-19 using image processing techniques. We evaluated our proposed model’s accuracy by comparing it with previous works. Tables 8–10 represent the summary of different studies that are conducted for COVID-19 detection using X-ray images, CT scan images and both types of images respectively.
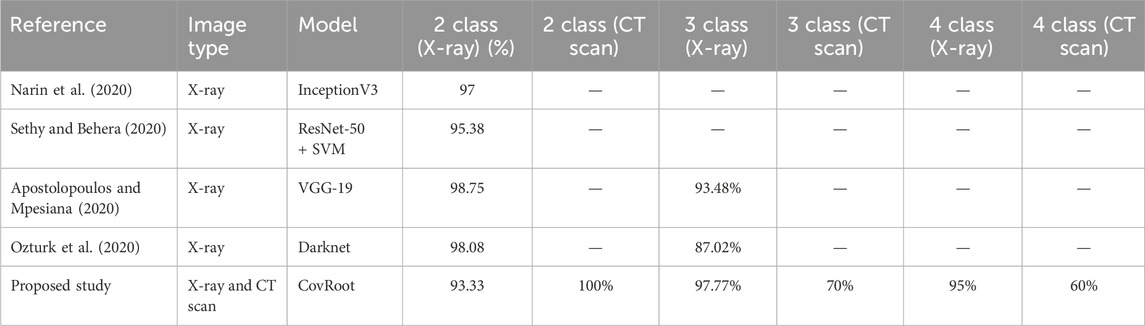
Table 8. Accuracy comparison of our proposed model, CovRoot, with other existing models for X-ray images.
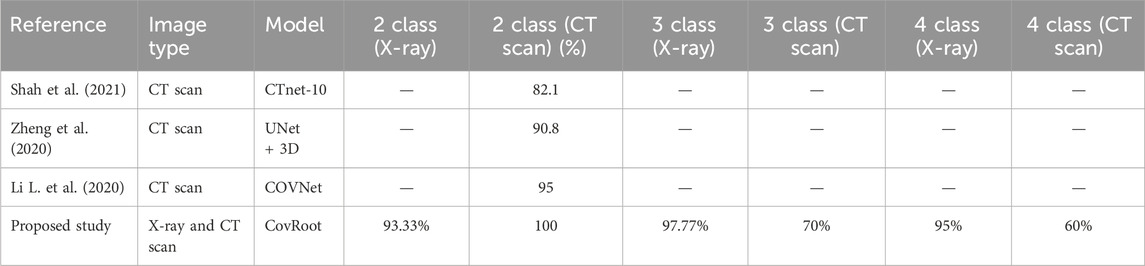
Table 9. Accuracy comparison of our proposed model, CovRoot, with other existing models for CT scan images.
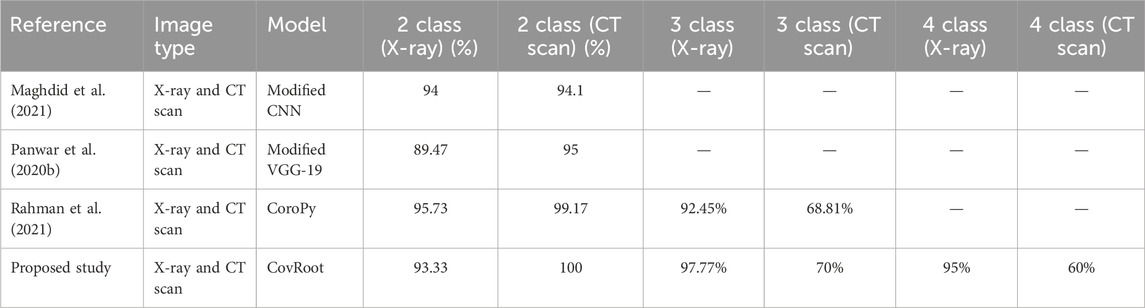
Table 10. Accuracy comparison of our proposed model, CovRoot, with other existing models for both X-ray and CT scan images.
Table 8 illustrates that Narin et al. (2020) and Sethy and Behera (2020) worked solely with X-ray images. They have only worked for COVID-19 and non-COVID-19 patients. Apostolopoulos and Mpesiana (2020) and Ozturk et al. (2020) also worked on X-ray images only, but they went one more step. They have conducted their research for detecting non-COVID, COVID-19 and Pneumonia. The research that we have discussed so far only used X-ray images. Table 9 shows that Shah et al. (2021), Zheng et al. (2020) and Li L. et al. (2020) worked on CT scan images. However, they were also limited in detecting only non-COVID and COVID-19 patients. Moreover, except for the work done by Li L. et al. (2020), others’ accuracy was not so great. Table 10 illustrates that there are a few studies where COVID-19 was detected using both image types. Among them, Panwar et al. (2020b) and Maghdid et al. (2021) classified only COVID and non-COVID cases. Rahman et al. (2021) also used both of these image types and classified normal, COVID, and viral pneumonia cases.
As far as we know, there has been no research work done till now where both these images have been used for more complex scenarios (COVID, NORMAL, PNEUMONIA_VIRAL, and PNEUMONIA_BACTERIA). So, we have developed a CNN architecture for eliminating this barrier. We are the first one to propose a CNN model where we have used both these image types to detect COVID, NORMAL, and two types of Pneumonia (PNEUMONIA_VIRAL and PNEUMONIA_BACTERIA). For our proposed study, we have generated the dataset CovRecker by gathering data from six different sources. Our proposed model has performed better in terms of accuracy compared to previously proposed models from different studies. Here, we found that for CT scan images, the performance of our model is best only for two-class classification with an accuracy of 100%. For three-class and four-class CT scan images, the performance is comparatively weak (70% and 60% respectively). However, our proposed model has shown a consistent performance for all the classes of X-ray images. Tables 8–10 explain that we have achieved the highest accuracy in three-class (97.77%) and four-class (95%) classification by using X-ray images with our proposed model compared to any other previously proposed models.
As we have briefly discussed already our proposed model has a better performance on X-ray images overall, we have tried our best to find out the most possible reason for that. In Figures 2, 3, we have shown X-ray and CT scan images of different classes. From these two figures, we can see the difference between X-ray and CT scan images. COVID-affected areas are defined by the white or greyish part. This portion is more prominent for CT scan images. For this reason, our proposed model could easily pick the features from CT scan images. Thus accuracy of 2 class classification is higher for CT scan images. On the contrary, X-ray images of both classes of pneumonia patients show quite dissimilarities which could be picked up by our model. However, this is not the case with CT scans of pneumonia patients. For this reason, the accuracy of our model drops for 3-class and 4-class classification of chest CT scan images.
3.2 Clinical evaluation
We have already mentioned that our proposed model cannot substitute the prevailing testing system. Rather it may help doctors to make an appropriate decision. To evaluate our proposed model’s performance more efficiently, we took help from a doctor and used some images randomly from our dataset. Figures 7–10 shows the obtained results of X-ray images and Figures 11–14 shows the obtained results of CT scan images. Then these images are diagnosed and explained by the doctor based on radiographical symptoms, such as focal consolidation, ground glass appearance, disseminated opacity of lung fields, etc.
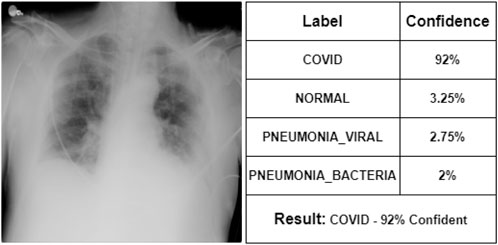
Figure 7. Representation of X-ray image of COVID.
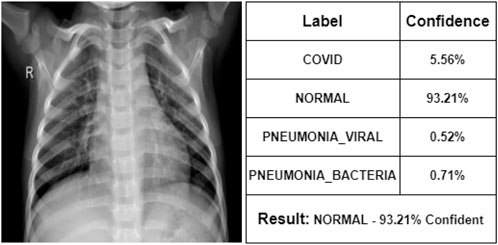
Figure 8. Representation of X-ray image of NORMAL.
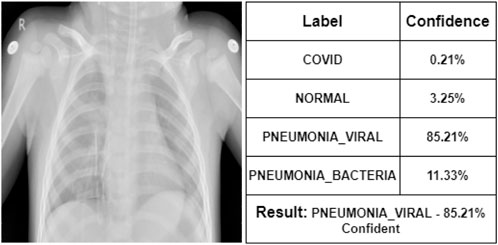
Figure 9. Representation of X-ray image of PNEUMONIA_VIRAL.
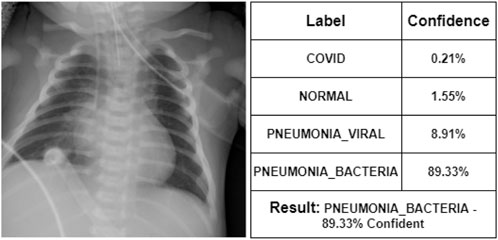
Figure 10. Representation of X-ray image of PNEUMONIA_BACTERIA.
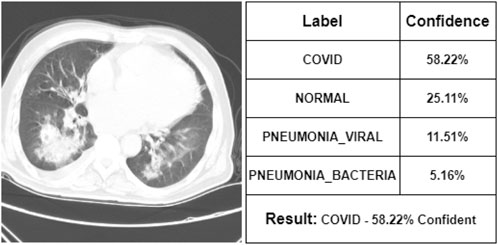
Figure 11. Representation of CT scan image of COVID.

Figure 12. Representation of CT scan image of NORMAL.

Figure 13. Representation of CT scan image of PNEUMONIA_VIRAL.
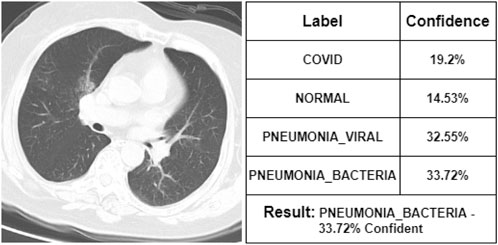
Figure 14. Representation of CT scan image of PNEUMONIA_BACTERIA.
At first, the doctor has seen some of the X-ray images. According to her, Figure 7 represents a COVID-19 infected person. We can see that our proposed model also indicates that COVID-19 with 92% confidence. She says that Figure 8 is the X-ray image of a normal person. Our proposed model also indicates that as NORMAL with 93.21% confidence. She states that Figure 9 is the X-ray image of a PNEUMONIA_VIRAL patient. Our proposed model is 85.21% confident about it. She mentions that Figure 10 is the X-ray image of a PNEUMONIA_BACTERIA patient. Our proposed model also indicates it as PNEUMONIA_BACTERIA with 89.33% confidence.
After commenting on the X-ray images, the doctor has seen some CT scan images. According to her, Figure 11 represents a COVID-19 infected person. Our proposed model is also 58.22% confident that it was the CT scan image of a COVID-19-infected person. She says that Figure 12 is the CT scan image for a normal person. And our proposed model also indicates it as NORMAL with 51.3% confidence. So, these two CT scan images were classified correctly by our proposed model though it was not fully confident about the classification. However, she states that Figure 13 is the CT scan image of a PNEUMONIA_VIRAL patient. Unfortunately, our proposed model was not confident about it and therefore wrongly classified that image as a COVID-19-infected CT scan image. Though the professional indicated it as PNEUMONIA_VIRAL, our proposed model was 52.31% confident that it was a COVID-19 case. At last, she mentions Figure 14 as a PNEUMONIA_BACTERIA case. However, again our proposed model was almost confused to classify that correctly as the CT scan image of a PNEUMONIA_BACTERIA infected person as the confidence of PNEUMONIA_VIRAL and PNEUMONIA_BACTERIA class is almost the same.
4 Conclusion
In this paper, we have proposed a novel CNN model named CovRoot which works successfully in more complex scenarios (i.e., COVID, NORMAL, PNEUMONIA_VIRAL, and PNEUMONIA_BACTERIA). From our result analysis, we have found that the performance of our proposed model is better for two-class classification where it can diagnose with 100% accuracy using CT scan images and 93.33% accuracy using X-ray images. We have also found that the performance of our proposed model is better for X-ray images in the case of three-class and four-class classifications. In the case of three-class classification, our proposed model can diagnose with 97.77% accuracy using X-ray images and 70% accuracy using CT scan images. In the case of four-class classification, the accuracy is 95% using X-ray images and 60% using CT scan images. In our experiment, we have achieved an overall better performance for X-ray images. In this research, we had limited hardware resources and less availability of dataset. Our future goal is to use updated models for better accuracy. We also have a goal of applying our model to analyze medical images of other diseases in the future.
Data availability statement
Publicly available datasets were analyzed in this study. This data can be found here: https://www.kaggle.com/datasets/jamilurrahman/covrecker2.
Author contributions
AN: Writing–review and editing, Writing–original draft, Visualization, Validation, Software, Resources, Methodology, Investigation, Formal Analysis, Data curation, Conceptualization. SF: Writing–review and editing, Writing–original draft, Visualization, Validation, Software, Resources, Methodology, Investigation, Formal Analysis, Data curation, Conceptualization. MP: Writing–review and editing, Validation, Supervision, Project administration, Methodology, Investigation, Funding acquisition, Formal Analysis, Conceptualization. SS: Writing–review and editing, Writing–original draft, Visualization, Validation, Software, Resources, Methodology, Investigation, Formal Analysis, Data curation, Conceptualization. FF: Writing–original draft, Conceptualization. MR: Writing–original draft, Validation, Software, Resources, Methodology, Formal Analysis, Data curation, Conceptualization. EH: Writing–review and editing, Conceptualization. TT: Writing–review and editing, Validation, Investigation.
Funding
The author(s) declare that no financial support was received for the research, authorship, and/or publication of this article. This research did not receive any specific grant from funding agencies in the public, commercial, or not-for-profit sectors.
Conflict of interest
The authors declare that the research was conducted in the absence of any commercial or financial relationships that could be construed as a potential conflict of interest.
Publisher’s note
All claims expressed in this article are solely those of the authors and do not necessarily represent those of their affiliated organizations, or those of the publisher, the editors and the reviewers. Any product that may be evaluated in this article, or claim that may be made by its manufacturer, is not guaranteed or endorsed by the publisher.
References
Apostolopoulos, I. D., and Mpesiana, T. A. (2020). Covid-19: automatic detection from x-ray images utilizing transfer learning with convolutional neural networks. Phys. Eng. Sci. Med. 43 (2), 635–640. doi:10.1007/s13246-020-00865-4
Asif, S., Wenhui, Y., Jin, H., Tao, Y., and Jinhai, S. (2020). “Classification of covid-19 from chest x-ray images using deep convolutional neural networks,” in 2020 IEEE 6th International Conference on Computer and Communications (ICCC), Chengdu, China, December 11–14, 2020.
Cohen, J. P. (2020). covid-chestxray-dataset. Available at: https://github.com/ieee8023/covid-chestxray-dataset.
Cohen, J. P., Dao, L., Morrison, P., Roth, K., Bengio, Y., Shen, B., et al. (2020). Predicting covid-19 pneumonia severity on chest x-ray with deep learning. Cureus. 12 (7), e9448. doi:10.7759/cureus.9448
Cucinotta, D., and Vanelli, M. (2020). WHO declares COVID-19 a pandemic. Acta Bio Medica Atenei Parm. 91 (1), 157–160. doi:10.23750/abm.v91i1.9397
Eduardo, P. (2020). SARS-CoV-2 CT-scan dataset: a large dataset of real patients CT scans for SARS-CoV-2 identification. Available at: https://www.kaggle.com/plameneduardo/sarscov2-ctscan-dataset.
Gharieb, R. R. (2022). X-rays and computed tomography scan imaging: instrumentation and medical applications. Tomogr. (CT) Scan 1. doi:10.5772/intechopen.101808
Hussain, E., Hasan, M., Rahman, M. A., Lee, I., Tamanna, T., and Parvez, M. Z. (2021). CoroDet: a deep learning based classification for COVID-19 detection using chest X-ray images. Chaos, Solit. and Fractals 142, 110495. doi:10.1016/j.chaos.2020.110495
Khan, A. I., Shah, J. L., and Bhat, M. M. (2020). Coronet: a deep neural network for detection and diagnosis of COVID-19 from chest x-ray images. Comput. Methods Programs Biomed. 196, 105581. doi:10.1016/j.cmpb.2020.105581
Khoong, W. H. (2020). COVID-19 xray dataset (train& test sets) with COVID-19 CNN pneumonia detector. Available at: https://www.kaggle.com/khoongweihao/covid19-xray-dataset-train-test-sets.
Li, L., Qin, L., Xu, Z., Yin, Y., Wang, X., Kong, B., et al. (2020). Artificial intelligence distinguishes COVID-19 from community acquired pneumonia on chest ct. Radiology, 200905. doi:10.1148/radiol.2020200905
Li, R., Pei, S., Chen, B., Song, Y., Zhang, T., Yang, W., et al. (2020). Substantial undocumented infection facilitates the rapid dissemination of novel coronavirus (SARS-CoV-2). Science 368 (6490), 489–493. doi:10.1126/science.abb3221
Maghdid, H. S., Asaad, A. T., Ghafoor, K. Z., Sadiq, A. S., Mirjalili, S., and Khan, M. K. (2021). Diagnosing COVID-19 pneumonia from X-ray and CT images using deep learning and transfer learning algorithms. Multimodal Image Exploitation Learn. 11734, 117340E. doi:10.1117/12.2588672
Mahmud, T., Rahman, M. A., and Fattah, S. A. (2020). CovXNet: a multi-dilation convolutional neural network for automatic COVID-19 and other pneumonia detection from chest X-ray images with transferable multi-receptive feature optimization. Comput. Biol. Med. 122, 103869. doi:10.1016/j.compbiomed.2020.103869
Narin, A., Kaya, C., and Pamuk, Z. (2020). Automatic detection of coronavirus disease (covid-19) using x-ray images and deep convolutional neural networks. Pattern Anal Appl. 24 (3), 1207–1220. doi:10.1007/s10044-021-00984-y
Ngan, K. H., Mansouri-Benssassi, E., Phelan, J., Townsend, J., and Garcez, A. D. A. (2024). From explanation to intervention: interactive knowledge extraction from Convolutional Neural Networks used in radiology. Plos one 19 (4), e0293967. doi:10.1371/journal.pone.0293967
Ozturk, T., Talo, M., Yildirim, E. A., Baloglu, U. B., Yildirim, O., and Acharya, U. R. (2020). Automated detection of COVID-19 cases using deep neural networks with X-ray images. Comput. Biol. Med. 121, 103792. doi:10.1016/j.compbiomed.2020.103792
Panwar, H., Gupta, P. K., Siddiqui, M. K., Morales-Menendez, R., Bhardwaj, P., and Singh, V. (2020b). A deep learning and grad-CAM based color visualization approach for fast detection of COVID-19 cases using chest X-ray and CT-Scan images. Chaos, Solit. Fractals 140, 110190. doi:10.1016/j.chaos.2020.110190
Panwar, H., Gupta, P. K., Siddiqui, M. K., Morales-Menendez, R., and Singh, V. (2020a). Application of deep learning for fast detection of COVID-19 in X-rays using nCOVnet. Chaos, Solit. Fractals 138, 109944. doi:10.1016/j.chaos.2020.109944
Parvez, M. Z., and Paul, M. (2014). Epileptic seizure detection by analyzing EEG signals using different transformation techniques. neurocomputing 145, 190–200. doi:10.1016/j.neucom.2014.05.044
Pereira, R. M., Bertolini, D., Teixeira, L. O., Silla Jr, C. N., and Costa, Y. M. (2020). COVID-19 identification in chest X-ray images on flat and hierarchical classification scenarios. Comput. Methods Programs Biomed. 194, 105532. doi:10.1016/j.cmpb.2020.105532
Rahman, M., Niloy, A. H., Shiba, S. A., Fahim, S. M., Faria, F. N., Hussain, E., et al. (2021). “CoroPy: a deep learning based comparison between X-ray and CT scan images in covid-19 detection and classification,” in International conference on bioengineering and biomedical signal and image processing, Gran Canaria, Spain, July 19–21, 2021 (Springer), 392–404.
Rahman, T. (2020). COVID-19 radiography database COVID-19 chest X-ray database. Available at: https://www.kaggle.com/tawsifurrahman/covid19-radiography-database.
Sadeghi Mofrad, S., Boozarjomehri Amnieh, S., Pakzad, M. R., Zardadi, M., Ghazanfari Jajin, M., Anvari, E., et al. (2024). The death rate of COVID-19 infection in different SARS-CoV-2 variants was related to C-reactive protein gene polymorphisms. Sci. Rep. 14 (1), 703. doi:10.1038/s41598-024-51422-y
Salehin, I., and Kang, D. K. (2023). A review on dropout regularization approaches for deep neural networks within the scholarly domain. Electronics 12 (14), 3106. doi:10.3390/electronics12143106
Segu, M., Tonioni, A., and Tombari, F. (2023). Batch normalization embeddings for deep domain generalization. Pattern Recognit. 135, 109115. doi:10.1016/j.patcog.2022.109115
Sethy, P. K., and Behera, S. K. (2020). Detection of coronavirus disease (covid-19) based on deep features. Preprints, 2020030300. doi:10.20944/preprints202003.0300.v1
Shah, V., Keniya, R., Shridharani, A., Punjabi, M., Shah, J., and Mehendale, N. (2021). Diagnosis of COVID-19 using CT scan images and deep learning techniques. Emerg. Radiol. 28, 497–505. doi:10.1007/s10140-020-01886-y
Shiri, F. M., Perumal, T., Mustapha, N., and Mohamed, R. (2023). A comprehensive overview and comparative analysis on deep learning models: CNN, RNN, LSTM, GRU. arXiv Prepr. arXiv:2305.17473. doi:10.48550/arXiv.2305.17473
Shrestha, N., Shad, M. Y., Ulvi, O., Khan, M. H., Karamehic-Muratovic, A., Nguyen, U. S. D., et al. (2020). The impact of COVID-19 on globalization. One Health.100180. doi:10.1016/j.onehlt.2020.100180
Tuncer, T., Dogan, S., and Ozyurt, F. (2020). An automated Residual Exemplar Local Binary Pattern and iterative ReliefF based COVID-19 detection method using chest X-ray image. Chemom. Intelligent Laboratory Syst. 203, 104054. doi:10.1016/j.chemolab.2020.104054
UCSD-AI4H (2020). COVID-CT. Available at: https://github.com/UCSD-AI4H/COVID-CT.
Wang, L., Lin, Z. Q., and Wong, A. (2020). Covid-net: a tailored deep convolutional neural network design for detection of covid-19 cases from chest x-ray images. Sci. Rep. 10 (1), 19549–19612. doi:10.1038/s41598-020-76550-z
Wu, Y., Chi, Z., Wang, Y., Plataniotis, K. N., and Feng, S. (2024). Test-time domain adaptation by learning domain-aware batch normalization. Proc. AAAI Conf. Artif. Intell. 38 (14), 15961–15969. doi:10.1609/aaai.v38i14.29527
Yan, T. (2020). COVID-19 and common pneumonia chest CT dataset (416 COVID-19 positive CT scans). Available at: https://data.mendeley.com/datasets/3y55vgckg6/2.
Zhao, X., Wang, L., Zhang, Y., Han, X., Deveci, M., and Parmar, M. (2024). A review of convolutional neural networks in computer vision. Artif. Intell. Rev. 57 (4), 99. doi:10.1007/s10462-024-10721-6
Keywords: convolutional neural network, deep learning, COVID-19, X-ray, CT scan
Citation: Niloy AH, Fahim SMFA, Parvez MZ, Shiba SA, Faria FN, Rahman MJ, Hussain E and Tamanna T (2024) CovRoot: COVID-19 detection based on chest radiology imaging techniques using deep learning. Front. Sig. Proc. 4:1384744. doi: 10.3389/frsip.2024.1384744
Received: 10 February 2024; Accepted: 06 August 2024;
Published: 20 September 2024.
Edited by:
Michalis Savelonas, University of Thessaly, GreeceReviewed by:
Pushpendra Singh, Jawaharlal Nehru University, IndiaDimitra-Christina Koutsiou, University of Thessaly, Greece
Copyright © 2024 Niloy, Fahim, Parvez, Shiba, Faria, Rahman, Hussain and Tamanna. This is an open-access article distributed under the terms of the Creative Commons Attribution License (CC BY). The use, distribution or reproduction in other forums is permitted, provided the original author(s) and the copyright owner(s) are credited and that the original publication in this journal is cited, in accordance with accepted academic practice. No use, distribution or reproduction is permitted which does not comply with these terms.
*Correspondence: Mohammad Zavid Parvez, bXBhcnZlekBjc3UuZWR1LmF1
†Present address: Mohammad Zavid Parvez, School of Accounting, Information Systems, and Supply Chain, RMIT University, Melbourne, VIC, Australia