Explore article hub
 Polina Shichkova1*†
 Jay S. Coggan1
 Lida Kanari1
 Elvis Boci1,2
 Cyrille Favreau1
 Stefano Maximiliano Antonel1
 Daniel Keller1,2
 Henry Markram1,2,3*
- 1Blue Brain Project, École Polytechnique Fédérale de Lausanne, Geneva, Switzerland
- 2Open Brain Institute, Lausanne, Switzerland
- 3Laboratory of Neural Microcircuitry, Brain Mind Institute, École Polytechnique Fédérale de Lausanne, Lausanne, Switzerland
Abstract
Age-related neurodegenerative disorders, including dementia, are a major global health concern. This article describes the first comprehensive, data-driven molecular model of the neuro-glia-vascular system to explore the complex relationships between the aging brain, energy metabolism, blood flow, and neuronal activity. Comprising 16,800 interaction pathways, the model includes all key enzymes, transporters, metabolites, and circulatory factors vital for neuronal electrical activity. We found significant alterations in metabolite concentrations and differential effects on adenosine triphosphate (ATP) supply in neurons and astrocytes and within subcellular compartments in aged brains and identified reduced sodium/potassium adenosine triphosphatase (Na+/K+-ATPase) activity as the leading cause of impaired neuronal action potentials. The model predicts that the metabolic pathways cluster more closely in the aged brain, suggesting a loss of robustness and adaptability. Additionally, the aged metabolic system displays reduced flexibility, undermining its capacity to efficiently respond to stimuli and recover from damage. Through transcription factor analysis, the estrogen-related receptor alpha (ESRRA) emerged as a central target connected to these aging-related changes. An unguided optimization search pinpointed potential interventions capable of restoring the brain’s metabolic flexibility and action potential generation. These strategies include increasing the nicotinamide adenine dinucleotide (NADH) cytosol-mitochondria shuttle, NAD+ pool, the ketone β-hydroxybutyrate, lactate, and Na+/K+-ATPase, while reducing blood glucose levels. The model is open sourced to help guide further research into brain metabolism.
Key points
- This is the most comprehensive molecular model of the neuro-glia-vascular system to date, integrating the key cellular and subcellular systems, molecules, metabolic pathways, and processes required to couple neuronal electrical behavior with brain energy metabolism and blood flow.
- Supplied with publicly available RNA sequencing data, the model closely reproduces known aging-related changes in brain metabolism and electrical activity, validating its utility as a research tool.
- The model predicted reduced robustness, flexibility, and metabolic adaptability in the aged brain and identified various aging-associated transcription factors and potential anti-aging therapies and strategies.
- We show that astrocytes may subserve the metabolic stability of neurons during aging, calling into question previous assumptions about selfish glia.
- This open-source resource should help accelerate research to improve our understanding of age-related neurodegenerative diseases (such as dementia) and how their onset could be prevented or delayed.
Introduction
The rise in neurodegenerative disorders, including dementia, is a leading public health and social care challenge around the world (1), and the risks of these and other disorders increase dramatically with age (2, 3). Globally, the number of people living with dementia is projected to increase from approximately 57 million cases in 2019 to 153 million in 2050, largely owing to population growth and aging (4). Accumulating evidence suggests that the onset of neurodegenerative diseases may be prevented or delayed by addressing modifiable risk factors, for example through lifestyle changes and other interventions—many of which are subject to ongoing investigations (1, 5–7).
Improving our understanding of the pathophysiology of age-related neurological degeneration is vital to identify new targets, interventions, and biomarkers. While traditional biomedical research techniques remain necessary to reveal key factors, they are insufficient for a comprehensive understanding of all the data and complex relationships. Complementary computational techniques that create data-driven models offer hope. With these in silico experiments we can uniquely probe the functions of complex biochemical and cellular networks to gain insights and more efficiently guide future laboratory initiatives.
There is a virtual catalog of speculated root causes of neurodegenerative diseases (8). Among the most cited and fundamental to brain aging is energy metabolism (9–12). A recent addition to this body of evidence has shown that rescuing mitochondrial function can even reduce synaptic loss in aging, one of the main correlates of dementia (13).
Neuronal activity is energetically demanding, requiring substantial amounts of adenosine triphosphate (ATP), as reflected in the disproportionate oxygen and glucose consumption of the brain compared with the rest of the body (14–17). Metabolic support and neuronal activity are closely linked (18), suggesting that age-related loss of metabolic support impairs the generation of electrical activity in the brain. However, the vast number of biochemical reactions forming the metabolic system make it highly complex, therefore it is exceedingly difficult to isolate how changes in that system impact neuronal activity.
Various dynamic models of brain metabolism have been developed over the decades. Early models (19, 20) focused on core components of the metabolic system and generalized many processes, such as mitochondrial respiration. Recent models have incorporated more detailed descriptions for selected subsystems, such as the pentose phosphate pathway (21), mitochondrial metabolism (22, 23), or neuronal electrophysiology (24). These models are well-validated and suitable for the research questions for which they were designed. However, a model with far greater biological detail is required to tackle more complex questions, such as how age-related changes in metabolism affect action potential generation and responses to stimuli.
This article presents a novel model of the neuro-glia-vascular (NGV) system that integrates previous models and adds greater detail and previously omitted subsystems. As the literature and databases contain extensive data relating to brain metabolism, we adopted a strict data-driven strategy to constrain the construction of this model, using relevant data to reconstruct and simulate metabolic systems in both the young and aged brain. The model integrates all key metabolites, transporters, and enzymes with all key cellular and extracellular processes underlying neuronal firing and their interactions with the blood (Figure 1), yielding a comprehensive representation of the biochemical network operating across the NGV system. It includes glutathione metabolism and regulation of glycogenolysis; it also couples the metabolic system to the intricate cellular processes underlying action potential generation, such as the sodium/potassium adenosine triphosphatase (Na+/K+-ATPase) pump, the glutamate-glutamine cycle, and ATP production by mitochondria and the cytosol. This allows the simulation of electrical activity impacting the metabolic system and vice versa. Subcompartments such as the mitochondrial matrix and intermembrane space, cytosol in neurons and astrocytes, endothelium, and the extracellular space (interstitium and basal lamina) are represented, allowing modeling of cross-compartment processes such as transport and exchange. Finally, the model also integrates blood flow and dynamic exchanges between the vasculature and the neurons and glia, thereby allowing research questions related to nutrient supply to the brain to be addressed. The model does not capture metabolic waste management, such as lactate removal, or the mechanistic effects of cerebral blood flow regulation with neuronal activation. Owing to limited data, the model also does not account for the changes in oxygen availability and transport with aging, even though oxygen is an important factor that affects multiple processes in the cell. Concentrations of molecules are specified in molar units (mM) and fluxes of reactions and transport processes are given in molar concentrations per second (mM/second). The model is openly available to facilitate its reuse in future studies (see “Data availability” below for links).
Figure 1

Figure 1. Model overview. The model consists of three connected sub-systems: metabolism, neuronal electrophysiology, and blood flow. Compartments of the model include the neuronal and astrocytic cytosol, mitochondrial matrix and intermembrane space, interstitium, basal lamina, endothelium, capillary, artery (only with fixed arterial concentrations of nutrients and oxygen), and endoplasmic reticulum (only with fixed pool of calcium). Enzymes and transporters shown correspond to the rate equations in the model that govern the dynamics of metabolite concentration changes. Neuronal electrophysiology is modeled in a slightly extended Hodgkin-Huxley-type model. Blood flow activation is described by a simple function dependent on the stimulus onset and duration according to the literature models. For abbreviations, see Figure note section.
We validated the model extensively against reported experimental data (not used to construct the model) on how enzyme and transporter activities and metabolite concentrations change in response to stimulation (Presentation 1: Supplementary Figure S1, Presentation 1: Full Annex - Supplementary Table S1). The consistency between the simulation and experimental data suggests that the model accurately captures the most essential elements of the metabolic system of the brain.
Alterations in enzyme expression have recently been shown to actively contribute to tissue aging and therefore offer potential drug targets to counter aging (25). To model aging of NGV metabolism, we therefore used RNA expression changes (RNA fold changes) from a comprehensive study on mouse cell-type changes (26, 27) to scale enzyme and transporter concentrations. These concentrations determine the output from their corresponding reaction/transport rate equations. Applying the RNAseq data (26, 27) to the respective metabolic pathways allows us to observe the decrease in expression of most enzymes with aging in both neurons and astrocytes. In addition to changes in enzyme and transporter expression, we used published values to adjust arterial glucose, lactate, β-hydroxybutyrate levels, total nicotinamide adenine dinucleotide (NAD; reduced and oxidized) pool, and glutamate concentration changes caused by synaptic transmission (28, 29). The metabolic system of a young brain is in an equilibrium at rest, i.e., when no stimulus is applied. To be able to compare the young and aged models, we ensured that the aged system was also in a steady state by reducing the NADH shuttle capacity between the cytosol and mitochondria. Figure 2 summarizes all aging data applied to the model, with further details available in the Methods section. When we simulated the dynamics of this complex system, driven by either synaptic input or current injection that generated action potentials, we observed numerous age-specific differences consistent with prior reports (Presentation 1: Full Annex - Supplementary Table S1). This further validated the model, provided a spectrum of new insights into how the NGV metabolic system may age, and allowed us to identify potential strategic interventions that could repair the aging metabolic system, which could take the form of dietary and lifestyle changes or even drug targets.
Figure 2
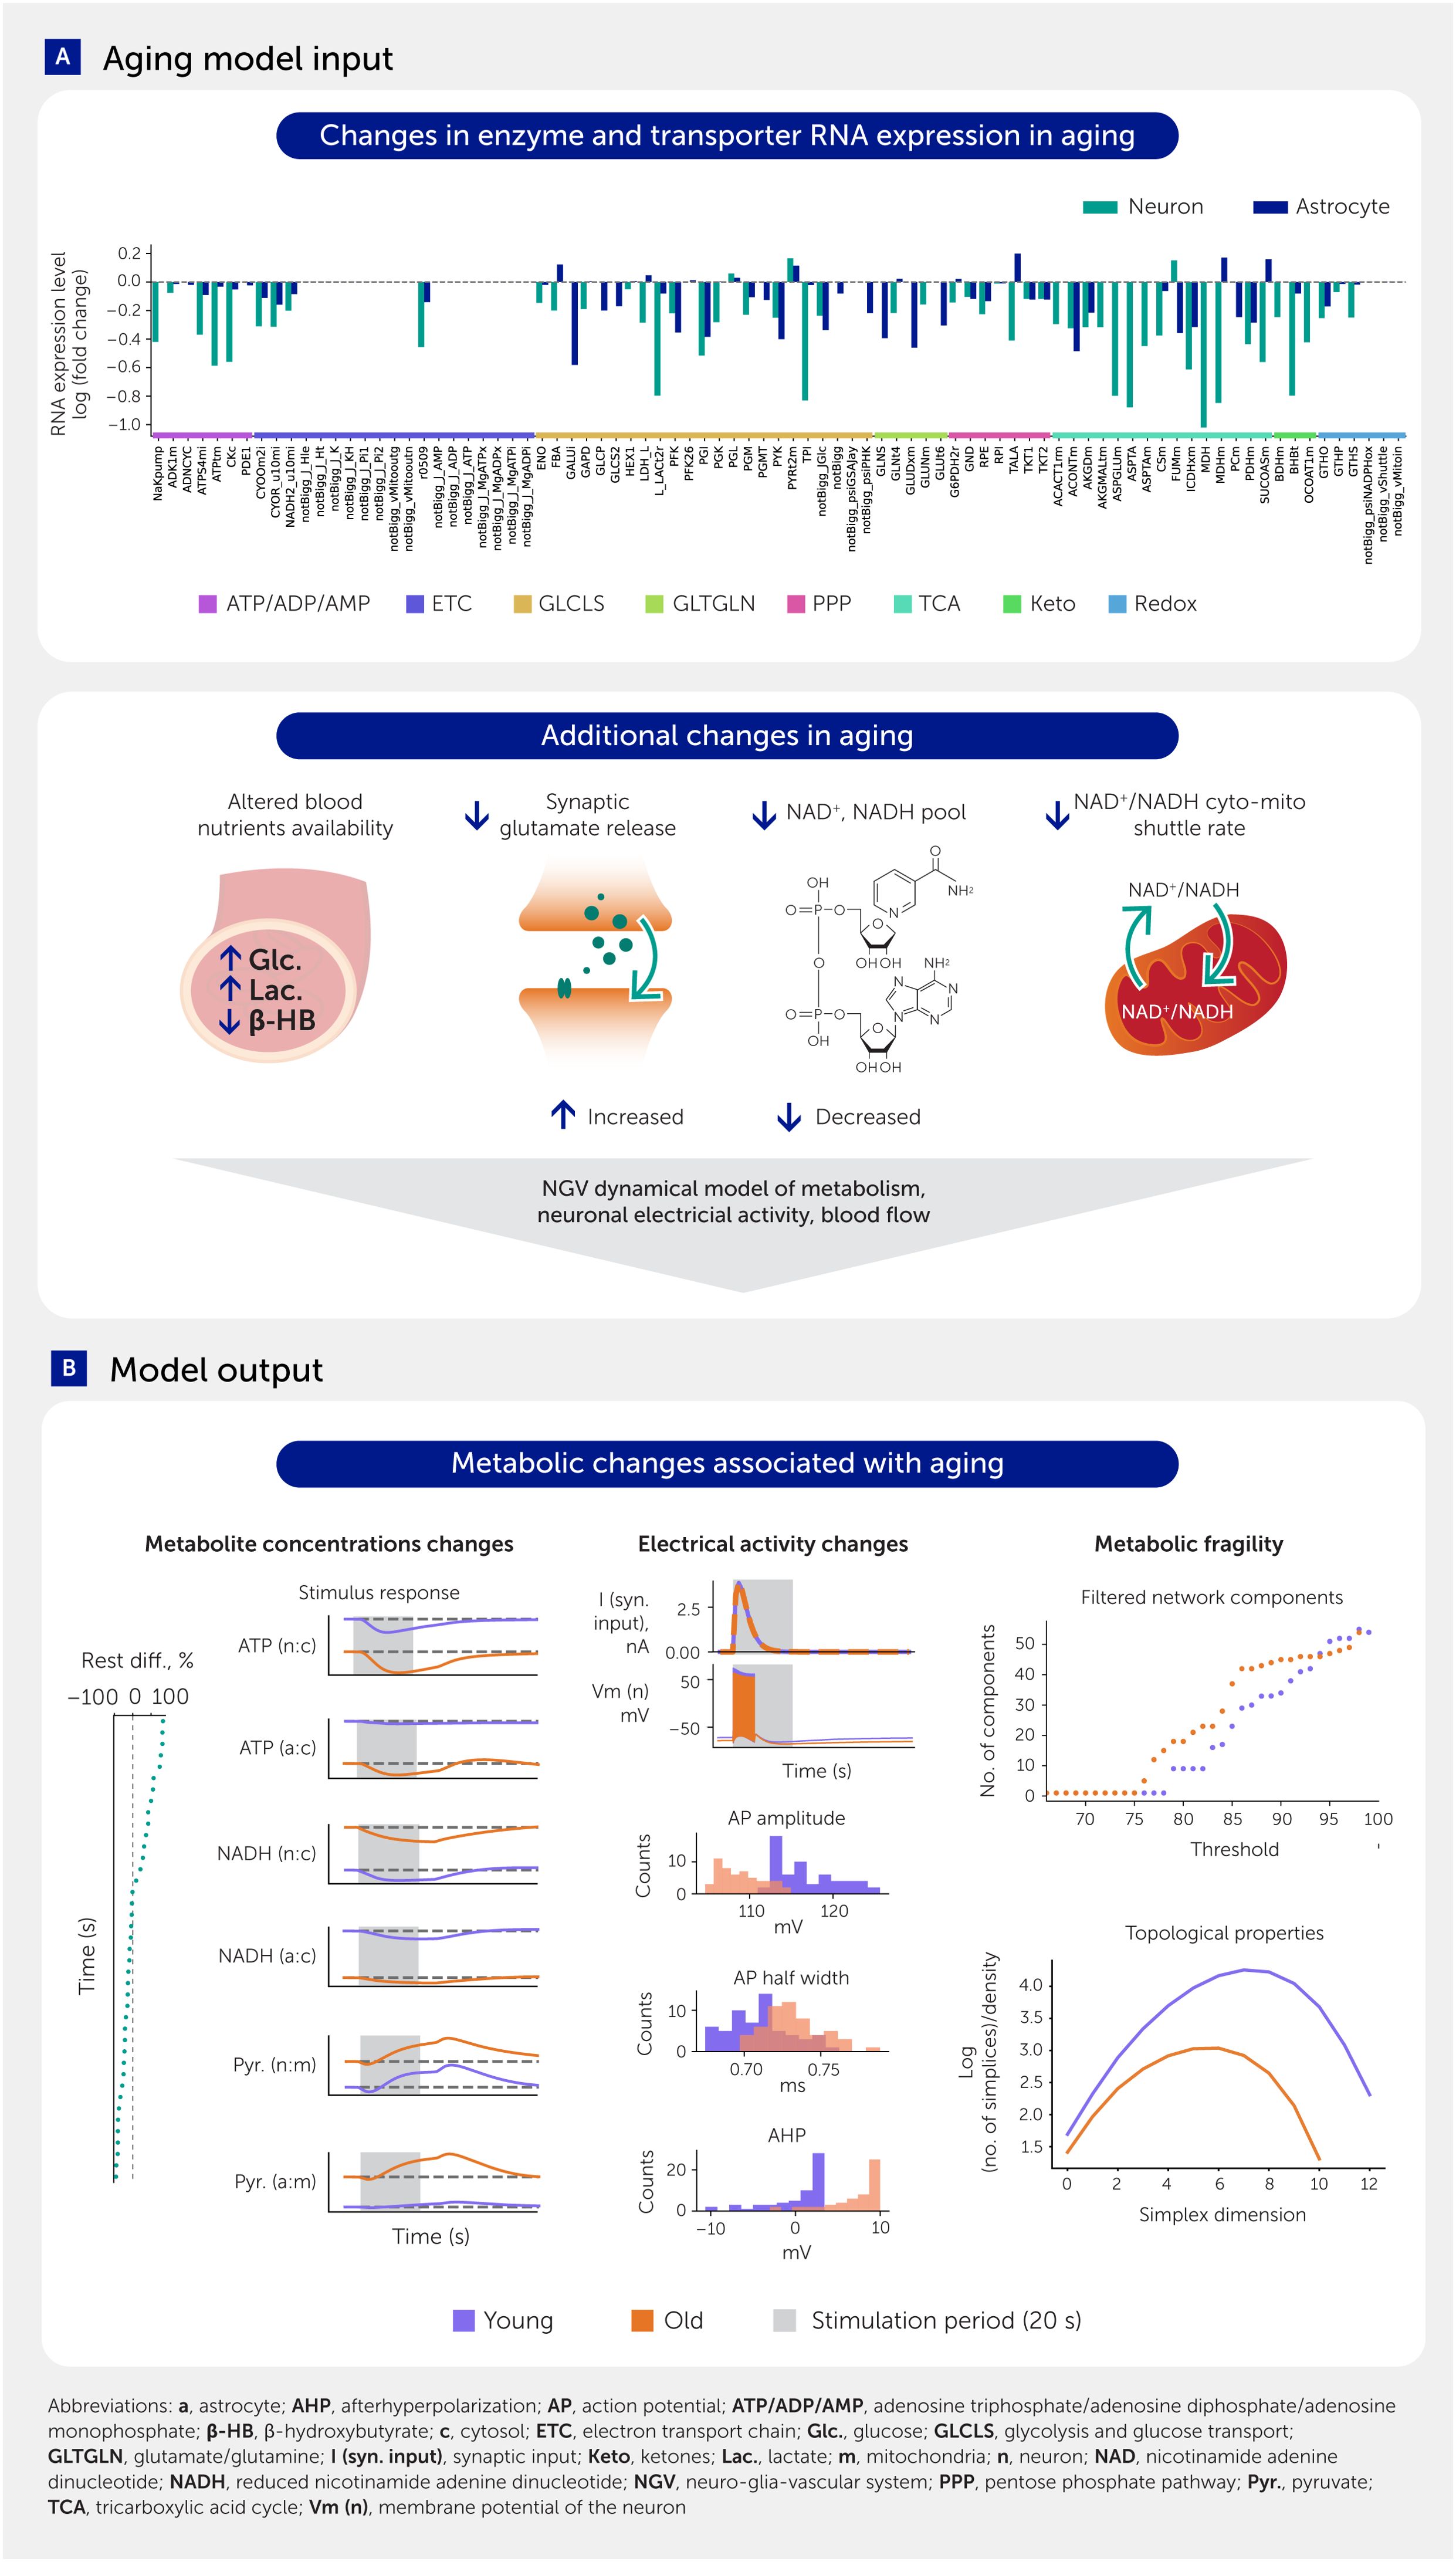
Figure 2. Aging model input and results overview. (A) Aging input is modeled with RNA expression fold changes of enzymes and transporters, scaling of arterial glucose, lactate, and β-hydroxybutyrate, as well as the total nicotinamide adenine dinucleotide (NAD; reduced and oxidized) pool, synaptic effects of glutamate concentration changes upon release events, and the reducing equivalents (NADH-related) shuttle between cytosol and mitochondria. (B) The key results include aging effects on metabolite levels, electrical activity of the neurons, and changes in adaptivity of the system in response to kinetic parameter perturbations (mimicking molecular damage and other conditions affecting enzyme and transporter functions).
Results
Aging affects metabolite levels at rest and during stimuli
In our model, the simulated aging brain phenotype exhibits a distinct resting state profile of metabolite concentrations when compared with that of the young brain (Presentation 1: Supplementary Figure S3A). Changes in metabolite concentrations in response to stimuli also differ between the young and aging brain (Figure 3C, Figure 4; Presentation 1: Supplementary Figures 3SB, S4, S5D, S6A), but metabolites differ in their changes in response to stimuli of varying amplitudes (Presentation 1: Supplementary Figures S6, S7). We performed uniform manifold approximation and projection (UMAP) for dimensionality reduction on relative differences in concentration traces between the two ages and observed numerous interdependencies between pathways. The pentose phosphate pathway (PPP) and tricarboxylic acid cycle (TCA) tend to form pathway-related clusters (Presentation 1: Supplementary Figure S8). Moreover, the pairwise Kendall correlation between metabolic concentration temporal profiles is also affected by aging: some pairs of metabolites showed more correlated response to stimuli, while the response of other pairs either did not change or decreased (Presentation 1: Supplementary Figure S9). This effect may be caused by the widely described metabolic dysregulation in aging (11). Reaction and transport fluxes are also impacted (Presentation 1: Supplementary Figures S10–S12). Aging effects on metabolite concentrations at rest and in response to stimuli are therefore metabolite-specific and largely uncorrelated, indicative of a fragmentation of the metabolic network in aging.
Figure 3
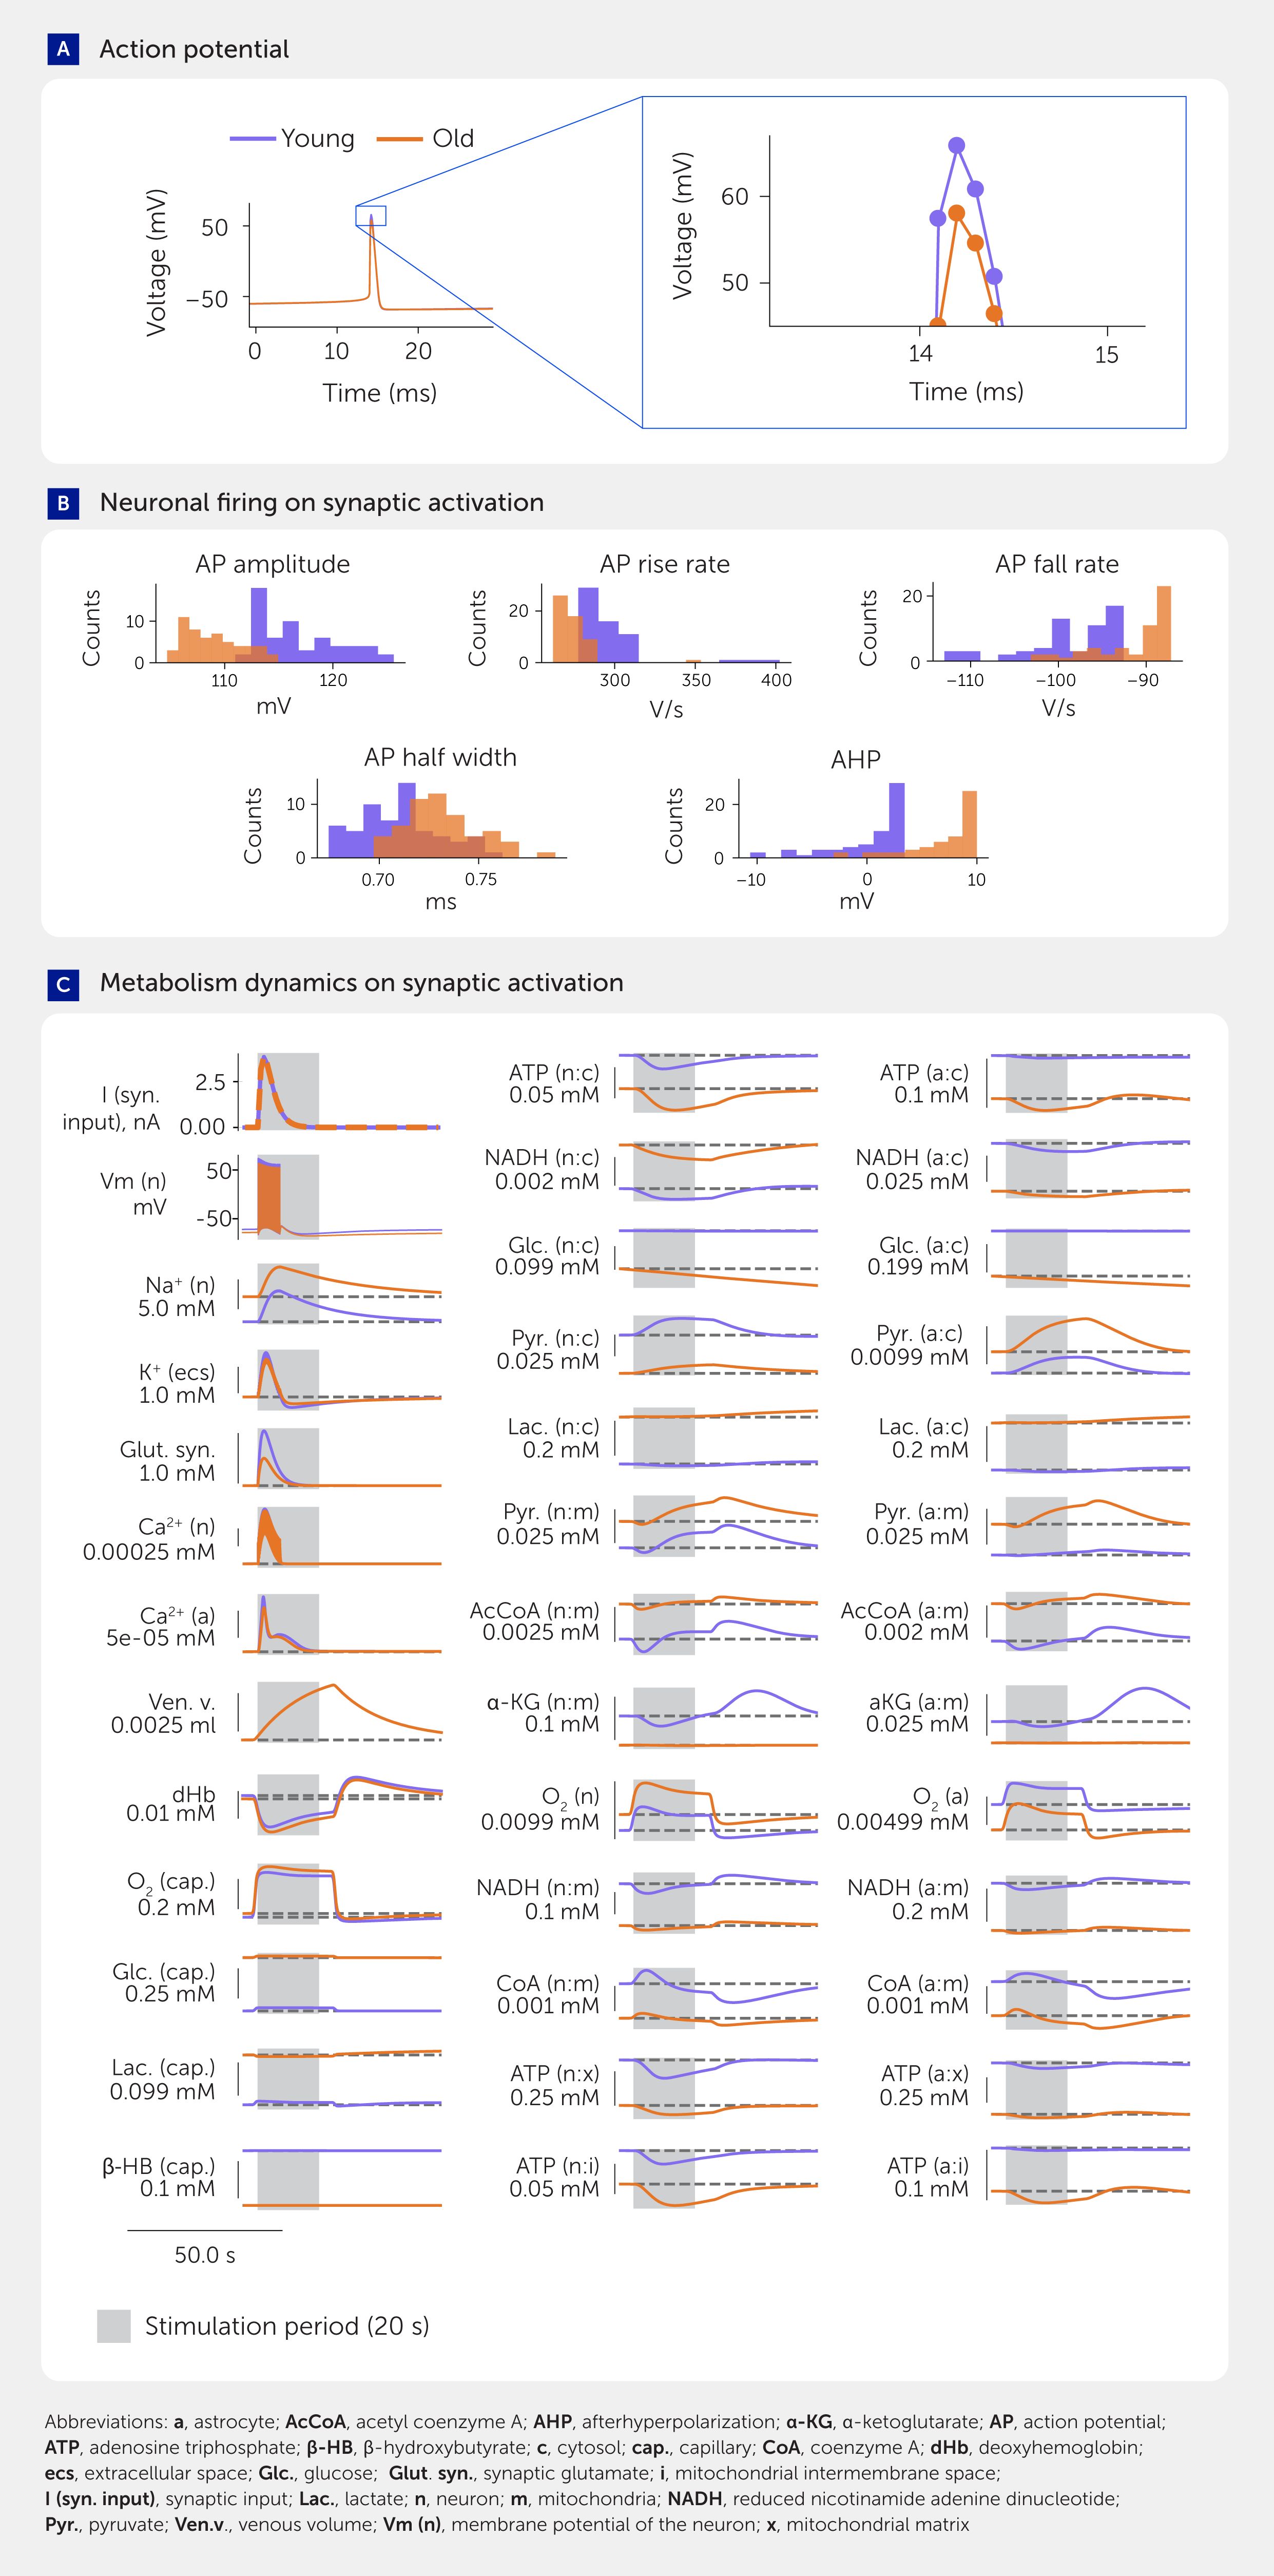
Figure 3. Simulation results comparing neural firing and metabolism in young and aged brains. (A) Example action potential in voltage traces in simulations of young and aged neurons with insets providing a closer view. (B) Characteristics of neuronal firing in young and aged brains upon synaptic activation. (C) Dynamics of metabolism in response to synaptic activation at different ages (only a selection of the most important variables is shown).
Figure 4
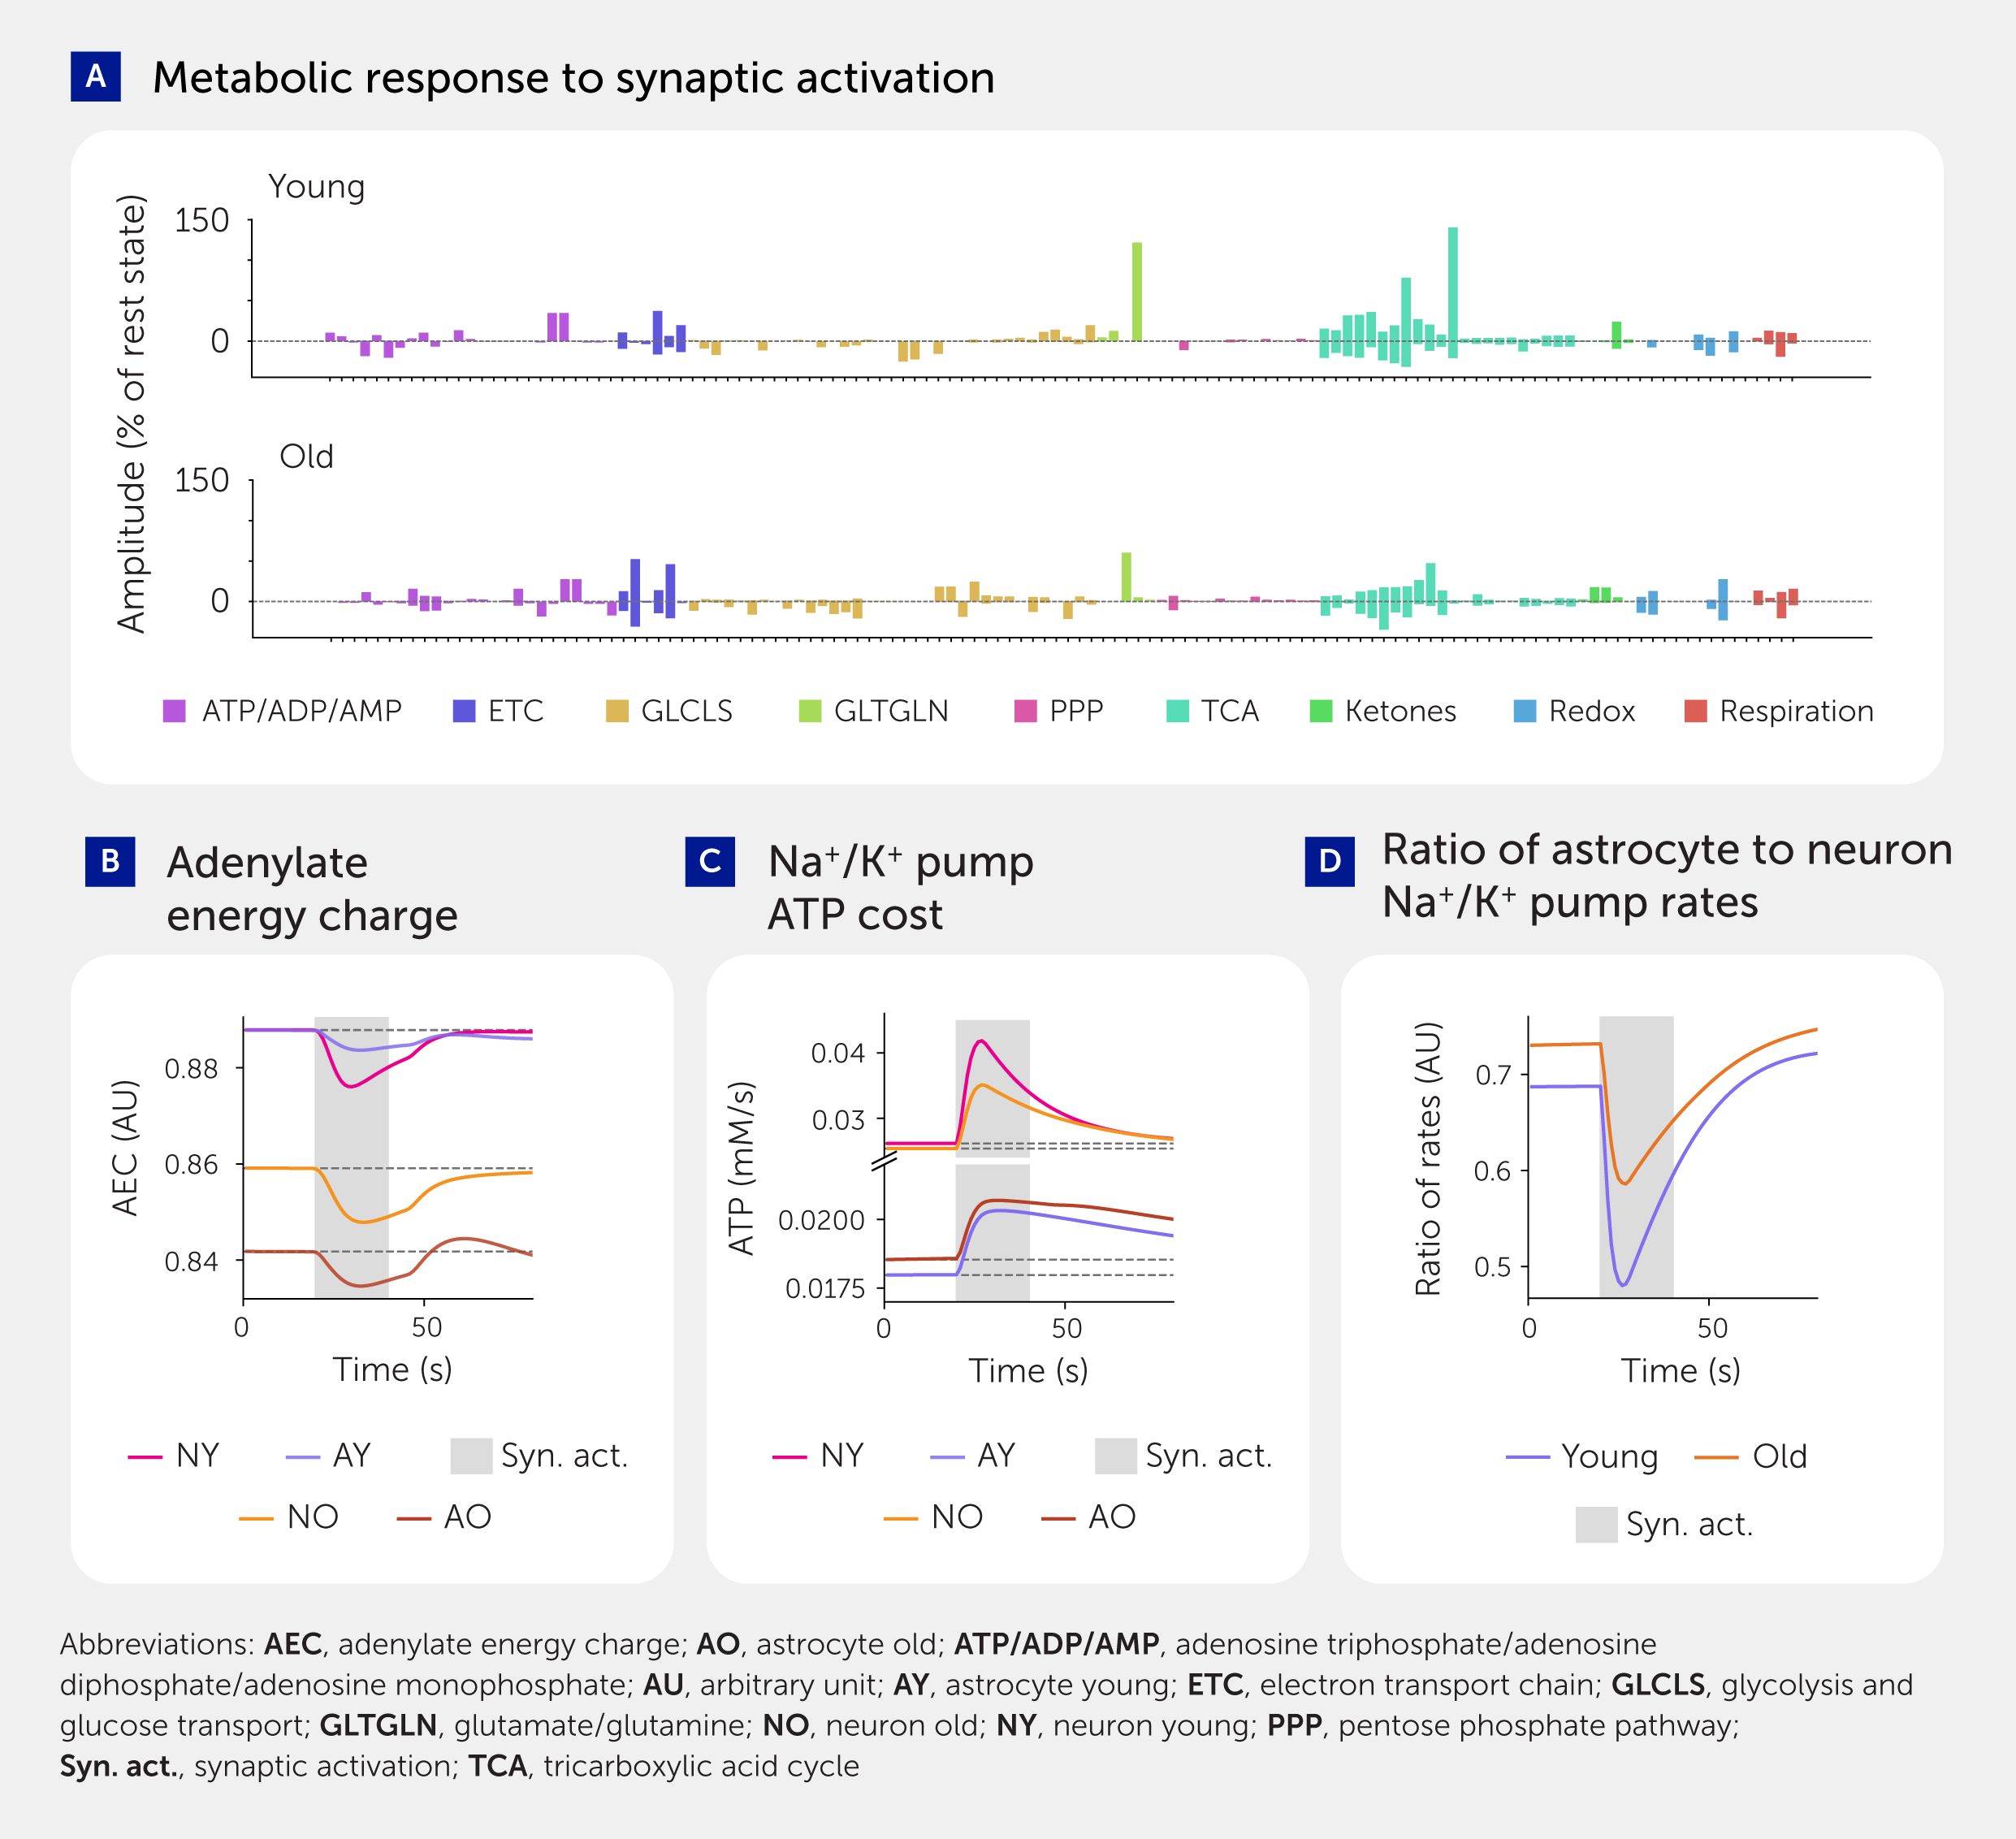
Figure 4. Simulation results comparing metabolic activity in neurons and astrocytes in young and aged brains. (A) Amplitude of concentration changes in response to synaptic activation in young and aged brains (see also Presentation 1: Supplementary Figure S18). (B) Adenylate energy charge (AEC) in young and aged neurons and astrocytes. AEC = (ATP + 0.5ADP)/(ATP + ADP + AMP). (C) Main energy consumption: sodium/potassium adenosine triphosphatase (Na+/K+-ATPase) rate of ATP use. (D) Ratio of astrocyte to neuron Na+/K+ pump rate.
Lactate transport directionality changes in the aging metabolic system
One of the central fueling mechanisms in brain neuroenergetics is the astrocyte-to-neuron lactate shuttle (ANLS). The intensely debated ANLS theory describes how neuronal activation drives astrocytic glycolysis and lactate export to the extracellular space, from where it can be taken up and used by neurons. Since its proposal by Magistretti and Pellerin (30–32), many studies have addressed it under various conditions [e.g., (33)]. Neuronal lactate import is lower in the aged metabolic system than the young, while astrocyte lactate export is slightly higher. This aging effect can be partially explained by reduced expression of monocarboxylate transporters (MCTs, based on RNA levels) and mitochondrial hypometabolism, which results in increased pyruvate levels and correspondingly higher levels of lactate. To examine the dependence of lactate transport directionality upon glucose levels in aged and young metabolic systems (Presentation 1: Supplementary Figure S13), we simulated the effects of varying resting blood glucose levels between 1.6–13.6 mM at increments of 1 mM. We performed two experiments, one with arterial lactate scaled proportionally to arterial glucose changes (where arterial lactate in the young brain was scaled proportionally to arterial glucose levels for comparability with the aged brain) and one with a fixed scale of lactate independent of glucose in an aged brain.
In the young system with both glucose and lactate scaled, we observed the expected ANLS at all tested blood glucose levels both at rest and during neuronal activation (averaged over the time interval of 20 seconds of pre-stimulation rest state and 20 seconds upon neuronal activation); as blood glucose levels increase, lactate export from astrocytes slightly increases in the range of low-to-normal blood glucose (1.6–4.6 mM) and decreases in the range of normal-to-high blood glucose (4.6–13.6 mM), while lactate import to neurons slightly increases throughout the entire tested range following the increase in concentration gradient. This directionality is consistent with concentration gradients. In the aged metabolic system with arterial lactate scaled proportionally to arterial glucose (assumption due to sparse data), the lactate shuttle at rest and during neuronal activation (averaged over the time interval of 20 seconds of pre-stimulation rest state and 20 seconds upon neuronal activation) has the same directionality as in the young system for moderate blood glucose levels (6.6–11.6 mM), consistent with a recent publication (34). However, both neurons and astrocytes export lactate when glucose levels are low-to-normal (1.6–5.6 mM) and both neurons and astrocytes import lactate when glucose levels are high (12.6–13.6 mM). A possible explanation for this dysregulation in the aged metabolic system could involve NAD+/NADH and ATP/ADP ratios owing to their regulatory role over the entire metabolic network, but this counterintuitive prediction requires experimental verification.
When aging-related changes in arterial lactate are independent of those of glucose, the directionality of lactate transport depends on the scaling coefficient of lactate levels relative to blood glucose levels. For the scaling based on our default aging model, lactate was exported by both the aged neuron and astrocyte at all tested glucose concentrations (given the same fixed arterial lactate), while the young state showed ANLS at all tested concentrations. This shift in lactate supply could be one of the underlying mechanisms of brain energy disruptions in aging.
Lactate serves as an alternative fuel to cells. Its levels depend on relevant transport and pathway reaction rates, including the activity of lactate dehydrogenase (LDH), which catalyzes the reversible conversion of lactate to pyruvate with the reduction of NAD+ to NADH and vice versa. High glucose levels affect concentrations of glycolytic metabolites, such as lactate, pyruvate, NAD+, and NADH, and consequently affect LDH and MCT activities.
Kinetics of enzymes and transporters, as well as metabolite concentrations, can be cell-type specific, leading to the difference in response to high blood glucose between neurons and astrocytes. Due to these complex interactions, results of computational models can seem counterintuitive, although they open new questions and lead us to a better understanding of how the system behaves under different conditions.
Aging-associated changes in metabolism alter electrophysiological characteristics
We show for the first time how aging in the metabolic system leads to changes in the generation of action potentials by both synaptic input (Figure 3) and current injection (Presentation 1: Supplementary Figure S5). Age-related differences in neuronal firing characteristics evoked by current injection are particularly important for decomposing NGV energy use because this type of stimulation protocol excludes the metabolic demand caused by glutamate release. We found similar changes in metabolic profiles following synaptic input and current injection (Presentation 1: Supplementary Figure S14), suggesting that metabolic changes mostly impact the action potential generation ability of neurons. However, the model would require a more detailed molecular coupling between the metabolic system and the entire glutamate cycle to strengthen this prediction.
We found that changes in action potential shape and size are caused by a reduction in Na+/K+-ATPase expression in the aged brain, supporting a recent theory of non-canonical control of neuronal energy status (35). To better understand whether other aspects of the metabolic system, such as reduced supply of ATP, also contribute to these changes, we increased the Na+/K+-ATPase expression levels in the aged brain model to match the young brain while leaving all other aspects of the aging metabolic system in their aged state. There were no significant differences in action potentials at low frequencies (4–8 Hz) and only slight changes at much higher frequencies (78–79 Hz), suggesting that the decreased expression of the Na+/K+-ATPase pump is the main factor impairing the ability of neurons to generate action potentials. However, it is still possible that other aspects of the NGV metabolic network become more important after sustained neuronal activity, such as those used during intense cognitive demand.
Lower supply and demand for energy in the aged brain
Although energy deficiency is a prominent hypothesis in brain aging (12), it is not clear if the supply is limited and/or demand is reduced; it is also unclear whether astrocytes and neurons are impacted in the same way. Adenylate energy charge (AEC), a widely used proxy for cellular energy availability (36), is higher in the young state than in the aged (Figure 4B). However, this value does not separate supply from demand. To separate the two factors, we first computed the total ATP cost of firing action potentials. We found that the young brain model consumes approximately 2 billion ATP molecules per second per NGV unit (where one unit is one neuron, one astrocyte, and their associated extracellular matrix and capillaries) with 8 Hz firing, while the aged brain model consumes around 1.8 billion molecules per second per unit, which aligns well with literature estimates (37–39). We found that ATP production is lower in the aged cytosol of both neurons and astrocytes and in aged neuronal mitochondria (Presentation 1: Supplementary Figure S2). However, ATP consumption is also lower (Figure 4C) due to the lower levels of Na+/K+-ATPase (40, 41), and therefore ATP supply is not necessarily a limiting factor. Nevertheless, while reduced ATP supply does not seem to limit action potential generation in the acute state, a persistently lower ATP supply may still cause Na+/K+-ATPase expression to decrease, thereby impairing action potential generation over a longer period.
We also found that neurons and astrocytes are differentially affected by aging. Normally, astrocytic Na+/K+-ATPases consume slightly less than two-thirds as much ATP as neuronal Na+/K+-ATPases (Figure 4D). In astrocytes, the ATP supply is only reduced in the cytosol and not in the mitochondria, and the catalytic subunit of the Na+/K+-ATPases expression is unchanged with aging. While ATP consumption of the Na+/K+-ATPase pump in neurons decreases with aging (Figure 4C), it slightly increases in astrocytes—resulting in an increase in the ratio of astrocyte to neuron Na+/K+-ATPase ATP consumption from around 0.69 in the young brain to around 0.72 in the aged. Since astrocytes do not need to fire action potentials, this finding suggests that there is an increased demand on astrocytes to support the neurons to clear extracellular K+ in order to help neurons generate their action potentials.
The model shows that Na+/K+ pump ATP use in the astrocyte is comparable with that of the neuron (Figure 4D), consistent with recent evidence (42). In line with previous studies (43), mitochondrial ATP production as a share of total ATP production is higher in neurons than in astrocytes, at 84% versus 70% (Presentation 1: Supplementary Figure S2).
Applying the RNAseq data (26, 27) to the respective metabolic pathways revealed that succinate dehydrogenase (SDH) is differentially affected by aging in neurons and astrocytes. SDH is a mitochondrial energy nexus and serves as complex II of the mitochondrial electron transport chain (ETC). SDH connects the tricarboxylic acid cycle (TCA) to the ETC. This result indicates that pre- and post-SDH enzymes of TCA (fumarase and succinate CoA ligase) display opposite changes in aged neurons and astrocytes. SDH itself decreases more in aged neurons than in aged astrocytes. In neurons, aging reduces both succinate CoA ligase and SDH, while increasing fumarase. Unlike in neurons, succinate CoA ligase levels rise in astrocytes during aging. SDH decreases slightly while fumarase levels decline further.
Aging brain metabolism is more fragile and susceptible to damage
Protein dysfunction is associated with several aging hallmarks, including loss of proteostasis, oxidative damage, and impaired DNA repair (11, 26). Moreover, reduced fidelity of protein translation leads to a phenotype resembling early Alzheimer’s disease (44). To mimic molecular damage and simulate the effect on enzyme and transporter functions, we introduced one perturbation at a time for each protein’s kinetic parameters (Michaelis constant, inhibition and activation constants, and catalytic rate constant—i.e., parameters in the enzyme rate equation), increasing or decreasing its value by 20% (in separate simulations, Figure 5A). We then calculated the changes in the response of all metabolites to measure the sensitivity of their concentrations to each perturbation. We ran 2,264 simulations with perturbed parameters, measuring metabolite sensitivities at rest and during stimulus for both the young and aged systems (see Equation 1).
Figure 5
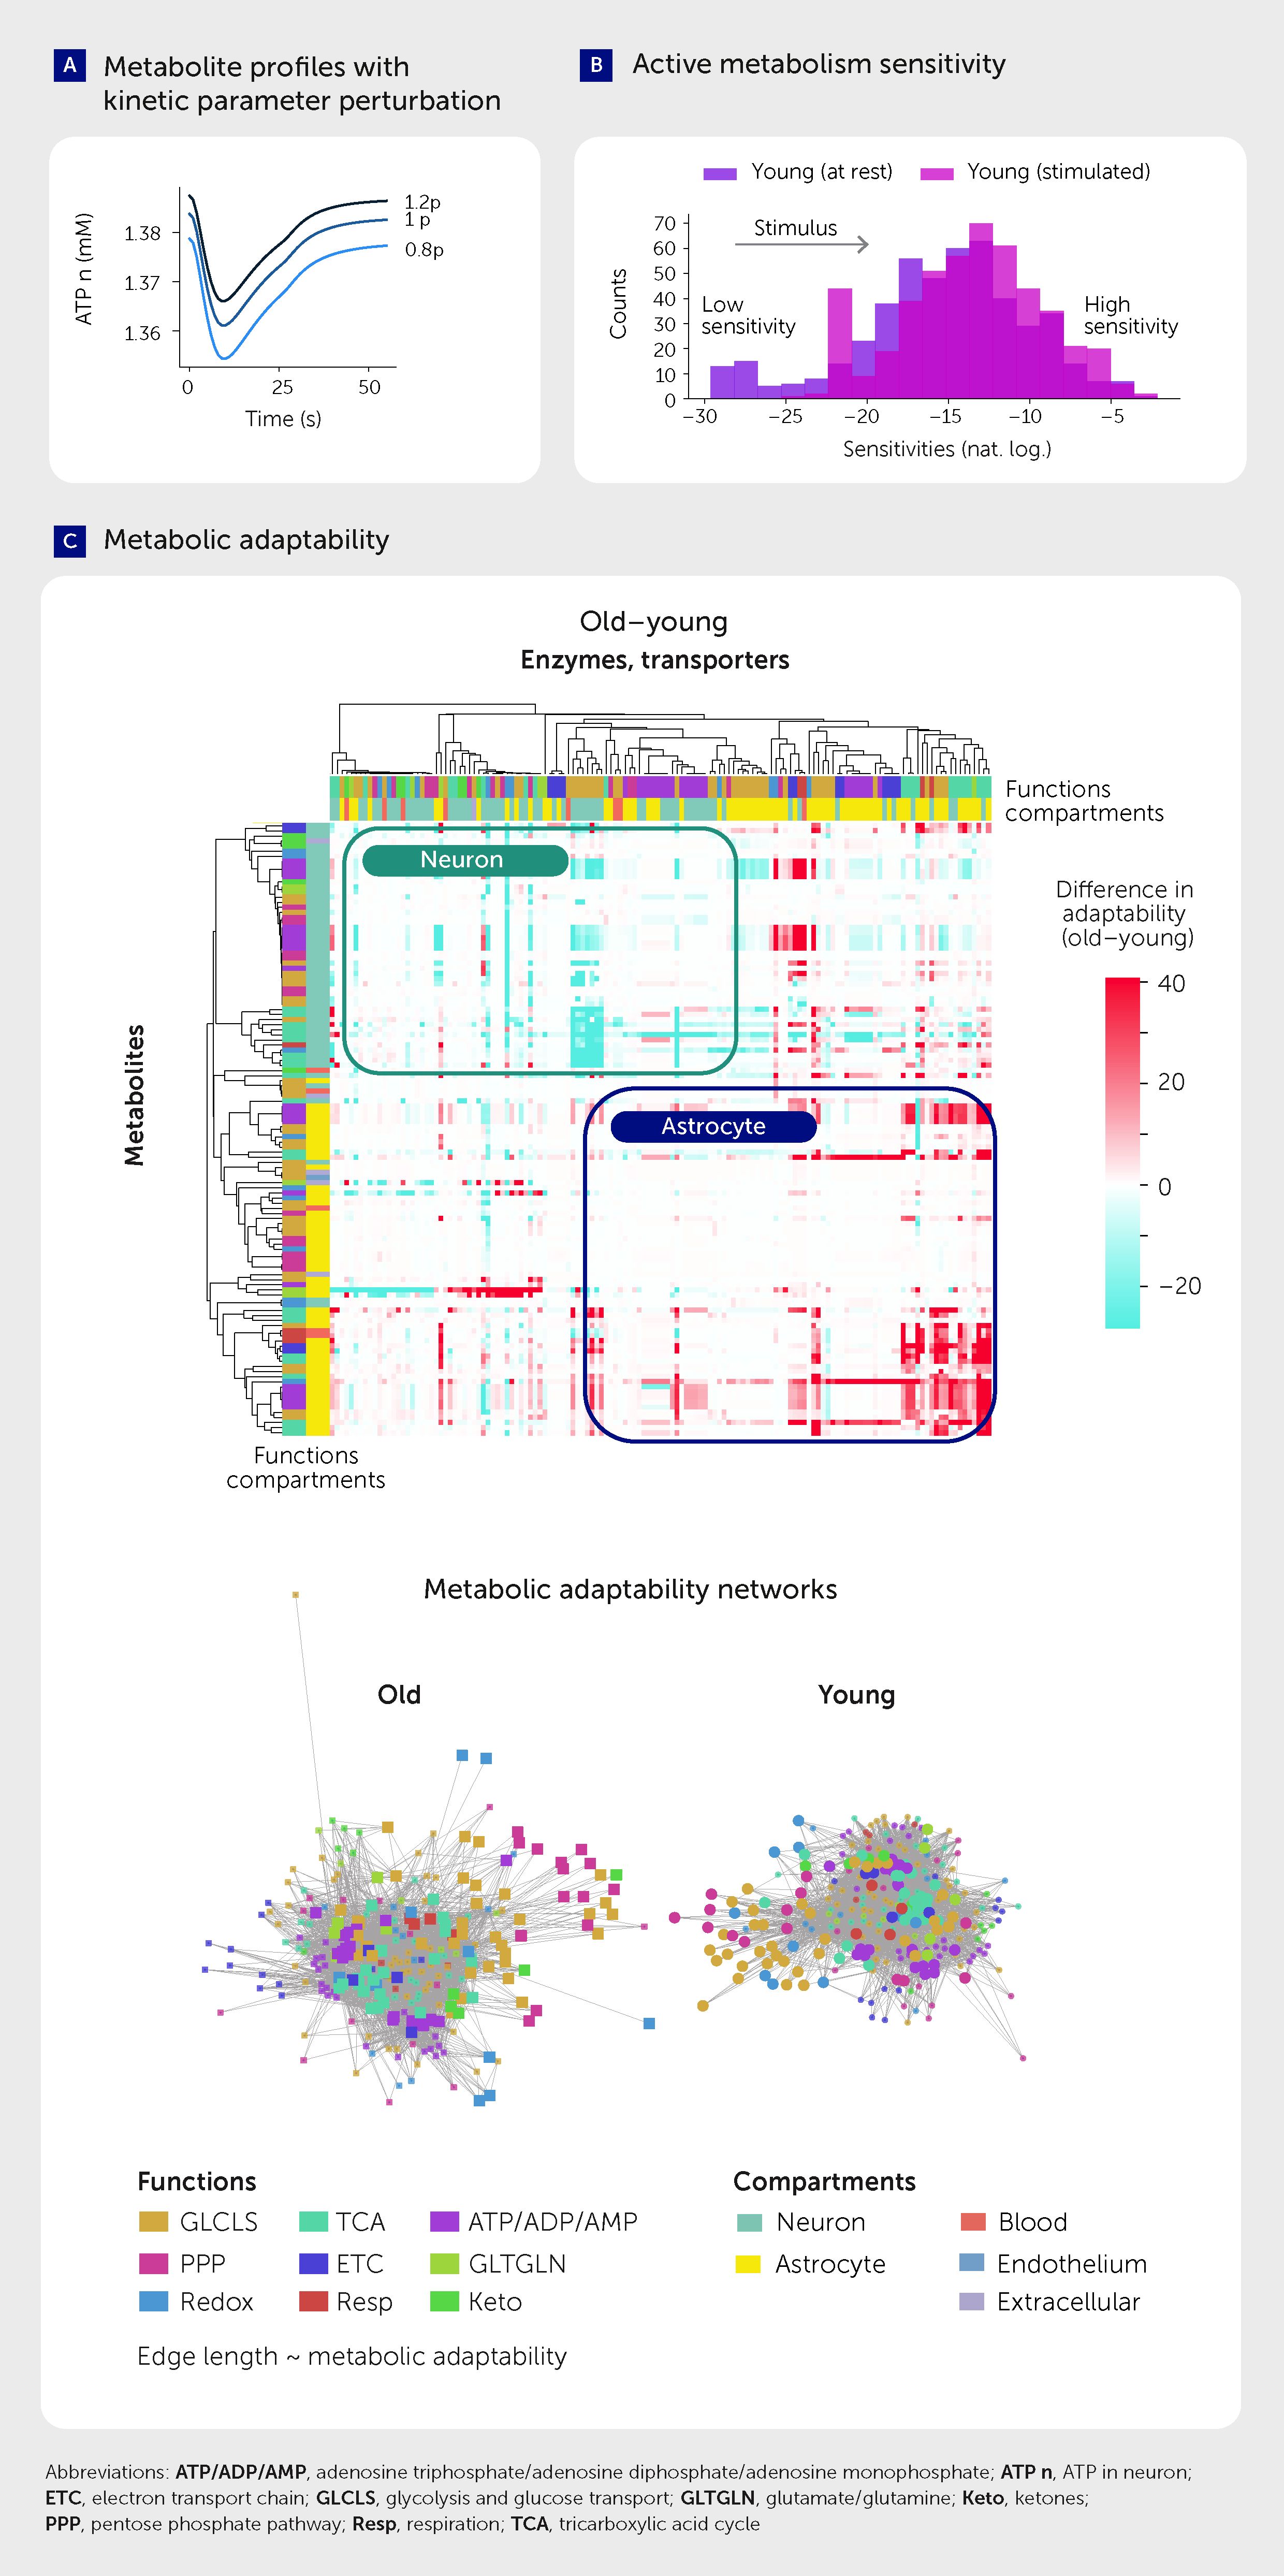
Figure 5. Metabolic response to kinetic perturbation changes with age. (A) Example metabolite level profiles in response to kinetic parameter perturbation. (B) Active metabolism sensitivity. (C) Metabolic adaptability to kinetic parameter perturbations (upper) and metabolic adaptability networks in young and aged brains (lower).
where dy/dp represents sensitivity, M(1.2p)[t] and M(0.8p)[t] are the metabolite concentrations at the time point t in simulation with the parameter p value multiplied by 1.2 and 0.8 respectively, M(p)[t] is the metabolite concentration at the time point t in the original simulation (no parameter variation), and dp is the change in parameter value from its value in the original model.
The difference between the sensitivities of the resting and stimulated states (Figure 5B), normalized by the resting state sensitivities, yielded a rest-normalized sensitivity. A larger value for a metabolite implies that a stimulus produces a larger change in its concentration (as compared with rest) when another parameter in the system is perturbed. We therefore interpret such a change as the ability of the system to adapt to damage; we call this metric “metabolic adaptability” (Figure 5C).
This metric allowed us to compare the whole metabolic systems of neurons and astrocytes in the young and aged brain (Figure 5C). We found that the adaptability of most neuronal metabolites decreases with age, while the adaptability of the astrocyte mostly increases. This observation concurs with the literature on astrocyte reactivity, which measures a set of phenotypic characteristics, including those of metabolism, inflammatory cytokine secretion, and cytoskeleton rearrangement (45). However, in contrast to the “selfish” astrocyte hypothesis (45), it is possible that the increase in astrocytic adaptability could instead be a “self-sacrifice” in an attempt to support the declining neurons; the increased adaptability of the astrocyte might be an attempt to stabilize the already declining metabolic profile in the neuron during aging.
We visualized the adaptability of the entire NGV metabolic network in the two age states by positioning the nodes of both metabolites and enzymes using the Fruchterman-Reingold force-directed algorithm (46). The length of each of the 16,800 edges were weighted by the inverse of metabolic adaptability (Figure 5C lower; see Presentation 1: Supplementary Information Files 1–8) to more intuitively reflect “metabolic fragility”. These networks displayed clustering of nodes largely by function and also revealed more evenly distributed clusters in young than in aged systems, indicative of a robust network. To quantify the network differences between young and aged systems, we calculated the centrality of nodes, which is the reciprocal of the sum of the shortest path distances between each node and all other nodes. The aged network showed longer average distances than the young network (Figure 6A), suggesting that the metabolic system of the aged brain is more fragile than that of the young brain.
Figure 6
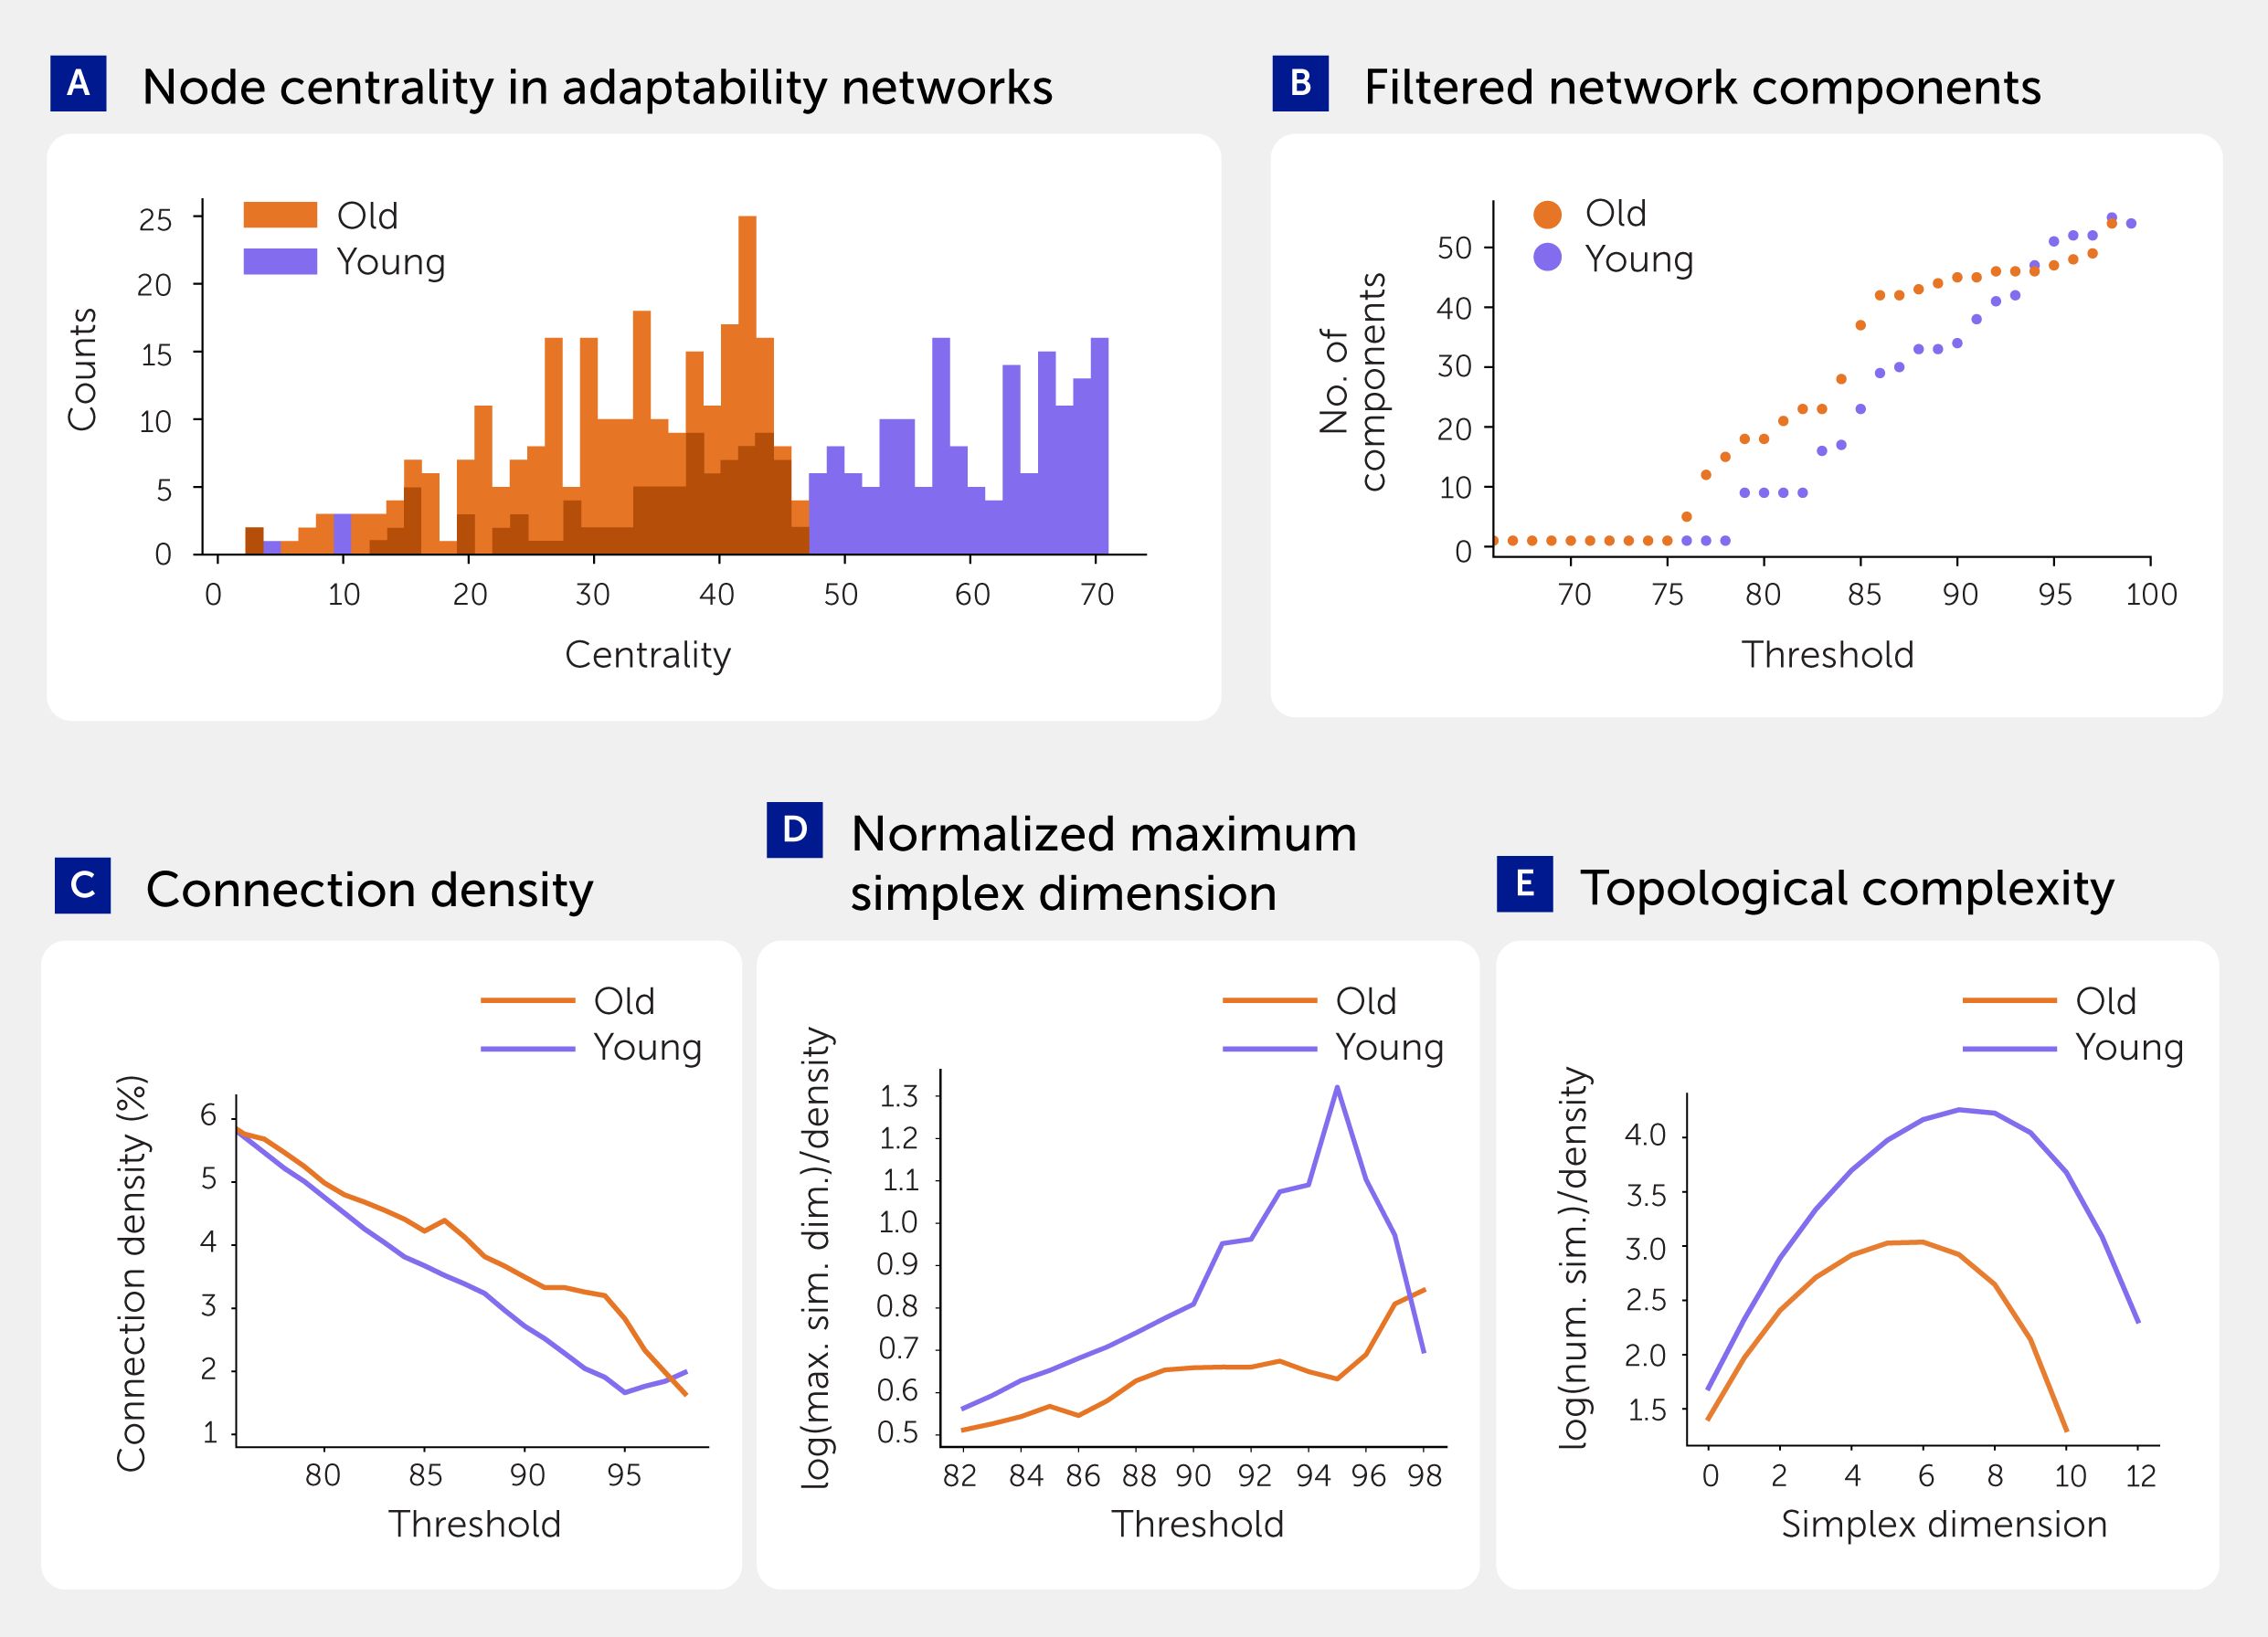
Figure 6. Metabolic adaptability networks in young and aged brains. (A) Centrality of the nodes in the networks of metabolic adaptability aggregated by enzymes. (B) Number of connected components in filtered networks of metabolic adaptability aggregated by enzymes. Ions, membrane potential, gating variables, mitochondrial membrane potential, and metabolites with fixed concentrations are omitted from the analysis for all figures in this panel. (C) Connection density of filtered networks. (D) Maximum simplex dimension (log-transformed) normalized by connection density. (E) Number of simplices (log-transformed) normalized by connection density (at 88% filtering threshold).
To quantify the effect of aging on metabolic system fragility, we progressively removed edges below a given percentile and calculated the number of connected components in young and aged metabolic networks (Figure 6B). This revealed that the aged network is fragmented into clusters or “islands”. Both networks are fully connected at thresholds below 76% and fully disconnected at 100%, but between 76% and 93% thresholds we observed a higher number of connected islands in the aged network. We computed directed simplices, a type of all-to-all connected clique, using algebraic topology (47, 48) to quantify the topological complexity of the network (see Methods). This showed that the dimensions (number of nodes) and number of simplices are higher in the young state (Figures 6C–E), indicating that the young metabolic network is more topologically complex, distributed, and robust than the aged system.
Potential drug targets to repair the aging metabolic system
The scale of the challenge of finding new drugs for therapeutic interventions is revealed by the >16,800 possible enzyme/transporter-metabolite interaction pathways we identified in the NGV metabolic network, plus the complexity of the metabolic response when any one pathway is perturbed. The measure of metabolic adaptability can guide identification of targets within this complex dynamical system. Here, interaction pathways with the highest differences in metabolic adaptability (Presentation 1: Supplementary Figure S16) are potential targets to repair the aged metabolic system (Figure 7), with high-priority targets being those that improve adaptability for the highest number of pathways. The ideal drug to repair the metabolic system is one that acts like a transcription factor (TF), regulating multiple enzymes and transporters to modulate an even larger number of metabolic pathways. We therefore applied the ChIP-X Enrichment Analysis 3 (ChEA3) optimization algorithm (49), which isolates the TFs with the largest overlap between a prioritized set of genes for those enzymes and transporters that show the biggest improvement in metabolic adaptability for the largest number of interaction pathways (Figure 8). We identified the ten highest-priority potential targets.
Figure 7
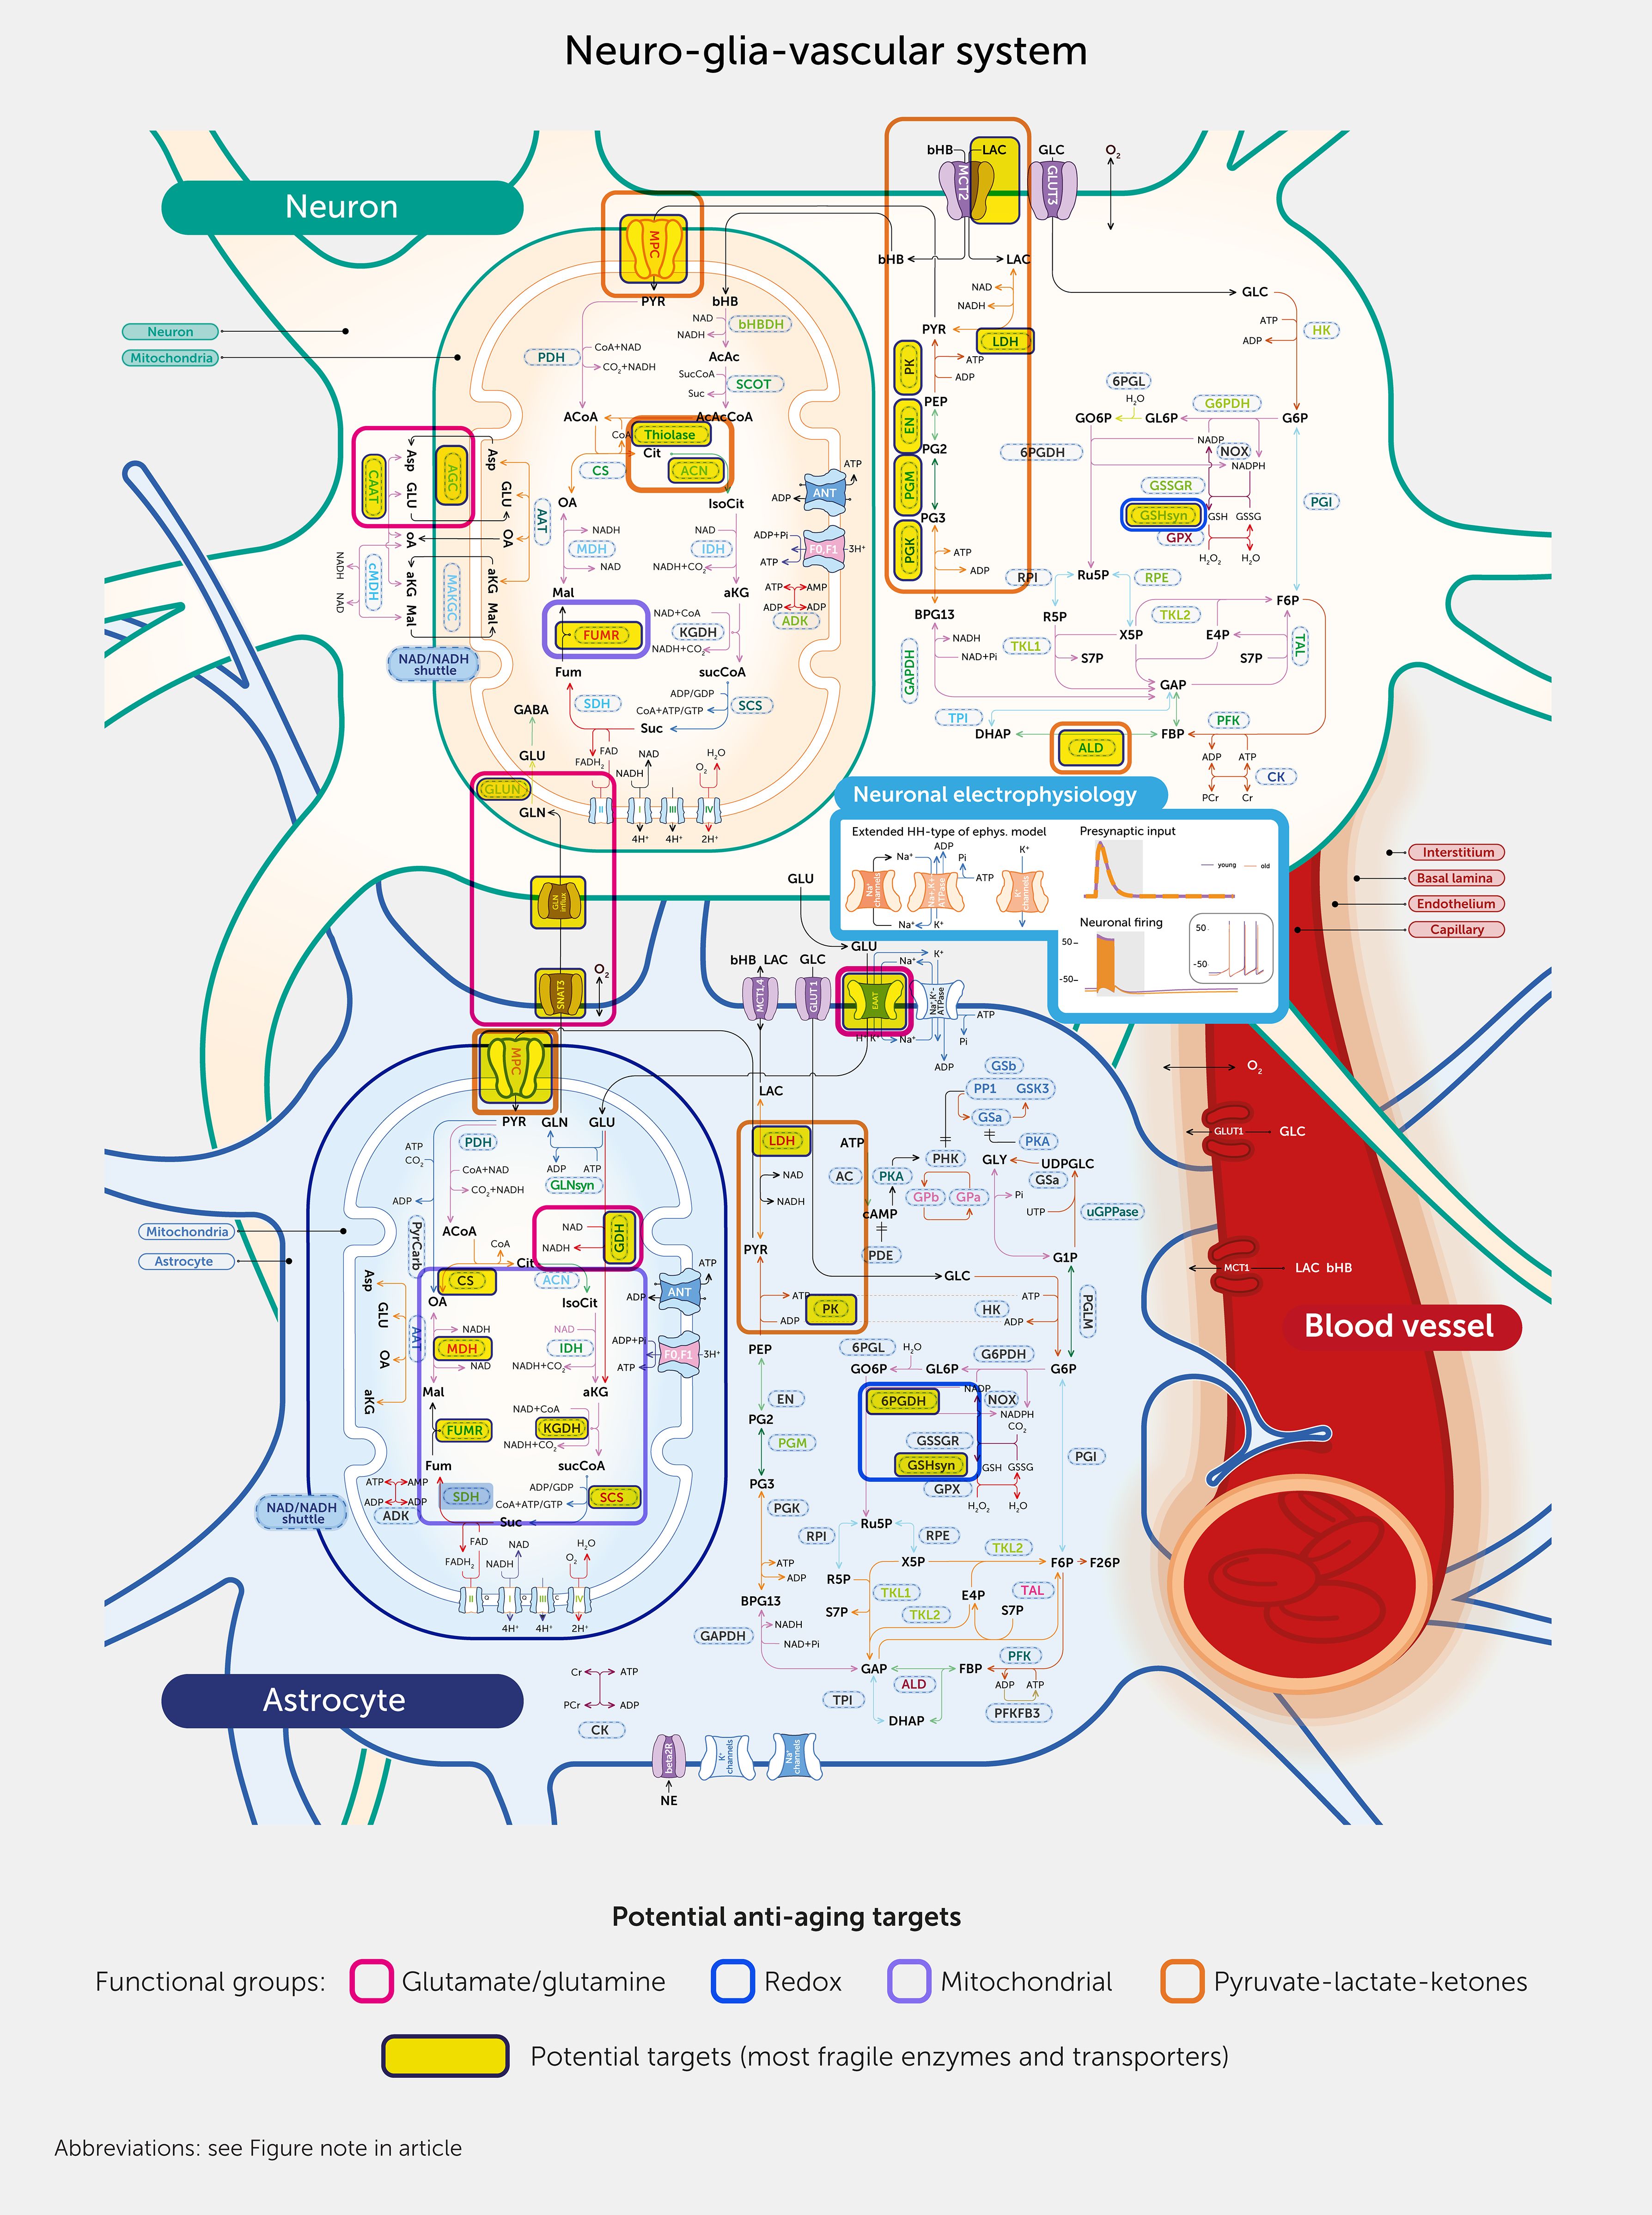
Figure 7. Reversing aging via targeted metabolism interventions. Sensitivity analysis-based potential targets are outlined by pink boxes and grouped by function in thick line boxes in the modeled system. For abbreviations, see Figure note section.
Figure 8

Figure 8. Transcription factor (TF) enrichment results obtained from ChIP-X Enrichment Analysis 3 (ChEA3) analysis. The left side shows the top 10 TFs, with estrogen-related receptor α (ESRRA) having the highest score. The right side shows the results of the STRING-database search for ESRRA from the ChEA3 analysis.
The TF with the highest score was estrogen-related receptor α (ESRRA). This TF regulates the expression of multiple metabolism-related genes, including those of mitochondrial function, biogenesis, and turnover, as well as lipid catabolism (50). It is also linked to autophagy and the nuclear factor kappa B (NF-κB)-mediated inflammatory response via silent information regulator 1 (Sirt1) signaling (51–54). Mitochondrial dysfunction and autophagy impairments are consistently among the hallmarks of aging (9–11, 55). Notably, ESRRA expression is downregulated in aging (26, 50). Altogether, therefore, ESRRA acts as a regulatory hub of multiple aging-associated pathways (outlined in Presentation 1: Supplementary Figure S19). The other TFs that we identified are also validated by literature reports on TFs implicated in aging and neurodegeneration (see Presentation 1: Supplementary Information Files 1–8).
Using the STRING database (56), we identified the following proteins most prominently associated with the top-scoring TF, ESRRA (Figure 8): hypoxia inducible factor 1 (HIF1A), Sirt1, histone deacetylase 8 (HDAC8), peroxisome proliferator-activated receptor gamma coactivator 1-alpha (PPARG1α, also called PGC1α), PPARG1β (PGC1β), myocyte enhancer factor 2C (MEF2C), nuclear receptor interacting protein 1 (NRIP1), nuclear receptor coactivator 1 (NCOA1), mitochondrial transcription factor A (TFAM), and PGC-1 and ERR-induced regulator in muscle protein 1 (PERM1). Numerous literature reports implicate these proteins in aging and neurodegeneration. The repair targets identified using our molecular model of the NGV system therefore largely align with reported experimental data on therapeutics for healthy aging (57). We additionally suggest a role for less-studied TFs in aging brain energy metabolism and provide insights into the links between molecular mechanisms implicated in aging and neurodegeneration (see Presentation 1: Supplementary Information Files 1–8). From a broader perspective, identified targets can be further investigated for their potential as biomarkers of aging. However, more research is needed to dissect causes from consequences and accompanying effects.
Potential strategic interventions to repair the aging metabolic system
As an alternative to specifically targeting the enzymes and transporters, we investigated whether key features of the aged brain phenotype, such as energy deficiency and altered neuronal firing, could be repaired through strategic interventions. We conducted constrained optimizations (see Methods) for (i) the interaction pathway targets identified by the differences in metabolic adaptability (same as the input for TF enrichment analysis above), (ii) the interaction pathways potentially regulated by ESRRA (above), (iii) parameters corresponding to arterial blood glucose and ketone levels (mimicking dietary factors), (iv) parameters corresponding to arterial blood lactate levels (mimicking exercise factors), and (v) total NAD-pool parameters in neurons and astrocytes (mimicking NAD-related supplementation). Surprisingly, optimization using a combination of diet (lower blood glucose and higher blood β-hydroxybutyrate), exercise (higher blood lactate), and NAD-related supplementation and modulation of the cytosol-mitochondria NAD-associated reducing equivalents shuttle (hereafter referred to as DEN therapy) increased ATP levels in both neurons and astrocytes toward values of the young metabolic system—comparable to that of the top-scoring targeted therapy (Figure 9A; Presentation 1: Supplementary Table S3). Interestingly, even though the parameter bounds for the optimization were allowed to search for increasing or decreasing values, the DEN therapy optimization converged unguided to a lower blood glucose and higher blood β-hydroxybutyrate, blood lactate, and NAD-modulation, consistent with commonly accepted benefits of calorie restriction, exercise, and NAD supplementation (58).
Figure 9
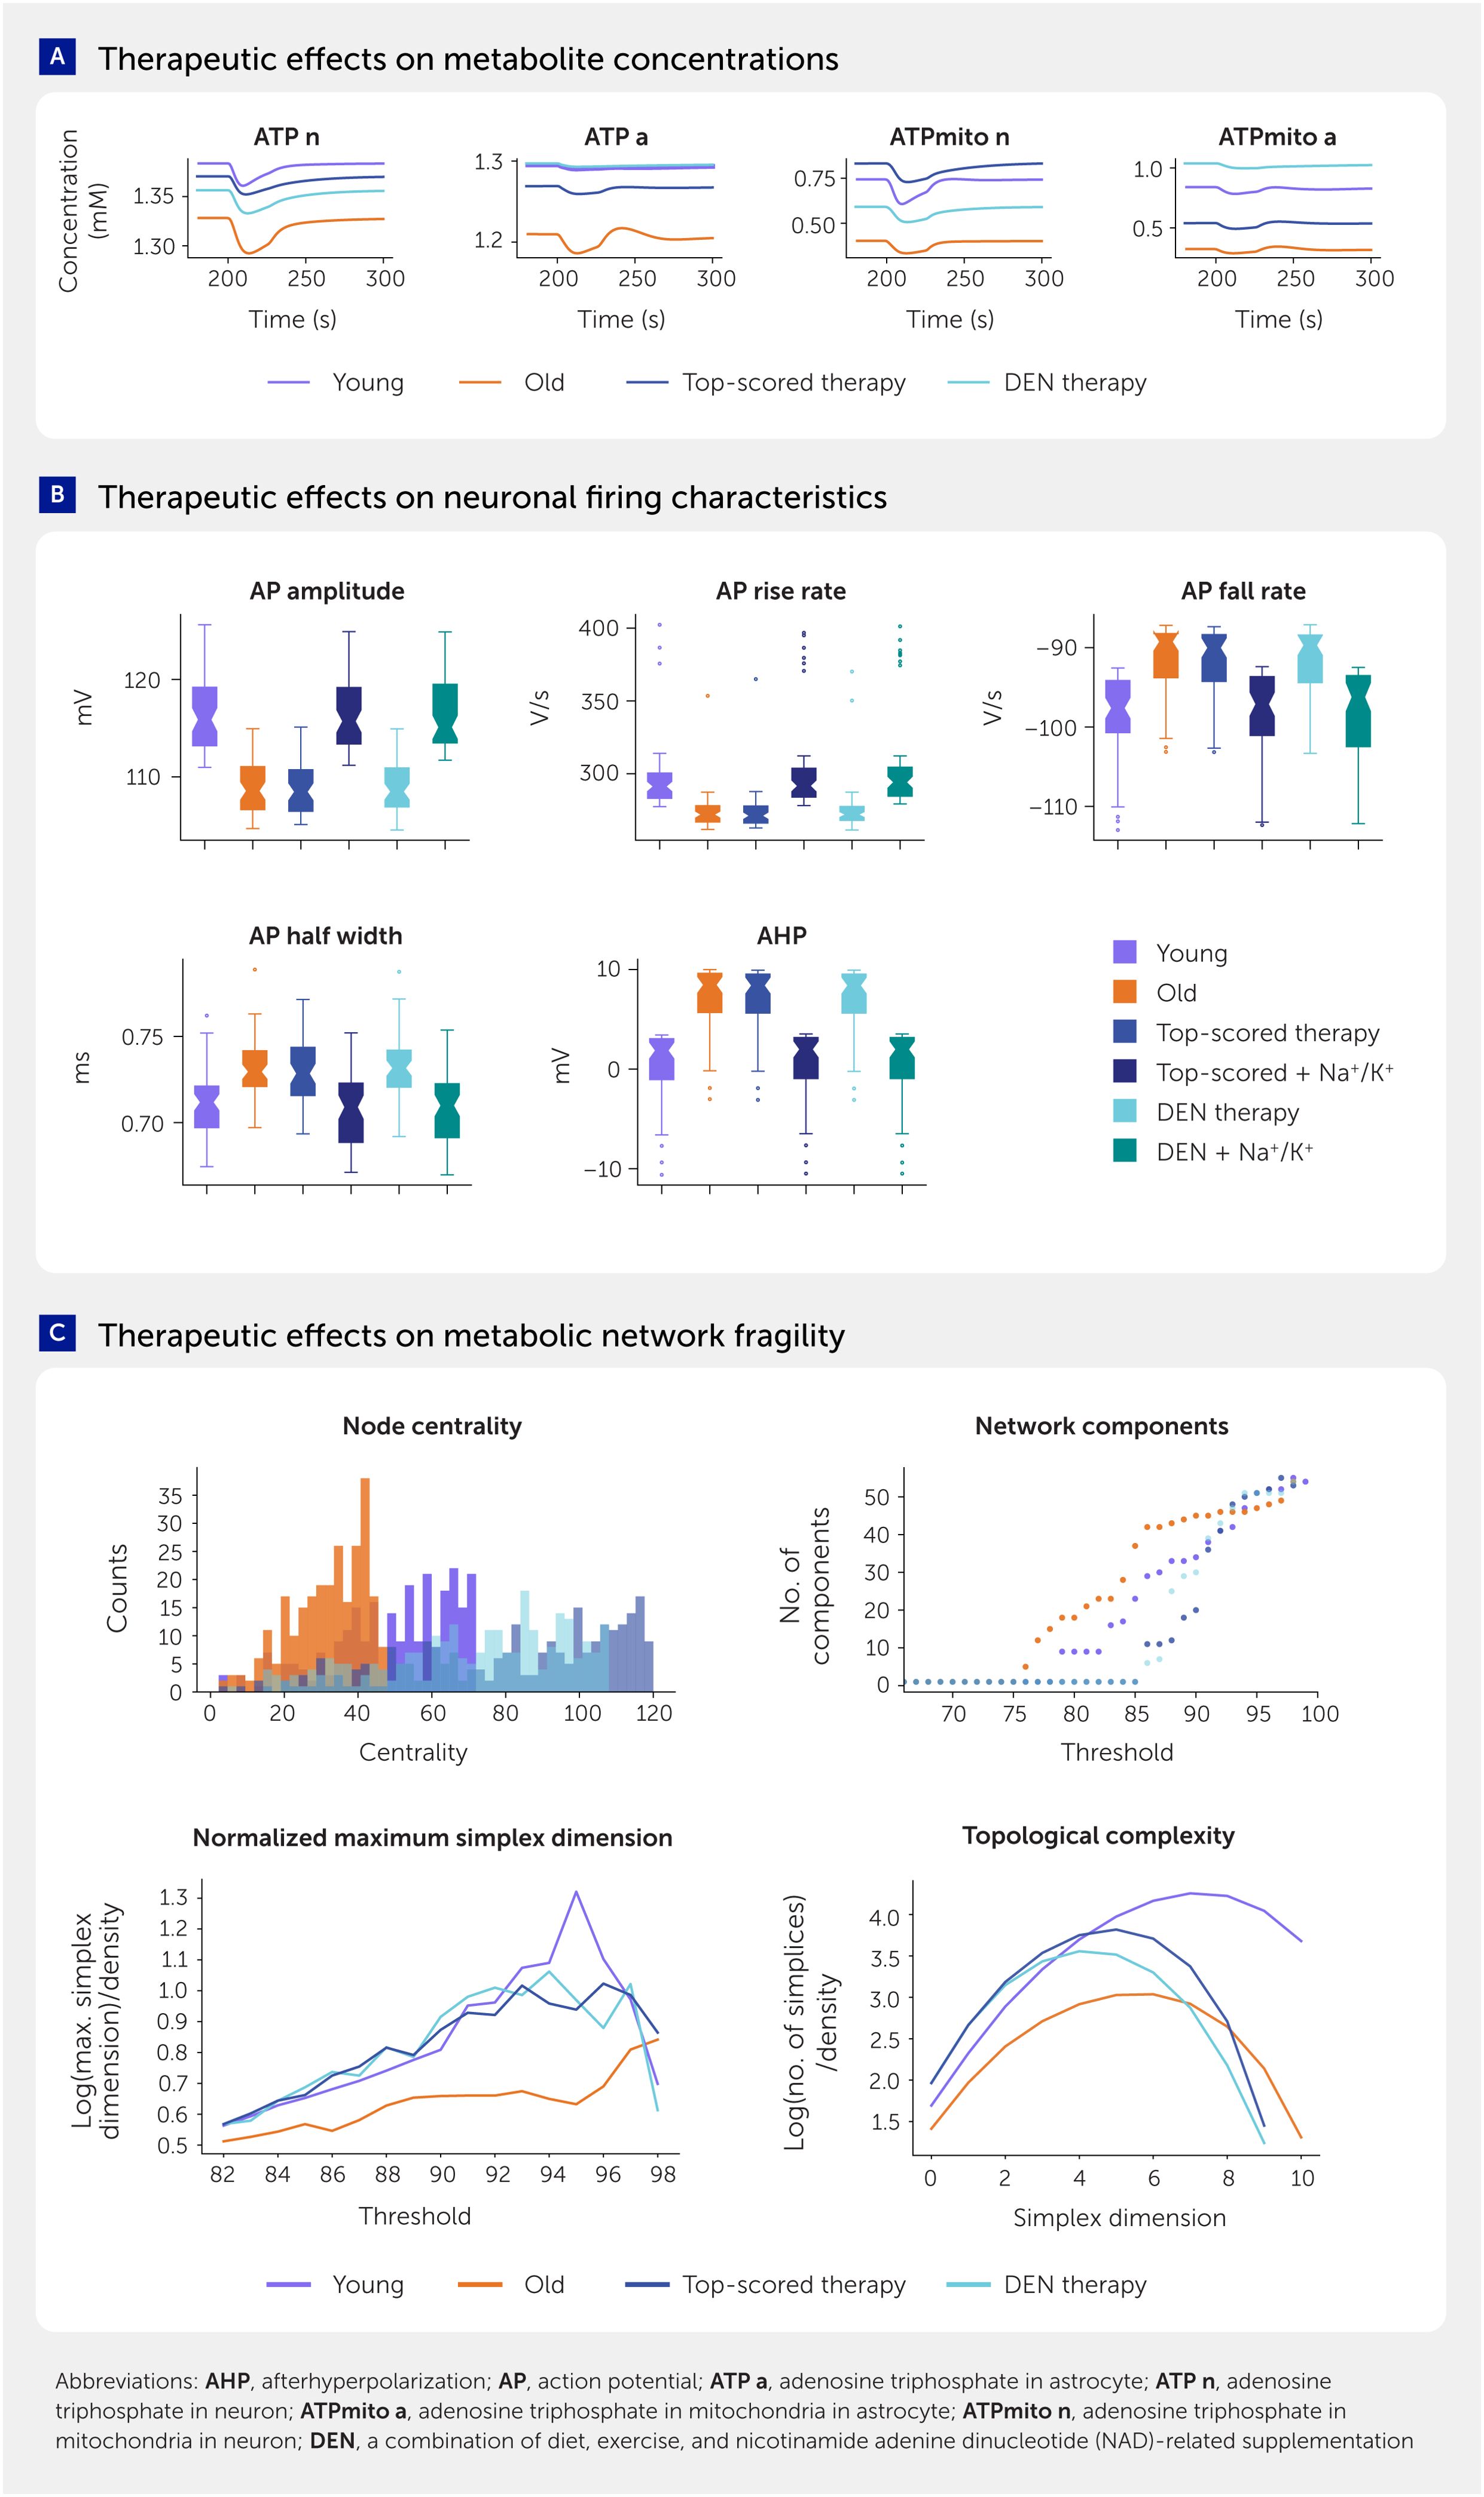
Figure 9. Analysis of potential strategic interventions to repair the aging metabolic system in the brain. (A) Time series traces of selected metabolites in young, aged, and treated aged states. (B) Characteristics of neuronal firing in young, aged, and treated aged states with selected therapies. In addition to selected top-performing and top-translatable therapies, we restored sodium/potassium (Na+/K+) pump expression to the young state. Application of the Na+/K+ pump expression restoration and each of the treatments restored characteristics of neuronal firing. Center line represents the median. (C) Therapeutic effects on metabolic network fragility.
The DEN therapy largely, although not completely, restored the youthful state of the neuronal metabolic system but not their action potential generation. As presented, action potential amplitude and shape can only be restored in our model by increasing the levels of the Na+/K+ pump to youthful levels. We therefore additionally reversed the age-related downregulation of the Na+/K+ pump for each intervention (i.e., for the best-scored combinatorial therapy based on targeted selection of enzymes and transporters, NAD supplementation, NADH cytosol-mitochondria shuttle capacity modulation, and for the DEN therapy). This approach restored neuronal firing characteristics similar to those of a young state for each intervention (Figure 9B) as well as ATP levels of both neurons and astrocytes. It is reasonable to assume that changes in action potential shape could affect calcium influx into presynaptic boutons and hence the probability of vesicle release, suggesting that restoration of action potential shape may also influence release properties. Interestingly, insulin is a common factor that activates Na+/K+-ATPase and increases its expression while also lowering blood glucose, consistent with DEN therapy. A sensitivity analysis, calculating adaptabilities for the DEN therapy and top-scored therapy, showed that network fragility could not only be repaired but even improved over the young state (Figure 9C).
Validation
To validate predictions of the model we used publicly available data that were not used to construct the model.
First, we extensively validated the model against a corpus of data reported in the literature on how enzyme and transporter activities and metabolite concentrations change in response to stimulation (Presentation 1: Supplementary Figure S1, Supplementary Table S1). All concentration-related variables were maintained in the range of biologically plausible values by the callbacks and the “isoutofdomain” parameter to a solver, as described in the Optimization part of the Methods section. We also qualitatively compared reaction and transport fluxes to their expected response to stimuli (Presentation 1: Supplementary Figure S2).
Next, we calculated the blood-oxygen-level-dependent (BOLD) signal (Presentation 1: Supplementary Figure S1D) and oxygen-glucose index (OGI) (ranging from 4.5–5.0 depending on stimulus, while literature data range from 4.0–5.5) using equations from Jolivet et al. to compare them with the literature (21, 24, 59). These two high-level phenomena are commonly used as benchmarks in NGV metabolism modeling papers (21, 24, 60), although these tissue-level metrics cannot be applied directly to the unitary models of NGV. We also found the lactate shuttle directionality in the aged metabolic system under moderate blood glucose levels (6.45–10.6 mM) was consistent with a recent publication (34).
Then we estimated energy use from the components of the Na+/K+-ATPase rate equation (calculated from the sum of neuron and astrocyte Na+/K+ pump ATP consumption flux in mM concentration per second with the volume of 17.8 µm3 and the literature estimate of ionic gradients sharing 31% of total energy use). Our estimates of ATP consumption rate per NGV unit at 8 Hz firing in both young and aged states align well with literature estimates (37–39). Our observations in action potential shape and size changes in aging as being caused by a reduction in Na+/K+-ATPase expression in the aged brain are in line with a recent theory of non-canonical control of neuronal energy status (35).
Furthermore, the model shows that Na+/K+ pump ATP use in the astrocyte is comparable to that of the neuron (Figure 4C), consistent with recent evidence (42). In line with previous studies (43), mitochondrial ATP production as a share of total ATP production is higher in neurons than in astrocytes, at 84% versus 70% (Presentation 1: Supplementary Figure S2). These data emerged when the model was simulated and their consistency with a range of reported experimental data suggests that the model accurately captures the most essential elements of the brain’s metabolic system.
We further validated aging-associated effects against the literature data shown in Presentation 1: Supplementary Table S1. TFs that we identified as regulating the most fragile enzymes and transporters are also validated by literature reports on TFs implicated in aging and neurodegeneration (see Presentation 1: Supplementary Information Files 1–8), and promising anti-aging therapies identified by this study are largely consistent with current understanding in the field.
Limitations
Even though we strove to be as biologically detailed and unbiased as possible, we had to refine weakly constrained parameters due to limited available data and focus on the most relevant pathways and processes rather than simulating dynamics at the whole genome-scale. Additionally, owing to data sparsity, differences between in vitro and in vivo conditions, as well as sex-related differences, were not considered. Some potential refinements of the model would be to include these aspects.
Furthermore, our model specifically emphasizes the key brain energy metabolism pathways and processes involved in neuronal signal transduction. However, to gain a more comprehensive understanding of the various complementary molecular mechanisms and pathways involved in aging and disease, it would be desirable to further expand the model to a whole-cell scale and incorporate more regulatory processes. At present, this task is hindered by data limitations. As more data become available, the model can be iteratively refined and expanded.
As we mostly focused on metabolism, our model does not incorporate detailed mechanisms of cerebral blood flow regulation with neuronal activation. Changes in oxygen availability and transport with aging were also not included due to data challenges. Refinement of the blood-related part of the model would be a highly valuable improvement. More details on neuronal signaling and synaptic mechanisms would potentially widen the model applications and level of biological detail.
For the various modeled conditions, we applied literature-based scaling factors to the concentrations of enzymes and transporters, as well as initial concentrations of variable metabolites. Owing to the lack of high-quality cell-type-specific protein concentration data for young and old rodents, we relied on data on RNA levels to derive the concentrations of enzymes and transporters, with scaling in the aging group based on the assumption that changes in RNA directly affect enzyme concentrations (61). This procedure, however, is often inaccurate due to various post-translational processes and protein degradation (62). Also due to literature uncertainty and potential biological variability, the scaling of blood nutrients in aging was based on the expectation of only a mild increase in blood glucose and proportional changes in blood lactate. Ketone body β-hydroxybutyrate and glutamatergic signaling were assumed to decrease by half in aging, but better measurements would be useful. We also applied scaling to the NAD pool and synaptic glutamate release, which were literature-driven but had to be approximated, as we did not find exact numbers for their changes with aging. NADH shuttle parameters were considered to be the most flexible as they had the highest uncertainty in the sourced data, which is why we optimized these to balance the aged model.
Another potential limitation is the uncertainty surrounding the nature of molecular damage (including that which accumulates with aging) and its effects on enzyme function, which we modeled as perturbations to individual kinetic parameters. Various other modifications of the model could be designed to be consistent with experimental data, such as inhibition of glycolysis or mitochondrial respiration via specific inhibition of the ETC complex I. However, those are outside the scope of our current study.
Discussion
This study presents a dynamical, molecular model of the NGV system that integrates the key cellular and subcellular systems, molecules, metabolic pathways, and processes required to couple neuronal electrical behavior with brain energy metabolism and blood flow. The data-driven strategy developed allows the application of experimental data, in principle from any condition, to produce a model of that condition. We applied experimental data from the young and aged brain metabolic systems to model their respective metabolic systems. We identified 16,800 enzyme/transporter–metabolite interaction pathways in the metabolic system of the brain. A sensitivity analysis for each pathway produced a comprehensive view of how each pathway impacts every other to support action potential generation. We found that the impact of one pathway on all the others is remarkably evenly distributed, indicative of a highly robust system with multiple routes to respond to changing metabolic demands, and one that is resilient to damage of any one pathway. By normalizing to resting sensitivities of each pathway, we developed a measure for the metabolic adaptability of each pathway to evaluate changes under different conditions, such as in the aged brain. Our analysis suggests that the aged metabolic system breaks down into “islands” where enzyme/transporter–metabolite interaction pathways cluster more than in the young brain, leaving this complex molecular system less robust to damage and more restricted when responding to stimuli. We identified the TF, ESRRA, and several key proteins it regulates as top potential drug targets and a prioritization of potential strategic interventions that could repair the aging metabolic system.
This data-driven model captures how brain energy metabolism interacts with neuronal activity through the ATP-dependent ion-gradient-restoring activity of Na+/K+-ATPase with a high degree of biological fidelity. Each enzyme and transporter is modeled using an experiment-derived rate equation featuring its concentration, key kinetic properties, and effects of inhibitors and activators (where applicable and relevant). This approach allows integration of proteomics and transcriptomics data for modeling various conditions and diseases that affect molecular levels and properties. Compared with the more generalized phenomenological metabolic models, the model features 183 processes, including 95 enzymatic reactions, 19 processes for the transport of molecules across cell and mitochondrial membranes, and 69 other processes for ionic currents, blood flow dynamics, and other related non-enzymatic processes. Changing molecular concentrations are simulated using 151 differential equations. Additionally, cytosolic adenosine diphosphate (ADP), creatine, NAD, and NADP are computed from the conservation law and total pool of relevant molecules.
To build such a complex model, we applied biologically reported parameters for each component of the model (see Methods), avoiding overriding biological values to fit literature reports of time-series of metabolic responses, which are scant and often contradictory. In order for the system of equations to have a solution, we optimized the parameters by only requiring steady state solutions at rest, rather than changing the parameters to fit the metabolic time-series responses reported in the literature. Alternative approaches used by others include likelihood-based optimization targeting the reference time-series data. This approach was not suitable in our case because most metabolites lacked data for meaningful likelihood-based parameter estimation, i.e., with recorded traces of metabolite levels in neurons and astrocytes. Others have used Bayesian parameter estimation, but this was computationally too costly for the scale and complexity of our model. To increase the biological dataset for parameterization, we merged data across in vitro and in vivo conditions and averaged these across natural ranges of biological variability. In some cases, we had to optimize weakly constrained parameters or include only the most relevant components, pathways, and processes (see Methods). The model, while containing an unprecedented level of detail, is also not yet at a whole-genome level. Similarly, while the model captures the key cellular elements, compartments, and sub-compartments, it does not yet capture explicit details on all possible geometric constraints.
The model was validated against numerous experimental datasets, but a key litmus test was simply whether computational convergence occurred for this complex system. Parameters were minimally optimized to allow convergence for a steady state at rest, but a self-constrained converged state emerged when the system was stimulated with current injection and synaptic input. On the other hand, when we introduced random modifications to enzyme and transporter concentrations and their kinetic parameters, some numeric solutions failed or diverged far from the steady state at rest. It is therefore even more remarkable that simulations converged without significant modifications introduced when we imported and applied the data from the aged brain. Furthermore, single parameter perturbations introduced instabilities in the simulations more often than when multiple RNA-seq derived changes were introduced, suggesting that the set of parameters are self-constraining.
Our results in both young and aged brain states align well with a wide range of published experimental reports. Aside from the time-series profiles of specific metabolites, enzymatic activities, and aging observations, it is particularly noteworthy that the estimates that emerged from the simulations for ATP consumption (37–39) and the effects of aging-associated metabolic changes on neuronal action potentials are consistent with experimental reports (63–67).
Calculating sensitivities is common when studying dynamical systems. In addition to sensitivity analysis, we introduced adaptability and fragility as biologically interpretable measures for the system undergoing transition between rest and a stimulated state. These measures capture the effects of perturbing an enzyme or transporter on all the metabolite levels in response to stimuli. These perturbations mimic the effects of conditions such as phosphorylation levels, transcription and translation errors, and molecular damage to enzyme and transporter kinetic properties. Perturbation analysis predicted diminished adaptability to changing energy demands with different changes in neurons and astrocytes in the aged brain. We could construct a network of enzyme/transporter-metabolite interaction pathways where each pathway could be evaluated in terms of metabolic adaptability, allowing quantification of the changes. We found a structural breakdown and decreased topological complexity of the NGV metabolic systems in the aged network as compared with the young state.
To identify potential targets for interventions to restore a youthful metabolic brain state and guide a search for biomarkers of aging, we determined the most fragile interaction pathways. We performed TF enrichment analyses for the most sensitive enzymes and transporters, whose functions largely overlap with known mechanisms of aging. Through constrained optimization, we identified a combination therapy that restores key features of the young brain phenotype. This therapy involves maintaining specific levels of blood glucose, lactate, and β-hydroxybutyrate—achievable through diet and exercise—coupled with redox state maintenance via NAD supplementation, modulation of the cytosol-mitochondria reducing equivalent shuttle (related to NADH, i.e., DEN therapy), and Na+/K+-ATPase activation. For instance, reversing the aging phenotype can be achieved in part by regulating insulin signaling, which lowers blood glucose and activates Na+/K+-ATPase.
The model suggests that complex interventions that act on multiple enzymatic targets, including some of the most promising potential targets of DEN therapy, could also restore ATP levels in cells. However, their development and implementation would require more extensive research before they could be considered for practical application in treating aging-related conditions. The observed model effects of these complex therapies appear comparable to those achieved with the simpler DEN therapy, although we can only theoretically speculate about clinical outcomes in each case.
The promising combination therapy identified in this study, which includes diet, exercise, NAD supplementation, NAD shuttle, and Na+/K+-ATPase modulation, agrees well with proposed anti-aging interventions such as caloric restriction, the ketogenic diet, and exercise (10). Physical exercise shows beneficial anti-aging and brain-health effects mediated by the brain-derived neurotrophic factor (BDNF), insulin-like growth factor 1 (IGF-1), and lactate (68–70). The ketogenic diet and caloric restriction, for example, impact the levels of β-hydroxybutyrate and glucose in the blood (71). Supplements investigated as potential aging treatments such as urolithin (72), metformin (73), and nicotinamide mononucleotide (74) benefit mitochondrial health and energy supply, consistent with the important role of energy regulation in aging.
Conclusion
In conclusion, this comprehensive, data-driven, molecular-level model of the NGV system offers a novel research tool to couple neuronal electrical behavior with brain energy metabolism and blood flow. It has undergone multiple validations and generated insights consistent with current findings, suggesting that it can guide experiments on brain aging and diseases, including those on disease-associated genetic variants, enzymatic deficiencies, and the effects of different intervention strategies. Energy-metabolism related transcriptomics, proteomics, and metabolomics data can also be applied to the model to study their effects on metabolic dynamics and neuronal firing. Furthermore, the model can simulate a variety of stimuli to neurons to guide studies on the energy constraints of brain activity. The model is open sourced for public use to help accelerate research into these important areas.
Methods
Baseline model building
We reconstructed and simulated a model of NGV metabolism coupled to a simple blood flow model and a Hodgkin-Huxley (HH) type of neuron model. The main concepts of electro-metabo-vascular coupling, as well as blood flow and the neuronal electrophysiology model, are based on the models available from the literature (19, 21, 24, 60). Our model specifically emphasizes the key brain energy metabolism pathways and processes involved in neuronal signal transduction. However, to gain a more comprehensive understanding of the various complementary molecular mechanisms and pathways involved in aging and disease, it is desirable to further expand the model to a whole-cell scale and incorporate more regulatory processes. At present, this task is hindered by data sparsity. As more data becomes available, the model can be iteratively refined and expanded.
Compared with the more generalized phenomenological metabolism models, our model features 183 processes: 95 enzymatic reactions; 19 processes for molecule transport across the cell and mitochondrial membranes; and 69 other processes related to ionic currents, blood flow dynamics, and some miscellaneous non-enzymatic processes, e.g., magnesium (Mg2+) binding to mitochondrial adenine nucleotides. Every reaction, transport, or other process is represented by a literature-derived rate equation. Changes in molecular concentrations are described by a system of 151 differential equations. Additionally, cytosolic ADP, creatine, NAD, and NADP are calculated from the conservation law and total pool of relevant molecules.
The model is based on literature data for enzyme kinetics and molecular concentrations. We meticulously collected all parameters and equations from literature sources (as referenced in Presentation 1: Supplementary Table S2 and throughout the model code) and programmatically queried the BRENDA (75) and SabioRK (76) databases. However, observed discrepancies in the parameters reported by different sources necessitated an optimization procedure to derive biologically plausible middle-ground values. These parameters with uncertainties were constrained by their lower and upper bounds, taking into account the type of the parameter (Michaelis constant of reaction, inhibition/activation constant, maximal rate of reaction, equilibrium constant, and Hill coefficient) and optimized as described in the Optimization section below.
To have the most realistic biological average for the initial values of all variables (concentrations, membrane potential, mitochondria membrane potential, venous volume, and gating variables) according to the literature, we considered not only measured and modeled literature data on the absolute values themselves but also additional constraints, such as known ratios of NADH to NAD+ in the neuron (22, 77–79) and astrocyte (79). One of the most important variables in the model, ATP concentration, was reported as being 2 mM in many experimental and modeling studies (20, 21, 24, 60, 80). However, more recent data report it at the 1.0–1.5 mM scale (35, 81). Assuming that more recent measurement technologies provide more precise data, we set cytosolic ATP in the neuron to approximately 1.4 mM according to Baeza-Lehnert et al. (35) and to approximately 1.3 mM in the astrocyte according to Köhler et al. (81), who reported ATP concentrations of 0.7–1.3 mM in acutely isolated cortical slices and 1.5 mM in primary cultures of cortical astrocytes.
Reported mammalian ATP to ADP ratios vary widely from 1 to >100 (82), while the ratio of ATP to adenosine monophosphate (AMP) is around 100 (80). Furthermore, metabolite ratios from Erecińska and Silver (80) were used to adjust initial concentrations of phosphocreatine and phosphate to the ATP levels. Lactate concentrations in different compartments, which is central to the ANLS debate, was set according to Mächler et al. (83). We also tested the model with all alternative literature-reported concentrations for the metabolites mentioned above.
Glucose supply from blood is of key importance to brain energy metabolism (84) and so we approached this meticulously. In our model, glucose concentrations are assigned to detailed compartments, such as arterial, capillary, endothelial, basal lamina, interstitium, neuronal cytosol, and astrocytic cytosol (85). According to the literature, hexokinase flux is split approximately equally between neuron and astrocyte (85–87), so we adjusted the maximum velocity (Vmax) of hexokinase so that its flux matched the literature data at rest. Upon activation, the ratio of glucose influx to astrocyte versus neuron increases, consistent with the literature (87, 88).
Implementation and simulation
This metabolism model is implemented and simulated in Julia programming language (89). We used the DifferentialEquations.jl package (90) to solve the differential equations system using order 2/3 L-stable Rosenbrock-W method (autodifferentiation disabled, both absolute and relative tolerances set to 1e-8). We chose to use the Julia language because of its high performance, its extensively developed mathematical methods ecosystem, and the readability of the code, which supports its future use. Most of the analysis and figures-making code is written in Python programming language.
The model is built modularly, so that every molecular process has a dedicated rate function, and the combination of relevant rate functions defines the dynamics of variables. This supports convenient testing of various enzymatic mechanisms, parameters, and initial values of concentrations, as well as easier model subsetting and expansion.
The code for model simulation, optimization, validation, and analysis is openly available (see “Data availability” below).
Optimization
Time-series data on the dynamics of specific metabolites in neurons and astrocytes are very limited and sometimes contradictory. To avoid favoring one data source over another, we only performed optimizations for the steady state (minimizing derivatives). We built and optimized the model bottom-up in multiple iterations, gradually expanding it with more details. We started with the model of neuronal electrophysiology (24, 60, 91–93). We included detailed astrocytic ion management based on the existing literature model (94). Then, for the metabolism model, we started with capillary dynamics, oxygen and glucose transport, and hexokinase, because these are very well studied and the cerebral metabolic rate (CMR) of glucose is widely measured, which sets a strong constraint on hexokinase rate. We then added each reaction one at a time and evaluated rates in simulations, manually (roughly) refining under-constrained parameters first, when necessary. After several reactions were added we ran an optimization (with an objective to minimize derivatives) for a selected small set of parameters that were the least constrained by the literature. Then we modeled lactate transport and connected it to glycolysis. We separately optimized PPP for steady state (with an objective to minimize derivatives). For the mitochondria, we started from the electron transport chain, which is mitochondrial-membrane potential-dependent and extremely sensitive to parameter variations. We mostly used the electron transport chain (ETC) model obtained from the publication of Theurey and colleagues (23) and then carefully selected a small number of parameters to optimize (with an objective to minimize derivatives) to make the ETC model compatible with ATP and ADP concentrations from more recent experimental evidence. Then we added TCA reactions to ETC one by one, as described above for other pathways. We also added the equations for modeling ketone metabolism, part of the malate-aspartate shuttle (MAS), and the glutamate-glutamine cycle (after having both neuron and astrocyte together in the system) based on the references given in Presentation 1: Supplementary Table S2.
The optimization procedure referenced above is a single objective optimization performed using BlackBoxOptim.jl (https://github.com/robertfeldt/BlackBoxOptim.jl of Robert Feldt) with the default algorithm (adaptive differential evolution optimizer) iteratively selecting different sets of processes to reduce the parameter space.
To avoid non-physiological molecular concentrations (negative or too high values), we used Julia-callbacks and the “isoutofdomain” mechanism to solve the differential equations system during optimization. For these biological plausibility reasons, we utilized “isoutofdomain” to control the solution of the differential equations system to stay non-negative, so that the solver takes smaller time steps if the solution leaves the domain, unless the minimum step size is reached and integration is terminated. The same methods were applied for the anti-aging optimization, but the selection of neuronal firing-related variables from the simulated time-series data from the young state were used for the objective function.
Computational models are often optimized by fitting parameters to the data using a selected algorithm. Indeed, some time-series data are available for various aspects of brain metabolism, including for concentrations of glucose, lactate, pyruvate, NADH and ATP, the BOLD signal, and cerebral metabolic rates of oxygen and glucose. However, to our knowledge, these usually come from different experiments rather than simultaneous measurements of multiple metabolite concentrations and other characteristics. Numerous studies have shown that one can fit system dynamics to selected data given a sufficient number of weakly constrained parameters and nonlinear rate equations (95). An interesting case is when measurements with similar metadata from different studies produce significantly different dynamics of metabolite concentrations, such as in the example of extracellular brain glucose from Kiyatkin and Lenoir (96) as compared with Fillenz and Lowry (97), which was further used in one of the early integrative NGV models (20). We therefore aimed to avoid the global optimization of fitting parameters to selected time series. Instead, we iteratively refined the bottom-up model by estimating parameters that would achieve the desired values of metabolite concentrations at a steady state (in which the concentration derivatives with respect to time are minimized). More details are available in the next section and the entire pipeline is shown in Presentation 1: Supplementary Figure S17. However, this approach has a downside: it does not guarantee exact matching of the experimentally recorded dynamics of any selected experiment. Good matching with the time series observed experimentally and in other models can only be obtained if the underlying model has a sufficient level of detail, uses relevant kinetic data for initial parameterization, and employs applicable constraints (e.g., a physiological range of metabolite concentrations and a typical range of values for kinetic parameters of a given type). While many of the time series produced by our model are close to the literature reports, glucose concentration traces and cerebral metabolic rate of glucose consumption have only modest stimulus responses as compared with the literature. This can be explained by our decision to follow the most detailed (to our knowledge) approach to glucose transport in the brain available in the literature (86, 98)—compartmentalizing arterial, capillary, basal lamina, interstitial space, astrocytes, and neuron spaces with glucose transfer between these compartments, described by rates that consider intracellular/extracellular concentration-dependent trans-acceleration and asymmetry of transporters.
Workflow and key aspects of bottom-up model building and optimization
We developed a workflow to build the model in a bottom-up, data-driven way, avoiding unreasonable bias for any particular data source. The resulting model performed remarkably well for different setups, producing high-quality simulation outcomes largely consistent with relevant literature. The only drawback was the workflow was largely iterative and time-demanding and required manual intervention. The steps and key considerations were as follows.
Step 1. Data collection
Models rely on the collection of as much reliable data as possible. Combining metabolism, electrophysiology, and blood flow, our model required the following data: molar concentrations of molecules (metabolites, proteins, and ions), enzyme and transporter kinetic parameters, electrophysiology and blood flow dynamics parameters, rate equations for all processes, mechanisms of reactions, and data on their inhibitors and activators (with corresponding mechanisms of action, existing pathway models, and their combinations). In most cases, the relevant reaction rates are modeled in the literature with multiple different equations owing to the use of different formalisms. For example, the same reaction can be described in a precise mechanistic way considering multiple transition states of complexes formed by enzymes with substrates, products, or regulators or using a more simplified form of modular rate law or Michaelis-Menten kinetics, when assumptions about the reaction mechanism are met. Due to iterative expansion of the model, we find it particularly important to keep collected data on reactions and how they are used in the existing models of pathways. For example, detailed mechanistic rate equations can be parameterized well for small models when sufficient consistently reliable data exist. However, where the data are highly uncertain, it is often hard to optimize and not overfit such models.
Step 2. Modeling of individual reactions
Time-series data were available for some individual enzymes, mostly from relatively old studies. These could be used to optimize the parameters of enzymatic rate equations, especially those that were under-constrained or came from different species or tissues. This step also allowed us to evaluate the rate of individual reactions, the significance of inhibitor and activator effects and whether these should be included in the model, and how problematic each particular reaction was in terms of the steady state and response to changing inputs.
Step 3. Combining reactions
Once data collection was complete, reactions were combined in the model one at a time according to the reconstructed pathway networks. This process was highly iterative and required multiple repetitions using different data. We evaluated multiple combinations to identify those in which minimal optimization was necessary to bring the system toward a steady state. It was also important to combine those small subsets of reactions with pseudo-reactions of substrates source flux and products sink flux to estimate how this unit will perform once it is connected to a larger system. Iterating on this step, we expanded the system to model pathways in individual cells. We offer the following guidance to researchers in this process:
● Existing models of those pathways are very helpful to guide the initial choice of the most promising combinations of reaction rates and parameters.
● Equations should have a similar level of detail for all reactions in a given pathway.
● When refining parameters for reactions connected in a pathway, it is useful to follow the sequential steps of the pathway (rather than following a commonly used list of reactions of the pathway and the metabolites); it helps to focus on reactions that are known to be key regulators of the overall pathway flux (bottlenecks), those close to connection points to other pathways, and those with the most complicated mechanisms.
● When setting the parameters in the model, the key factors for consideration are the concentrations at the steady state (or pseudo-steady state if a formal steady state cannot be achieved in a reasonable time), their response to stimuli (at least qualitatively in which direction and approximately how fast do they change, if no data are available), and the reaction and transport fluxes. Several “best performing” models should be retained for all subsystems/pathways because their relative performance rankings may change once they are plugged into a bigger system.
Step 4. Network expansion of metabolic system
Once small units/pathways had been built in at least a few variations, they were connected into larger systems. When optimizing connecting reactions, it is important to start from different entry points, compare overall fluxes of the pathways, and consider volumetric scaling aspects. In some cases, temporary use of pseudo-reactions for source and sink of some metabolites for optimization significantly improved the performance.
Step 5. Connecting metabolic, electrophysiology, and vascular models
The large metabolic system was connected (using the same strategy as in Step 4) to the electrophysiology and blood flow models. Variations of electrophysiology and blood flow models exist in the literature and these were optimized separately, if needed.
Step 6. Connecting neuron and astrocyte models
The models of the neuron and the astrocyte were connected in the same way as described above. Simulations and sensitivity analyses were used to select the parameters whose optimization had the greatest effect and which efficiently improved the model according to available data. If no consistently reliable data were available, the objective function was set to a level that minimized derivatives in the rest state for the system to be at the steady state.
Validation
First, we tested the response of the key metabolites (ATP, NADH, lactate, and glucose) to the stimuli. All concentration-related variables were maintained in the range of biologically plausible values by the callbacks and the “isoutofdomain” parameter to a solver as described under “Optimization”. Next, we calculated the BOLD signal (Presentation 1: Supplementary Figure S1D) and OGI (in the range of 4.5–5 depending on stimulus, while literature data is in the range of 4–5.5) using equations from Jolivet et al. to compare them with the literature (21, 24, 59). These two high-level phenomena are commonly used as benchmarks in NGV metabolism modeling papers (21, 24, 60). We also qualitatively compared dynamics of some key metabolites and reaction and transport fluxes to their expected response to stimuli. Then we estimated energy use from the components of the Na+/K+-ATPase rate equation (calculated from the sum of neuron and astrocyte Na+/K+ pump ATP consumption flux in mM concentration per second with the volume of 17.8 µm3 and the literature estimate of ionic gradients sharing 31% of total energy use) and compared it to the literature estimates (37). We further validated aging-associated effects against the literature data shown in Presentation 1: Supplementary Table S1.
Implementing aging effects in the model
Aging is a multifactor phenomenon that affects metabolism at different levels, such as transcriptome, proteome, metabolome, and potentially even kinetic properties of enzymes and transporters owing to accumulated genetic damage, lower protein synthesis fidelity, and higher chances of protein misfolding. Implementing the aging effect in our model in a fully data-driven way would require data on neuron- and astrocyte-specific proteomics, metabolomics, and enzyme kinetics. However, for the most part such data are not yet publicly available.
We modeled the aging effects using the following data:
● expression fold changes of enzymes and transporters from the Tabula Muris Senis (TMS) dataset (26, 27) applied as scaling factors to levels of corresponding enzymes and transporters
● scaled initial concentrations of blood glucose, lactate, and β-hydroxybutyrate according to the literature data on difference in their levels in aging (approximation, because effect size depends on the literature source)
● total NAD+ and NADH concentration pool scaling (approximation), because it decreases in aging according to qualitative literature
● synaptic glutamate release pool (approximation, but synaptic input is set as the same for comparability of the results)
● scaling of reducing equivalents shuttles between cytosol and mitochondria: the NADH shuttle is a generalized rate equation based on the activity of multiple enzymes of malate-aspartate and glycerol-phosphate shuttles, for which we followed the literature to model it (24).
For the above factors, which mention “approximative/approximation”, the direction of change is according to the literature, but the absolute number of scaling factors (not known/contradictory in the literature) is set with an objective for the model to be steady at rest.
We implemented the aging effects on enzyme and transporter levels in two parallel ways: (i) using cell-type specific transcriptomics data (26, 27) and (ii) using integrated proteomics data from our earlier meta-analysis (99). The first approach featured higher coverage depth for the astrocyte-specific data. To reduce bias from inferring missing data in the second method, we relied on RNA data for implementing aging effects into simulation, while we used the second data source for validation.
RNA fold changes for modeling aging effects
An extensive single-cell transcriptomics mouse dataset (26, 27) has recently provided insights into the aging patterns of various cells, including neurons and astrocytes. However, RNA needs to be translated into proteins. RNA data need to be used with caution when inferring age-dependent protein concentrations. Nonetheless, using RNA fold changes to scale enzyme and transporter levels results in metabolite concentration changes that are consistent with the literature (Presentation 1: Supplementary Table S1).
We mapped reaction identifiers to gene names using the gene-reaction-rules from a publicly available metabolism reconstruction, Recon 3D (100). Then for the cases of multiple genes per reaction (i.e., enzymes comprising several protein subunits or different isoforms present at the same time), we calculated age-scaling in two ways: (i) using the geometric mean of all fold changes and (ii) taking fold changes, which results in the lowest levels of RNA in aging (i.e., using the assumption that each protein subunit or isoform can be rate-limiting if its concentration is not sufficient to build a fully functional protein). We applied each of these methods twice: first for all genes and second only for those with significant changes (significance defined by the source data paper). Next, we manually reviewed the mapping of all genes-to-reactions and kept only those that were enzyme subunits/isoforms and not regulatory factors. We then refined it by subcellular location.
Protein levels for modeling aging effects
Several studies measured brain protein levels at different ages, but they provided mostly brain tissue/regions data rather than single neuron and astrocyte age-specific protein levels. Studies that did provide neuron- and astrocyte specific-protein levels used cultured cells or young/adult rodents. For these reasons, even a combination of proteomics datasets remains sparse in terms of cell-type and age-specific protein quantification. Even though using protein levels directly to scale Vmax of the enzymes and transporters would allow consideration of posttranscriptional effects of protein synthesis and degradation, to reduce potential bias we relied only on the RNAseq data for age-associated changes in enzyme and transporter levels.
Other necessary aging factors
Arterial glucose, lactate, β-hydroxybutyrate, and total NAD (reduced and oxidized) pool are fixed in the model. However, as multiple studies report that these variables change on aging we scaled them according to the literature. The resulting model was far from a steady state, which could be explained by some missing age-associated changes. We then scaled NADH exchange between the mitochondria and cytosol, which is also known to be affected by the aging process, and this resulted in a well-functioning model producing biologically meaningful observations. For a more realistic setup, we also scaled synaptic effects of glutamate concentration changes upon release events, but this had less of an effect and the age-associated changes in electric features extracted from simulations with only current injection are consistent with those driven synaptically.
Adaptability calculation and search for potential anti-aging strategies
As described in the main text, the adaptability calculation was a modified sensitivity analysis with perturbation of one parameter at a time by 20% of its initial value and subsequent calculation of the difference between the resting and stimulated state’s sensitivities, normalized by the resting state sensitivities (see Equation 1 above). We then considered enzymes and transporters with the highest difference in adaptability between young and aged states as the most fragile and, therefore, as potential anti-aging targets. Furthermore, to identify enriched TFs for these targets we applied the ChEA3 algorithm (49). As described in the main text, we then performed constrained optimization for 20 sets of parameters combining those of adaptability-based and the top-scoring TF-regulated enzymes and transporters, as well as parameters related to diet, exercise, and NAD supplementation.
Topological analysis
We used algebraic topology methods in our topological analysis of the adaptability networks. The distribution of directed simplices, introduced by Reimann et al. (47), has been essential for the study of brain networks and has revealed significant links between the maximum simplex dimension and the robustness of networks. The distribution of directed simplices was computed with the open-source software Flagser-count (https://github.com/JasonPSmith/flagser-count). Owing to varied connectivity density (defined as the number of edges over the total number of possible edges), we divided the logarithm of the number of simplices by the connectivity density for different sensitivity thresholds. This normalization allowed us to compare networks of different connectivity densities and identify which parts of the networks are more susceptible to changes.
Figure note
The following abbreviations are used in Figure 1 and Figure 7: AAT, aspartate aminotransferase; AC, adenylyl cyclase; AcAc, acetoacetate; ACoA, acetyl coenzyme A; AcAcCoA, acetoacetyl coenzyme A; ACN, aconitase; ADK, adenylate kinase; ADP, adenosine diphosphate; AGC, aspartate/glutamate carrier; AHP, after-hyperpolarization; αKG, alpha-ketoglutarate; ALD, aldolase; ANT, adenine nucleotide translocator; AP, action potential; Asp, aspartate; ATP, adenosine triphosphate; ATPase, adenylpyrophosphatase; β2R, adrenergic receptor; βHB, beta-hydroxybutyrate; βHBDH, beta-hydroxybutyric dehydrogenase; BPG13, 1,3-biphosphoglycerate; CAAT, cytosolic aspartate aminotransferase; cAMP, cyclic adenosine monophosphate; Cit, citrate; CK, creatine kinase; cMDH, cytosolic malate dehydrogenase; CoA, coenzyme A; Cr, creatine; CS, citrate synthase; DHAP, dihydroxyacetone phosphate; EAAT, excitatory amino acid transporters; EN, enolase; E4P, erythrose 4-phosphate; F0/F1, F0F1-ATPase/ATP synthase; FAD, flavin adenine dinucleotide; FADH2, hydroquinone form of FAD; FBP, fructose-1,6-bisphosphate; F6P, fructose-6-phosphate; F26P, fructose 2,6-bisphosphate; Fum, fumarate; FUMR, fumarase; GABA, gamma-aminobutyric acid; GAPDH, glyceraldehyde-3-phosphate dehydrogenase; GAP, glyceraldehyde 3-phosphate; GDH, glutamate dehydrogenase; GDP, guanosine diphosphate; GLC, glucose; GLN, glutamine; GLNsyn, glutamine synthetase; GL6P, 6-phosphogluconolactone; GLTGLN, glutamate/glutamine; GLU, glutamate; GLUN, glutaminase; GLUT1, glucose transporter 1; GLUT3, glucose transporter 3; GLY, glucose; GO6P, 6-phosphogluconate; G1P, glucose-1-phosphate; G6P, glucose-6 phosphate; GPa, active glycogen phosphorylase a; GPb, inactive glycogen phophorylase b; G6PDH, glucose-6-phosphate dehydrogenase; GPX, glutathione peroxidase; GSa, glycogen synthase a; GSb, glycogen synthase b; GSH, glutathione; GSHsyn, GSH synthetase; GSK3, glycogen synthase kinase 3; GSSG, glutathione disulfide; GSSGR, GSSG reductase; GTP, guanosine-5'-triphosphate; HH, Hodgkin–Huxley model; HK, hexokinase; IDH, isocitrate dehydrogenase; IsoCit, isocitrate; KGDH, ketoglutarate dehydrogenase; LAC, lactate; LDH, lactate dehydrogenase; MAKGC, malate/α-ketoglutarate carrier; Mal, malate; MCT1,4, monocarboxylate transporter 1,4; MCT2, monocarboxylate transporter 2; MDH, malate dehydrogenase; MPC, mitochondrial pyruvate carrier; NAD, nicotinamide adenine dinucleotide; NADH, reduced nicotinamide adenine dinucleotide; NADP, nicotinamide adenine dinucleotide phosphate; NE, norepinephrine; NOX, NADPH oxidase; OA, oxaloacetate; PCr, phosphocreatine; PDE, phosphodiesterase; PDH, pyruvate dehydrogenase; PEP, phosphoenolpyruvate; PFK, phosphofructokinase; PFKFB3, 6-phosphofructo-2-kinase/fructose-2,6-biphosphatase 3; PG2, 2-phosphoglycerate; PG3, 3-phosphoglycerate; 6PGDH, 6-phosphogluconate dehydrogenase; PGI, phosphoglucose isomerase; PGK, phosphoglycerate kinase; 6PGL, 6-phosphogluconolactone; PGLM, phosphoglucomutase; PGM, phosphoglycerate mutase; PHK, phosphorylase kinase; Pi, inorganic phosphate; PK, pyruvate kinase; PKA, protein kinase A; PP1, protein phosphatase 1; PPI, protein–protein interaction; PYR, pyruvate; PyrCarb, pyruvate carboxylase; Pyr-Lac-keto, pyruvate-lactate-ketones; R5P, ribose 5-phosphate; RPE, ribulose-5-phosphate epimerase; RPI, ribose-5-phosphate isomerase; Ru5P, ribulose 5-phosphate; SCOT, succinyl-CoA:3-oxoacid-CoA transferase; SCS, succinyl-CoA synthetase; SDH, succinate dehydrogenase; SNAT3, sodium-coupled neutral amino acid transporter 3; S7P, sedoheptulose 7-phosphate; Suc, succinate; SucCoA, succinyl-coenzyme A; TAL, transaldolase; TKL1, transketolase 1; TKL2, transketolase 2; TPI, triose phosphate isomerase; UDPGLC, uridine diphosphate glucose; uGPPase, UDP-glucose pyrophosphorylase; UTP, uridine triphosphate; X5P, xylulose-5-phosphate.
Supplementary material
The Supplementary material for this article can be found online at: https://www.frontiersin.org/articles/10.3389/fsci.2025.1441297/full#supplementary-material. See Appendix for additional details.
Acknowledgments
The authors thank Judit Planas Carbonell, Claudia Savoia, and Jean-Denis Courcol for organizing web portal development and visualization and Matthias Wolf for software support. We thank Karin Holm for writing assistance and Ayima Okeeva for the model notebook evaluation. All of the persons acknowledged above are affiliated with the Blue Brain Project, École Fédérale Polytechnique de Lausanne (EPFL), Geneva, Switzerland.
Statements
Author contributions
PS: Conceptualization, Data Curation, Formal Analysis, Investigation, Methodology, Software, Validation, Visualization, Writing – original draft, Writing – review & editing. JC: Conceptualization, Supervision, Writing – original draft, Writing – review & editing. LK: Formal Analysis, Investigation, Writing – original draft, Writing – review & editing. EB: Visualization, Writing – original draft, Writing – review & editing. CF: Visualization, Writing – original draft, Writing – review & editing. SA: Software, Visualization, Writing – original draft, Writing – review & editing. DK: Conceptualization, Project Administration, Supervision, Writing – original draft, Writing – review & editing. HM: Conceptualization, Funding acquisition, Resources, Supervision, Writing – original draft, Writing – review & editing.
Data availability statement
Data collected from various sources are listed in Presentation 1: Supplementary Table S2 and referenced therein. A dataset that is not included in the Supplementary material is the dataset from the Tabula Muris Consortium with the figshare data referenced therein (101).
The model described in the present article is available via Github (https://github.com/BlueBrain/metabolism-in-aging) and Google Colab (https://colab.research.google.com/drive/12EZSRjzq5eIaezpT41kv0e7LBMWFDZ_Y?usp=sharing). It is also available for use at the Open Brain Platform hosted by the Open Brain Institute (https://www.openbraininstitute.org), under the following DOI: 10.25453/fsci.28653347.
Funding
The author(s) declare financial support was received for the research presented in this article. This study was supported by funding to the Blue Brain Project, a research center of the École Polytechnique Fédérale de Lausanne, from the Swiss government’s Eidgenössische Technische Hochschule (ETH) Board of the Swiss Federal Institutes of Technology. The funder was not involved in the study design, collection, analysis, interpretation of data, the writing of this article, or the decision to submit it for publication.
Conflict of interest
HM is a co-founder and board member of Frontiers Media SA.
HM declared that he was an editorial board member of Frontiers, at the time of submission. This had no impact on the peer review process and the final decision.
PS is employed as a proteomics application data scientist at Biognosys AG.
The remaining authors declare that the research was conducted in the absence of any commercial or financial relationships that could be construed as a potential conflict of interest.
This study received funding from the Swiss government’s ETH Board of the Swiss Federal Institutes of Technology. Neither the funder nor the companies listed above were involved in the study design, collection, analysis, interpretation of data, the writing of this article, or the decision to submit it for publication.
Generative AI statement
The authors declared that no generative AI was used in the creation of this manuscript.
Publisher’s note
All claims expressed in this article are solely those of the authors and do not necessarily represent those of their affiliated organizations, or those of the publisher, the editors and the reviewers. Any product that may be evaluated in this article, or claim that may be made by its manufacturer, is not guaranteed or endorsed by the publisher.
References
1. Livingston G, Sommerlad A, Orgeta V, Costafreda SG, Huntley J, Ames D, et al. Dementia prevention, intervention, and care. Lancet (2017) 390(10113):2673–734. doi: 10.1016/S0140-6736(17)31363-6
2. Niccoli T, Partridge L. Ageing as a risk factor for disease. Curr Biol (2012) 22(17):R741–52. doi: 10.1016/j.cub.2012.07.024
3. Hou Y, Dan X, Babbar M, Wei Y, Hasselbalch SG, Croteau DL, et al. Ageing as a risk factor for neurodegenerative disease. Nat Rev Neurol (2019) 15(10):565–81. doi: 10.1038/s41582-019-0244-7
4. GBD 2019 Dementia Forecasting Collaborators. Estimation of the global prevalence of dementia in 2019 and forecasted prevalence in 2050: an analysis for the Global Burden of Disease Study 2019. Lancet Public Health (2022) 7((2):e105–25. doi: 10.1016/S2468-2667(21)00249-8
5. Kivipelto M, Mangialasche F, Ngandu T. Lifestyle interventions to prevent cognitive impairment, dementia and Alzheimer disease. Nat Rev Neurol (2018) 14(11):653–66. doi: 10.1038/s41582-018-0070-3
6. Kivipelto M, Mangialasche F, Snyder HM, Allegri R, Andrieu S, Arai H, et al. World-Wide FINGERS Network: a global approach to risk reduction and prevention of dementia. Alzheimers Dement (2020) 16(7):1078–94. doi: 10.1002/alz.12123
7. Coley N, Giulioli C, Aisen PS, Vellas B, Andrieu S. Randomised controlled trials for the prevention of cognitive decline or dementia: a systematic review. Ageing Res Rev (2022) 82:101777. doi: 10.1016/j.arr.2022.101777
8. Wilson DM 3rd, Cookson MR, Van Den Bosch L, Zetterberg H, Holtzman DM, Dewachter I. Hallmarks of neurodegenerative diseases. Cell (2023) 186(4):693–714. doi: 10.1016/j.cell.2022.12.032
9. López-Otín C, Blasco MA, Partridge L, Serrano M, Kroemer G. The hallmarks of aging. Cell (2013) 153(6):1194–217. doi: 10.1016/j.cell.2013.05.039
10. López-Otín C, Blasco MA, Partridge L, Serrano M, Kroemer G. Hallmarks of aging: an expanding universe. Cell (2023) 186(2):243–78. doi: 10.1016/j.cell.2022.11.001
11. Mattson MP, Arumugam TV. Hallmarks of brain aging: adaptive and pathological modification by metabolic states. Cell Metab (2018) 27(6):1176–99. doi: 10.1016/j.cmet.2018.05.011
12. Bonvento G, Bolaños JP. Astrocyte-neuron metabolic cooperation shapes brain activity. Cell Metab (2021) 33(8):1546–64. doi: 10.1016/j.cmet.2021.07.006
13. Andreyev AY, Yang H, Doulias PT, Dolatabadi N, Zhang X, Luevanos M, et al. Metabolic bypass rescues aberrant S-nitrosylation-Induced TCA cycle inhibition and synapse loss in Alzheimer’s disease human neurons. Adv Sci (Weinh) (2024) 11(12):e2306469. doi: 10.1002/advs.202306469
14. Kety SS. The general metabolism of the brain in vivo. In: Richter D, editor. Metabolism of the nervous system. Pergamon: Elsevier (1957). 221–37. doi: 10.1016/B978-0-08-009062-7.50026-6
15. Mink JW, Blumenschine RJ, Adams DB. Ratio of central nervous system to body metabolism in vertebrates: its constancy and functional basis. Am J Physiol (1981) 241(3):R203–12. doi: 10.1152/ajpregu.1981.241.3.R203
16. Sokoloff L. Cerebral metabolism and visualization of cerebral activity. In: Greger R, Windhorst U, editors. Comprehensive human physiology. Berlin, Heidelberg: Springer (1996). 579–602. doi: 10.1007/978-3-642-60946-6_30
17. Rolfe DF, Brown GC. Cellular energy utilization and molecular origin of standard metabolic rate in mammals. Physiol Rev (1997) 77(3):731–58. doi: 10.1152/physrev.1997.77.3.731
18. Mann K, Deny S, Ganguli S, Clandinin TR. Coupling of activity, metabolism and behaviour across the Drosophila brain. Nature (2021) 593(7858):244–8. doi: 10.1038/s41586-021-03497-0
19. Aubert A, Costalat R, Valabrègue R. Modelling of the coupling between brain electrical activity and metabolism. Acta Biotheor (2001) 49(4):301–26. doi: 10.1023/a:1014286728421
20. Cloutier M, Bolger FB, Lowry JP, Wellstead P. An integrative dynamic model of brain energy metabolism using in vivo neurochemical measurements. J Comput Neurosci (2009) 27(3):391–414. doi: 10.1007/s10827-009-0152-8
21. Winter F, Bludszuweit-Philipp C, Wolkenhauer O. Mathematical analysis of the influence of brain metabolism on the BOLD signal in Alzheimer’s disease. J Cereb Blood Flow Metab (2018) 38(2):304–16. doi: 10.1177/0271678X17693024
22. Berndt N, Kann O, Holzhütter H-G. Physiology-based kinetic modeling of neuronal energy metabolism unravels the molecular basis of NAD(P)H fluorescence transients. J Cereb Blood Flow Metab (2015) 35(9):1494–506. doi: 10.1038/jcbfm.2015.70
23. Theurey P, Connolly NMC, Fortunati I, Basso E, Lauwen S, Ferrante C, et al. Systems biology identifies preserved integrity but impaired metabolism of mitochondria due to a glycolytic defect in Alzheimer’s disease neurons. Aging Cell (2019) 18(3):e12924. doi: 10.1111/acel.12924
24. Jolivet R, Coggan JS, Allaman I, Magistretti PJ. Multi-timescale modeling of activity-dependent metabolic coupling in the neuron-glia-vasculature ensemble. PloS Comput Biol (2015) 11(2):e1004036. doi: 10.1371/journal.pcbi.1004036
25. Palla AR, Ravichandran M, Wang YX, Alexandrova L, Yang AV, Kraft P, et al. Inhibition of prostaglandin-degrading enzyme 15-PGDH rejuvenates aged muscle mass and strength. Science (2021) 371(6528):eabc8059. doi: 10.1126/science.abc8059
26. Schaum N, Lehallier B, Hahn O, Pálovics R, Hosseinzadeh S, Lee SE, et al. Ageing hallmarks exhibit organ-specific temporal signatures. Nature (2020) 583(7817):596–602. doi: 10.1038/s41586-020-2499-y
27. Zhang MJ, Pisco AO, Darmanis S, Zou J. Mouse aging cell atlas analysis reveals global and cell type-specific aging signatures. eLife (2021) 10:e62293. doi: 10.7554/eLife.62293
28. Dong Y, Brewer GJ. Global metabolic shifts in age and Alzheimer’s disease mouse brains pivot at NAD+/NADH redox sites. J Alzheimers Dis (2019) 71(1):119–40. doi: 10.3233/JAD-190408
29. Cox MF, Hascup ER, Bartke A, Hascup KN. Friend or foe? Defining the role of glutamate in aging and Alzheimer’s disease. Front Aging (2022) 3:929474. doi: 10.3389/fragi.2022.929474
30. Pellerin L, Magistretti PJ. Glutamate uptake into astrocytes stimulates aerobic glycolysis: a mechanism coupling neuronal activity to glucose utilization. Proc Natl Acad Sci USA (1994) 91(22):10625–9. doi: 10.1073/pnas.91.22.10625
31. Magistretti PJ, Pellerin L. Cellular bases of brain energy metabolism and their relevance to functional brain imaging: evidence for a prominent role of astrocytes. Cereb Cortex (1996) 6(1):50–61. doi: 10.1093/cercor/6.1.50
32. Pellerin L, Pellegri G, Bittar PG, Charnay Y, Bouras C, Martin JL, et al. Evidence supporting the existence of an activity-dependent astrocyte-neuron lactate shuttle. Dev Neurosci (1998) 20(4–5):291–9. doi: 10.1159/000017324
33. Mason S. Lactate shuttles in neuroenergetics-homeostasis, allostasis and beyond. Front Neurosci (2017) 11:43. doi: 10.3389/fnins.2017.00043
34. Acevedo A, Torres F, Kiwi M, Baeza-Lehnert F, Barros LF, Lee-Liu D, et al. Metabolic switch in the aging astrocyte supported via integrative approach comprising network and transcriptome analyses. Aging (2023) 15(19):9896–912. doi: 10.18632/aging.204663
35. Baeza-Lehnert F, Saab AS, Gutiérrez R, Larenas V, Díaz E, Horn M, et al. Non-canonical control of neuronal energy status by the Na+ pump. Cell Metab (2019) 29(3):668–680.e4. doi: 10.1016/j.cmet.2018.11.005
36. Atkinson DE. The energy charge of the adenylate pool as a regulatory parameter. Interaction with feedback modifiers. Biochemistry (1968) 7(11):4030–4. doi: 10.1021/bi00851a033
37. Howarth C, Gleeson P, Attwell D. Updated energy budgets for neural computation in the neocortex and cerebellum. J Cereb Blood Flow Metab (2012) 32(7):1222–32. doi: 10.1038/jcbfm.2012.35
38. Yi G, Grill WM. Average firing rate rather than temporal pattern determines metabolic cost of activity in thalamocortical relay neurons. Sci Rep (2019) 9(1):6940. doi: 10.1038/s41598-019-43460-8
39. Zhu F, Wang R, Pan X, Zhu Z. Energy expenditure computation of a single bursting neuron. Cognit Neurodyn (2019) 13(1):75–87. doi: 10.1007/s11571-018-9503-3
40. Niven JE. Neuronal energy consumption: biophysics, efficiency and evolution. Curr Opin Neurobiol (2016) 41:129–35. doi: 10.1016/j.conb.2016.09.004
41. Meyer DJ, Díaz-García CM, Nathwani N, Rahman M, Yellen G. The Na+/K+ pump dominates control of glycolysis in hippocampal dentate granule cells. eLife (2022) 11:e81645. doi: 10.7554/eLife.81645
42. Barros LF. How expensive is the astrocyte? J Cereb Blood Flow Metab (2022) 42(5):738–45. doi: 10.1177/0271678X221077343
43. Bélanger M, Allaman I, Magistretti PJ. Brain energy metabolism: focus on astrocyte-neuron metabolic cooperation. Cell Metab (2011) 14(6):724–38. doi: 10.1016/j.cmet.2011.08.016
44. Brilkova M, Nigri M, Kumar HS, Moore J, Mantovani M, Keller C, et al. Error-prone protein synthesis recapitulates early symptoms of Alzheimer disease in aging mice. Cell Rep (2022) 40(13):111433. doi: 10.1016/j.celrep.2022.111433
45. Weber B, Barros LF. The astrocyte: powerhouse and recycling center. Cold Spring Harb Perspect Biol (2015) 7(12):a020396. doi: 10.1101/cshperspect.a020396
46. Hagberg AA, Schult DA, Swart PJ. Exploring network structure, dynamics, and function using NetworkX [paper 2]. In: Varoquaux G, Vaught T, Millman J, editors. Proceedings of the 7th Python in Science Conference. Pasadena, CA: SciPy (2008). 11–5. doi: 10.25080/TCWV9851
47. Reimann MW, Nolte M, Scolamiero M, Turner K, Perin R, Chindemi G, et al. Cliques of neurons bound into cavities provide a missing link between structure and function. Front Comput Neurosci (2017) 11:48. doi: 10.3389/fncom.2017.00048
48. Sizemore AE, Giusti C, Kahn A, Vettel JM, Betzel RF, Bassett DS. Cliques and cavities in the human connectome. J Comput Neurosci (2018) 44(1):115–45. doi: 10.1007/s10827-017-0672-6
49. Keenan AB, Torre D, Lachmann A, Leong AK, Wojciechowicz ML, Utti V, et al. ChEA3: transcription factor enrichment analysis by orthogonal omics integration. Nucleic Acids Res (2019) 47(W1):W212–24. doi: 10.1093/nar/gkz446
50. Tripathi M, Yen PM, Singh BK. Estrogen-related receptor alpha: an under-appreciated potential target for the treatment of metabolic diseases. Int J Mol Sci (2020) 21(5):1645. doi: 10.3390/ijms21051645
51. Cantó C, Gerhart-Hines Z, Feige JN, Lagouge M, Noriega L, Milne JC, et al. AMPK regulates energy expenditure by modulating NAD+ metabolism and SIRT1 activity. Nature (2009) 458(7241):1056–60. doi: 10.1038/nature07813
52. Yuk J-M, Kim TS, Kim SY, Lee H-M, Han J, Dufour CR, et al. Orphan nuclear receptor ERRα controls macrophage metabolic signaling and A20 expression to negatively regulate TLR-induced inflammation. Immunity (2015) 43(1):80–91. doi: 10.1016/j.immuni.2015.07.003
53. Kim SY, Yang C-S, Lee H-M, Kim JK, Kim Y-S, Kim Y-R, et al. ESRRA (estrogen-related receptor α) is a key coordinator of transcriptional and post-translational activation of autophagy to promote innate host defense. Autophagy (2018) 14(1):152–68. doi: 10.1080/15548627.2017.1339001
54. Suresh SN, Chavalmane AK, Pillai M, Ammanathan V, Vidyadhara DJ, Yarreiphang H, et al. Modulation of autophagy by a small molecule inverse agonist of ERRα is neuroprotective. Front Mol Neurosci (2018) 11:109. doi: 10.3389/fnmol.2018.00109
55. Amorim JA, Coppotelli G, Rolo AP, Palmeira CM, Ross JM, Sinclair DA. Mitochondrial and metabolic dysfunction in ageing and age-related diseases. Nat Rev Endocrinol (2022) 18(4):243–58. doi: 10.1038/s41574-021-00626-7
56. Szklarczyk D, Gable AL, Lyon D, Junge A, Wyder S, Huerta-Cepas J, et al. STRING v11: protein–protein association networks with increased coverage, supporting functional discovery in genome-wide experimental datasets. Nucleic Acids Res (2019) 47(D1):D607–13. doi: 10.1093/nar/gky1131
57. Campisi J, Kapahi P, Lithgow GJ, Melov S, Newman JC, Verdin E. From discoveries in ageing research to therapeutics for healthy ageing. Nature (2019) 571(7764):183–92. doi: 10.1038/s41586-019-1365-2
58. Rajman L, Chwalek K, Sinclair DA. Therapeutic potential of NAD-boosting molecules: the in vivo evidence. Cell Metab (2018) 27(3):529–47. doi: 10.1016/j.cmet.2018.02.011
59. Jung WB, Im GH, Jiang H, Kim S-G. Early fMRI responses to somatosensory and optogenetic stimulation reflect neural information flow. Proc Natl Acad Sci USA (2021) 118(11):e2023265118. doi: 10.1073/pnas.2023265118
60. Calvetti D, Capo Rangel G, Gerardo Giorda L, Somersalo E. A computational model integrating brain electrophysiology and metabolism highlights the key role of extracellular potassium and oxygen. J Theor Biol (2018) 446:238–58. doi: 10.1016/j.jtbi.2018.02.029
61. Edfors F, Danielsson F, Hallström BM, Käll L, Lundberg E, Pontén F, et al. Gene-specific correlation of RNA and protein levels in human cells and tissues. Mol Syst Biol (2016) 12(10):883. doi: 10.15252/msb.20167144
62. Liu Y, Beyer A, Aebersold R. On the dependency of cellular protein levels on mRNA abundance. Cell (2016) 165(3):535–50. doi: 10.1016/j.cell.2016.03.014
63. Power JM, Wu WW, Sametsky E, Oh MM, Disterhoft JF. Age-related enhancement of the slow outward calcium-activated potassium current in hippocampal CA1 pyramidal neurons in vitro. J Neurosci (2002) 22(16):7234–43. doi: 10.1523/JNEUROSCI.22-16-07234.2002
64. Disterhoft JF, Oh MM. Alterations in intrinsic neuronal excitability during normal aging. Aging Cell (2007) 6(3):327–36. doi: 10.1111/j.1474-9726.2007.00297.x
65. Kumar A, Foster TC. Neurophysiology of old neurons and synapses. In: Riddle DR, editor. Brain aging: models, methods, and mechanisms. Boca Raton, FL: CRC Press (2007). 229–50. doi: 10.1201/9781420005523.ch10
66. Smithers HE, Terry JR, Brown JT, Randall AD. Aging-associated changes to intrinsic neuronal excitability in the bed nucleus of the stria terminalis is cell type-dependent. Front Aging Neurosci (2017) 9:424. doi: 10.3389/fnagi.2017.00424
67. Vitale P, Salgueiro-Pereira AR, Lupascu CA, Willem M, Migliore R, Migliore M, et al. Analysis of age-dependent alterations in excitability properties of CA1 pyramidal neurons in an APPPS1 model of Alzheimer’s disease. Front Aging Neurosci (2021) 13:668948. doi: 10.3389/fnagi.2021.668948
68. Horowitz AM, Fan X, Bieri G, Smith LK, Sanchez-Diaz CI, Schroer AB, et al. Blood factors transfer beneficial effects of exercise on neurogenesis and cognition to the aged brain. Science (2020) 369(6500):167–73. doi: 10.1126/science.aaw2622
69. Stillman CM, Esteban-Cornejo I, Brown B, Bender CM, Erickson KI. Effects of exercise on brain and cognition across age groups and health states. Trends Neurosci (2020) 43(7):533–43. doi: 10.1016/j.tins.2020.04.010
70. Xue X, Liu B, Hu J, Bian X, Lou S. The potential mechanisms of lactate in mediating exercise-enhanced cognitive function: a dual role as an energy supply substrate and a signaling molecule. Nutr Metab (Lond) (2022) 19(1):52. doi: 10.1186/s12986-022-00687-z
71. Meidenbauer JJ, Ta N, Seyfried TN. Influence of a ketogenic diet, fish-oil, and calorie restriction on plasma metabolites and lipids in C57BL/6J mice. Nutr Metab (Lond) (2014) 11:23. doi: 10.1186/1743-7075-11-23
72. Singh A, D’Amico D, Andreux PA, Fouassier AM, Blanco-Bose W, Evans M, et al. Urolithin A improves muscle strength, exercise performance, and biomarkers of mitochondrial health in a randomized trial in middle-aged adults. Cell Rep Med (2022) 3(5):100633. doi: 10.1016/j.xcrm.2022.100633
73. Kulkarni AS, Gubbi S, Barzilai N. Benefits of metformin in attenuating the hallmarks of aging. Cell Metab (2020) 32(1):15–30. doi: 10.1016/j.cmet.2020.04.001
74. Yoshino J, Baur JA, Imai S-I. NAD+ intermediates: the biology and therapeutic potential of NMN and NR. Cell Metab (2018) 27(3):513–28. doi: 10.1016/j.cmet.2017.11.002
75. Chang A, Jeske L, Ulbrich S, Hofmann J, Koblitz J, Schomburg I, et al. BRENDA, the ELIXIR core data resource in 2021: new developments and updates. Nucleic Acids Res (2021) 49(D1):D498–508. doi: 10.1093/nar/gkaa1025
76. Wittig U, Rey M, Weidemann A, Kania R, Müller W. SABIO-RK: an updated resource for manually curated biochemical reaction kinetics. Nucleic Acids Res (2018) 46(D1):D656–60. doi: 10.1093/nar/gkx1065
77. Neves SR. Obtaining and estimating kinetic parameters from the literature. Sci Signal (2011) 4(191):tr8. doi: 10.1126/scisignal.2001988
78. Dienel GA. Brain lactate metabolism: the discoveries and the controversies. J Cereb Blood Flow Metab (2012) 32(7):1107–38. doi: 10.1038/jcbfm.2011.175
79. Mongeon R, Venkatachalam V, Yellen G. Cytosolic NADH-NAD+ redox visualized in brain slices by two-photon fluorescence lifetime biosensor imaging. Antioxid Redox Signal (2016) 25(10):553–63. doi: 10.1089/ars.2015.6593
80. Erecińska M, Silver IA. ATP and brain function. J Cereb Blood Flow Metab (1989) 9(1):2–19. doi: 10.1038/jcbfm.1989.2
81. Köhler S, Schmidt H, Fülle P, Hirrlinger J, Winkler U. A dual nanosensor approach to determine the cytosolic concentration of ATP in astrocytes. Front Cell Neurosci (2020) 14:565921. doi: 10.3389/fncel.2020.565921
82. Tantama M, Martínez-François JR, Mongeon R, Yellen G. Imaging energy status in live cells with a fluorescent biosensor of the intracellular ATP-to-ADP ratio. Nat Commun (2013) 4:2550. doi: 10.1038/ncomms3550
83. Mächler P, Wyss MT, Elsayed M, Stobart J, Gutierrez R, von Faber-Castell A, et al. In vivo evidence for a lactate gradient from astrocytes to neurons. Cell Metab (2016) 23(1):94–102. doi: 10.1016/j.cmet.2015.10.010
84. Benton D, Parker PY, Donohoe RT. The supply of glucose to the brain and cognitive functioning. J Biosoc Sci (1996) 28(4):463–79. doi: 10.1017/S0021932000022537
85. Barros LF, San Martín A, Ruminot I, Sandoval PY, Fernández-Moncada I, Baeza-Lehnert F, et al. Near-critical GLUT1 and neurodegeneration. J Neurosci Res (2017) 95(11):2267–74. doi: 10.1002/jnr.23998
86. Barros LF, Bittner CX, Loaiza A, Porras OH. A quantitative overview of glucose dynamics in the gliovascular unit. Glia (2007) 55(12):1222–37. doi: 10.1002/glia.20375
87. Jolivet R, Allaman I, Pellerin L, Magistretti PJ, Weber B. Comment on recent modeling studies of astrocyte–neuron metabolic interactions. J Cereb Blood Flow Metab (2010) 30(12):1982–6. doi: 10.1038/jcbfm.2010.132
88. Chuquet J, Quilichini P, Nimchinsky EA, Buzsáki G. Predominant enhancement of glucose uptake in astrocytes versus neurons during activation of the somatosensory cortex. J Neurosci (2010) 30(45):15298–303. doi: 10.1523/JNEUROSCI.0762-10.2010
89. Bezanson J, Edelman A, Karpinski S, Shah VB. Julia: A fresh approach to numerical computing. SIAM Rev (2017) 59(1):65–98. doi: 10.1137/141000671
90. Rackauckas C, Nie Q. DifferentialEquations.jl – A performant and feature-rich ecosystem for solving differential equations in Julia. J Open Res Softw (2017) 5(1):15. doi: 10.5334/jors.151
91. Pospischil M, Toledo-Rodriguez M, Monier C, Piwkowska Z, Bal T, Frégnac Y, et al. Minimal Hodgkin–Huxley type models for different classes of cortical and thalamic neurons. Biol Cybern (2008) 99(4–5):427–41. doi: 10.1007/s00422-008-0263-8
92. Øyehaug L, Østby I, Lloyd CM, Omholt SW, Einevoll GT. Dependence of spontaneous neuronal firing and depolarisation block on astroglial membrane transport mechanisms. J Comput Neurosci (2012) 32(1):147–65. doi: 10.1007/s10827-011-0345-9
93. Krishnan GP, Filatov G, Shilnikov A, Bazhenov M. Electrogenic properties of the Na+/K+ ATPase control transitions between normal and pathological brain states. J Neurophysiol (2015) 113(9):3356–74. doi: 10.1152/jn.00460.2014
94. Witthoft A, Filosa JA, Karniadakis GE. Potassium buffering in the neurovascular unit: models and sensitivity analysis. Biophys J (2013) 105(9):2046–54. doi: 10.1016/j.bpj.2013.09.012
96. Kiyatkin EA, Lenoir M. Rapid fluctuations in extracellular brain glucose levels induced by natural arousing stimuli and intravenous cocaine: fueling the brain during neural activation. J Neurophysiol (2012) 108(6):1669–84. doi: 10.1152/jn.00521.2012
97. Fillenz M, Lowry JP. Studies of the source of glucose in the extracellular compartment of the rat brain. Dev Neurosci (1998) 20(4–5):365–8. doi: 10.1159/000017332
98. Simpson IA, Carruthers A, Vannucci SJ. Supply and demand in cerebral energy metabolism: the role of nutrient transporters. J Cereb Blood Flow Metab (2007) 27(11):1766–91. doi: 10.1038/sj.jcbfm.9600521
99. Shichkova P, Coggan JS, Markram H, Keller D. A standardized brain molecular atlas: a resource for systems modeling and simulation. Front Mol Neurosci (2021) 14:604559. doi: 10.3389/fnmol.2021.604559
100. Brunk E, Sahoo S, Zielinski DC, Altunkaya A, Dräger A, Mih N, et al. Recon3D enables a three-dimensional view of gene variation in human metabolism. Nat Biotechnol (2018) 36(3):272–81. doi: 10.1038/nbt.4072
101. Tabula Muris Consortium. A single-cell transcriptomic atlas characterizes ageing tissues in the mouse. Nature (2020) 583(7817):590–5. doi: 10.1038/s41586-020-2496-1
102. King ZA, Lu J, Dräger A, Miller P, Federowicz S, Lerman JA, et al. BiGG Models: a platform for integrating, standardizing and sharing genome-scale models. Nucleic Acids Res (2016) 44(D1):D515–22. doi: 10.1093/nar/gkv1049
Appendix
See Supplementary Material (Presentation 1) for more information, as well as the following supplementary tables and figures:
● Supplementary Table 1. Observed aging effects and their comparison to the literature.
● Supplementary Table 2. Data sources with references per model component.
● Supplementary Table 3. Anti-aging optimization results.
● Supplementary Figure 1. Validation, predicted energy budget.
● Supplementary Figure 2. ATP production, glucose and lactate transport fluxes.
● Supplementary Figure 3. Differences between young and old in rest state concentrations (top) and in sum of relative deviations of concentration from rest (normalized by rest state) upon synaptic activation (bottom), both ranked by rest state differences (top), only top ranked are shown.
● Supplementary Figure 4. Comparison of amplitudes of metabolic response to synaptic activation in young and old ages (filtered by absolute values of deviations and difference in deviations of higher than 1%).
● Supplementary Figure 5. Train of APs evoked by 1 nA current injection simulations.
● Supplementary Figure 6. Aging-associated differences in range of response to the current injections of different amplitudes.
● Supplementary Figure 7. Dependence of metabolism and electrophysiology responses on the current injection amplitude in young and old ages.
● Supplementary Figure 8. UMAP of relative differences in concentration traces in old compared to young.
● Supplementary Figure 9. Kendall correlation of metabolite concentrations time series data in aging.
● Supplementary Figure 10. Cytosolic NADH fluxes.
● Supplementary Figure 11. Cytosolic NADPH fluxes.
● Supplementary Figure 12. Mitochondrial NADH fluxes.
● Supplementary Figure 13. Lactate shuttle in conditions with different blood glucose levels.
● Supplementary Figure 14. Comparison of synaptic activation and current injection evoked metabolic responses.
● Supplementary Figure 15. Sensitivities curve fit.
● Supplementary Figure 16. Metabolic adaptability difference.
● Supplementary Figure 17. Bottom-up iterative model building workflow and the key considerations.
● Supplementary Figure 18. Labels of individual metabolites for Figure 4A.
● Supplementary Figure 19. Literature evidence for ESRRA being a regulatory hub of aging-associated pathways (colored by reference).
● Supplementary Information File 1: Explanation of the Fruchterman-Reingold force-directed algorithm to position nodes. Centrality in the context of metabolic adaptability.
● Supplementary Information File 2: Changes in other characteristics of neuronal firing (related to Figure 3). Statistical tests for comparison of characteristics of neuronal firing (Figure 3).
● Supplementary Information File 3: Detailed discussion of top-scored TFs.
● Supplementary Information File 4: Model equations. Baseline young state rate functions. Rate functions with the aging-defined scaling factors.
● Supplementary Information File 5: Model parameters. Age-specific parameters and initial values of variables.
● Supplementary Information File 6: Derived entities.
● Supplementary Information File 7: Mapping of model variables indexes to descriptive names and Bigg (102) nomenclature (where available).
● Supplementary Information File 8: Model variables initial values.
● Supplementary Information References
Keywords: brain aging, aging metabolism, brain energy metabolism, neurometabolic coupling, neuro-glia-vascular system, metabolism model, aging brain model, differential equations model
Citation: Shichkova P, Coggan JS, Kanari L, Boci E, Favreau C, Antonel SM, Keller D and Markram H. Breakdown and repair of metabolism in the aging brain. Front Sci (2025) 3:1441297. doi: 10.3389/fsci.2025.1441297
Received: 30 May 2024; Accepted: 15 January 2025;
Published: 25 March 2025.
Edited by:
Jon Storm-Mathisen, University of Oslo, NorwayReviewed by:
Richard B. Buxton, University of California, San Diego, United StatesLuc Pellerin, University of Poitiers, France
Copyright © 2025 Shichkova, Coggan, Kanari, Boci, Favreau, Antonel, Keller and Markram. This is an open-access article distributed under the terms of the Creative Commons Attribution License (CC BY). The use, distribution or reproduction in other forums is permitted, provided the original author(s) and the copyright owner(s) are credited and that the original publication in this journal is cited, in accordance with accepted academic practice. No use, distribution or reproduction is permitted which does not comply with these terms.
*Correspondence: Polina Shichkova, cG9saW5hLnNoaWNoa292YUBhbHVtbmkuZXBmbC5jaA==; Henry Markram, aGVucnkubWFya3JhbUBlcGZsLmNo
†Present address: Polina Shichkova, Biognosys AG, Schlieren, Switzerland