Explore article hub
 Eric Dinerstein1*
 Anup R. Joshi2
 Nathan R. Hahn1
 Andy T. L. Lee1
 Carly Vynne1
 Karl Burkart3
 Gregory P. Asner4
 Charlotte Beckham5Gerardo Ceballos6
 Richard Cuthbert5
 Rodolfo Dirzo7Oliver Fankem8
 Sarah Hertel3
 Binbin V. Li9
 Haley Mellin10Félix Pharand-Deschênes11David Olson12Bivash Pandav13
 Carlos A. Peres14,15Rudi Putra16
 Amy Rosenthal17,18
 Caspar Verwer19Eric Wikramanayake20Andrew Zolli17
- 1RESOLVE, Washington, DC, United States
- 2Conservation Sciences Program, Department of Fisheries, Wildlife and Conservation Biology, University of Minnesota, Minneapolis, MN, United States
- 3One Earth, Culver City, CA, United States
- 4Center for Global Discovery and Conservation Science, Arizona State University, Tempe, AZ, United States
- 5World Land Trust, Halesworth, United Kingdom
- 6Instituto de Ecología, Universidad Nacional Autónoma de México, Ciudad de México, Mexico
- 7Department of Biology, Stanford University, Stanford, CA, United States
- 8Global Conservation, Yaoundé, Cameroon
- 9Environmental Research Center, Duke Kunshan University, Suzhou, Jiangsu, China
- 10Conserve, Fairfax, CA, United States
- 11Globaïa, Wellington, New Zealand
- 12Conservation Earth, Sharma, Saudi Arabia
- 13Wildlife Institute of India, Dehradun, India
- 14School of Environmental Sciences, University of East Anglia, Norwich, United Kingdom
- 15Instituto Juruá, Manaus, AM, Brazil
- 16Forum Konservasi Leuser, Aceh, Indonesia
- 17Planet Labs PBC, San Francisco, CA, United States
- 18Field Museum of Natural History, Chicago, IL, United States
- 19International Union for Conservation of Nature (IUCN) - Netherlands, Amsterdam, Netherlands
- 20Environmental Foundation, Colombo, Sri Lanka
Abstract
Ambitious biodiversity goals to protect 30% or more of the Earth’s surface by 2030 (30x30) require strategic near-term targets. To define areas that must be protected to prevent the most likely and imminent extinctions, we propose Conservation Imperatives—16,825 unprotected sites spanning ~164 Mha of the terrestrial realm that harbor rare and threatened species. We estimate that protecting the Conservation Imperatives would cost approximately US$169 billion (90% probability: US$146—US$228 billion). Globally, 38% of the 16,825 sites are either adjacent to or within 2.5 km of an existing protected area, potentially reducing land acquisition and management costs. These sites should be prioritized for conservation action over the next 5 years as part of a broader strategy to expand the global protected area network. The expansion of global protected areas between 2018 and 2023 incorporated only 7% of sites harboring range-limited and threatened species, highlighting a renewed urgency to conserve these habitats. Permanently protecting only 0.74% of land found in the tropics, where Conservation Imperatives are concentrated, could prevent the majority of predicted near-term extinctions once adequately resourced. We estimate this cost to be from US$29 billion to US$46 billion per year over the next 5 years. Multiple approaches will be required to meet long-term protection goals: providing rights and titles to Indigenous Peoples and Local Communities (IPLCs) conserving traditional lands, government designation of new protected areas on federal and state lands, and land purchase or long-term leasing of privately held lands.
Key points
- There is an urgent need to prioritize the conservation of habitats of rare and threatened species as part of a larger global biodiversity strategy.
- Conservation Imperatives offer a solution to conserving the last unprotected sites harboring rare, range-restricted, and threatened species and should be a central component of the ambitious goals to protect at least 30% of the Earth’s surface by 2030.
- The Conservation Imperatives identified in this study are highly concentrated, requiring only ~164 Mha globally to avoid extinctions; this equates to only 1.22% of the Earth’s entire terrestrial surface and 0.74% of land in the tropics.
- Targeted investments to prevent extinctions in parallel with the conservation of carbon-rich regions are necessary as the world sets about expanding the protected area network from 15.7% today to 30% by 2030.
- Conserving Conservation Imperatives is achievable and affordable, especially in the tropics, as the purchase of the tropical subset of Conservation Imperatives costs about US$169 billion (90% probability: US$146–US$228 billion), or US$34 billion (90% probability: US$29.2–US$45.6 billion) per year over 5 years.
- As Conservation Imperatives represent the most biologically important and threatened places to protect, they can be thought of as “anchor points” to design regional-scale conservation planning efforts under 30×30.
Introduction
In late December 2022, at the United Nations Convention on Biological Diversity’s 15th Conference of Parties (COP15), more than 190 parties adopted the 30×30 target—to protect at least 30% of the world’s lands, oceans, and inland waters by 2030 (1). Conservation biologists, Indigenous Peoples, science-based NGOs, corporate leaders, and others have endorsed the 30×30 target and also called for protecting half of the terrestrial realm for humanity to have the best chance to reverse biodiversity loss, stabilize Earth’s climate, prevent ecosystem collapse, and avoid future pandemics (2–5). Either goal—30% protected or 50% protected—will encourage the protection of large areas of land to meet targets, but this strategy can easily result in an underrepresentation of biodiversity (6). Land protection targets must account for the urgency of preventing numerous species extinctions and extirpations of small, rare, and range-restricted populations.
The purpose of this paper is to offer a science-based strategy to secure and protect the remaining homes of rare and endangered species through timely, affordable investments in land acquisition and habitat conservation. To this end, we introduce the term Conservation Imperatives, defined as currently unprotected sites that contain rare, threatened, and narrow-range endemic species. Specifically, our approach is to map unprotected sites harboring rare species while accounting for converted habitats and estimating costs to put these lands under conservation stewardship. We also seek to determine progress in the protection of global sites of rarity as determined from 2018 to 2023. Finally, we outline new efforts to leverage Conservation Imperatives to finance protection where immediate focus is needed and create anchor points for wider conservation planning under a global 5-year strategy.
Advancing Conservation Imperatives is a global prioritization scheme in the sense that preventing extinctions is proposed as an immediate conservation target. We strive for maximum buy-in by all nations, Indigenous groups, and local communities who have jurisdiction over such lands to preserve opportunities for expanding protection to Conservation Imperatives. We intentionally avoid prioritizing sites on a global scale. The maps and data we present here should be used as a starting point for subsequent ecoregion-based or regional prioritizations within each realm. A rich literature on systematic conservation planning and reserve design can inform methodologies for evaluating and delineating proposed sites at the regional level (7–10). Local teams of experts in each country can also take advantage of higher-resolution spatial data—for species distributions, population viability of threatened species, representation of rare habitats, land cover, extent of degraded lands, restoration potential, connectivity options, threats from development, extensive records of land purchase or leasing prices, and feasibility of conservation effort—often unavailable in global assessments. These essential planning efforts reinforce local ownership of Conservation Imperatives and will help reduce extinction risk by considering the likely future conditions in each region.
Methods
Species rarity layer
We combined six widely used data layers employed in published global biodiversity assessments to identify sites supporting rare, narrow-range endemic, and endangered species (4). Using the latest dataset of global protected areas (11) as our base map, we sequentially intersected polygons identified as supporting rare and threatened species to avoid double counting of the overlapped areas. These include Alliance for Zero Extinction (AZE) sites, the range-restricted rarity of forest species, the International Union for Conservation of Nature (IUCN) Red List, Key Biodiversity Areas (KBAs), a second estimator of range-restricted rarity among vertebrates, and range-restricted vascular plants. For more details on the construction of the species rarity layer, see Dinerstein et al. (4) (Presentation 1: Supplementary Table 1). The total extent of these six data layers, minus the area covered by global protected areas, determines the remaining unprotected segment, which defines the extent of the Conservation Imperatives (Figure 1). This layer of species rarity was then refined using the fractional land cover analysis described below.
Figure 1
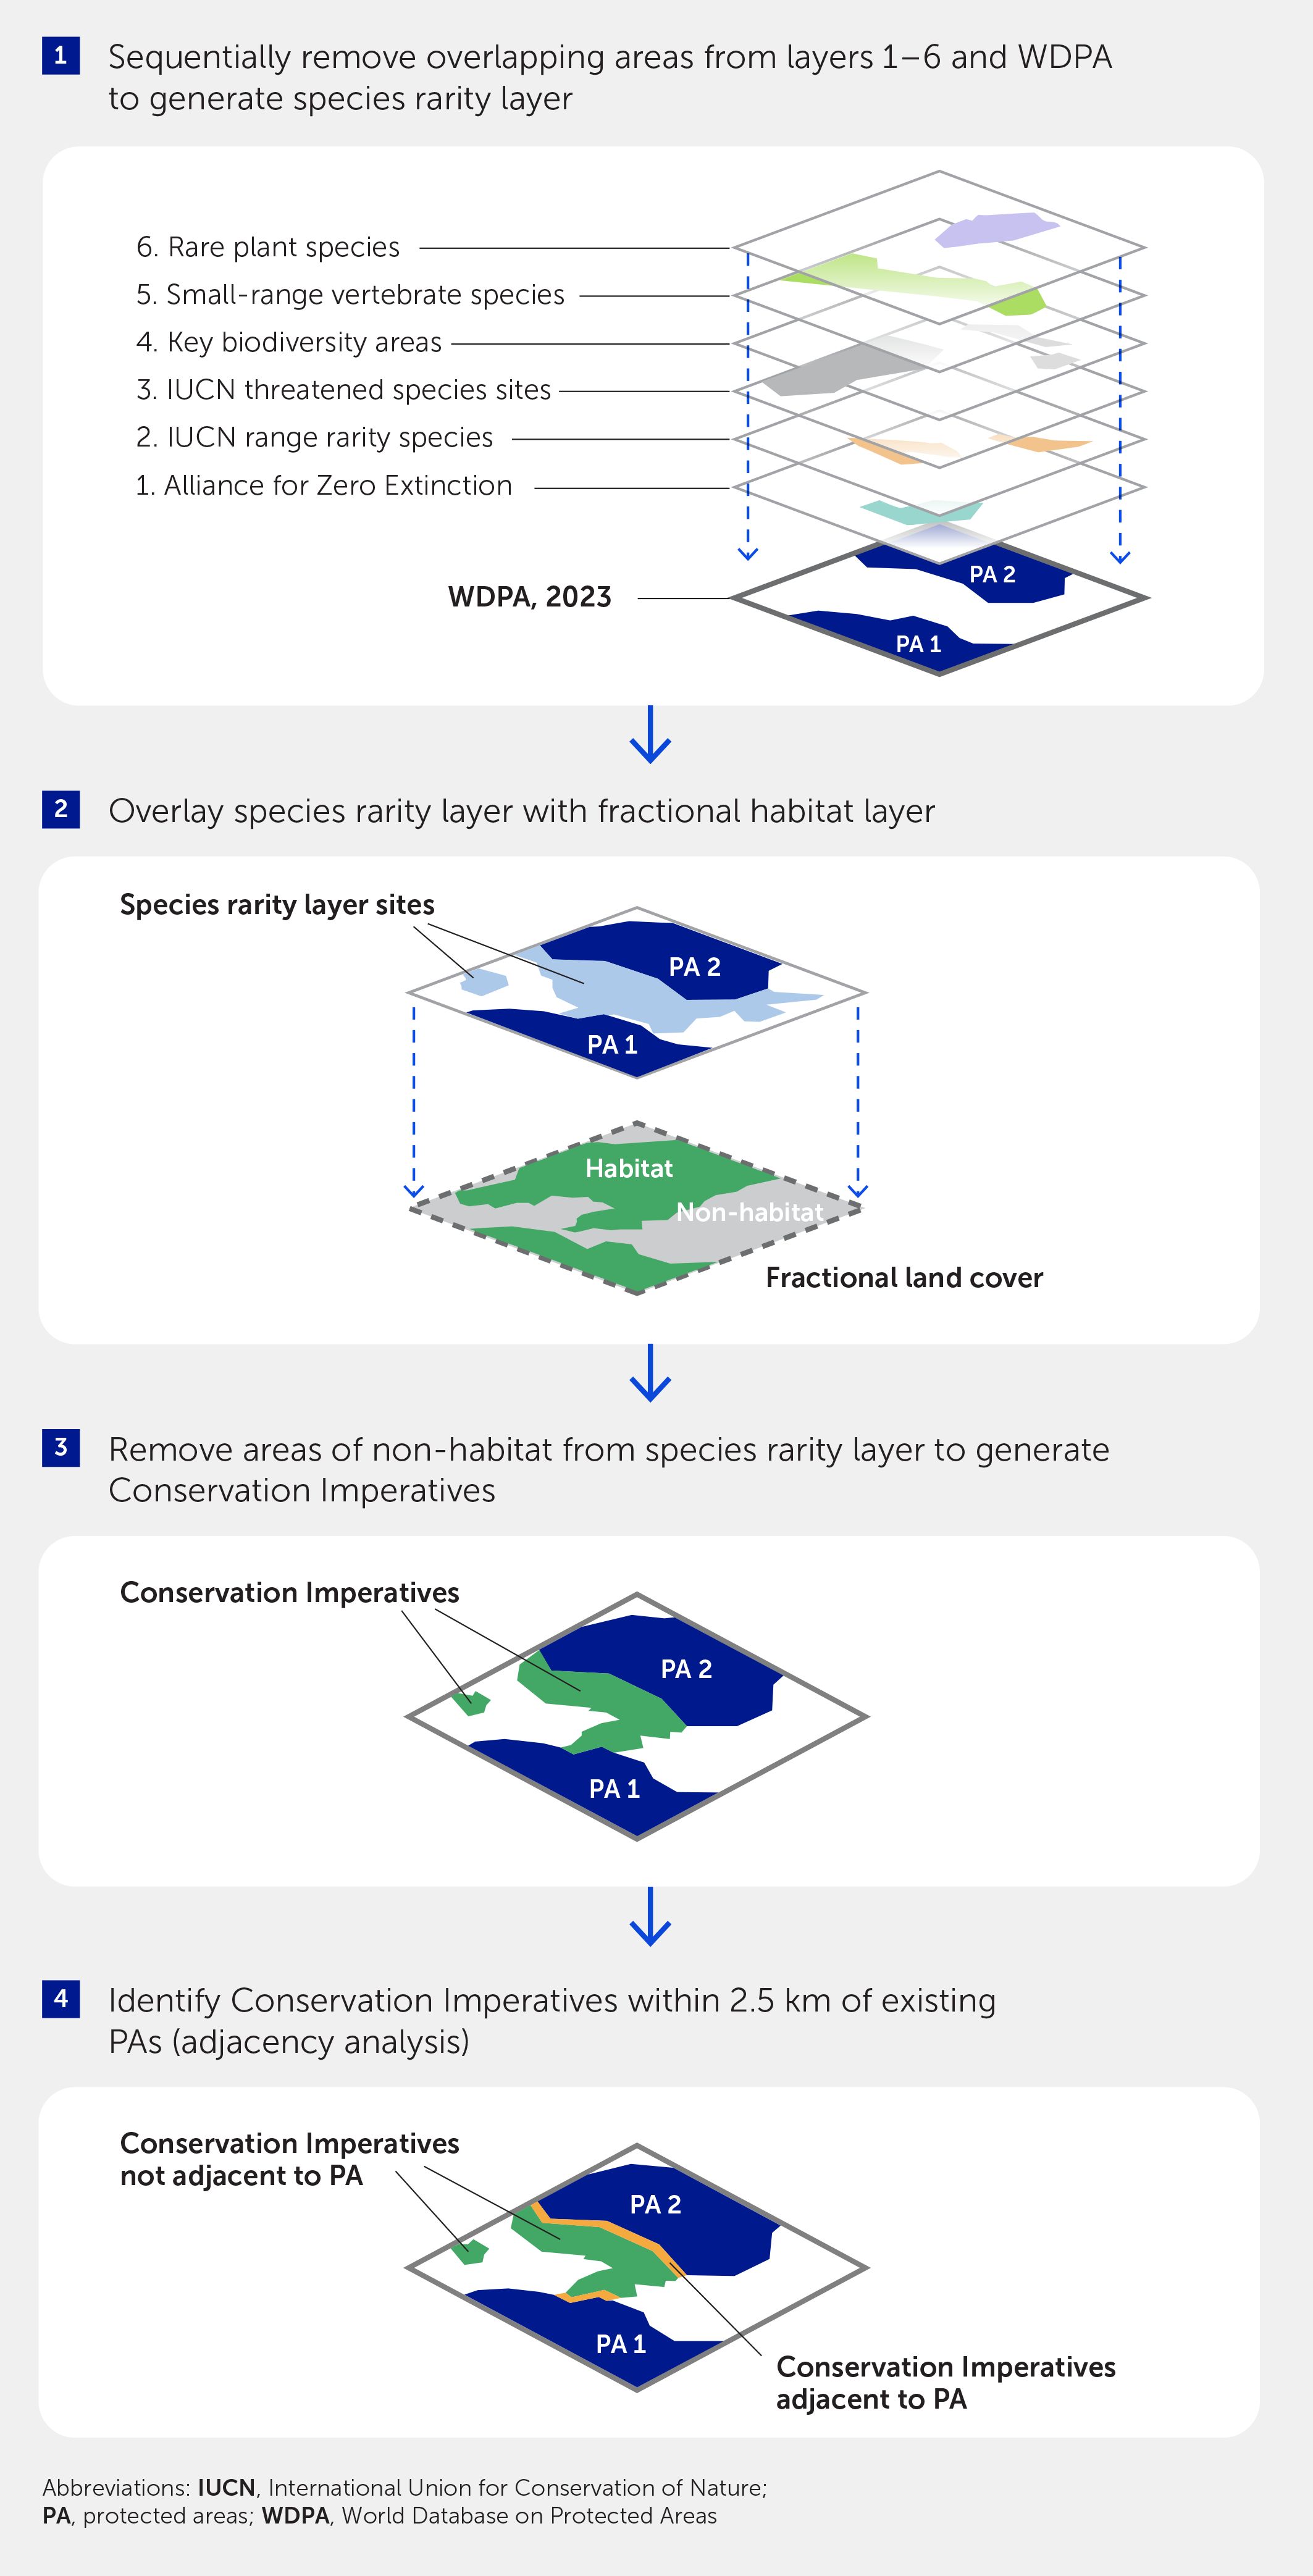
Figure 1 Schematic illustrating the construction of Conservation Imperatives and adjacency analysis. 1) Six layers of rare species data were overlaid together with the World Database on Protected Areas (11) to remove overlapping areas and generate the species rarity layer. 2) The resulting species rarity layer was overlaid on a fractional land cover map with areas of habitat and non-habitat. 3) Areas of non-habitat were removed from the species rarity layer to derive Conservation Imperatives. 4) After completion of the previous steps, spatial analysis was performed to identify Conservation Imperatives that are adjacent to an existing reserve (i.e., within 2.5 km).
For freshwater species, which are on average more endangered than terrestrial species, we relied on the same data layers for the following reasons: i) the life histories of some of the most endangered vertebrates in the IUCN Red List of Endangered Species (Layer 3, see Figure 1) could be considered freshwater or at least freshwater-dependent rather than terrestrial species. These taxa include amphibians and some reptile groups; ii) the IUCN Red List polygons (Layer 3) also contain the spatial distributions of several relatively well-studied freshwater taxa for which range maps exist. These include freshwater turtles, freshwater fish, freshwater crabs, freshwater mollusks, freshwater crayfishes and shrimps, odonates (dragonflies and damselflies), and some aquatic plants; and iii) more than half of all endangered vertebrates in the Alliance for Zero Extinction layer (Layer 1) are amphibians.
Fractional land cover analysis
We introduced a fractional land cover analysis to derive a more accurate estimate of the true Area of Habitat (hereafter “AoH”) for rare and threatened species because published range data contain varying amounts of agricultural, pastoral, and urban lands. The uneven resolution of the most widely used global biodiversity layers, coupled with rapid land-use change from conversion to agriculture and urbanization, results in many species rarity sites now containing areas of non-habitat. To identify and remove non-habitat, we used Copernicus Global Land Cover Layers CGLS-LC100 Collection 3 at 100 m resolution (12) (hereafter “Copernicus data”) and Google Earth Engine (13) to generate a land cover map that includes fractions of all land cover types occurring in a pixel at 100 m resolution.
We used seven classes to create the fractional layer: Forest, Shrub, Grass, Crop, Urban, Bare Ground, and Permanent Water (inland water bodies). We defined Forest using the percent tree cover in the Copernicus data that varied by biome and set cutoff levels based on expert knowledge in each biome and their distinguishing ecological characteristics. Forest is defined as pixels with a tree cover fraction > 80% for the tropical forest biome, > 50% for the temperate forest biome, and > 30% for the boreal forest and mangrove biomes. To differentiate desert habitat from bare ground in the desert and xeric shrub biome, desert is defined as > 70% bare soil and bare ground as 50–69% bare soil in this biome. For all other cover types, we did not differentiate the percent cover among biomes. Shrub cover is defined as pixels with a shrub cover fraction ≥ 30%; Grass as a grass cover fraction ≥ 50%; Bare Ground as a bare cover fraction ≥ 50%; Urban as an urban cover fraction ≥ 10%; Permanent Water (inland) as a permanent water cover fraction ≥ 30%; and Crop as a cropland cover fraction >1% (to avoid any potential cultivated areas).
The species rarity layer and the fractional land cover map were overlaid to calculate the contribution of different cover types to unprotected polygons (Figure 1). To calculate the AoH (14) in species rarity sites, we masked all land in the Crop, Urban, and Bare Ground cover types. We recognize that crops and bare ground can represent suitable habitats for some species that are threatened or have restricted ranges. Evaluating these individual species’ requirements is, however, beyond the scope of this global assessment. In instances where the fractional land cover analysis resulted in small, isolated fragments of rare species habitat surrounded by developed or cultivated land, fragments smaller than 1 ha were removed due to high near-term conversion risk. Finally, we overlaid the resulting species rarity layer with the world’s 846 terrestrial ecoregion boundaries to be able to categorize Conservation Imperatives by ecoregion (15). The result of these sequential overlays allows us to identify Conservation Imperatives (Figure 1).
Adjacency analysis
To determine the adjacency of Conservation Imperatives to existing reserves mapped in the World Database on Protected Areas (WDPA) layer (Figure 1), we buffered protected areas by 2.5 km and assessed which sites fell within this buffer. For this exercise, we assumed that site protection and management could be easier than the expansion of existing protected areas or corridor establishment. We chose 2.5 km as the upper limit based on the minimum corridor width recommended for the largest terrestrial vertebrates (elephants) to move between isolated patches of habitat (16).
Cost assessment
Establishing accurate spatial delineation of Conservation Imperatives sets the stage for estimating the expected costs of protected area designation. Previous assessments of costs for conservation at the global scale have relied on extrapolation of land values based on agricultural and pastoral potential (17, 18). Despite recent calls for datasets reflecting the real costs of land for conservation (19, 20), comprehensive datasets remain unavailable. Complicating this estimation is that multiple stewardship mechanisms with different cost implications—such as private land purchase, leasing of community reserves and forests, re-establishing Indigenous land rights, and government re-designations—affect the true total costs of protecting sites harboring rare species. Using actual data on costs to place land under conservation stewardship can provide a clearer approximation of the resources required to secure critical sites for biodiversity (19).
To estimate the cost of securing Conservation Imperative sites in the tropical belt, we collected empirical data from land protection projects occurring between 2008 and 2022, fit generalized linear regression models, and applied a simulation approach. Our dataset consisted of 1,016 projects compiled from IUCN Netherlands, the Quick Response Fund for Nature, and World Land Trust (21), supplemented by unpublished data from other NGOs focused on land purchases that met our criteria for inclusion. These organizations regularly fund land acquisition, designation, and protection projects globally, with a higher concentration in the tropics. This portfolio includes a range of projects, including the expansion of existing parks and community reserves, establishment of privately protected areas, and creation of community forest reserves. Acquisition costs cover the purchase price and legal and notary fees, which were as much as 10% of the acquisition cost. For leased land projects of varying lengths, we calculated an annual value and then extrapolated the cost per hectare for 10 years—the dataset’s median lease length. We adjusted all costs to 2023 US$ to account for inflation. We removed projects with incomplete information on location, purchase cost, purchase size, and lease length. After cleaning the dataset, the remaining locations contained 833 sites distributed across all 6 major realms and 14 biomes (Presentation 1: Supplementary Figure 1).
We next fit linear regression models to the empirical cost per hectare of land protection projects. We used a log transformation on cost-per-hectare values to reduce skew and create an approximate normal distribution. We hypothesized that land value could be influenced by the biogeographical realm, region, ecoregion, area of land being secured, type of land acquisition, and country-level economic factors (4, 22). We used the following covariates as predictors: realm, size of acquisition, type of acquisition (categorized into purchase or lease), national per capita GDP, and country population size (23). All continuous covariates were scaled and centered for interpretation. The mean per capita GDP and population were extracted based on the country in which the project occurred between 2010 and 2020. A random effect for data source was added to account for possible variation among the groups that supplied project data. We fit candidate models and used the Akaike Information Criterion and conditional R2 values to select the most informative model for land value [MuMin R Package (24)]. We tested for correlations among continuous covariates and excluded variables with R > 0.65 values prior to the analysis (5). We also tested for multiple collinearity using the variance inflation factor (25). Neither test required the removal of covariates.
To calculate the price to place Conservation Imperatives under conservation stewardship, we used Monte Carlo simulations (26) to estimate the cost per hectare and total land value of all sites under simulated purchase scenarios. Each simulation used the land value model to predict the cost per hectare of each Conservation Imperative site using random values for acquisition size (assuming multiple smaller purchases would be needed to secure large sites), acquisition type (assuming a mix of purchase and lease), and data source and determined land value by multiplying the predicted cost per hectare by the known size of the site. We ran 10,000 simulations with random values drawn from distributions parameterized by realm. Total cost estimates were calculated as the mean across all simulations, and we used 90% probability distributions to measure uncertainty. We used this approach to determine the total cost of placing all Conservation Imperatives in the tropical belt under conservation stewardship. We then identified the top 10 ecoregions in each realm harboring the most Conservation Imperatives and assessed the price of conserving those sites by ecoregion. We converted all results to US$ per square kilometer to keep units comparable to the fractional analysis. The code used for model fitting and simulation can be found in the Supplementary Materials.
Representation of species rarity among newly created protected areas
To determine if the increases in the global protected area estate over the last 5 years have effectively addressed rare and endemic species exposed to the greatest risks of extinction, we intersected the Conservation Imperatives polygons with the most recent map of the WDPA using protected area categories 1–7 (April 2023) (11). We predicted that new reserves created from 2018 to 2023 would cover > 50% of the Conservation Imperatives.
Results
Fractional land cover analysis
We identified 16,825 sites harboring rare and threatened species, covering ~164 Mha or 1.22% of the Earth’s land surface (Figure 2). This AoH represents a 46% reduction from earlier estimates based on a published compilation of identified areas of importance for rare and threatened species [e.g., KBAs, Red List sites (4)]. Most of these reductions occurred in large blocks of unprotected habitat rather than in smaller fragments.
Figure 2
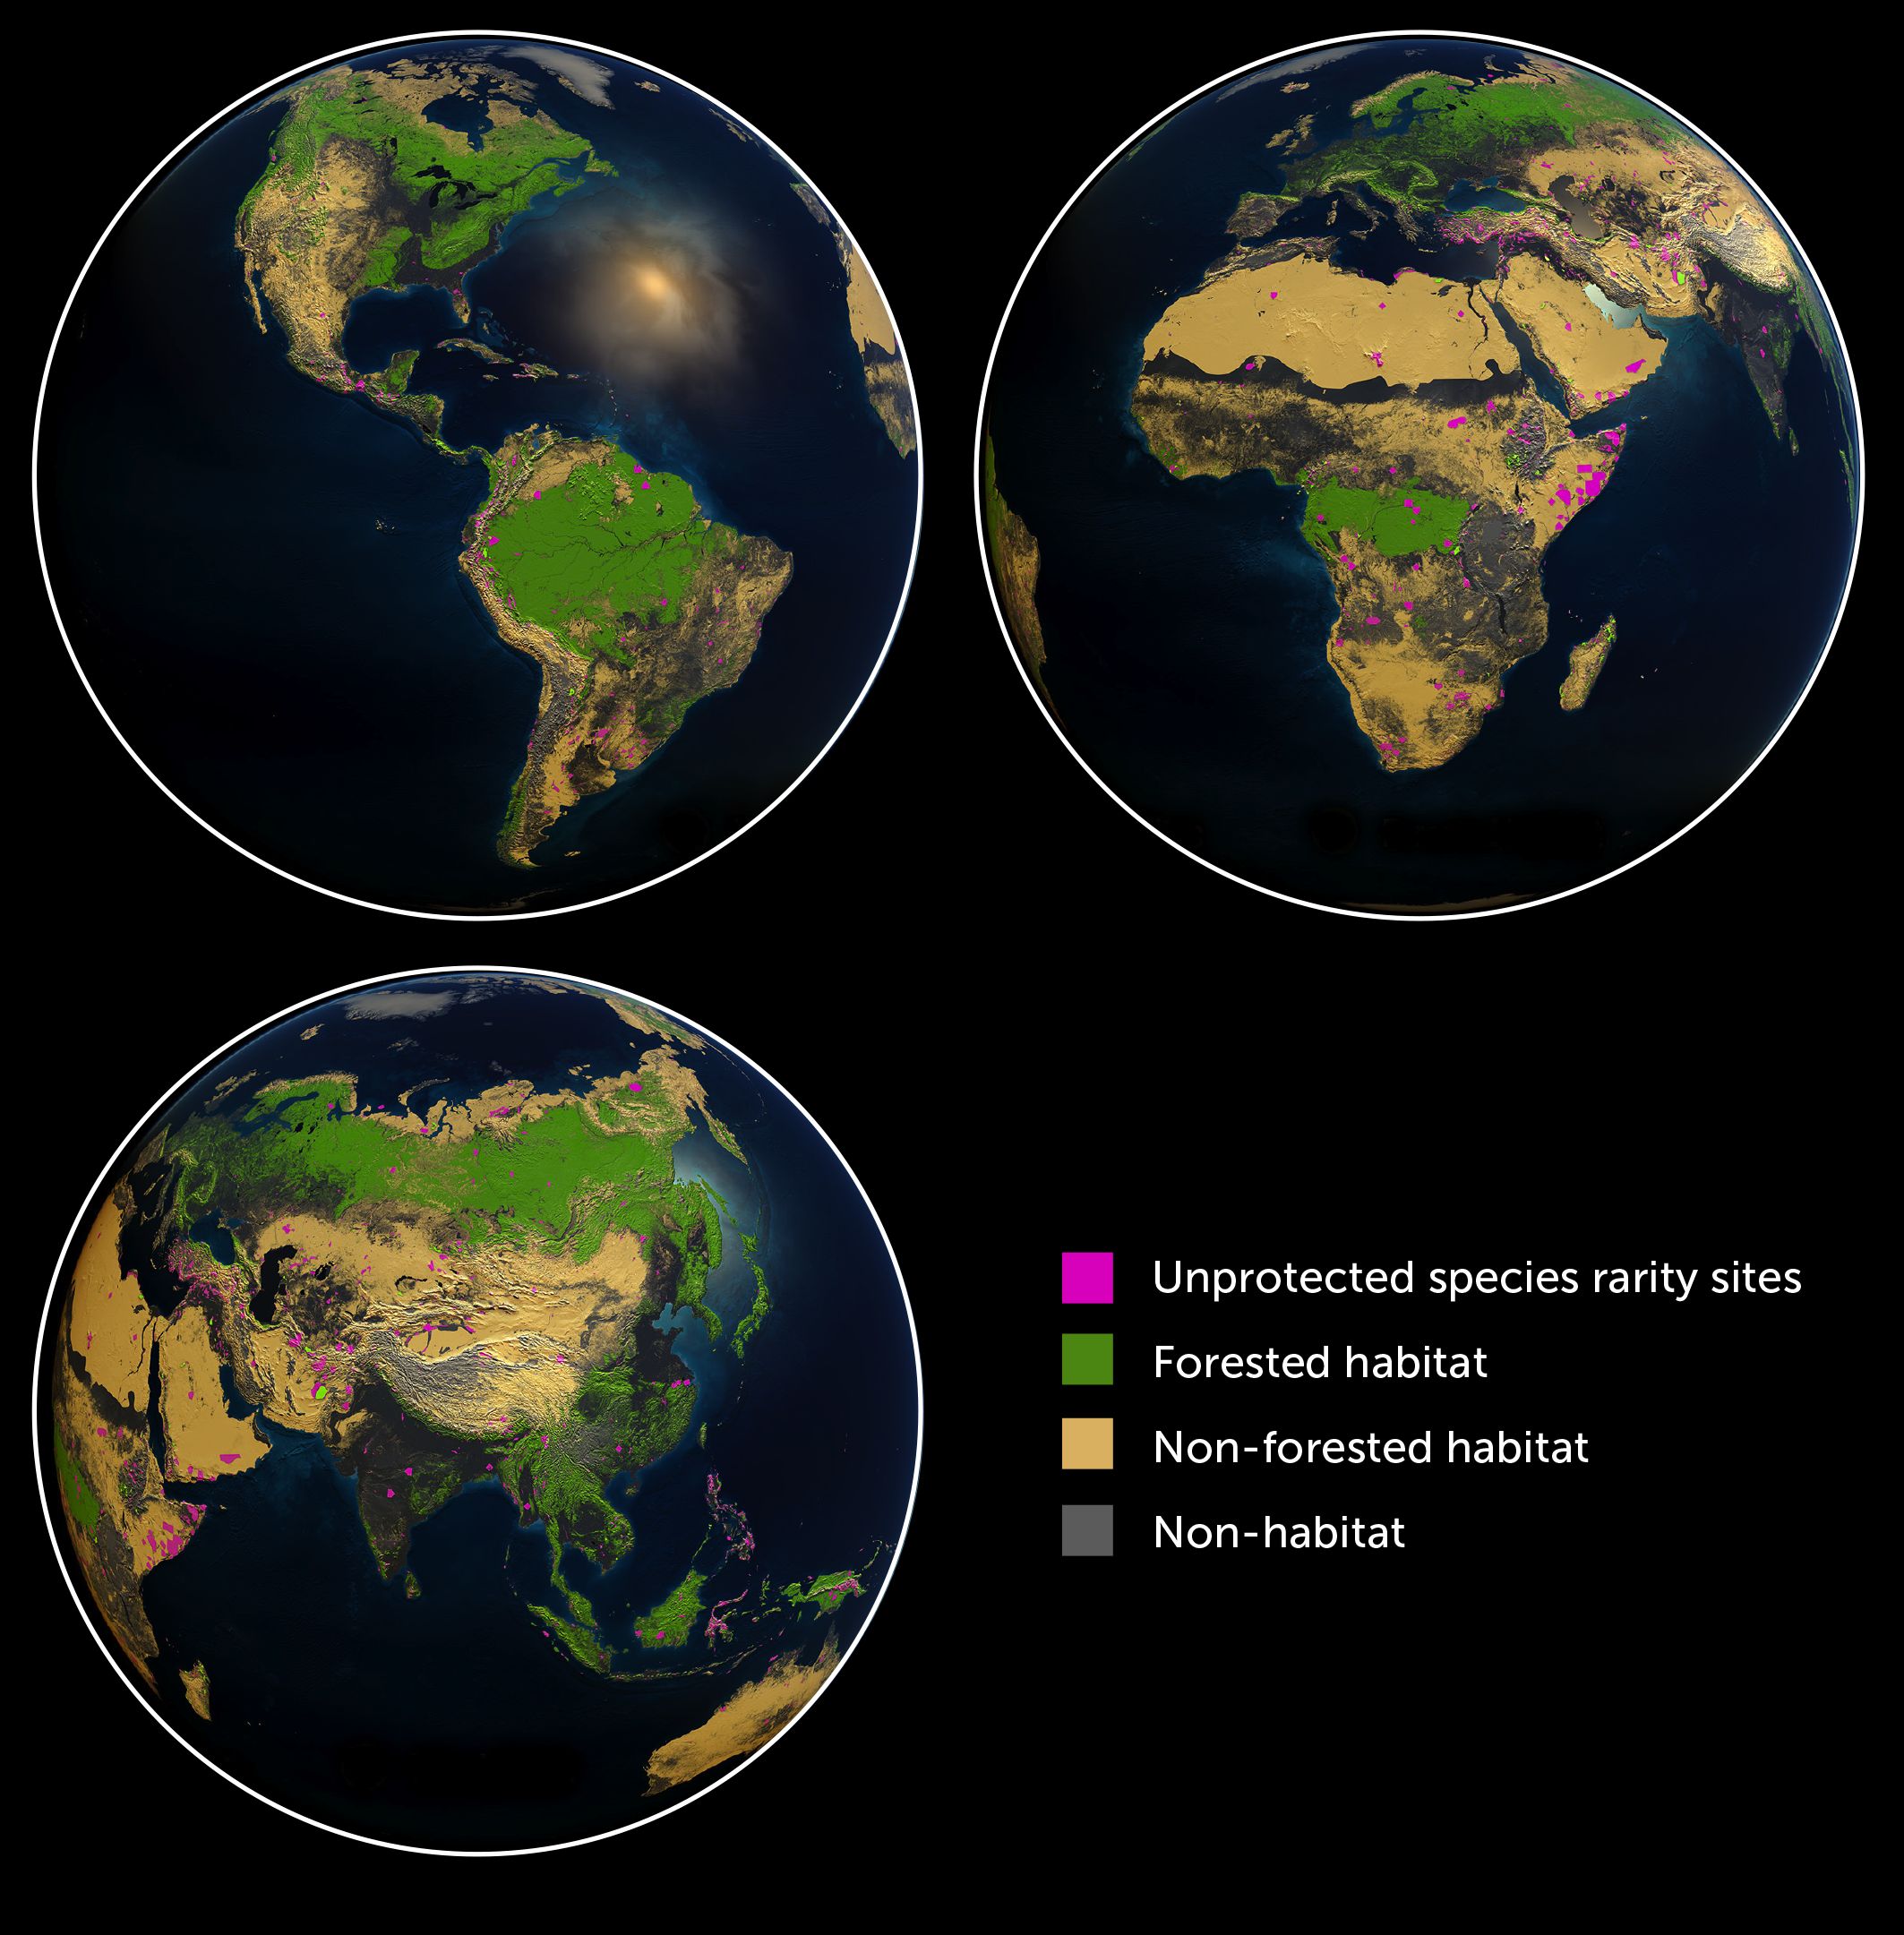
Figure 2 Map of global unprotected species rarity site. Global distribution of the unprotected species rarity sites (magenta area) across predominantly forested habitat (green) and non-forested habitat (yellow), with non-habitat areas (grey) removed from previously designated species rarity sites, covering 1.22%. Non-habitat areas include land classified as urban, agricultural, and degraded.
Reduction in total AoH harboring unprotected rarity differed by latitude and by biome. In the four major tropical realms, we found a 45% reduction in total land area. In the non-tropical realms, we estimated a 49% reduction in area (Table 1). Within biomes that comprise the tropical realms, tropical and subtropical dry broadleaf forests underwent the largest reduction in target habitat (77%), followed by tropical and subtropical coniferous forests (58%). Tropical and subtropical moist broadleaf forests, which contained the highest concentration (75%) of Conservation Imperatives, showed a 49% reduction in area (Figure 3; Table 2).
Table 1
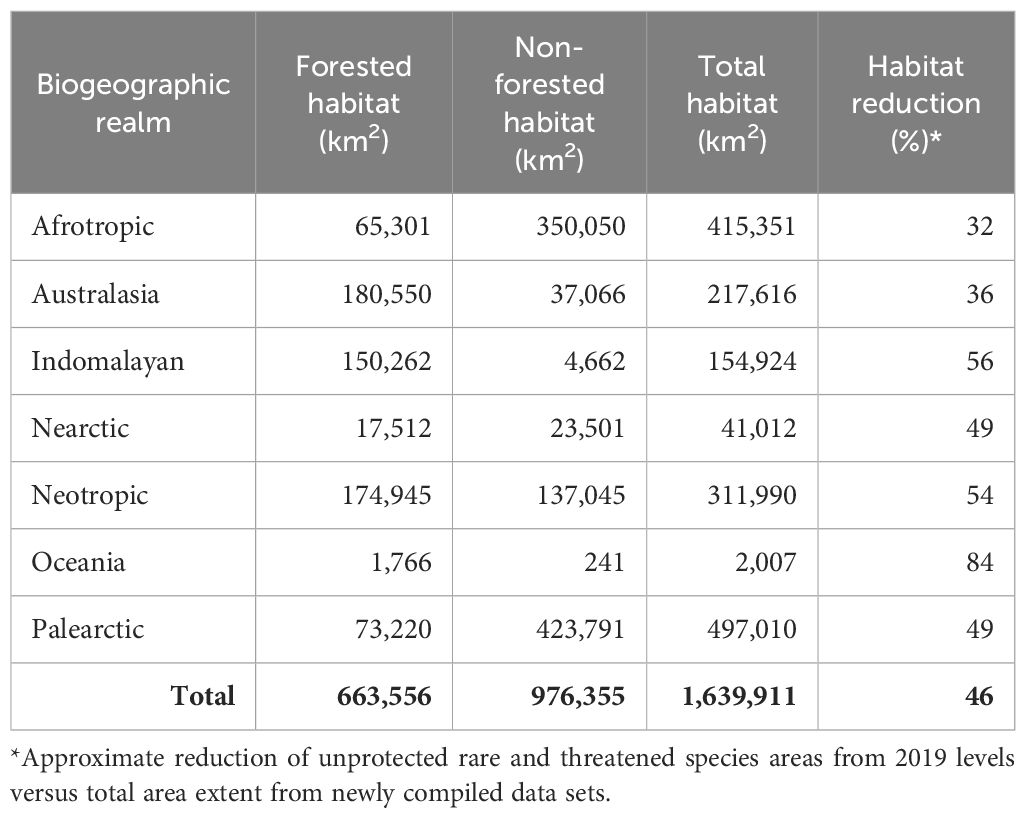
Table 1 Extent of habitat by biogeographic realm after applying fractional land cover to species rarity sites and removing non-habitat area.
Figure 3
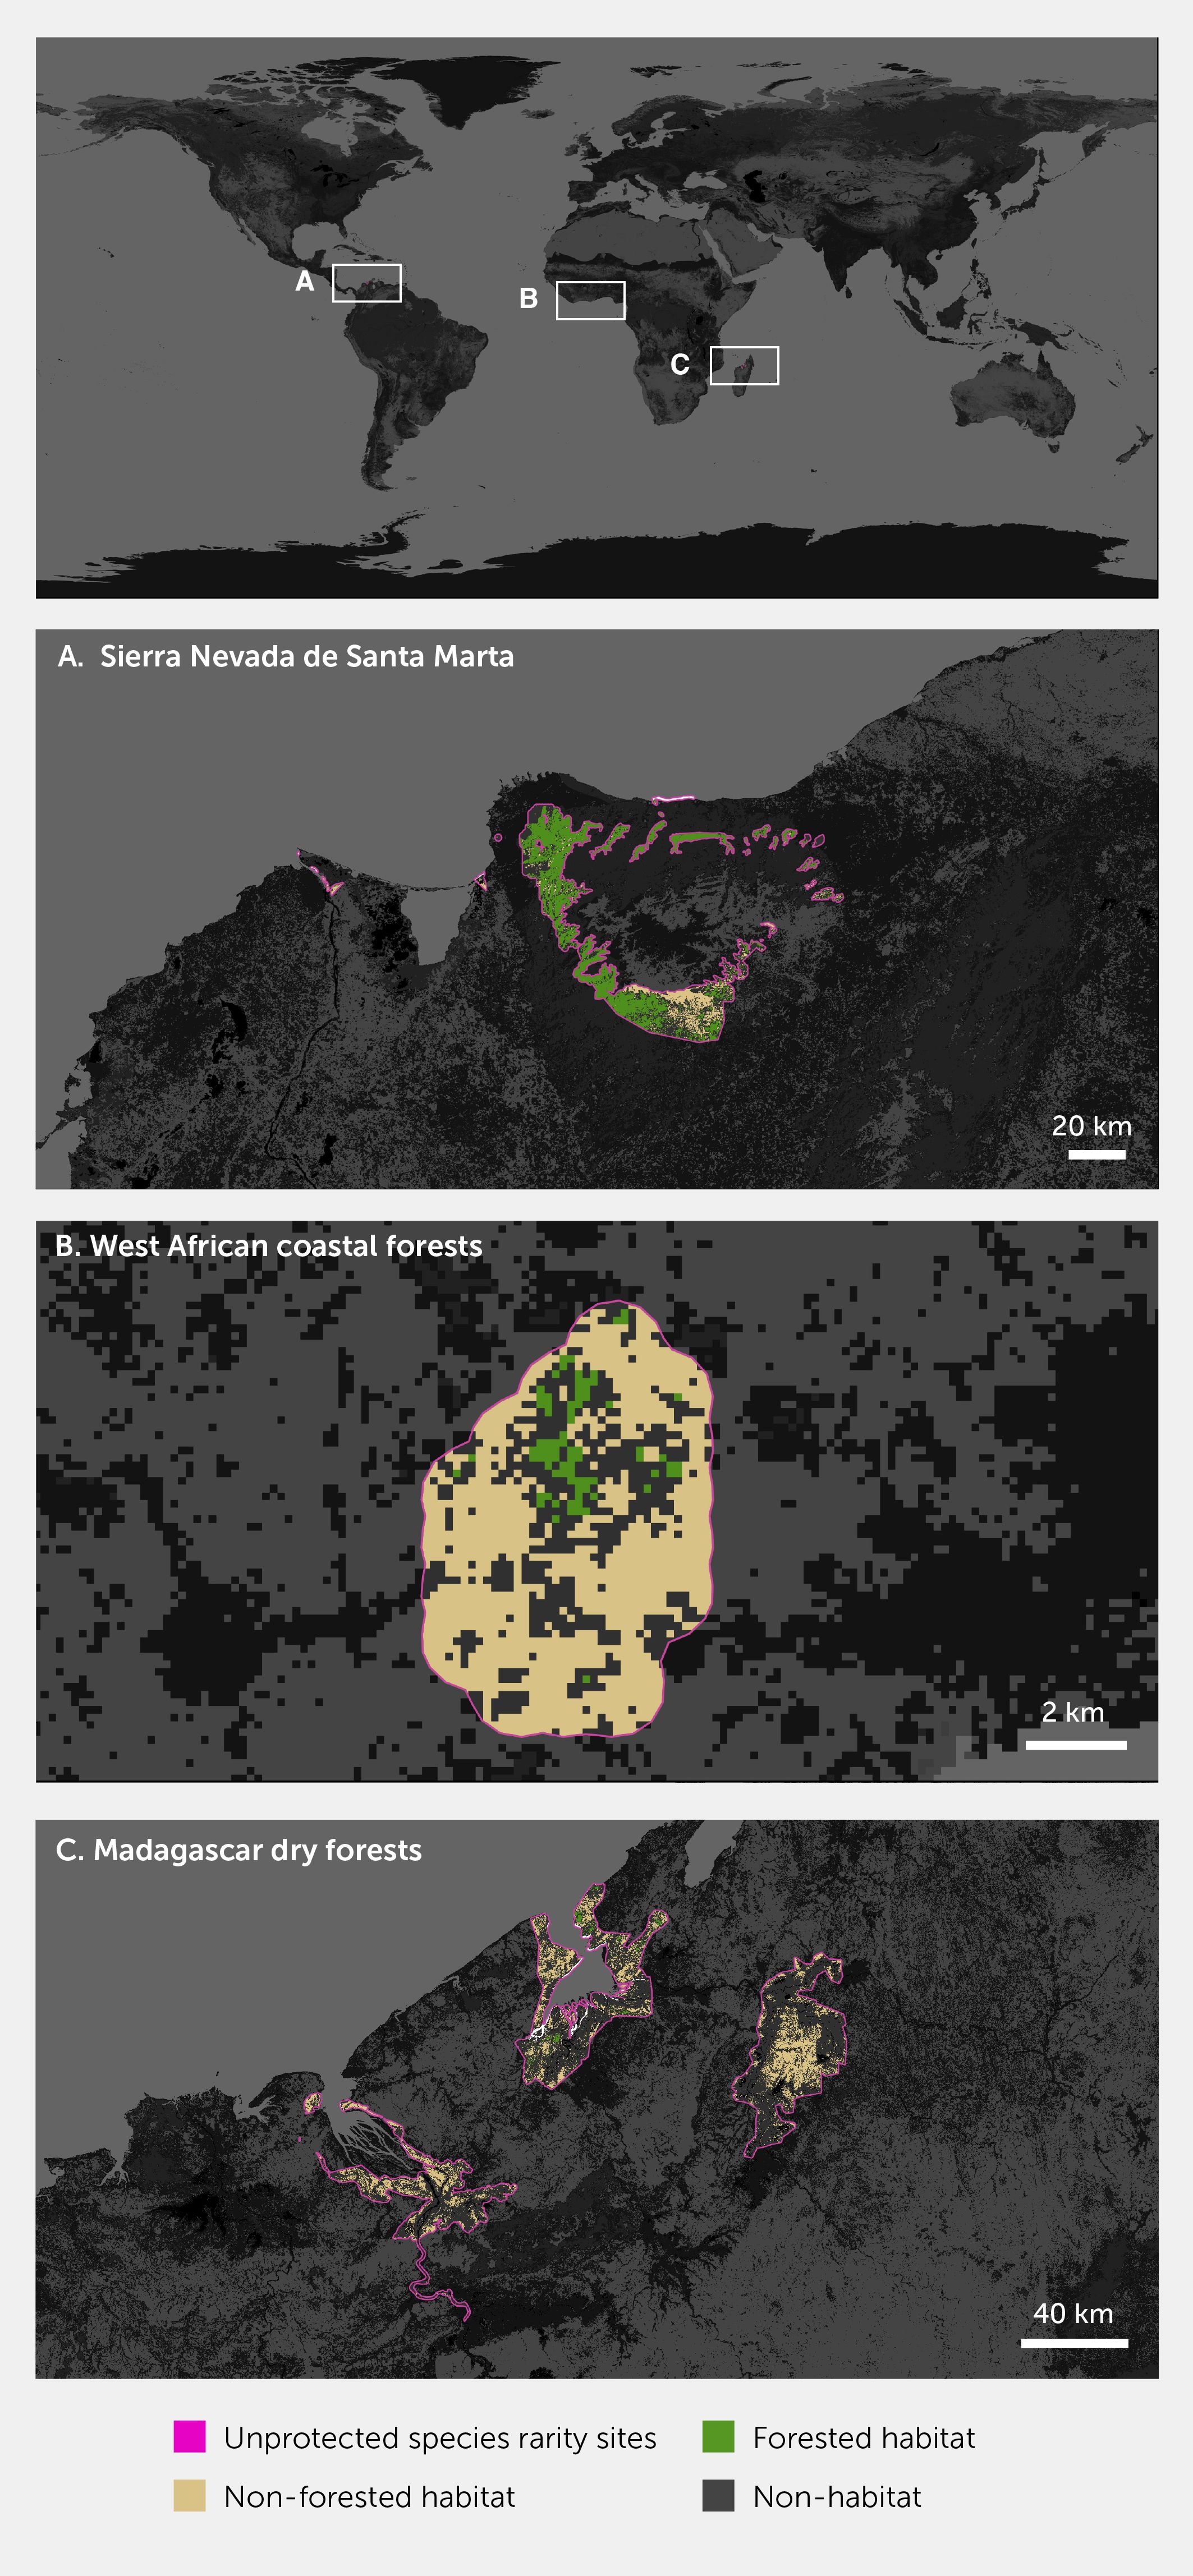
Figure 3 Effect of fractional analysis when identifying and removing non-habitat (Other) areas from species rarity polygons in several regions with high species rarity. Forested and non-forested habitats are retained. (A) Sierra Nevada de Santa Marta, Colombia; (B) West African coastal forests; and (C) Madagascar dry forests.
Table 2
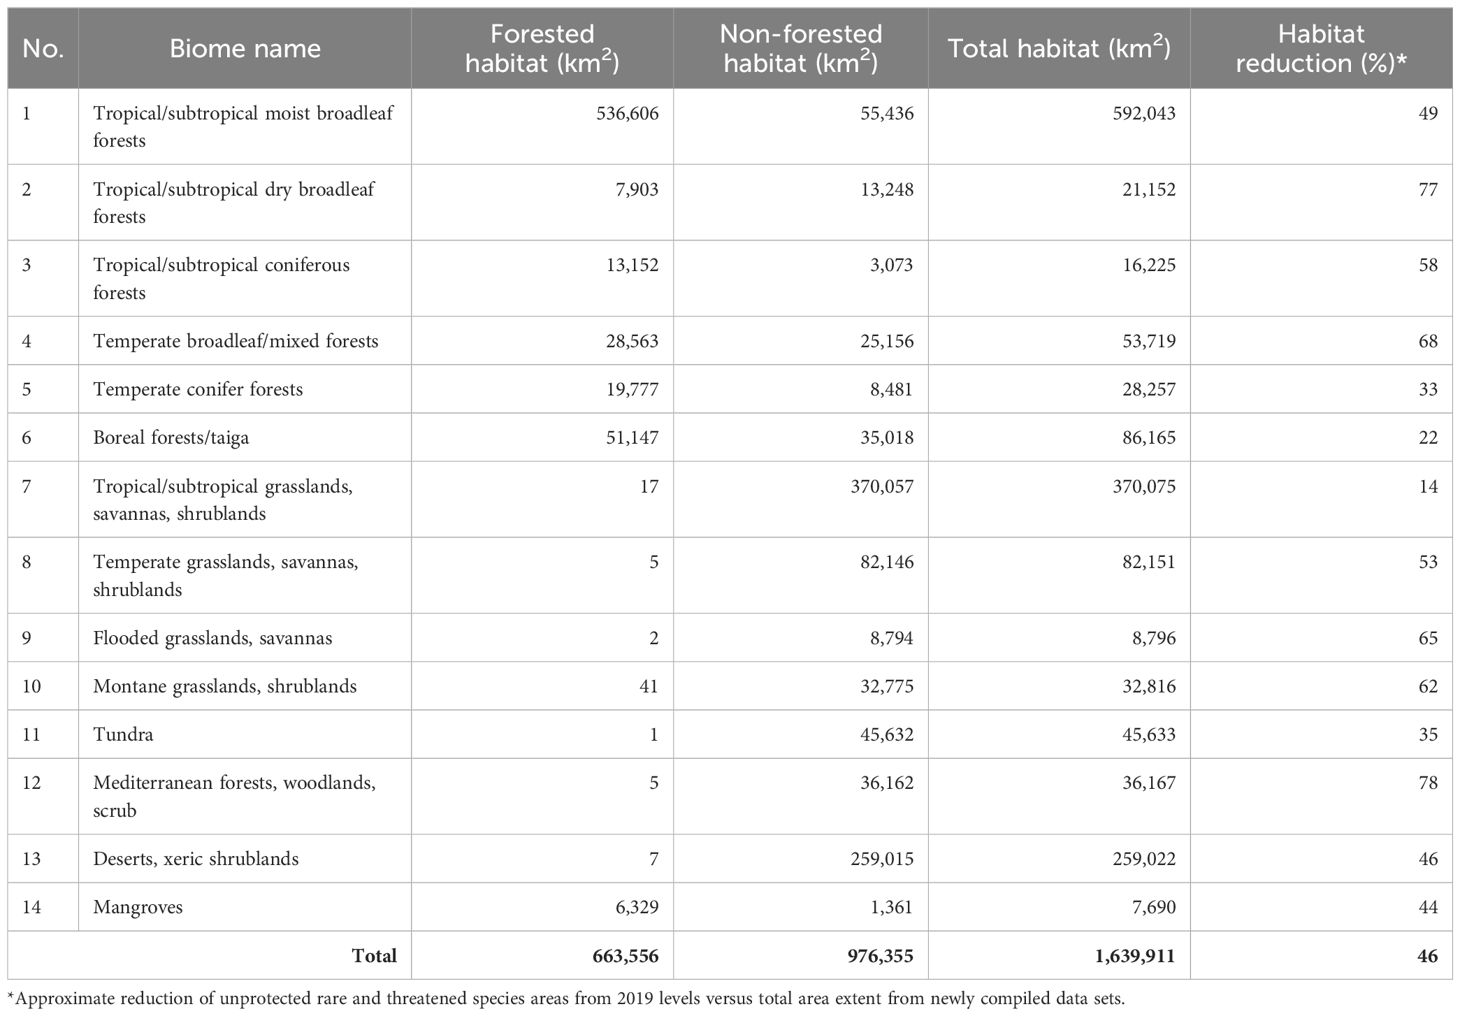
Table 2 Extent of habitat by biome after applying fractional land cover to species rarity sites and removing non-habitat area.
Conservation Imperatives
Conservation Imperatives are highly concentrated. We found a distinct skew in the distribution of the 16,825 sites harboring unprotected rarity across biogeographic realms and biomes (Figure 2; Tables 3, 4; Presentation 1: Supplementary Table 2). The majority of unprotected sites fall within the tropical and subtropical moist forests biome. Within the same biome but sorted by realm, the Neotropics had the most sites (38% of all Conservation Imperatives), followed by the Indomalayan (34%), Australasia (18%), and Afrotropic (9%) realms. Sites were also clustered within realms. The 10 ecoregions with the most Conservation Imperatives within the four major tropical realms account for 63.5% of all sites globally (Figure 4; Table 5). The top five countries in the world with the highest number of Conservation Imperatives are the Philippines, Brazil, Indonesia, Madagascar, and Colombia, and together they account for 59% of all sites globally. Over 87% of all Conservation Imperatives occur in just 30 countries (Table 6).
Table 3
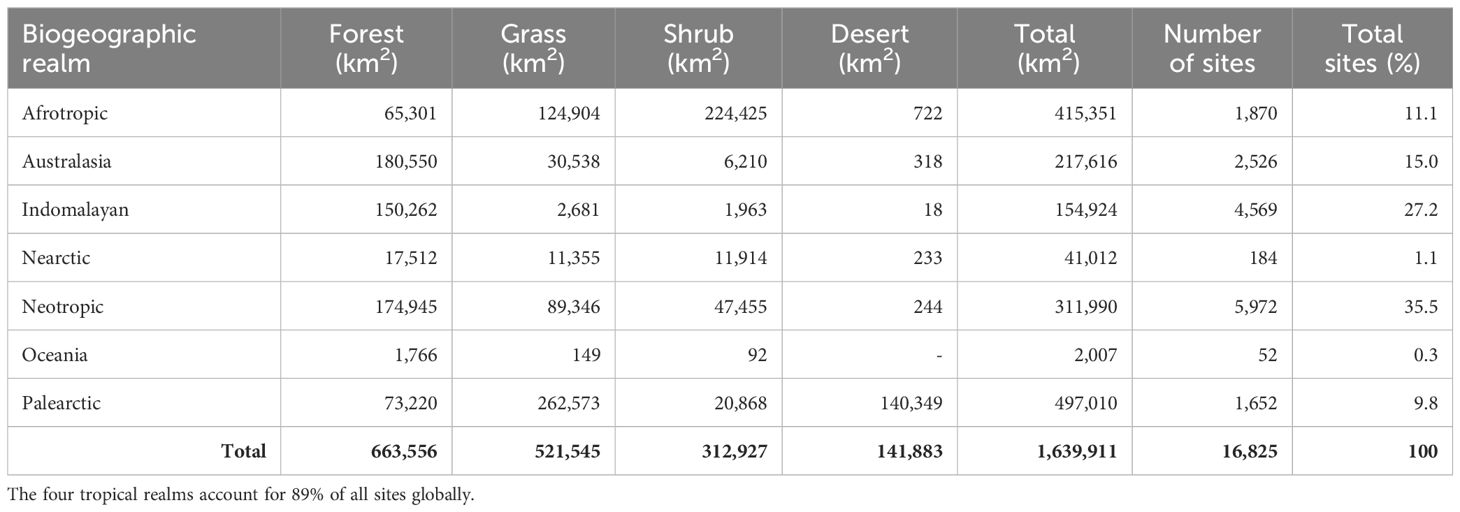
Table 3 Distribution of Conservation Imperative sites (2023) by realm.
Table 4
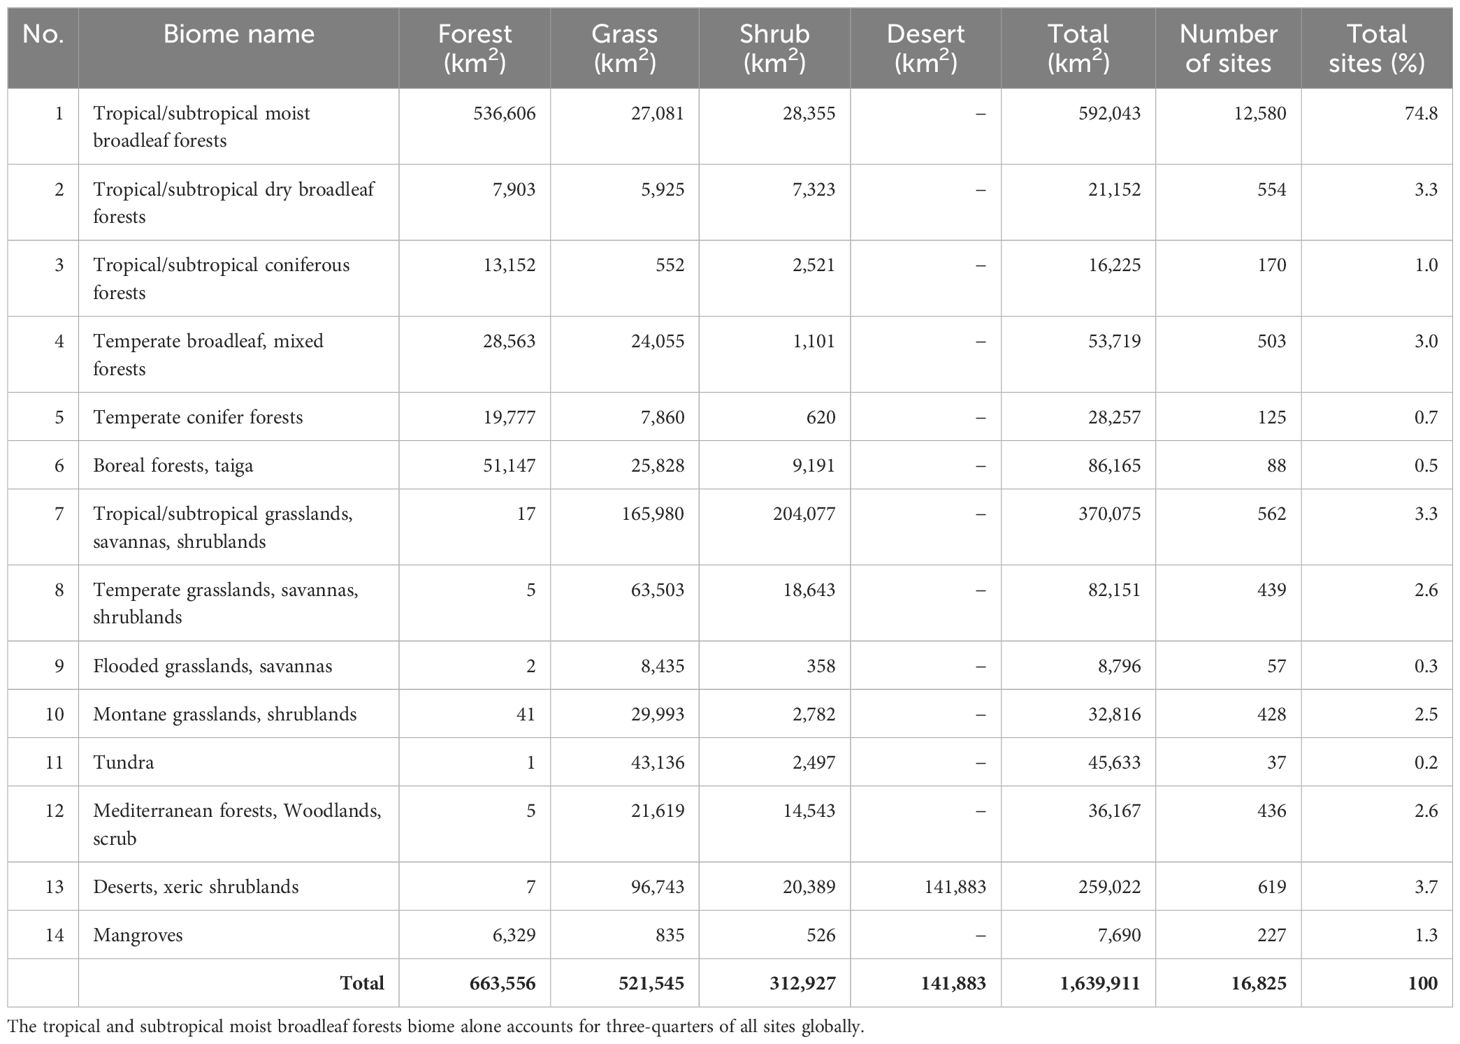
Table 4 Distribution of Conservation Imperative sites in each biome (2023).
Figure 4
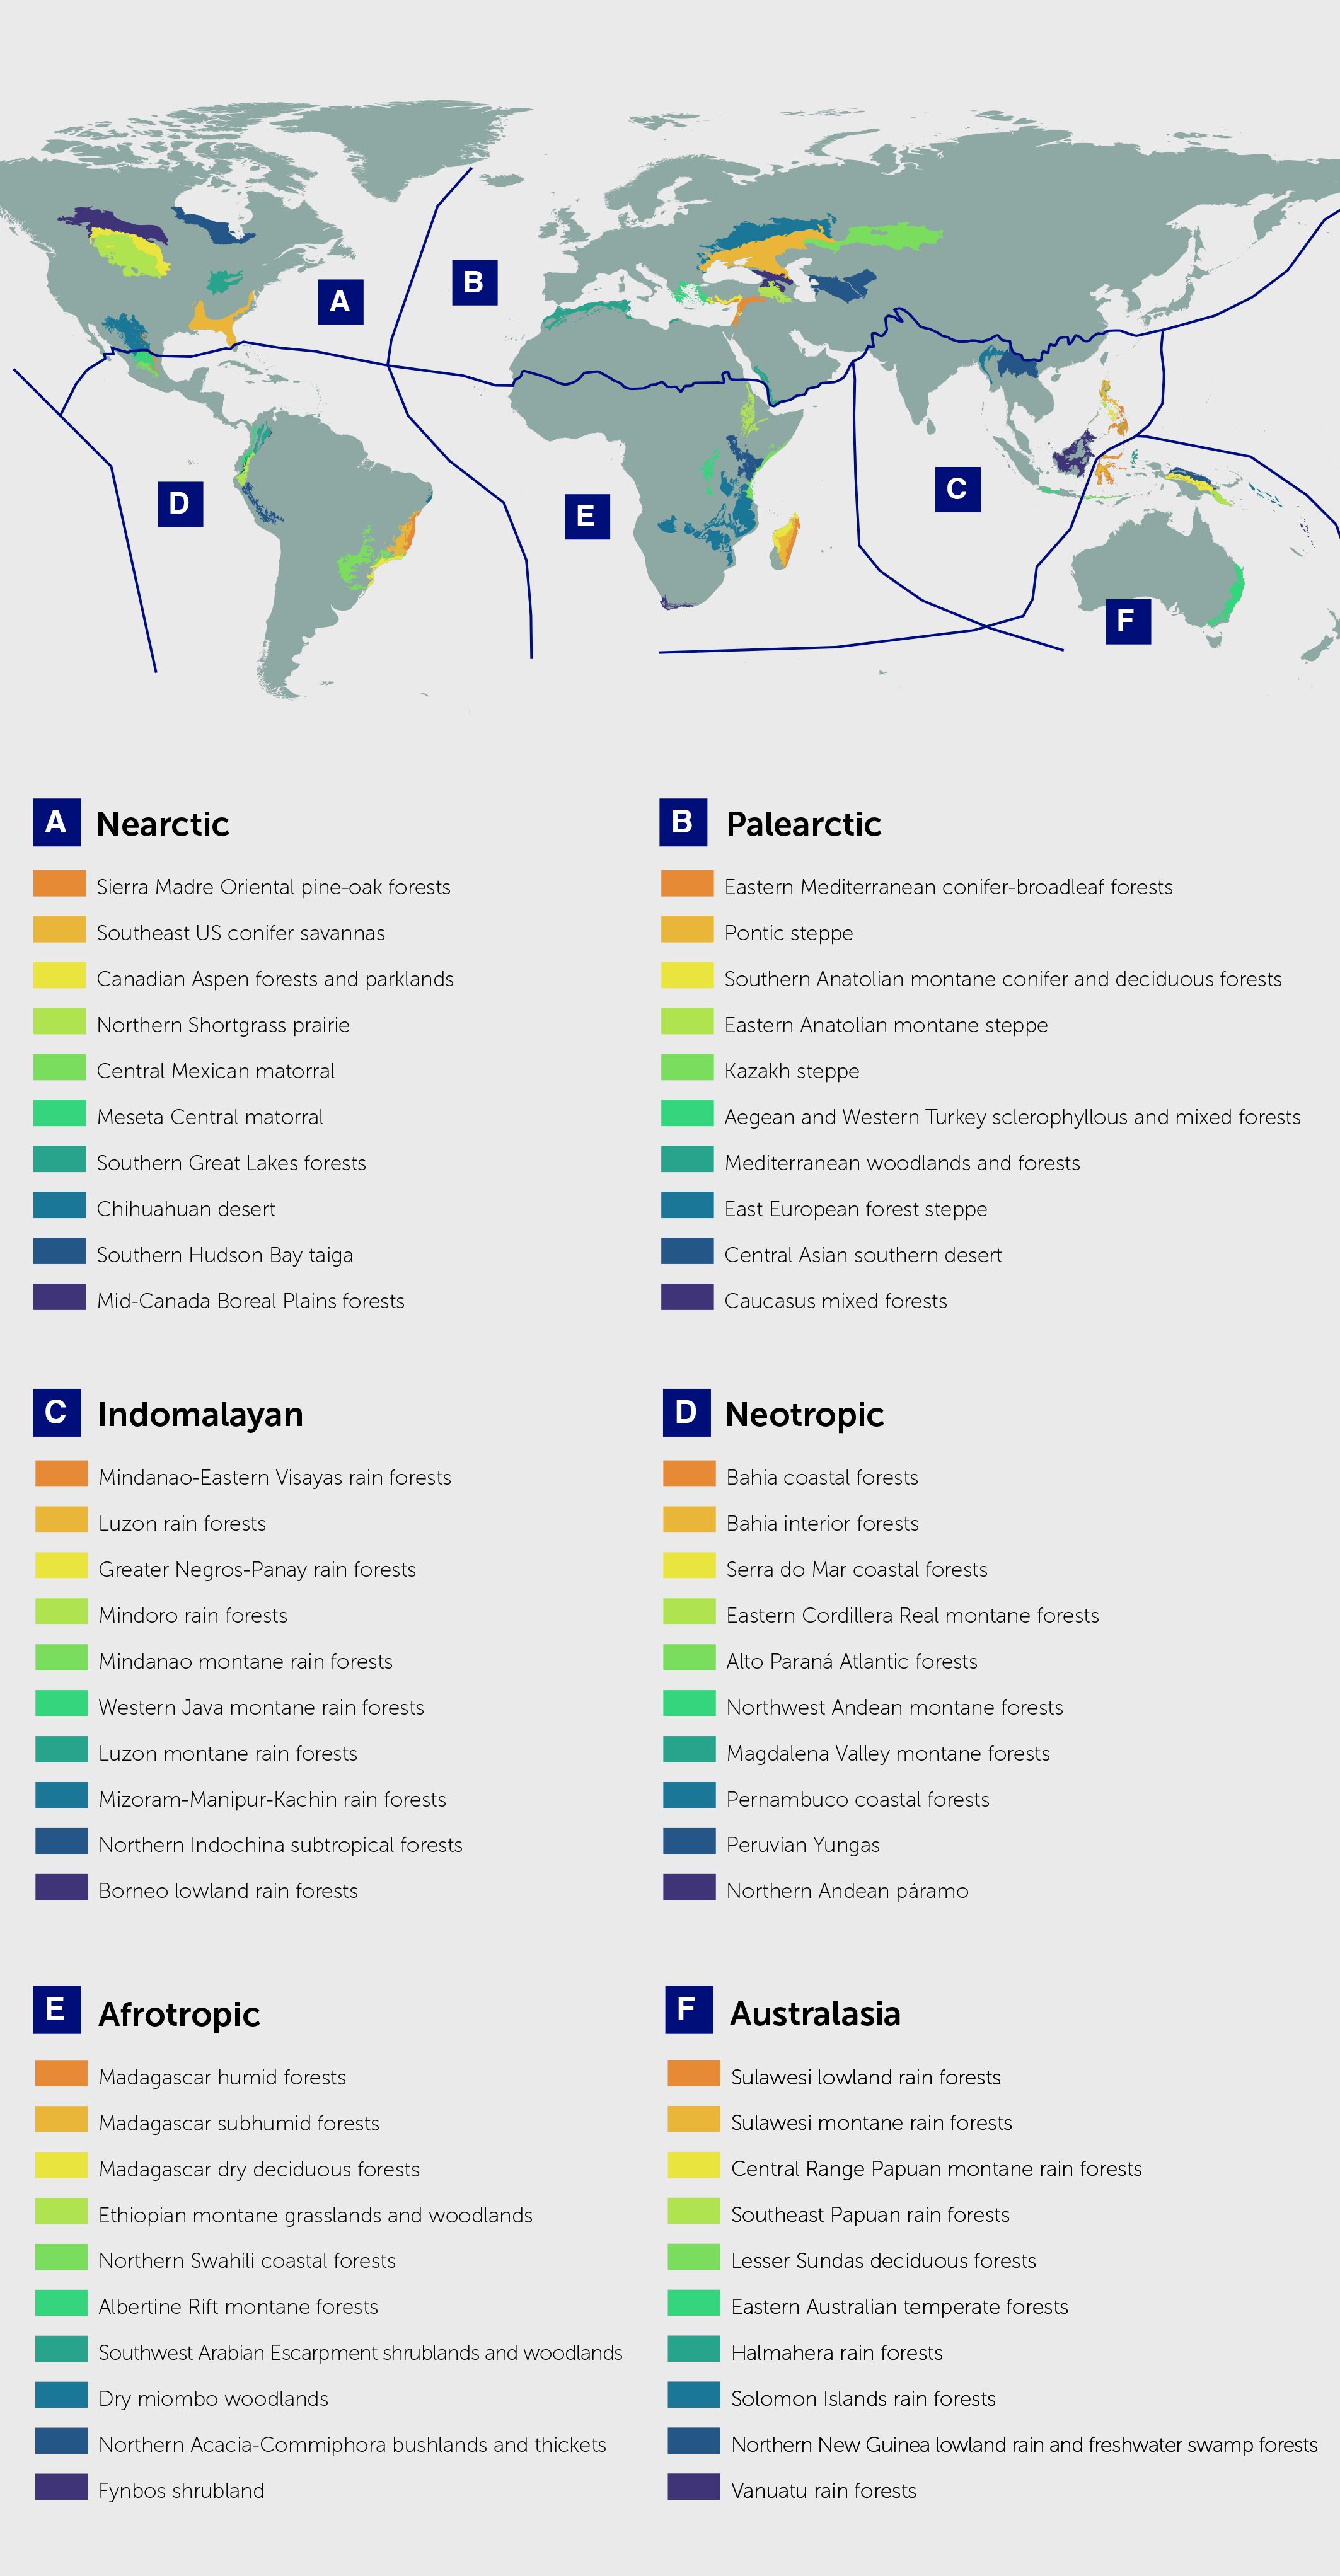
Figure 4 The 10 ecoregions in each realm containing the highest number of Conservation Imperatives.
Table 5
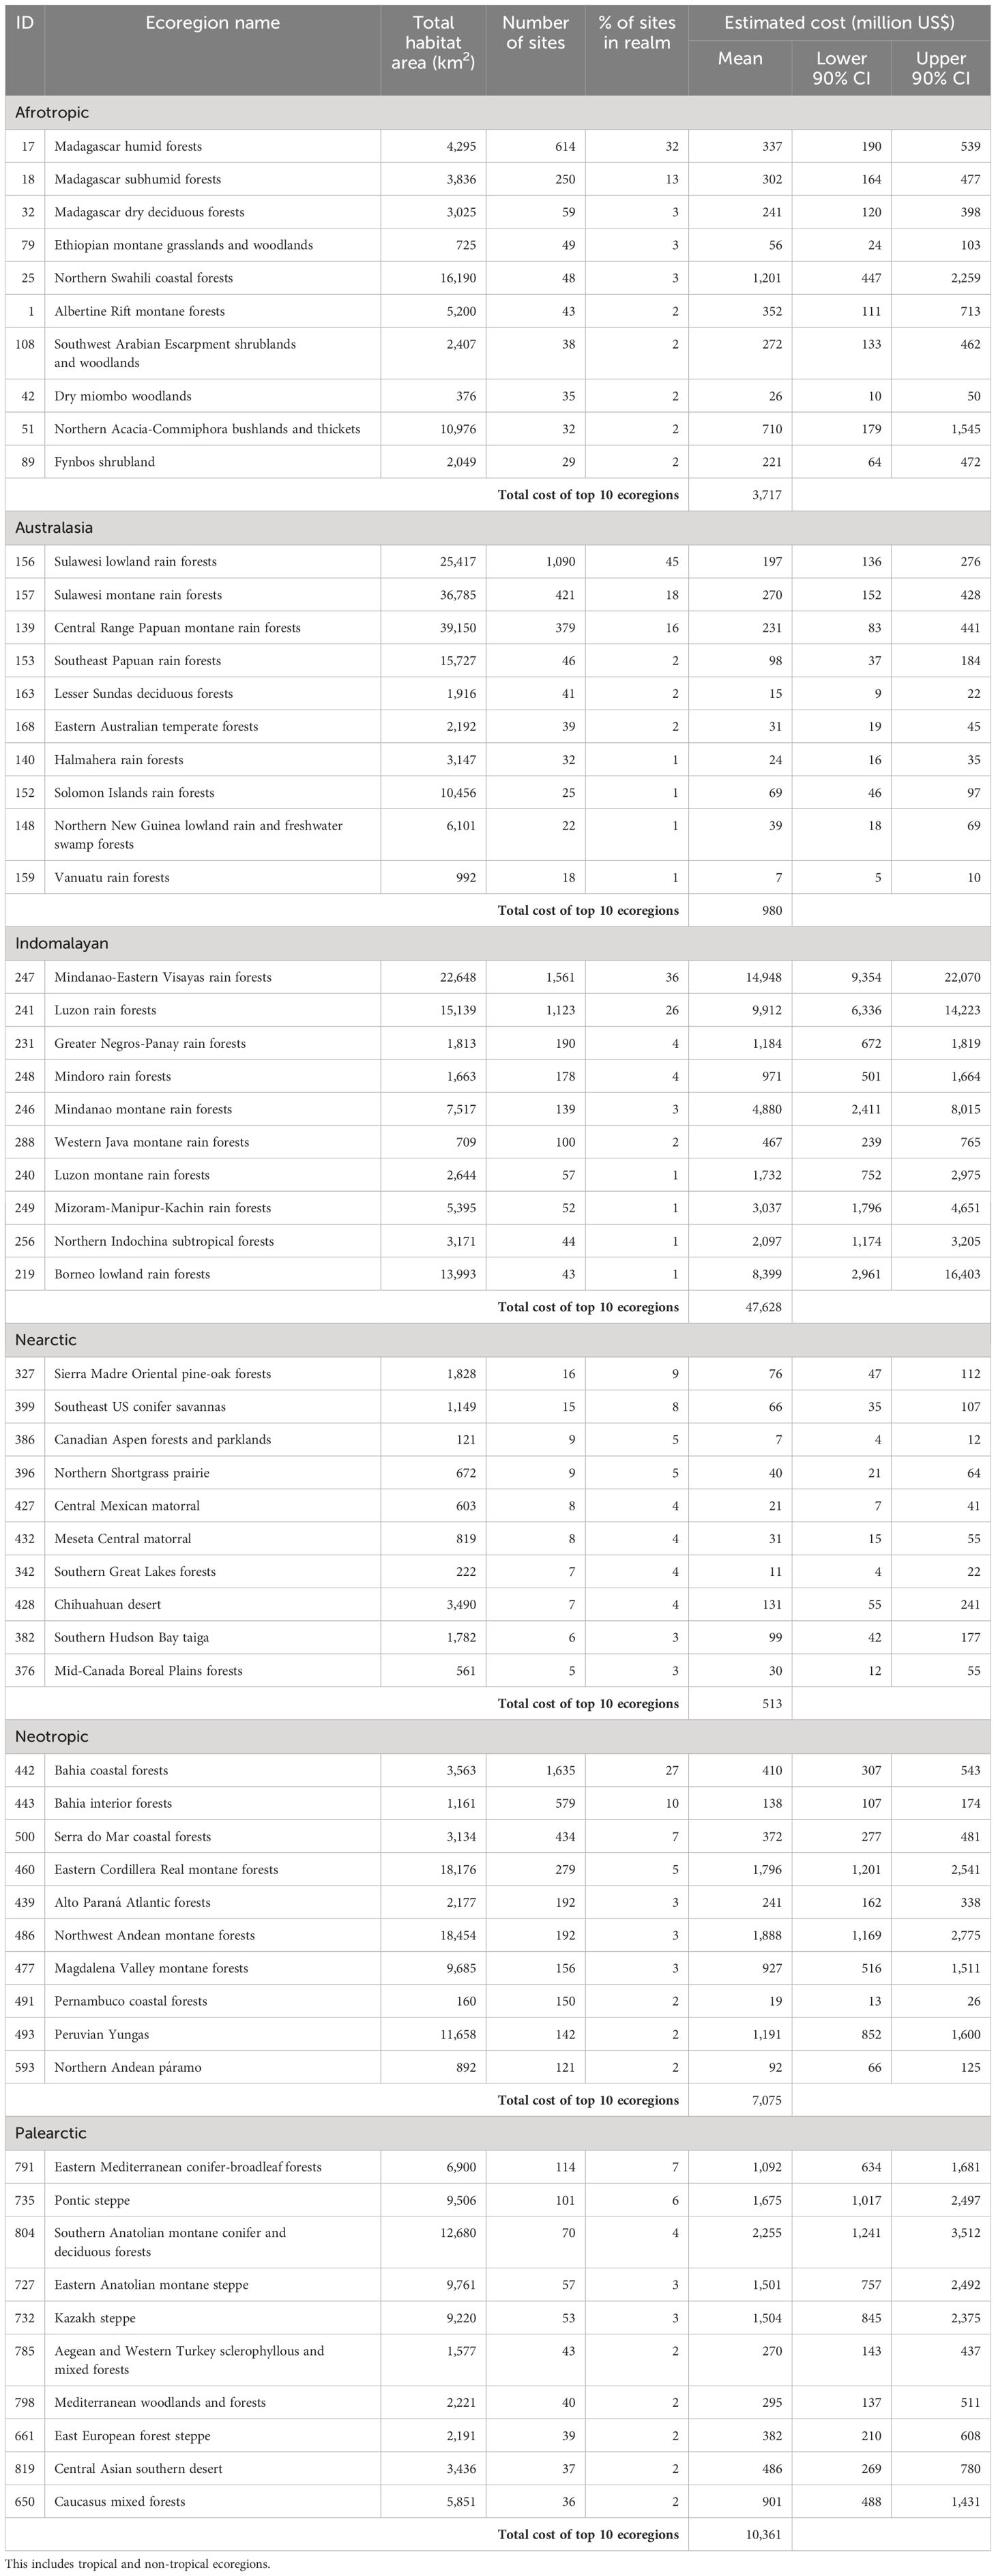
Table 5 The top 10 ecoregions in each realm with the highest number of Conservation Imperative sites (2023) and the total remaining natural habitat and estimated cost to place under conservation stewardship.
Table 6
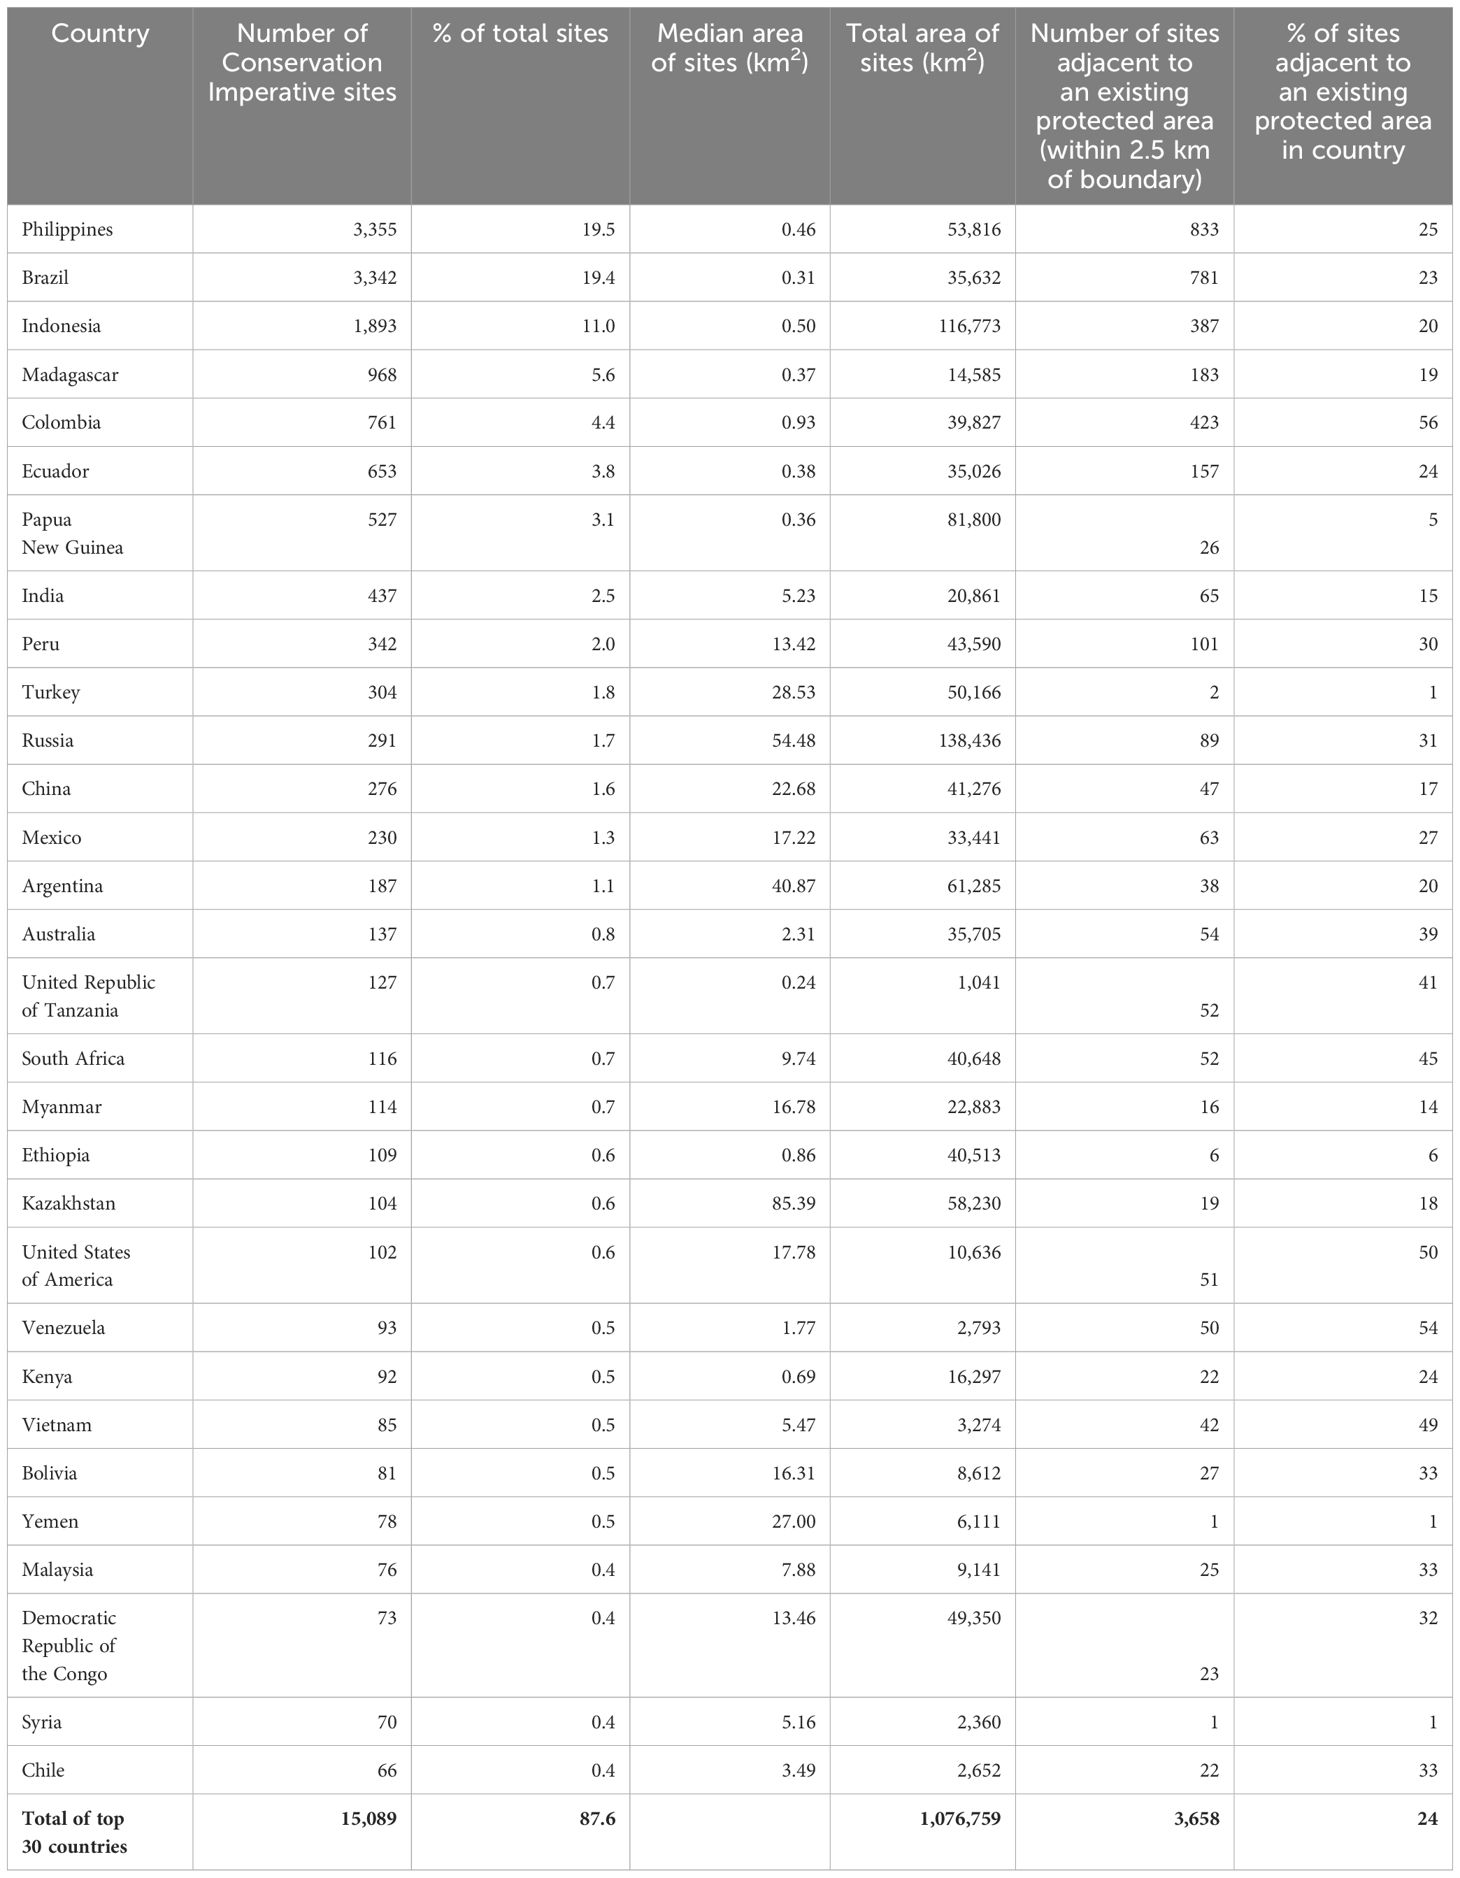
Table 6 Top 30 countries with the highest number of Conservation Imperative sites, their percentage total, median and total area of sites (km2), and the number and percentage of sites within each country that are adjacent to existing protected areas (i.e., within 2.5 km of boundary).
Representation of species rarity among newly created protected areas
We predicted that >50% of new protected areas designated between 2018 and 2023 would overlap with unprotected species rarity sites. We estimated that 1.2 million km2 was added to the global protected area estate over this 5-year time period (11). Of that, the largest extent was located in two ecoregions (#473 Japura-Solimões-Negro Moist Forests and #831 North Arabian Desert, totaling 192,000 km2), but based on our analysis these additions showed very little overlap with areas harboring rare and threatened species. In fact, over this same time period, only 109,779 km2, or less than 7% of identified Conservation Imperatives, have been added to the World Database on Protected Areas (Figure 5), leaving the vast majority of these sites at risk of conversion and degradation. Expressed slightly differently, had the 1.2 million km2 set aside during the 2018–2023 period included only Conservation Imperatives, 73% of these sites globally would now be under protection.
Figure 5
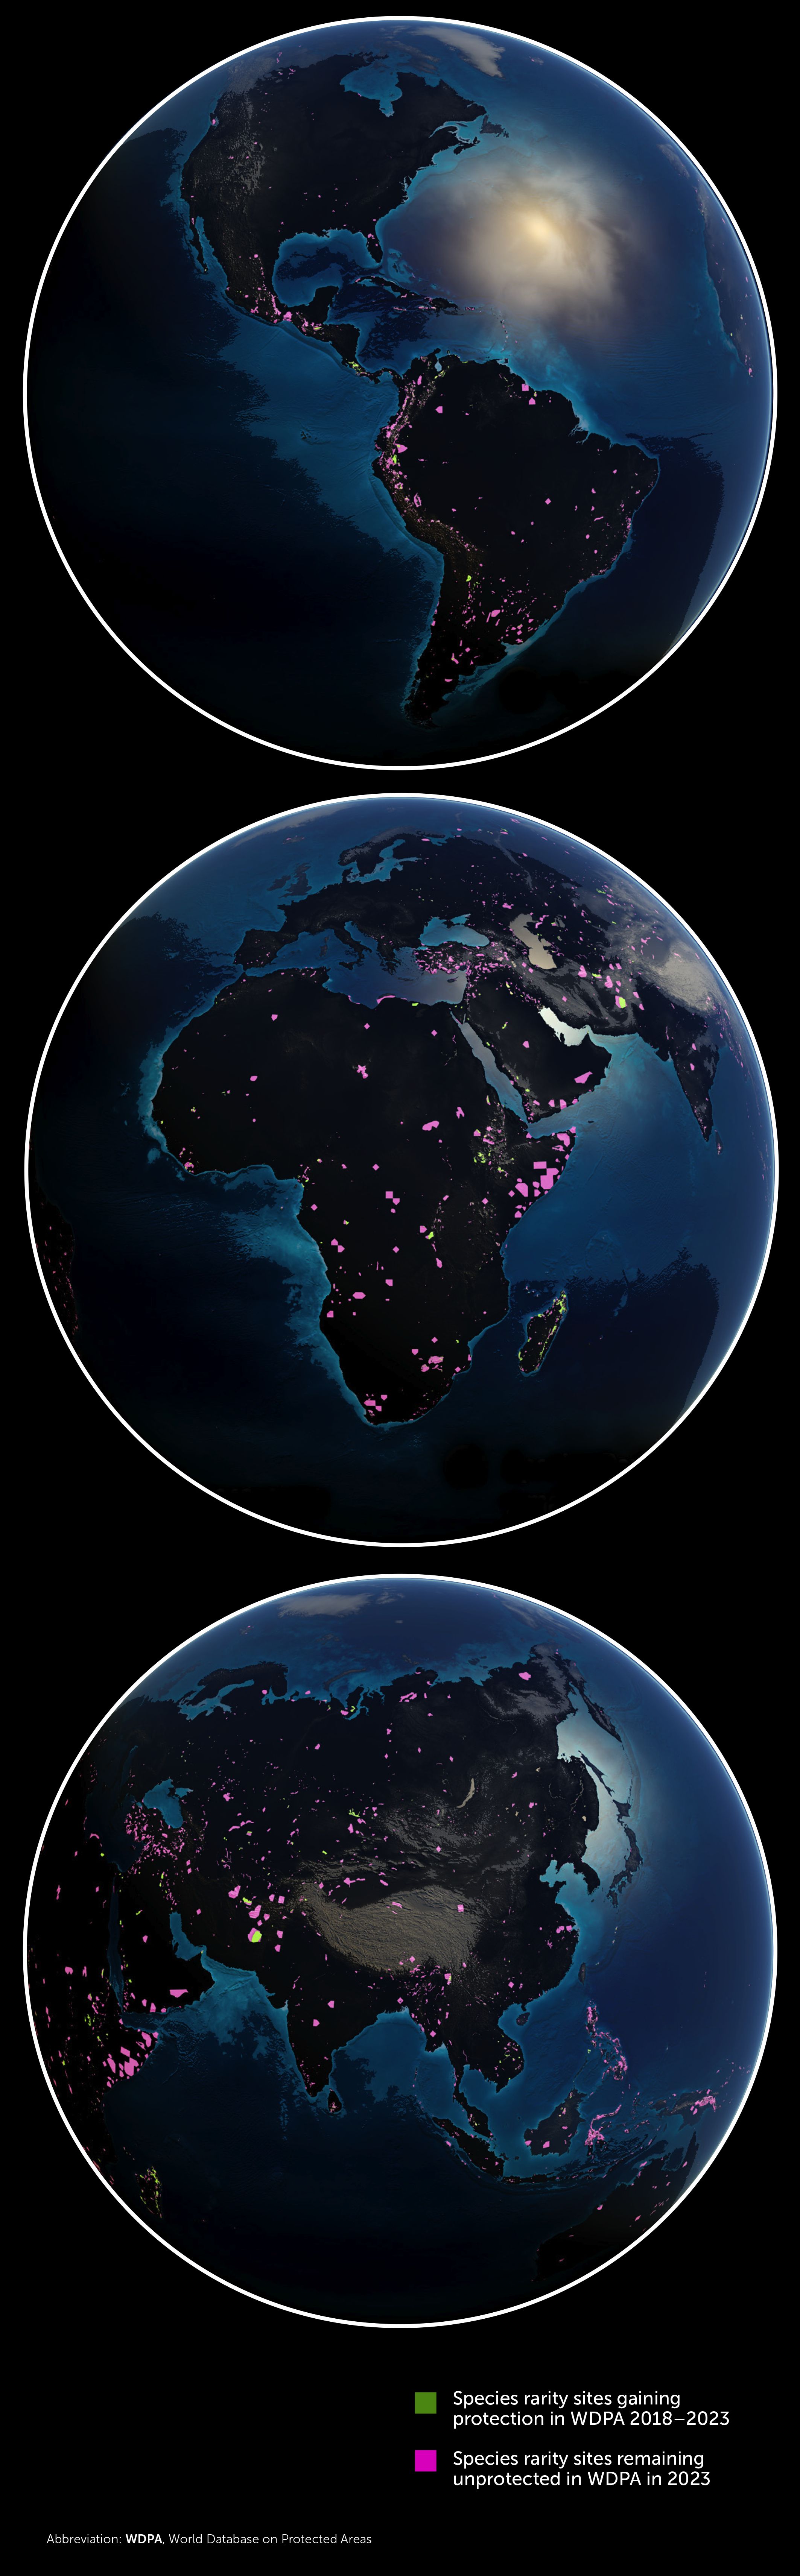
Figure 5 Expansion of protection in species rarity sites in World Database on Protected Areas (WDPA) between 2018 and 2023 after overlaying the fractional land cover. Green polygons show unprotected species rarity sites that have gained protection between 2018 and 2023, representing only 7% of the global increase in protection coverage. Magenta polygons represent sites that remain unprotected in 2023.
Cost analysis
The model of land acquisition costs per hectare that included realm, purchase type, purchase size, per capita GDP, and population size performed best and had an R2 value of 0.76 (Presentation 1: Supplementary Table 4). Among the variables we tested, acquisition size [-0.67, 95% CI (-0.71, -0.64); larger acquisitions had lower per-ha costs], acquisition type [0.97, 95% CI (0.66, 1.28); purchases were more expensive than leases], and realm were the most useful predictors and explained much of the model variation on their own. We also found that higher per capita GDP [0.18, 95% CI (0.07, 0.28)] and human population density [0.03, 95% CI (0.02, 0.08)] increased land prices (Presentation 1: Supplementary Table 4).
In Monte Carlo simulations of the land cost for Conservation Imperatives, we found that the total cost of the Conservation Imperatives in the tropics is US$169 billion, with a 90% probability between US$146 and US$228 billion (Presentation 1: Supplementary Figure 2). Much of this uncertainty appeared to come from variations in the size and type (purchases and leases) of land acquisitions. Land acquisition was least expensive in Australasia and most expensive in the Indomalayan realm but somewhat similar in the other realms (Table 7, Presentation 1: Supplementary Figure 2B). The Afrotropic, Indomalayan, and Neotropic realms showed the largest variation in predicted total cost, which appeared to arise from larger cost differences between lease arrangements and purchases and the number of sites that were either leased or purchased in each simulation (Presentation 1: Supplementary Figure 2). Land costs for the top 10 ecoregions—ranked by number of species rarity sites—from each of the four major tropical realms would be US$59.4 billion (90% probability of US$29–US$108 billion), safeguarding 63% of all sites (Figure 4; Table 5). To cover Conservation Imperatives at all latitudes, the total cost increases to US$263 billion (90% probability of US$204–US$339 billion).
Table 7
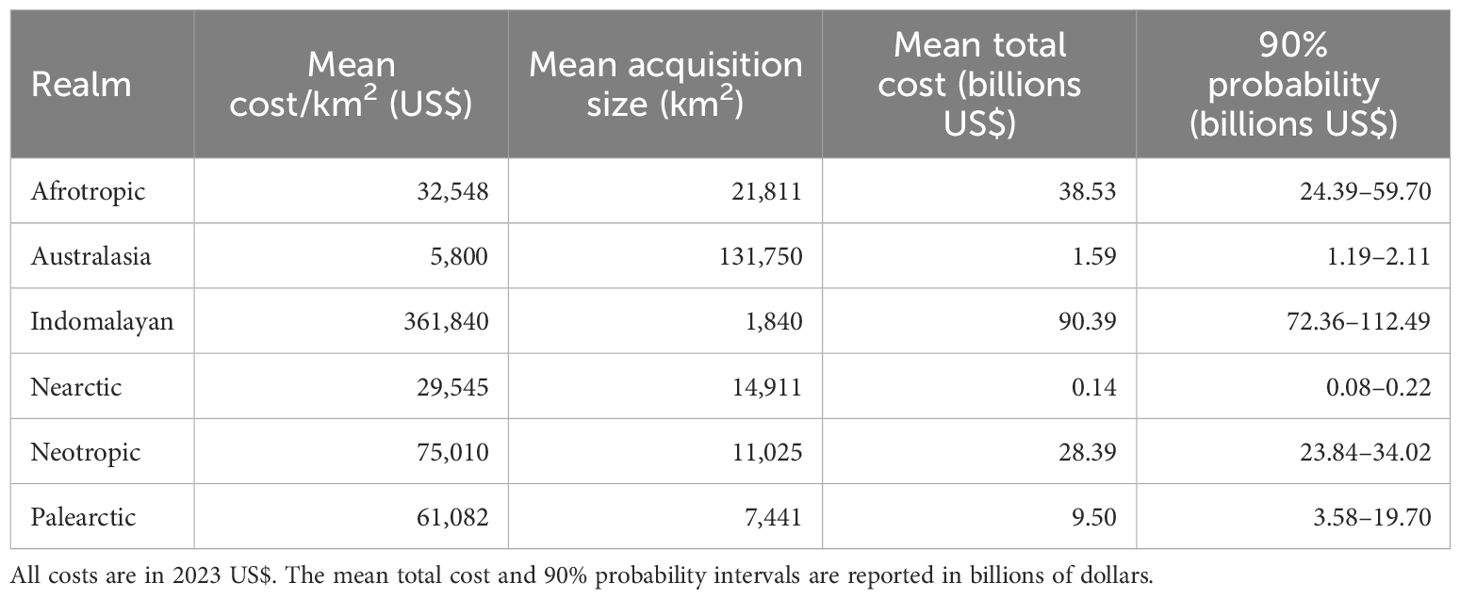
Table 7 Predicted cost per km2 and total purchase cost for securing Conservation Imperatives (2023) within tropical latitudes by realm.
Adjacency analysis
Adjacency analysis of Conservation Imperative sites relative to existing protected areas revealed that 38% (SD = 36.01) of the 16,825 sites either bordered or were within 2.5 km of a nearby existing protected area (Table 6). The five countries with the most Conservation Imperatives had at least 20% adjacency to existing protected areas (Presentation 1: Supplementary Figure 3). Colombia ranked highest among the top 30 countries with 56% of all Conservation Imperatives bordering protected areas.
Discussion
Key findings
Five key insights emerging from this study highlight the need to prioritize the conservation of rare and threatened species and their habitats as an urgent near-term target within a larger global biodiversity strategy: i) Conservation Imperatives identified in this study represent a mere 1.2% of the Earth’s terrestrial surface (0.74% in the tropical belt); ii) Conservation Imperatives were underrepresented in the creation of new protected areas over the last 5 years, indicating that a focus on species rarity is necessary; iii) if new protected areas created from 2018 to 2023 had been more strategically located to cover polygons identified as Conservation Imperatives, 73% of them could have been protected; iv) the bulk of the world’s rare and endangered species could be represented in protected areas for approximately US$25 billion/year for 5 years, and for only US$5 billion/year for 5 years in the Neotropics, where ecoregions contain the largest number of Conservation Imperatives; and v) the proximity of 38% of the 16,825 Conservation Imperatives to existing protected areas could greatly reduce barriers to protection and the costs of subsequent management of these areas while enhancing connectivity and augmenting climate adaptation strategies.
Preventing extinction is an unfulfilled conservation mandate
These insights raise a strategic question: Why have sites harboring rarity and impending global extinction been overlooked? Numerous studies have shown that stabilizing the Earth’s climate and reversing biodiversity loss are interdependent goals (4, 27, 28). Efforts and investments to address the climate crisis have overshadowed the attention governments and intergovernmental processes have paid to the biodiversity crisis. The recent Biodiversity COP held in Montreal, Canada in December 2022 (1) was an important milestone that helped spur more urgent and ambitious efforts to protect biodiversity. The COP also linked nature conservation with climate interventions that maintain the Earth’s forest cover and carbon sinks, sometimes referred to as nature-based climate solutions (29). Major investments to prevent forest conversion in carbon-rich regions, such as the Amazon Basin, the Congo Basin, and boreal regions, are essential and must be afforded a high priority as some of the last remaining wilderness areas. However, a focus on unprotected rare species areas is needed as the world sets about to expand the protected area network from 17% today to 30% or more by 2030.
Our results corroborate observations that conservation efforts are failing to target regions rich in rare species (30). Only 7% of the 1.2 million km2 added to the global protected area estate over the past 5 years covered unprotected species rarity sites. These included protected areas that had been established prior but had only recently been recorded in the WDPA—the actual expansion of protection during this period could be even smaller. Several analyses point to a pattern where the addition of new protected areas to the global coverage is largely attributable to areas characterized by low agricultural productivity (31) and has had limited success in protecting threatened species (32). Clearly, the combined efforts of international and local conservation NGOs, foundations, and government agencies to increase protected area coverage to avoid extinctions and extirpations of species need greater support. This analysis shows that this will not happen de facto even with 30x30 goals given the limited progress over the past 5 years.
Of most concern is that only 2.4% of newly created protected areas added to the WDPA were in the tropical and subtropical moist forest biome, which contains by far the highest numbers of Conservation Imperatives. In contrast, 69% of protection occurred in the temperate broadleaf and mixed forests biome, 14% in the boreal forest/taiga biome, and 6% in the temperate conifer forest biome—none of which contain high numbers of Conservation Imperatives. As a result, a targeted effort is now required to secure the remaining fraction of rare unprotected species sites before more land conversion occurs and without leaving to chance the selection of new protected areas. Our results yield a surprisingly low number of Conservation Imperatives in the five ecoregion complexes that make up the endemism-rich Mediterranean scrub biome. This finding may be because this biome is one of the most heavily converted among the 14 terrestrial biomes and much of what remains is either protected or so degraded that the fractional land cover analysis inadvertently removed areas that are still viable.
Preventing extinction is affordable and doable
Using the Conservation Imperatives identified in this analysis, a starting strategy that targets the 10 ecoregions within each of the four tropical realms containing the highest number of sites could put 63% of all identified sites under conservation stewardship and represent 12 different biomes. With the geographic concentration of Conservation Imperative sites, this approach will retain representation across distinct biomes and realms (7, 33). The land value for those sites is estimated at US$59 billion (90% probability of US$29–US$108 billion). Focusing more narrowly on the 10 Neotropic ecoregions containing the largest number of Conservation Imperatives would reach 23% of all identified sites, involving a land acquisition cost of US$1.4 billion/year for 5 years in this realm. Several studies have suggested that up to US$224 billion per year for 10 years would be needed to protect nature globally (34). The Conservation Imperatives could help focus these investments in the next 5 years to protect sites where irreplaceable biodiversity is concentrated while allowing individual nation-states to formulate longer-term strategies to address fewer threatened taxa, habitats, and ecological processes.
Factors affecting the cost of Conservation Imperatives
While land purchase or leasing values provide a starting point for costs, a diversity of approaches will be needed to secure the protection of Conservation Imperatives. Whereas traditional land trust models focus on the purchase of land for private management, options such as community reserves, government re-designations, private sector commitments, and other effective area-based conservation measures (OECMs) may be more effective, less costly, and more sustainable. Where national governments incorporate the creation of new protected areas into their sovereign biodiversity strategies as a unique contribution, the global cost of the initial protection of Conservation Imperatives will drop dramatically.
Conservation Imperatives that are adjacent to or within 2.5 km of an existing reserve could be much cheaper to manage than isolated Conservation Imperatives. This would especially be true where entities or agencies responsible for protecting nearby reserves could extend management protocols to the adjacent Conservation Imperatives. Alternatively, where these adjacent lands constitute buffer areas or corridors, they could be managed as community reserves. Promoting this landscape approach to reserve management will help ensure these protected areas remain home to the rare and endangered species they protect, even in a rapidly changing world.
As the best conservation strategy will depend on site conditions and land tenure, much of the work to secure Conservation Imperatives will depend on close collaboration with local groups, communities, and governments. For example, 17% of Conservation Imperatives are located within current and historical Indigenous lands (4). Indigenous Peoples and Local Communities (IPLCs) have been among the most effective stewards of biodiversity, and recognition of land rights can play an outsized role in protecting people and biodiversity (4, 35–37). Resource management by local communities can further secure the protection of millions of hectares of critical habitat within sustainable-use forest reserves, such as Amazonian floodplains (38), with the added bonus of raising thousands of local households above the poverty line (39). Where this strategy is appropriate, funding through conservation payments could provide a viable means to pay for site protection and restoration (40, 41).
Finer scale assessment of Conservation Imperatives
Conservation Imperatives can serve as a starting point to guide biodiversity protection commitments from the public and private sectors. Efforts are now underway to finance Conservation Imperatives in 5 of the top 10 countries (Table 6) for sites deemed appropriate for land purchase through private philanthropy. By the end of 2024, similar initiatives could be underway in all of the top 30 countries. Many companies are now developing strategies to become “nature positive” by avoiding impacts on biodiversity-sensitive sites and increasing financial commitments to nature and biodiversity. Conservation Imperatives should be considered for such plans, and can guide the direction of globally flexible resources toward the highest priority targets. These discrete sites are measurable and relatively straightforward to monitor and thus could appeal to companies concerned about clearly defined nature-positive outcomes. Of course, in all cases, the local context must be assessed to ensure that conservation actions will be sustainable and support local and Indigenous communities where applicable.
Conservation Imperatives can also act as “anchor points” or connectivity nodes in comprehensive conservation planning efforts. Multicriteria analysis and decision-making platforms can utilize Conservation Imperatives to optimize broader strategies for designing compact and connected protected area networks at the national, ecoregional, or subnational levels (42). Systematic conservation planning can also prove valuable, although these assessments must take into account natural, financial, social, human, and institutional factors that are best assessed and finer spatial scales (8). Existing planning tools such as Marxan (9) and new tools allowing dynamic conservation planning from automated satellite-based habitat monitoring (43) could underpin these regional assessments.
One of the most critical aspects of these fine-scale assessments is determining the viability of sites. A number of Conservation Imperatives that are not adjacent to existing protected areas are small fragments. The long-term viability of these sites and the endangered populations they contain must be subjected to feasibility analyses, such as those conducted recently for a subset of mammal species (10). These in-depth analyses can also better assess the dynamic nature of threats, model the effects of climate change, and incorporate other features.
Efforts to reach the 30×30 goal will incur long-term costs for protection and restoration. As assessments of Conservation Imperatives move to the country, ecoregional, or landscape scales, the work of local teams of scientists and planners to identify critical areas for restoration and tap into these resources could help safeguard many threatened Conservation Imperatives. Such funding is typically earmarked for restoring lands by allowing for natural regeneration or targeted re-planting (preferably with native species) and is not applicable to land purchase. However, time frames for restoration of degraded habitats can be on the order of 5–20 years or more. A central point of our paper is that the Conservation Imperatives require protection within the next 5 years. This urgency is underlined by two levels of extinction crisis documented by conservation biologists: the accelerated rates of species extinction compared to the historical background rate (32, 44) and the extinction of small populations (45). So, these conservation targets—safeguarding the last populations of rare and endangered species and the protection and restoration of habitats—exist on different timelines.
Gaps in our approach
The largest gap in our approach occurs where adding new parcels alone will not achieve the desired outcome of avoiding extinctions. The best examples of this problem are where exotic invasive species are introduced into tropical archipelagos and where poaching of endangered species, particularly keystone species, remains unchecked. In the first instance, simply setting aside land will not guarantee a future for island endemics that have evolved in the absence of exotic invasive herbivores, omnivores, and carnivores, invasive plants, or new diseases. Even those archipelagos that contain formally protected areas are subjected to these threats. Here, targeted eradication and control campaigns are the primary approaches to prevent extinctions, and funding is desperately needed to conserve the large number of tropical flora and fauna on remote islands facing these threats. In the second instance, excessive hunting and poaching of large mammal species could remove critical species whose presence or abundance is essential to maintain critical ecological function. New technologies are emerging to assist those charged with protecting endangered populations and should be part of this global funding effort to avoid extinctions (46).
Conclusion
Conservation Imperatives can contribute to a science-based priority-setting strategy for expanding the global protected area network to at least 30% by 2030, which is in line with ambitious targets outlined in the Kunming-Montreal Global Biodiversity Framework. Area-based conservation targets have moved to the forefront of conservation, and we welcome this approach. Embedded in the area-based approach, however, should be the commitment to protecting irreplaceable sites harboring rare and endangered biodiversity as we strive towards 30×30. Conservation Imperatives occupy only a small portion of the emerging global conservation portfolio but offer high-quality opportunities to protect the diversity of life on Earth.
Supplementary material
The Supplementary Material for this article can be found online at: https://www.frontiersin.org/articles/10.3389/fsci.2024.1349350/full#supplementary-material. See Appendix for additional details.
Acknowledgments
This paper is dedicated to a visionary in biodiversity conservation, Dr. Thomas Lovejoy: a friend of wild nature, colleague, mentor, and inspiration to us all. We would like to thank R. Naidoo, S. Butchart, and S. Pimm for their helpful comments on the manuscript. We thank N. D. Burgess and A. Arnell at UNEP-WCMC for providing support and verification of the use of the World Database on Protected Area data in the analysis and for valuable editorial comments. A pre-print version of this manuscript was submitted to Preprints.org, and the most recent version is available online at https://www.preprints.org/manuscript/202309.1827/v2 (47).
Statements
Author contributions
ED: Writing – original draft, Writing – review & editing, Conceptualization, Investigation, Methodology, Project administration, Supervision, Validation. AJ: Investigation, Methodology, Software, Validation, Visualization, Writing – original draft, Writing – review & editing, Conceptualization, Data curation, Formal Analysis. NH: Writing – original draft, Writing – review & editing, Conceptualization, Data curation, Formal Analysis, Investigation, Methodology, Resources, Software, Validation, Visualization. AL: Writing – original draft, Writing – review & editing, Conceptualization, Formal Analysis, Investigation, Project administration, Validation, Visualization. CVy: Writing – original draft, Writing – review & editing, Conceptualization, Methodology, Supervision, Validation. KB: Writing – original draft, Writing – review & editing, Conceptualization, Funding acquisition, Supervision, Validation. GA: Writing – original draft, Writing – review & editing, Methodology, Software. CB: Writing – original draft, Writing – review & editing, Resources. GC: Writing – original draft, Writing – review & editing. RC: Writing – original draft, Writing – review & editing, Resources. RD: Writing – original draft, Writing – review & editing. OF: Writing – original draft, Writing – review & editing. SH: Writing – original draft, Writing – review & editing, Funding acquisition. BL: Writing – original draft, Writing – review & editing. HM: Writing – original draft, Writing – review & editing. FP: Writing – original draft, Writing – review & editing, Visualization. DO: Writing – original draft, Writing – review & editing. BP: Writing – original draft, Writing – review & editing. CP: Writing – original draft, Writing – review & editing. RP: Writing – original draft, Writing – review & editing. AR: Writing – original draft, Writing – review & editing. CVe: Writing – original draft, Writing – review & editing, Resources. EW: Writing – original draft, Writing – review & editing. AZ: Writing – original draft, Writing – review & editing.
Data availability statement
The datasets presented in this study can be found in online repositories. The names of the repository/repositories and accession number(s) can be found in the article/Supplementary Material. Shape files of Conservation Imperative sites are not publicly available due to restrictions of the original data layers from which they are derived. Land price data is not publicly available due to privacy restrictions from the data owners and the sites that were funded.
Funding
The author(s) declare financial support was received for the research, authorship, and/or publication of this article. This work was supported by a grant from the non‐profit organization One Earth (https://www.oneearth.org).
Conflict of interest
Authors AR and AZ are employed by the company Planet Labs PBC. The company was not involved in the study design, collection, analysis, interpretation of data, the writing of this article, or the decision to submit it for publication.
This study received funding from the non‐profit organization One Earth (https://www.oneearth.org), which KB and SH are employed by. KB was responsible for manuscript writing and reviewing, study conceptualization, funding acquisition, supervision, and validation. SH was responsible for manuscript writing and reviewing, and funding acquisition.
The remaining authors declare that the research was conducted in the absence of any commercial or financial relationships that could be construed as a potential conflict of interest.
The handling editor HP declared a past collaboration with the author KB. The reviewer JK declared a shared research project Global Renewables Watch with the author AZ to the handling editor, and declared a collaboration with the author KB which started after peer review of the present manuscript.
The author BL declared that they were an editorial board member of Frontiers, at the time of submission. This had no impact on the peer review process and the final decision.
Publisher’s note
All claims expressed in this article are solely those of the authors and do not necessarily represent those of their affiliated organizations, or those of the publisher, the editors and the reviewers. Any product that may be evaluated in this article, or claim that may be made by its manufacturer, is not guaranteed or endorsed by the publisher.
Author disclaimer
The findings and perspectives in this paper do not necessarily reflect the position of Planet Labs PBC.
References
1. Convention on Biological Diversity. COP15: nations adopt four goals 23 targets for 2030 in landmark UN biodiversity agreement (2022). Available at: https://www.cbd.int/article/cop15-cbd-press-release-final-19dec2022.
2. Locke H. Nature needs (at least) half: a necessary new agenda for protected areas. In: Wuerthner G, Crist E, Butler T eds. Protecting the Wild: Parks and Wilderness, the Foundation for Conservation. Washington, DC: Island Press. p. 3–15. doi: 10.5822/978-1-61091-551-9_1
3. Pimm SL, Jenkins CN, Li BV. How to protect half of Earth to ensure it protects sufficient biodiversity. Sci Adv (2018) 4(8):eaat2616. doi: 10.1126/sciadv.aat2616
4. Dinerstein E, Joshi AR, Vynne C, Lee ATL, Pharand-Deschênes F, França M, et al. A “Global Safety Net” to reverse biodiversity loss and stabilize Earth’s climate. Sci Adv (2020) 6(36):eabb2824. doi: 10.1126/sciadv.abb2824
5. International Union for Conservation of Nature World Conservation Congress. “101 - Setting area-based conservation targets based on evidence of what nature and people need to thrive.” IUCN World Conservation Congress Marseille (2021). Available at: https://www.iucncongress2020.org/motion/101.
6. Kuempel CD, Chauvenet ALM, Possingham HP. Equitable representation of ecoregions is slowly improving despite strategic planning shortfalls. Conserv Lett (2016) 9(6):422–8. doi: 10.1111/conl.12298
7. Margules CR, Pressey RL. Systematic conservation planning. Nature (2000) 405(6783):243–53. doi: 10.1038/35012251
8. Bottrill MC, Pressey RL. The effectiveness and evaluation of conservation planning. Conserv Lett (2012) 5(6):407–20. doi: 10.1111/j.1755-263X.2012.00268.x
9. Watts ME, Stewart RR, Martin TG, Klein CJ, Carwardine J, Possingham HP. Systematic conservation planning with Marxan. In: Learn Landsc Ecol Pract Guid Concepts Tech (2017). p. 211–27.
10. Wolff NH, Visconti P, Kujala H, Santini L, Hilbers JP, Possingham HP, et al. Prioritizing global land protection for population persistence can double the efficiency of habitat protection for reducing mammal extinction risk. One Earth (2023) 6(11):1564–75. doi: 10.1016/j.oneear.2023.10.001
11. United Nations Environment Programme World Conservation Monitoring Centre and International Union for Conservation of Nature. Protected planet: the World Database on Protected Areas (WDPA) and world database on other effective area-based conservation measures (WD-OECM) (2023). Available at: www.protectedplanet.net.
12. Buchhorn M, Smets B, Bertels L, De Roo B, Lesiv M, Tsendbazar N-E, et al. Copernicus global land service: land cover 100m: collection 3: epoch 2019: Globe. Version V3. 0.1. (2020). doi: 10.5281/zenodo.3939038.
13. Gorelick N, Hancher M, Dixon M, Ilyushchenko S, Thau D, Moore R. Google Earth Engine: planetary-scale geospatial analysis for everyone. Remote Sens Environ (2017) 202:18–27. doi: 10.1016/j.rse.2017.06.031
14. Brooks TM, Pimm SL, Akçakaya HR, Buchanan GM, Butchart SHM, Foden W, et al. Measuring terrestrial area of habitat (AOH) and its utility for the IUCN Red List. Trends Ecol Evol (2019) 34(11):977–86. doi: 10.1016/j.tree.2019.06.009
15. Dinerstein E, Olson D, Joshi A, Vynne C, Burgess ND, Wikramanayake E, et al. An ecoregion-based approach to protecting half the terrestrial realm. BioScience (2017) 67(6):534–45. doi: 10.1093/biosci/bix014
16. Beier P. A rule of thumb for widths of conservation corridors. Conserv Biol (2019) 33(4):976–8. doi: 10.1111/cobi.13256
17. Naidoo R, Iwamura T. Global-scale mapping of economic benefits from agricultural lands: implications for conservation priorities. Biol Conserv (2007) 140(1–2):40–9. doi: 10.1016/j.biocon.2007.07.025
18. Strassburg BBN, Iribarrem A, Beyer HL, Cordeiro CL, Crouzeilles R, Jakovac CC, et al. Global priority areas for ecosystem restoration. Nature (2020) 586(7831):724–9. doi: 10.1038/s41586-020-2784-9
19. Coomes OT, MacDonald GK, de Waroux YP. Geospatial land price data: A public good for global change science and policy. BioScience (2018) 68(7):481–4. doi: 10.1093/biosci/biy047
20. White TB, Petrovan SO, Christie AP, Martin PA, Sutherland WJ. What is the price of conservation? A review of the status quo and recommendations for improving cost reporting. BioScience (2022) 72(5):461–71. doi: 10.1093/biosci/biac007
21. Quick Response Fund for Nature (n.d.). Available at: www.quickrespondfund.org.
22. Tulloch VJD, Atkinson S, Possingham HP, Peterson N, Linke S, Allan JR, et al. Minimizing cross-realm threats from land-use change: a national-scale conservation framework connecting land, freshwater and marine systems. Biol Conserv (2021) 254:108954. doi: 10.1016/j.biocon.2021.108954
23. World Bank. World databank. World Development Indicators (2022). Available at: https://databank.worldbank.org/source/world-development-indicators.
24. Burnham KP, Anderson DR. Multimodel inference: understanding AIC and BIC in model selection. Sociol Methods Res (2004) 33(2):261–304. doi: 10.1177/0049124104268644
25. Dormann CF, Elith J, Bacher S, Buchmann C, Carl G, Carré G, et al. Collinearity: a review of methods to deal with it and a simulation study evaluating their performance. Ecography (2013) 36(1):27–46. doi: 10.1111/j.1600-0587.2012.07348.x
26. Mooney CZ. Monte Carlo Simulation. USA: Sage Publications Inc (1997). doi: 10.4135/9781412985116
27. Arneth A, Shin Y-J, Leadley P, Rondinini C, Bukvareva E, Kolb M, et al. Post-2020 biodiversity targets need to embrace climate change. Proc Natl Acad Sci USA (2020) 117(49):30882–91. doi: 10.1073/pnas.2009584117
28. Shin YJ, Midgley GF, Archer ERM, Arneth A, Barnes DKA, Chan L, et al. Actions to halt biodiversity loss generally benefit the climate. Glob Chang Biol (2022) 28(9):2846–74. doi: 10.1111/gcb.16109
29. International Union for Conservation of Nature and Natural Resources. Global standard for nature-based solutions. A user-friendly framework for the verification, design and scaling up of NbS. Switzerland: Gland (2020).
30. Maxwell SL, Cazalis V, Dudley N, Hoffman M, Rodrigues ASL, Stolton S, et al. Area-based conservation in the twenty-first century. Nature (2020) 586:217–27. doi: 10.1038/s41586-020-2773-z
31. Venter O, Magrach A, Outram N, Klein CJ, Possingham HP, Di Marco M, et al. Bias in protected-area location and its effects on long-term aspirations of biodiversity conventions. Conserv Biol (2018) 32(1):127–34. doi: 10.1111/cobi.12970
32. Pimm SL, Jenkins CN, Abell R, Brooks TM, Gittleman JL, Joppa LN, et al. The biodiversity of species and their rates of extinction, distribution, and protection. Science (2014) 344(6187):1246752. doi: 10.1126/science.1246752
33. Pressey RL, Cabeza M, Watts ME, Cowling RM, Wilson KA. Conservation planning in a changing world. Trends Ecol Evol (2007) 22(11):583–92. doi: 10.1016/j.tree.2007.10.001
34. Waldron A, Adams V, Allan J, Arnell A, Asner G, Atkinson S, et al. Protecting 30% of the planet for nature: costs, benefits and economic implications. International Institute for Applied Systems Analysis (2020). Available at: https://www.conservation.cam.ac.uk/files/waldron_report_30_by_30_publish.pdf. doi: 10.17863/CAM.56764
35. Ban NC, Frid A, Reid M, Edgar B, Shaw D, Siwallace P. Incorporate Indigenous perspectives for impactful research and effective management. Nat Ecol Evol (2018) 2(11):1680–3. doi: 10.1038/s41559-018-0706-0
36. Dawson NM, Coolsaet B, Sterling EJ, Loveridge R, Gross-Camp ND, Wongbusarakum S, et al. The role of Indigenous peoples and local communities in effective and equitable conservation. E&S (2021) 26(3):19. doi: 10.5751/ES-12625-260319
37. Prioli Duarte DP, Peres CA, Perdomo EFC, Guizar-Coutiño A, Nelson BW. Reducing natural vegetation loss in Amazonia critically depends on the formal recognition of indigenous lands. Biol Conserv (2023) 279:109936. doi: 10.1016/j.biocon.2023.109936
38. Campos-Silva JV, Peres CA. Community-based management induces rapid recovery of a high-value tropical freshwater fishery. Sci Rep (2016) 6:34745. doi: 10.1038/srep34745
39. Campos-Silva JV, Peres CA, Hawes JE, Haugaasen T, Freitas CT, Ladle RJ, et al. Sustainable-use protected areas catalyze enhanced livelihoods in rural Amazonia. Proc Natl Acad Sci USA (2021) 118(40):e2105480118. doi: 10.1073/pnas.2105480118
40. Börner J, Wunder S, Wertz-Kanounnikoff S, Tito MR, Pereira L, Nascimento N. Direct conservation payments in the Brazilian Amazon: scope and equity implications. Ecol Econ (2010) 69(6):1272–82. doi: 10.1016/j.ecolecon.2009.11.003
41. Zander KK, Garnett ST. The economic value of environmental services on indigenous-held lands in Australia. PloS One (2011) 6(8):e23154. doi: 10.1371/journal.pone.0023154
42. Zhang R, Lu Y, Adams K, Sefair JA, Mellin H, Acevedo MA, et al. A visual analytics framework for conservation planning optimization. Environ Modell Softw (2021) 145:105178. doi: 10.1016/j.envsoft.2021.105178
43. Shirk AJ, Jones GM, Yang Z, Davis RJ, Ganey JL, Gutiérrez RJ, et al. Automated habitat monitoring systems linked to adaptive management: a new paradigm for species conservation in an era of rapid environmental change. Landsc Ecol (2023) 38(1):7–22. doi: 10.1007/s10980-022-01457-1
44. Ceballos G, Ehrlich PR, Barnosky AD, García A, Pringle RM, Palmer TM. Accelerated modern human–induced species losses: entering the sixth mass extinction. Sci Adv (2015) 1(5):e1400253. doi: 10.1126/sciadv.1400253
45. Ceballos G, Ehrlich PR, Dirzo R. Biological annihilation via the ongoing sixth mass extinction signaled by vertebrate population losses and declines. Proc Natl Acad Sci USA (2017) 114(30):E6089–96. doi: 10.1073/pnas.1704949114
46. Dertien JS, Negi H, Dinerstein E, Krishnamurthy R, Negi HS, Gopal R, et al. Mitigating human–wildlife conflict and monitoring endangered tigers using a real-time camera-based alert system. BioScience (2023) 73(10):748–57. doi: 10.1093/biosci/biad076
47. Dinerstein E, Joshi AR, Hahn NR, Lee ATL, Vynne C, Burkart K, et al. Conservation Imperatives: securing the last unprotected terrestrial sites harboring irreplaceable biodiversity. [Preprint] (2023). doi: 10.20944/preprints202309.1827.v2
Appendix
See Supplementary Material (Presentation 1) for information on the creation of the species rarity layer (2018), caveats and sources of error of the fractional analysis and cost assessment, and supplementary tables and figures:
● SM Table 1. The six biodiversity datasets comprising the species rarity layer and their 923 terrestrial areas.
● SM Table 2. Distribution of Conservation Imperative sites by ecoregion. (See Supplementary Spreadsheet.)
● SM Table 3. Distribution of Conservation Imperative sites by administration. (See Supplementary Spreadsheet.)
● SM Table 4. Model selection table with AIC and R2 values.
● SM Table 5. Model estimates for the top candidate model using realm purchase size, purchase type per capita GDP, and population size.
● SM Figure 1. Locations of project cost data.
● SM Figure 2. Probability distributions for the predicted mean cost per hectare and total land costs.
● SM Figure 3. Maps of Conservation Imperatives in A) the Philippines, B) Brazil, C) Indonesia, D) Madagascar, and E) Colombia.
● SM File. R Code for land cost model fitting and simulation.
Keywords: Conservation Imperatives, 30x30, protected area targets, rare species, land cover fraction mapping, geospatial analysis, land costs analysis
Citation: Dinerstein E, Joshi AR, Hahn NR, Lee ATL, Vynne C, Burkart K, Asner GP, Beckham C, Ceballos G, Cuthbert R, Dirzo R, Fankem O, Hertel S, Li BV, Mellin H, Pharand-Deschênes F, Olson D, Pandav B, Peres CA, Putra R, Rosenthal A, Verwer C, Wikramanayake E and Zolli A. Conservation Imperatives: securing the last unprotected terrestrial sites harboring irreplaceable biodiversity. Front Sci (2024) 2:1349350. doi: 10.3389/fsci.2024.1349350
Received: 04 December 2023; Accepted: 22 May 2024;
Published: 25 June 2024.
Edited by:
Hugh Possingham, The University of Queensland, AustraliaReviewed by:
Joseph Michael Kiesecker, The Nature Conservancy, United StatesDavid Lindenmayer, Australian National University, Australia
Copyright © 2024 Dinerstein, Joshi, Hahn, Lee, Vynne, Burkart, Asner, Beckham, Ceballos, Cuthbert, Dirzo, Fankem, Hertel, Li, Mellin, Pharand-Deschênes, Olson, Pandav, Peres, Putra, Rosenthal, Verwer, Wikramanayake and Zolli. This is an open-access article distributed under the terms of the Creative Commons Attribution License (CC BY). The use, distribution or reproduction in other forums is permitted, provided the original author(s) and the copyright owner(s) are credited and that the original publication in this journal is cited, in accordance with accepted academic practice. No use, distribution or reproduction is permitted which does not comply with these terms.
*Correspondence: Eric Dinerstein, ZWRpbmVyc3RlaW5AcmVzb2x2ZS5uZ28=
