Explore article hub
 Matthew Collins1*
 Jonathan D. Beverley1,2,3
 Thomas J. Bracegirdle4Jennifer Catto1
 Michelle McCrystall5,6Andrea Dittus7
 Nicolas Freychet8
 Jeremy Grist9
 Gabriele C. Hegerl8
 Paul R. Holland4
 Caroline Holmes4Simon A. Josey9Manoj Joshi10
 Ed Hawkins7
 Eunice Lo11
 Natalie Lord11
 Dann Mitchell11
 Paul-Arthur Monerie7Matthew D. K. Priestley1Adam Scaife1,12
 James Screen1Natasha Senior10David Sexton12Emily Shuckburgh13Stefan Siegert1
 Charles Simpson14
 David B. Stephenson1Rowan Sutton7
 Vikki Thompson11,15
 Laura J. Wilcox7Tim Woollings16
- 1Department of Mathematics and Statistics, University of Exeter, Exeter, United Kingdom
- 2Cooperative Institute for Research in Environmental Sciences, University of Colorado Boulder, Boulder, CO, United States
- 3National Oceanic and Atmospheric Administration (NOAA) Physical Sciences Laboratory (PSL), Boulder, CO, United States
- 4British Antarctic Survey, Natural Environment Research Council, Cambridge, United Kingdom
- 5Centre for Earth Observation Science, University of Manitoba, Winnipeg, MB, Canada
- 6Department of Physics, University of Auckland, Auckland, New Zealand
- 7National Centre for Atmospheric Science, Department of Meteorology, University of Reading, Reading, United Kingdom
- 8School of Geosciences, University of Edinburgh, Edinburgh, United Kingdom
- 9National Oceanography Centre, Southampton, United Kingdom
- 10Climate Research Unit (CRU), University of East Anglia, Norwich, United Kingdom
- 11School of Geographical Sciences and Cabot Institute, University of Bristol, Bristol, United Kingdom
- 12Met Office, Exeter, United Kingdom
- 13Cambridge Zero, University of Cambridge, Cambridge, United Kingdom
- 14Bartlett School of Environment, Energy and Resources, University College London (UCL), London, United Kingdom
- 15Royal Netherlands Meteorological Institute (KNMI), Utrecht, Netherlands
- 16Atmosphere Oceanic and Planetary Physics, Department of Physics, University of Oxford, Oxford, United Kingdom
Abstract
The reality of human-induced climate change is unequivocal and exerts an ever-increasing global impact. Access to the latest scientific information on current climate change and projection of future trends is important for planning adaptation measures and for informing international efforts to reduce emissions of greenhouse gases (GHGs). Identification of hazards and risks may be used to assess vulnerability, determine limits to adaptation, and enhance resilience to climate change. This article highlights how recent research programs are continuing to elucidate current processes and advance projections across major climate systems and identifies remaining knowledge gaps. Key findings include projected future increases in monsoon rainfall, resulting from a changing balance between the rainfall-reducing effect of aerosols and rainfall-increasing GHGs; a strengthening of the storm track in the North Atlantic; an increase in the fraction of precipitation that falls as rain at both poles; an increase in the frequency and severity of El Niño Southern Oscillation (ENSO) events, along with changes in ENSO teleconnections to North America and Europe; and an increase in the frequency of hazardous hot-humid extremes. These changes have the potential to increase risks to both human and natural systems. Nevertheless, these risks may be reduced via urgent, science-led adaptation and resilience measures and by reductions in GHGs.
Key points
- Monsoons are expected to increase in intensity in the future, as aerosol emissions abate and greenhouse gas forcing emerges, increasing the risks of floods, landslides, and reduced agricultural yields in affected regions.
- Very high-resolution climate models have recently highlighted a potential strengthening of the storm track into northwestern Europe, risking an increase in land-falling extreme storms likely to cause high winds, flooding, and threats to infrastructure.
- An increasing fraction of precipitation will fall as rain rather than snow over both poles in the future, potentially destabilizing melting ice and amplifying sea level rise.
- El Niño Southern Oscillation (ENSO) events, which cause floods, droughts, heatwaves, and wildfires around the world, are expected to increase in frequency and severity in as little as 20 years.
- Temperature extremes are increasing globally: impactful events often combine high heat and humidity, thereby significantly affecting sectors such as agriculture—negatively impacting crop yields, reducing the ability to work outdoors, and increasing mortality in vulnerable populations.
Introduction
The human-induced forcing of climate change, principally due to increases in atmospheric carbon dioxide (CO2) and other greenhouse gas (GHG) emissions, is unequivocal, and the climate will continue to warm until net zero emissions are achieved (1). Even if CO2 emissions ceased completely, global temperatures would remain elevated for many decades and it would take centuries before atmospheric GHG concentrations returned to pre-industrial levels via natural uptake processes (2). Assessing the likelihood of different levels of global warming over the coming decades is important to inform efforts to avoid dangerous climate change. It is equally important to understand regional aspects of climate change, including extreme events such as heatwaves, to allow adaptation planning and to monitor the effects of mitigation strategies. Here we present new results concerning regional impacts of climate change that we might expect to see this century. This article builds on recent comprehensive Intergovernmental Panel on Climate Change (IPCC) reports (3) and synthesizes recent studies from diverse geographic areas, ranging from the equator to the poles. A complete synthesis of all aspects of regional climate change is not possible given the constraints on the length of this article; hence, we focus on a few key areas where recent progress has been made.
Scenarios and global mean temperature projections
Climate model projections usually employ scenarios of different future GHGs and other forcing agents to make projections, and modeling centers share model outputs from coordinated experiments via the Coupled Model Intercomparison Projects (CMIP5 and CMIP6) (4). They use a set of Shared Socioeconomic Pathways (SSPs) to sample different possible futures (5). SSPs offer five different pathways (SSP1–5) with different assumptions about future levels of population, land use, gross domestic product (GDP), and emissions of GHGs and other pollutants, especially aerosols (Box 1). Within each SSP, further assumptions lead to sub-SSP scenarios, e.g., SSP1–1.9 or SSP1–2.6, providing more detailed qualitative and/or quantitative information to support specific analyses. These are based on the Representative Concentration Pathways (RCPs; Box 2). As climate projection scientists, we combine information from models, observations, and our understanding of how the climate system works to assess likely changes under these scenarios.
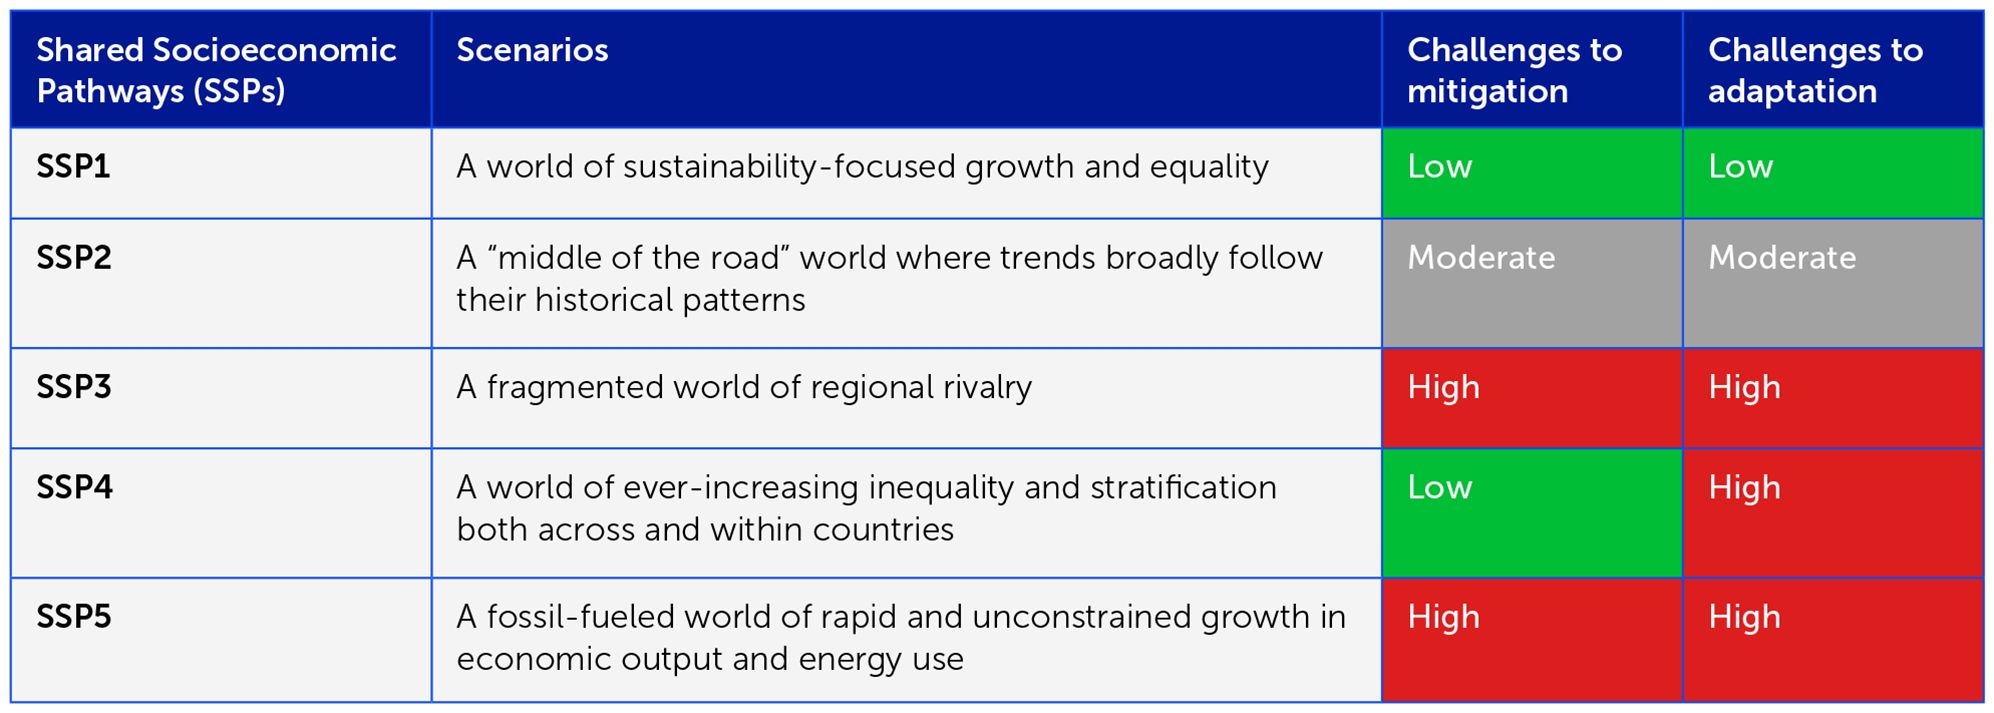
Box 1 Assumptions underpinning the Shared Socioeconomic Pathways (SSPs) used to characterize different levels of future global warming and climate change. Adapted from (5).
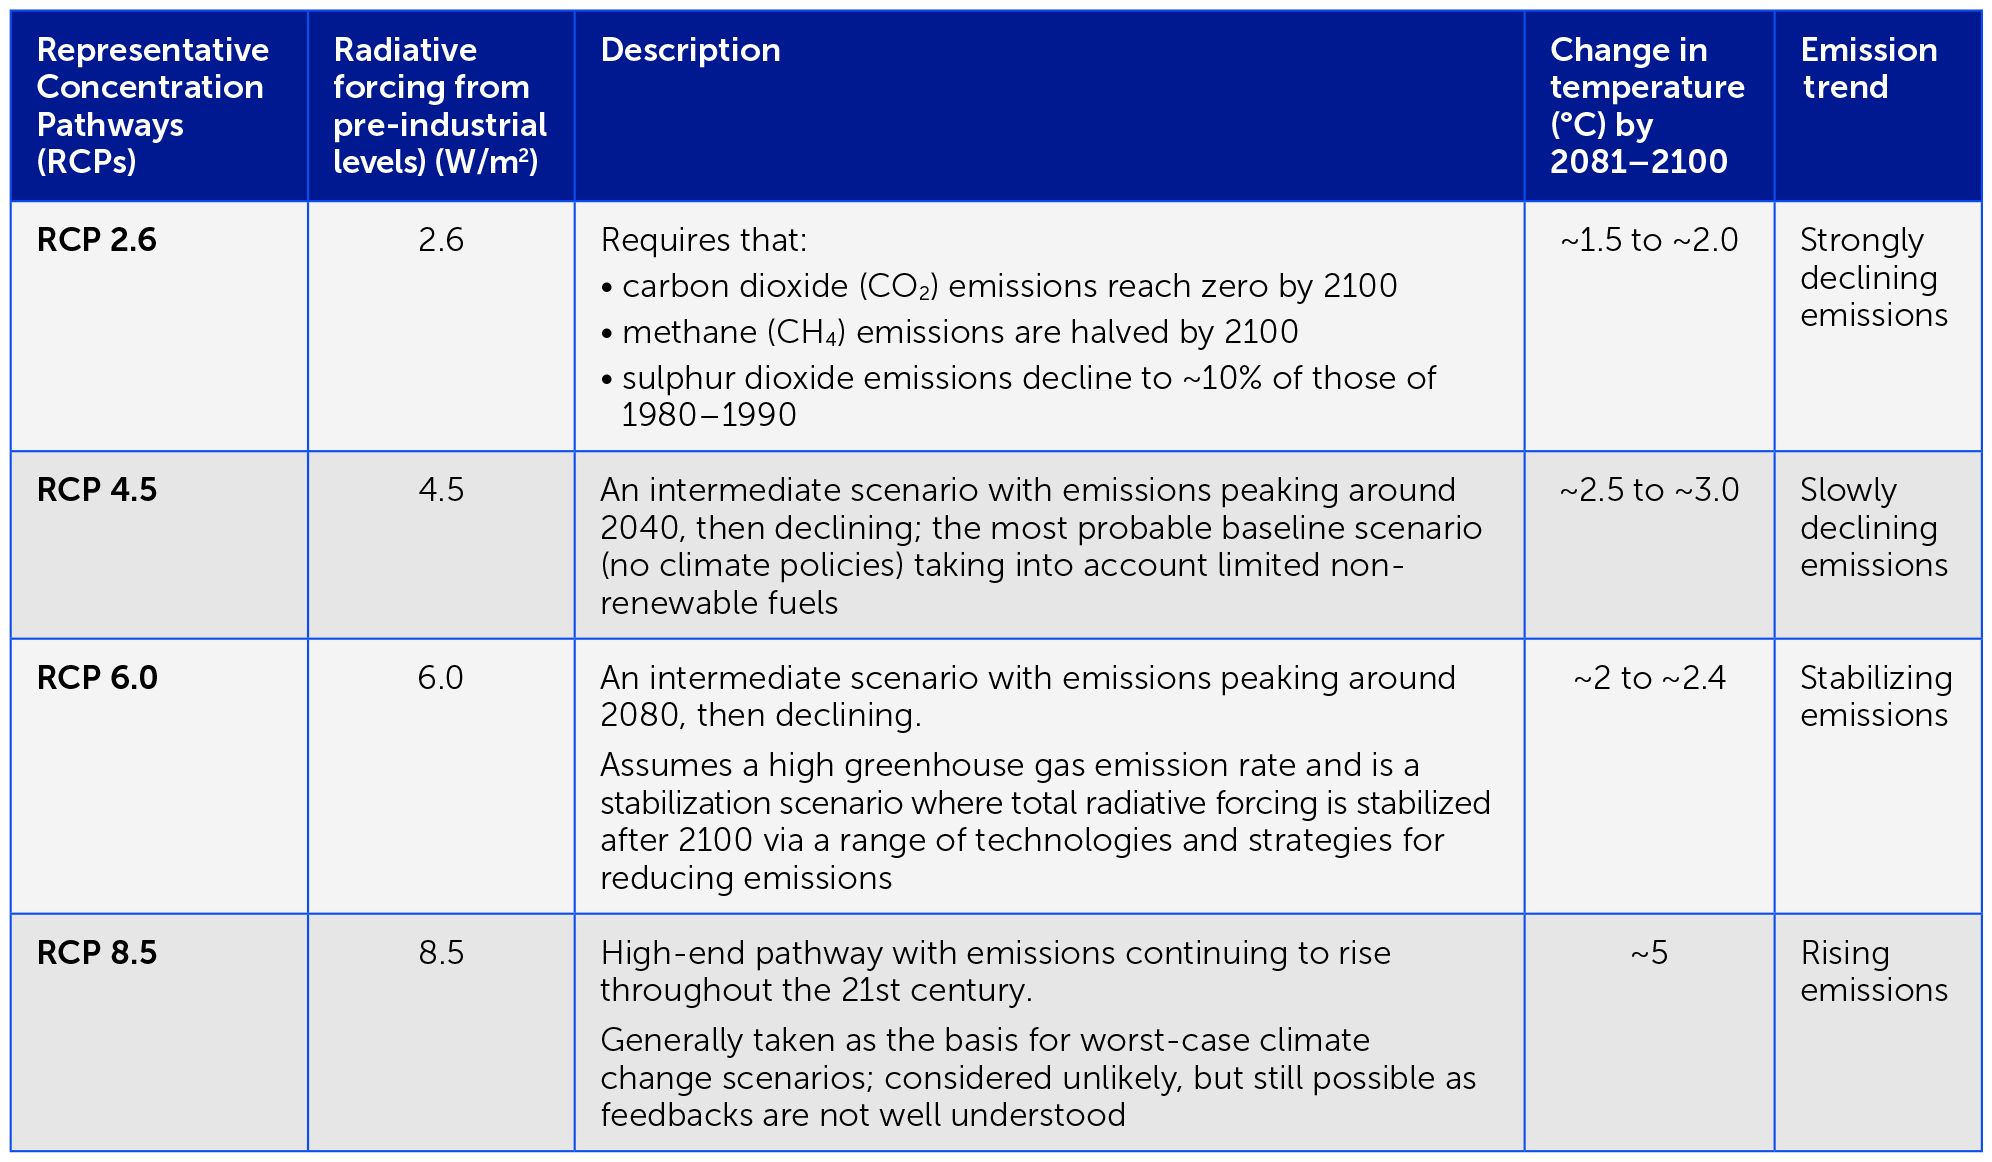
Box 2 Assumptions underpinning the Representative Concentration Pathways (RCPs) used by the International Panel on Climate Change (IPCC) to characterize different levels of future global warming and climate change as sub-pathways of the Shared Socioeconomic Pathways (SSPs; see Box 1). Adapted from (5).
Different scenarios produce different levels of future global warming. However, climate models are not perfect representations of how the real climate system might evolve, owing to approximations and limitations in computing power. Moreover, any ensemble of global mean climate projections does not necessarily represent our best estimate of the likely level of future global warming (7). Reports such as the IPCC commonly adjust the model output to produce a more credible estimate of future change. Judgments about how to produce credible estimates lead to uncertainty over when key policy-relevant thresholds will be realized, such as when pre-industrial temperatures will be exceeded by 1.5°C and 2°C (Figure 1). Regional aspects of climate change and extreme events often scale well with global mean temperature. Adjusting these projections is therefore useful and global mean temperature targets are a major focus for climate policy.
Figure 1
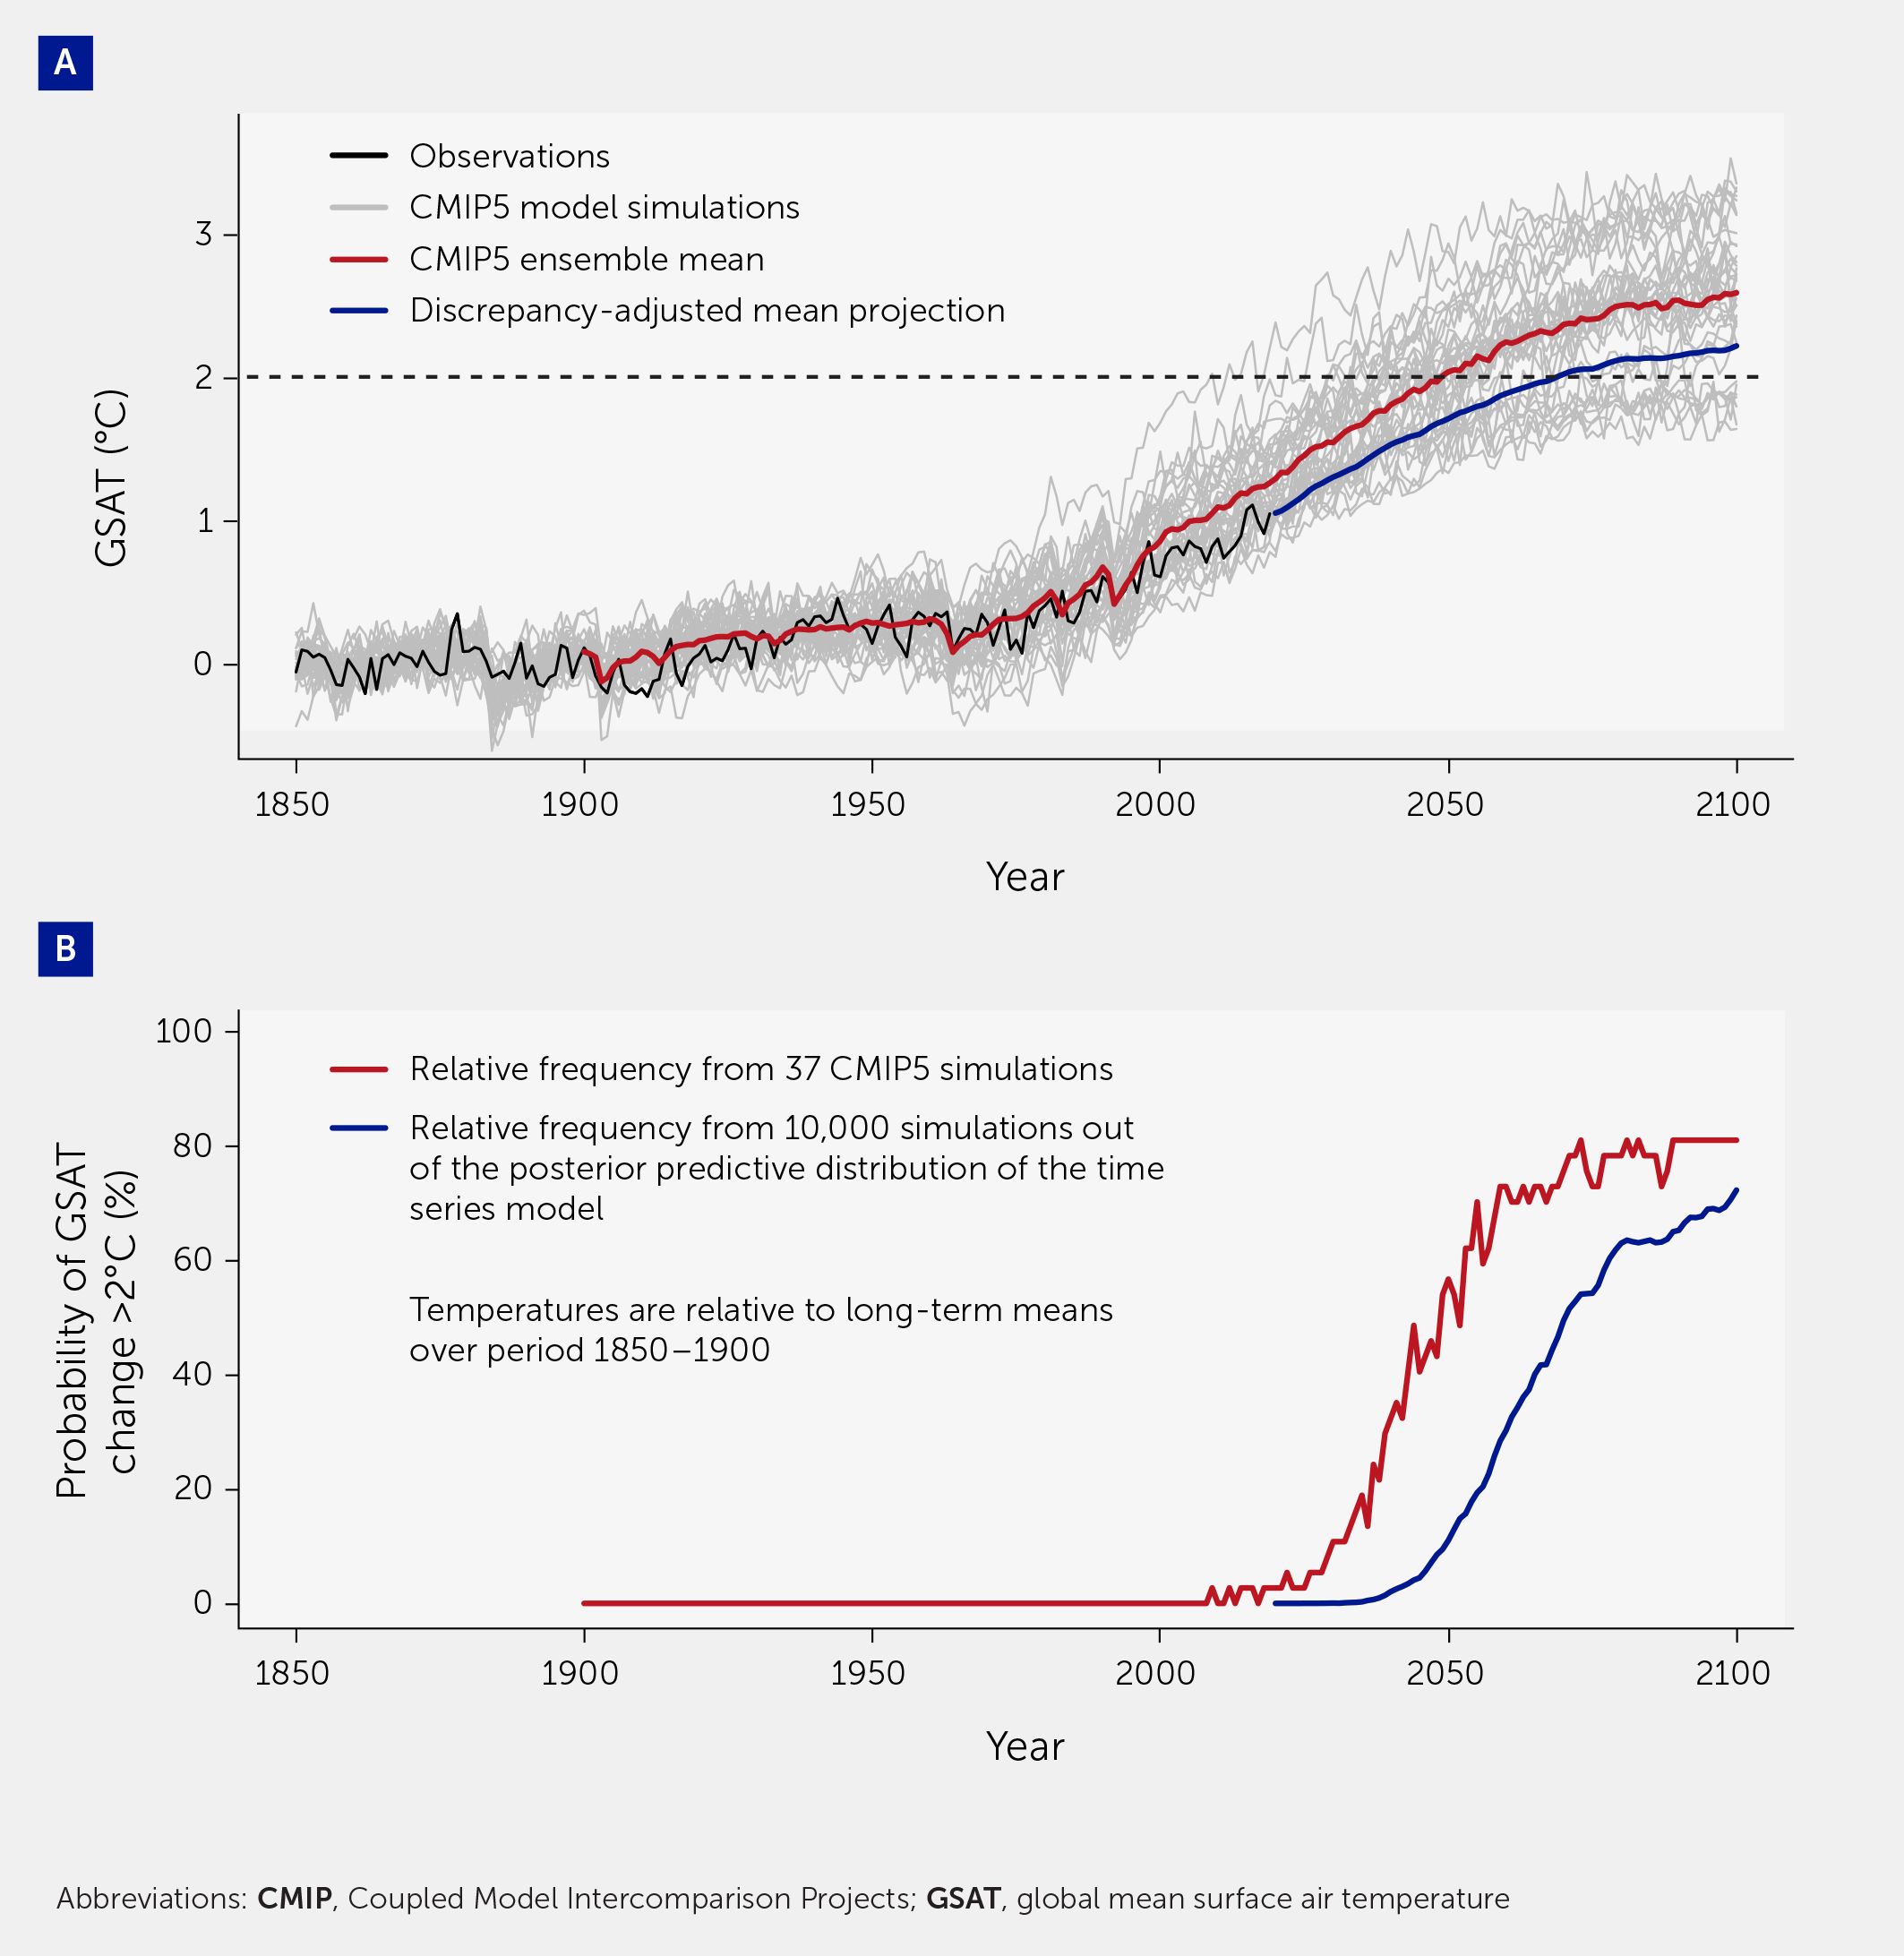
Figure 1 (A) Global mean surface air temperature (GSAT) observations and projections. Figure plots Coupled Model Intercomparison Projects (CMIP)-5 model simulations, CMIP5 ensemble mean, and discrepancy-adjusted mean projections for GSAT over time. (B) Probability (in %) of GSAT change exceeding 2°C, showing relative frequencies from 37 CMIP5 simulations and 10,000 simulations from the posterior predictive distribution of the time series model—all relative to the long-term means over the early industrial period of 1850–1900. Adapted from (8) based on a simple linear energy balance model that can mimic the global mean temperature evolution of more complex climate models (9). The projections of mean warming are almost 0.5°C cooler than those in the Intergovernmental Panel on Climate Change 5th Assessment Report, which ignores common discrepancies—leading to a substantial reduction and a delay of several decades in the future probability of > 2°C warming (10). Other approaches to adjusting for climate model discrepancies use other assumptions and hence produce quantitatively different projections.
In addition to the SSP scenarios, new experiments are exploring the impacts of stabilization at the target global warming levels of 1.5 and 2°C set out in the Paris Agreement (11). Fixed GHG concentration experiments show ongoing warming beyond 2100, as expected when concentrations are kept constant (Figure 2) (13). Fixed concentrations of CO2 imply some continued emissions and so are not equivalent to net zero emission experiments. Zero CO2 emission experiments allow GHG concentrations to evolve interactively, leading to a decline in concentrations following a cessation of emissions. Such experiments may more closely simulate the effects of reaching net zero emissions in the real world, where we expect that a cessation of GHG emissions would halt further human-induced global warming (2, 3).
Figure 2
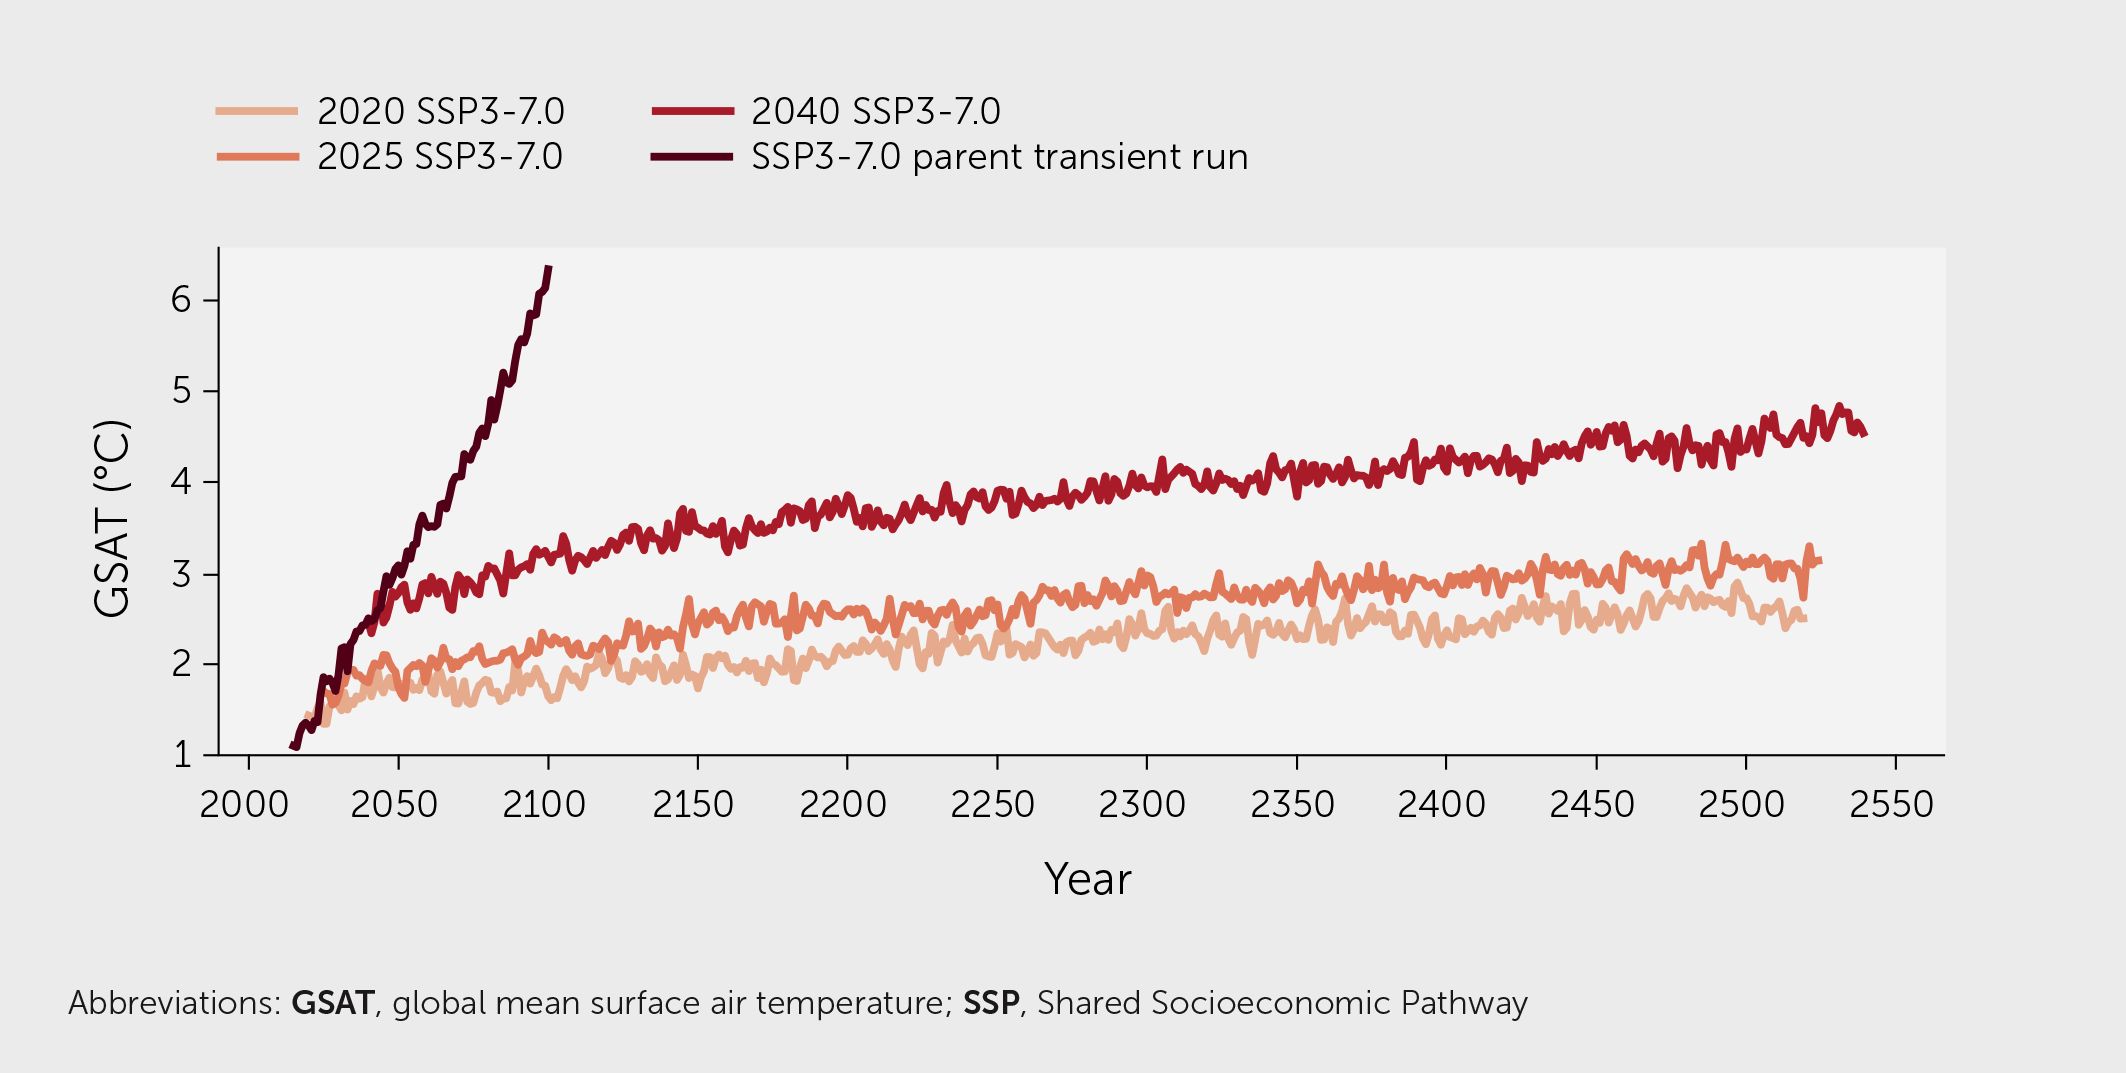
Figure 2 Global mean surface air temperatures over time from climate model (UKESM1.0-LL) experiments in which all anthropogenic forcings were held constant at the level they were at in the year of branching off (in 2020, 2025, and 2040) from the parent Shared Socioeconomic Pathway SSP3–7.0 scenario. This includes constant concentrations of greenhouse gases (GHG) and constant emissions of anthropogenic aerosols and their precursors. Similar experiments branching off from SSP2–4.5 and SSP1–1.9 are not shown here. Data from (12).
The results reported here use a range of different approaches to assess the signal of climate change. Some compare changes in different SSP scenarios, while others compare changes at different warming levels or simply assess the largest global warming scenario to maximize the signal-to-noise ratio, i.e., the climate change signal against the background of natural internal climate variability. In general, we do not assign likelihoods to different warming levels or scenarios but rather seek to assess confidence in signals based on our understanding of how the climate system works.
Other climate forcers
Tropospheric aerosol emissions and concentrations are particularly relevant to regional climate change over the next two decades. Projected emissions of anthropogenic aerosols (such as black carbon) and their precursors (such as sulfur dioxide; SO2) span a range of pathways, from rapid reductions to close to preindustrial levels by 2050 in SSP1 to continued increases to 2050 followed by moderate decreases in SSP3. SSP2 and SSP5 both include similar steady declines throughout the 21st century, with carbonaceous aerosol emissions reaching pre-industrial levels by 2100, and SO2 emissions returning to ~1900 levels. GHG emissions are projected to decrease in SSPs 1 and 2. In SSP3 and SSP5 they continue to increase until ~2050 and ~2070, respectively, before declining. Generally, aerosol reductions will cause a climate response of the same sign as GHG increases. While their influence on global temperature projections is small, they are expected to play a larger role in regional climate changes.
Assessing regional climate change and extremes
Models and observations both show robust signals of climate change. For example, models indicate greater warming over land than over the ocean, tropospheric warming and stratospheric cooling, Arctic amplification of warming, and enhanced warming of tropical upper tropospheric temperatures—all features that have relatively well-understood physical mechanisms (3, 10). Nevertheless, the amplitude and precise spatial patterns of these features require further study because of feedback in the climate system (14). These thermodynamic features of climate change led to dynamic changes in the atmosphere and ocean that are responsible for changes in regional rainfall and weather systems. Models are known not to provide perfect “digital twins” of the real climate system: persistent and stubborn errors in models still hamper progress in assessing regional and dynamical changes. Many of the examples below aim to take model imperfections into account using different approaches. This is a major focus of adaptation-related climate science.
This article examines recently described changes in monsoons, storm tracks and storms, and polar phenomena together with evidence regarding changes in the teleconnection patterns that link remote geographical regions. Finally, we look at changes in extreme phenomena, such as heatwaves. The final section outlines how we move from assessing the physical climate hazard to evaluating how such hazards impact nature and people—to better inform critical mitigation and adaptation actions.
Monsoons and tropical rainfall
Monsoons
The term monsoon was traditionally used to describe the seasonally reversing winds that occur in various tropical and subtropical regions in summer. However, we now use the term to mean both changes in atmospheric circulation and the accompanying abundant rainfall that is important for agriculture, for example. We either talk of individual monsoons or a collection of monsoon systems averaged over multiple regions.
Changes in tropical precipitation associated with monsoons directly affect billions of people, with 60% of the world’s population living in the Northern Hemisphere monsoon regions where the summer monsoon can bring 80% of the total annual rainfall (15). Averaged over all the major Northern Hemisphere monsoon systems, precipitation decreased from the 1950s to the 1980s. This was largely in response to increases in anthropogenic aerosol emissions (16–18), which reduce hemispheric temperature contrasts, cause the Inter-Tropical Convergence Zone (ITCZ) to shift southwards, and decrease moisture flux into monsoon regions. A range of regional trends exist within the Northern Hemisphere monsoon region. For example, the severe Sahel drought in the 1980s has been largely attributed to aerosol increases (19, 20), while drying trends over South Asia lie within the range of internal variability (21, 22).
Northern Hemisphere monsoon precipitation is now increasing, although the drivers remain unclear (21). Increased monsoon precipitation is consistent with increases in GHG emissions, which strengthen the hemispheric and land–sea temperature and moisture contrasts, shifting the monsoon northwards (23–25), and increase tropospheric humidity, which can lead to increased moisture fluxes and precipitation (26, 27). Aerosol reductions also cause the ITCZ to shift northwards, contributing to an increase in monsoon precipitation (28). Nevertheless, the inter-model uncertainty in changes in hemispheric temperatures and precipitation is large (29) and is mediated by changes in ocean circulation (30). Modes of Sea Surface temperature variability, such as the Atlantic Meridional Variability, can also be affected by changes in aerosol emissions and impact monsoon precipitation (31–34).
At regional scales, uncertainties in attributing monsoon trends arise because of large natural internal variability, nonlinearities in the response to forcing, and model biases (35). Attribution studies often rely on historical simulations where only one forcing agent, such as GHGs, varies with time. If a climate response depends linearly on forcing, the linear sum of single forcing experiments should reproduce the historical simulation. However, this is not the case for regional monsoon precipitation (17, 36). While the main driver of the trend can be identified, quantitative attribution is a challenge.
Rapid reductions in aerosol emissions in SSP1–2.6 result in larger increases in Asian summer monsoon precipitation in the near future (to 2050) in this scenario than in SSP2–4.5, SSP3–7.0, and SSP5–8.5 (here Asia encompasses the South, Southeast, and East Asian monsoons). This is despite the GHG decreases in SSP1–2.6 and continued GHG increases in SSP3–7.0 and SSP5–8.5, indicating that the scenario of aerosol emissions is most important in the near term (37). Regional variations in aerosol emissions are also important: SSP2–4.5 and SSP5–8.5 include continued increases in SO2 emissions over South Asia alongside decreases over East Asia. This dipole in Asian emission trends appears to further suppress future monsoon precipitation increases over South Asia relative to both SSP1–2.5, where emissions decrease in South and East Asia, and SSP3–7.0, where emissions increase in South and East Asia (37). This is due to interactions between the atmospheric response to the East and South Asian precipitation changes, which act to amplify the South Asian precipitation response (36).
Aerosol-driven trends in historical South Asian monsoon precipitation are more likely to emerge than GHG-driven trends (17). Nevertheless, natural internal variability is large and can obscure the forced signal for several decades (22). The differences in near-future precipitation between SSP3–7.0 and SSP1–2.6 are therefore still small relative to internal variability (Figure 3). Both scenarios result in warming throughout the tropics, which is larger in SSP3–7.0 everywhere except South and Northeast Asia. Both scenarios also show similar patterns of precipitation change, with increases in the African and Asian summer monsoon regions and the Pacific ITCZ being larger in SSP3–7.0, while the Asian and Pacific changes are largest in SSP1–2.6, hinting at a larger aerosol contribution to the near-future trends here.
Figure 3
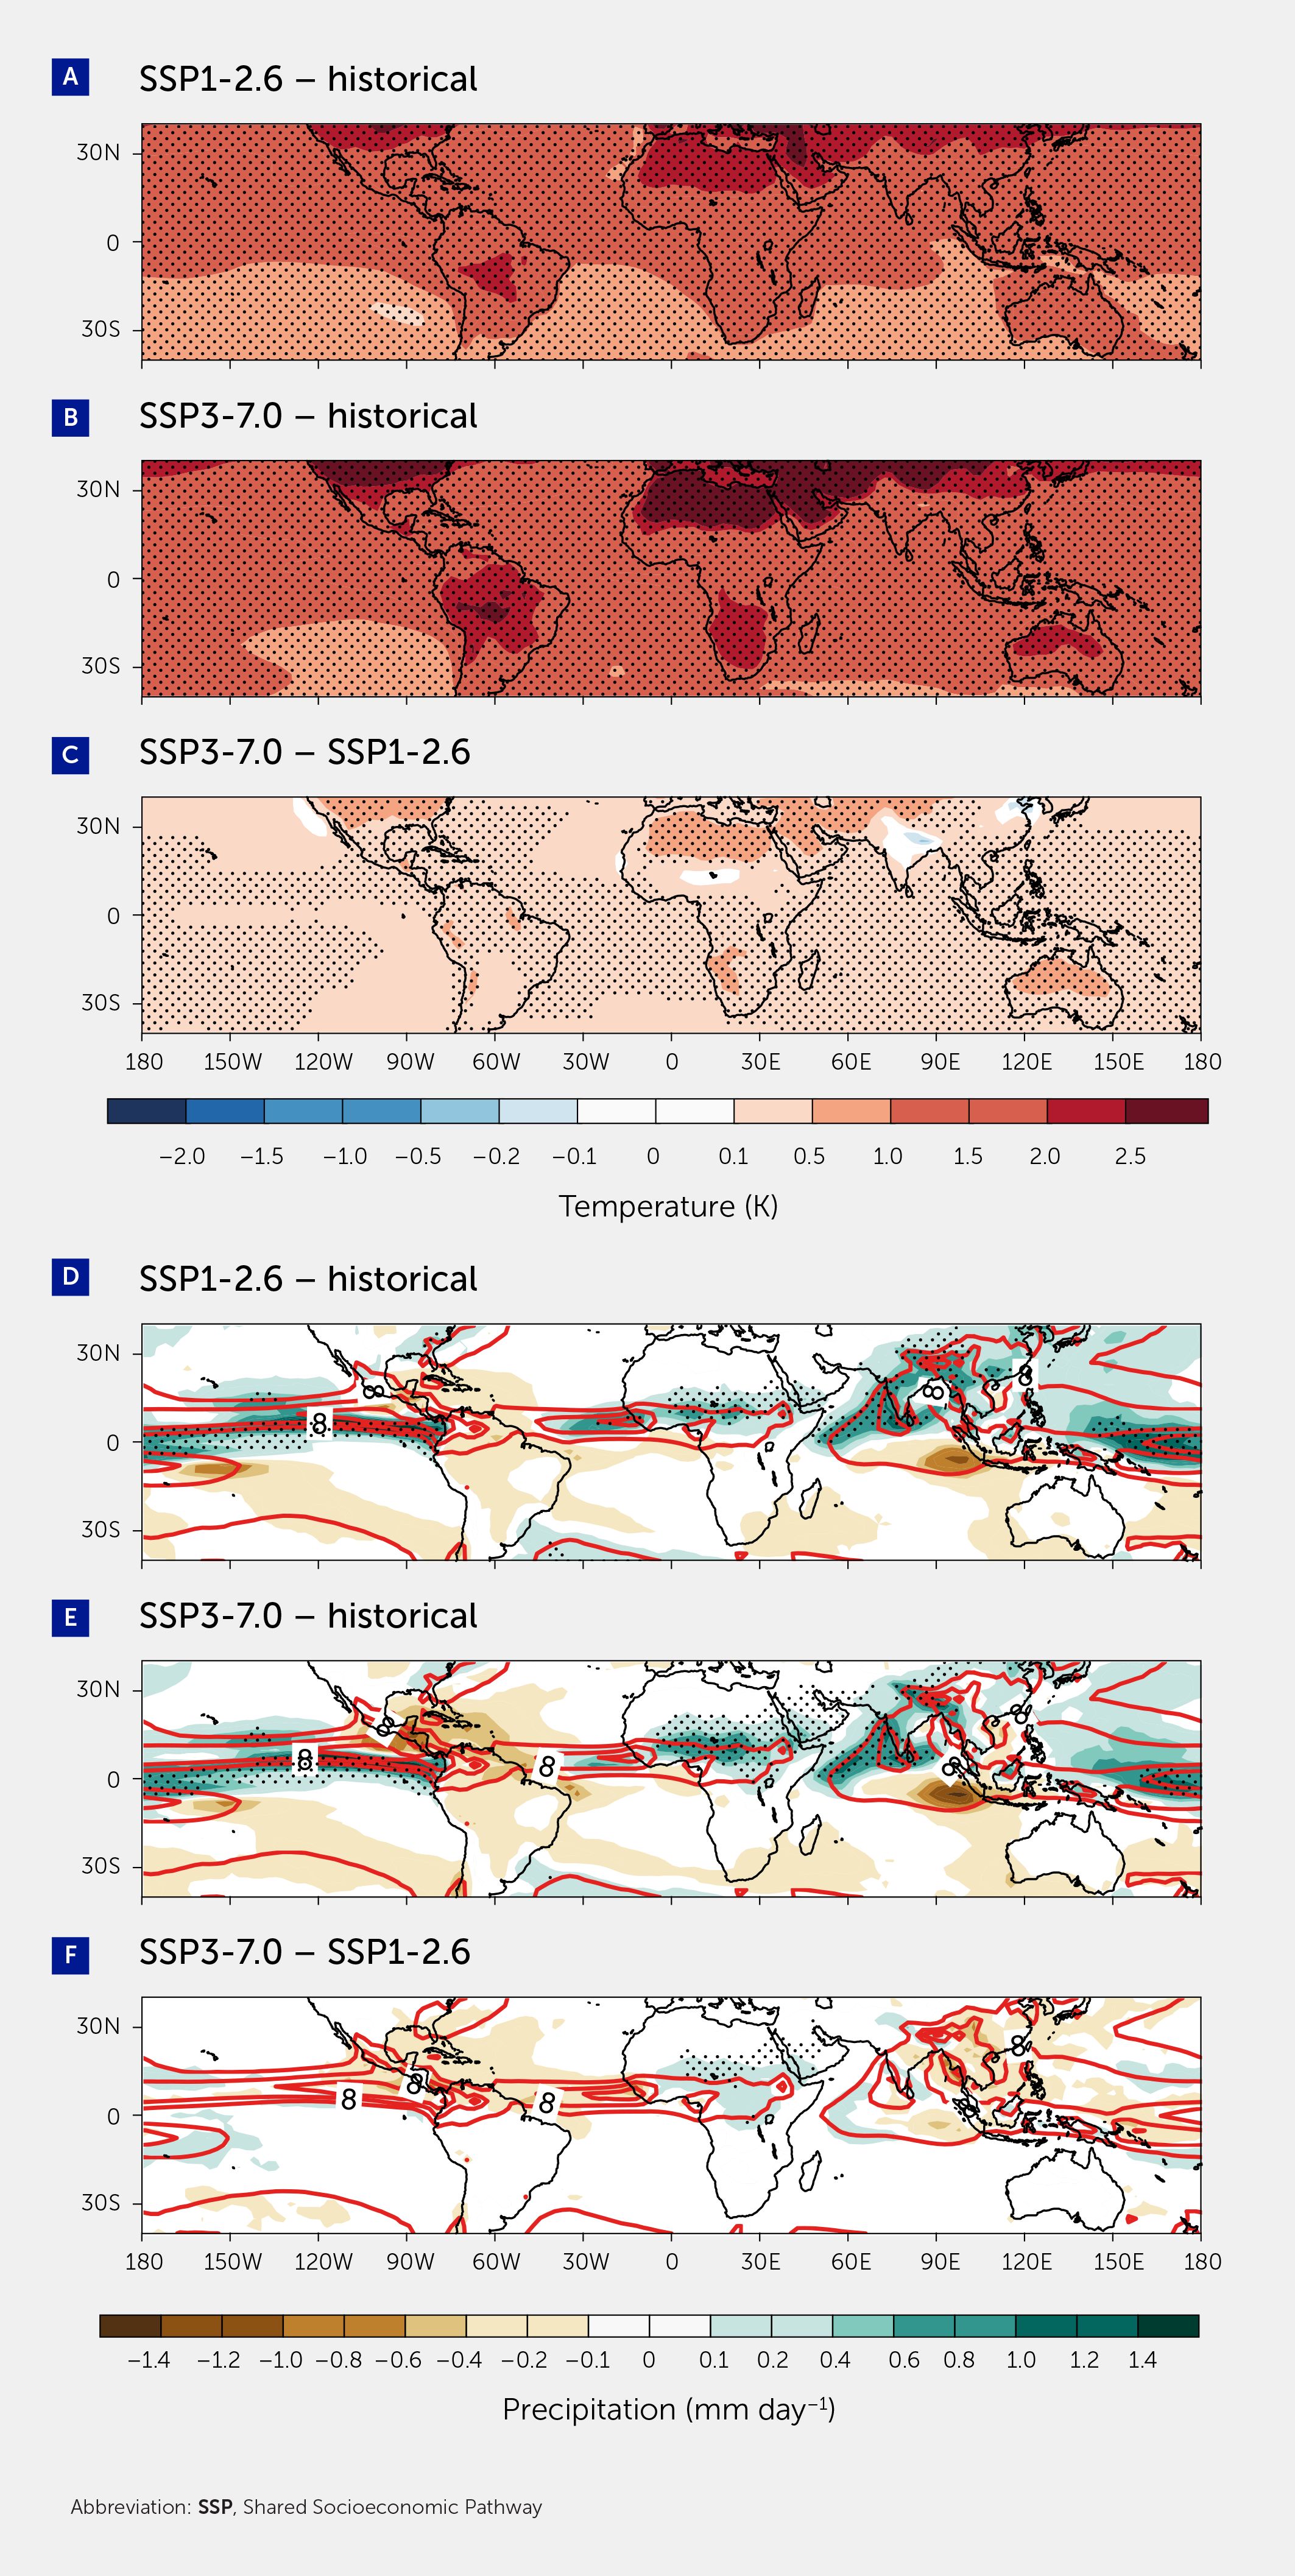
Figure 3 Near-surface June–September air temperature difference between present day conditions (1979–1999), (A) Shared Socioeconomic Pathway SSP1–2.6 (2035–2060), and (B) SSP3–7.0 (2035–2060). (C) is the difference between the responses in the two scenarios. (D–F) show the same for precipitation. Stippling (black dots) shows where the magnitude of the anomaly is greater than at least twice the internal variability for each grid point, based on the standard deviation of a 25-year running mean from the pre-industrial control simulations, which represent only natural internal climate variability. Red contours in (D–F) indicate the present day average June–September precipitation.
Despite progress in understanding the signal of monsoon changes against the background of natural internal climate variability, knowledge gaps remain. Climate models have long-standing biases in simulating mean monsoon precipitation and typically underestimate monsoon intensity and extent (17, 37, 38). These biases can prevent attribution of monsoon changes: even if models capture the observed mechanism underlying a precipitation change, they may not reproduce the precipitation change itself (35). As the relative position of regional forcing and regional circulation features is important for the circulation response to forcing, such biases may also limit our mechanistic understanding of precipitation trends. Large inter-model differences in monsoon climatology also contribute to differences in monsoon projections (39), although such a link over West Africa is unclear (40, 41). As for many climate projections, reduction in model biases is a priority.
Contrasting changes are expected in other monsoon regions, with increases in rainfall projected in some and decreases projected in others (42). In addition, changes in intraseasonal variability such as active-break cycles are possible. Monsoon systems have large impacts on societies, for example through floods, landslides, and agricultural production (43). Changing monsoons will change the risks of such hazards, with the potential to lead to reduced resilience and high vulnerability if adaptation actions are not taken.
Other tropical rainfall changes
Rainfall is crucial in the tropics to sustain Earth’s largest rainforest systems, thereby supporting biodiversity and global carbon uptake. One of the major processes driving changes in rainfall in these regions is the plant physiological effect, whereby enhanced CO2 causes stomata to open less, reducing evapotranspiration and the enhanced land versus ocean warming (44). These processes interact with the climatological circulation in different ways in different rainforest regions. Over New Guinea, for example, land-surface warming amplifies moisture convergence from the ocean and increases rainfall. In the Congo, no clear rainfall changes emerge as the land-surface warming effect is offset by migrations of rainfall. In Amazonia, the interaction of land-surface warming with the climatological circulation pattern leads to a precipitation-change dipole, with reduced rainfall in central and eastern Amazonia and increased rainfall in the west (45).
Single-model initial-condition large ensembles (SMILES) can be employed to better quantify the roles of forced and internal variability and to elucidate the impact of structural differences between models. They can be used to better quantify inter-ensemble spread (17) or to isolate the role of different forcing factors, such as aerosols (46). In addition to such ensembles, atmosphere-only model simulations can isolate forcings, such as the direct effect of CO2 or the impact of warming sea surface temperatures on monsoons (47, 48). Such changes may be decomposed into components that evolve on different time scales (6). These recent studies have revealed competing factors influencing dynamic atmospheric features that drive opposing trends in monsoon rainfall (e.g., in North Africa in the cited articles). Future changes in monsoon patterns are therefore uncertain, the net signal resulting from a balance of these opposing trends.
Midlatitude climate change
Storm tracks and jet streams
Seasonal storm tracks are a major part of the global atmospheric circulation and are associated with most of the climate variability in the midlatitudes via the storms or cyclones that they comprise. These weather systems are climate hazards that can bring loss of life and property damage through high winds, intense precipitation, or both. Most risks associated with midlatitude storms occur when the associated extreme weather features interact with areas of high population and/or infrastructure density. Damage is often worse when storm systems are associated with multiple (or compound) hazards, such as extreme wind and rain (49).
Models can represent most of the large-scale features of storm tracks and are improving through increases in spatial resolution, with models with spatial resolutions of 25–50 km being able to capture the most intense events (50–54). Nevertheless, persistent biases remain in terms of the strength of winds in different cyclone airstreams and the strength of the large-scale upper-level jet.
How storm tracks respond to climate change is uncertain. The IPCC 5th Assessment Report (10) concluded that a poleward shift of storm tracks is likely in the Southern Hemisphere; this is also observed to a greater extent in CMIP6 models with larger end-of-century warming (55). However, regional changes in the Northern Hemisphere are more uncertain (56). Storm-related precipitation is expected to increase, but future changes in wind strength are less clear (57), partly owing to methodological differences between studies. CMIP6 models of the most intense storms show robust increases in wind intensity under future climatic forcing using various metrics (55). This signal of increased intensity for the most damaging storms is also found using models with cloud-permitting resolutions (58). It is hypothesized that diabatic processes—which stimulate higher intensity cyclones—are resolved more realistically in high-resolution models than in coarser resolution ones (59, 60).
As model resolution increases, a recent study suggests the potential for a greater sensitivity of the storm tracks to warming (61). Complementing a high atmospheric resolution with a very high resolution 1/12°, “eddy-rich” ocean can provide a clearer signal of climate change in midlatitude storminess and precipitation. Such coupled high-resolution models project significantly greater future increases in east Atlantic storminess (62) and European precipitation than do simulations with a lower-resolution (¼°) ocean (63). This is due to the better representation of features associated with oceanic western boundary currents, such as the separation of the Gulf Stream from the eastern coast of the United States. Only in the eddy-rich resolutions has the Gulf Stream been found to separate correctly at Cape Hatteras (Figure 4). This separated Gulf Stream moves toward the coast under climate change, bringing the warm Gulf Stream waters closer to the cold continental air that appears critical for increasing future storminess and precipitation associated with Atlantic midlatitude storms.
Figure 4
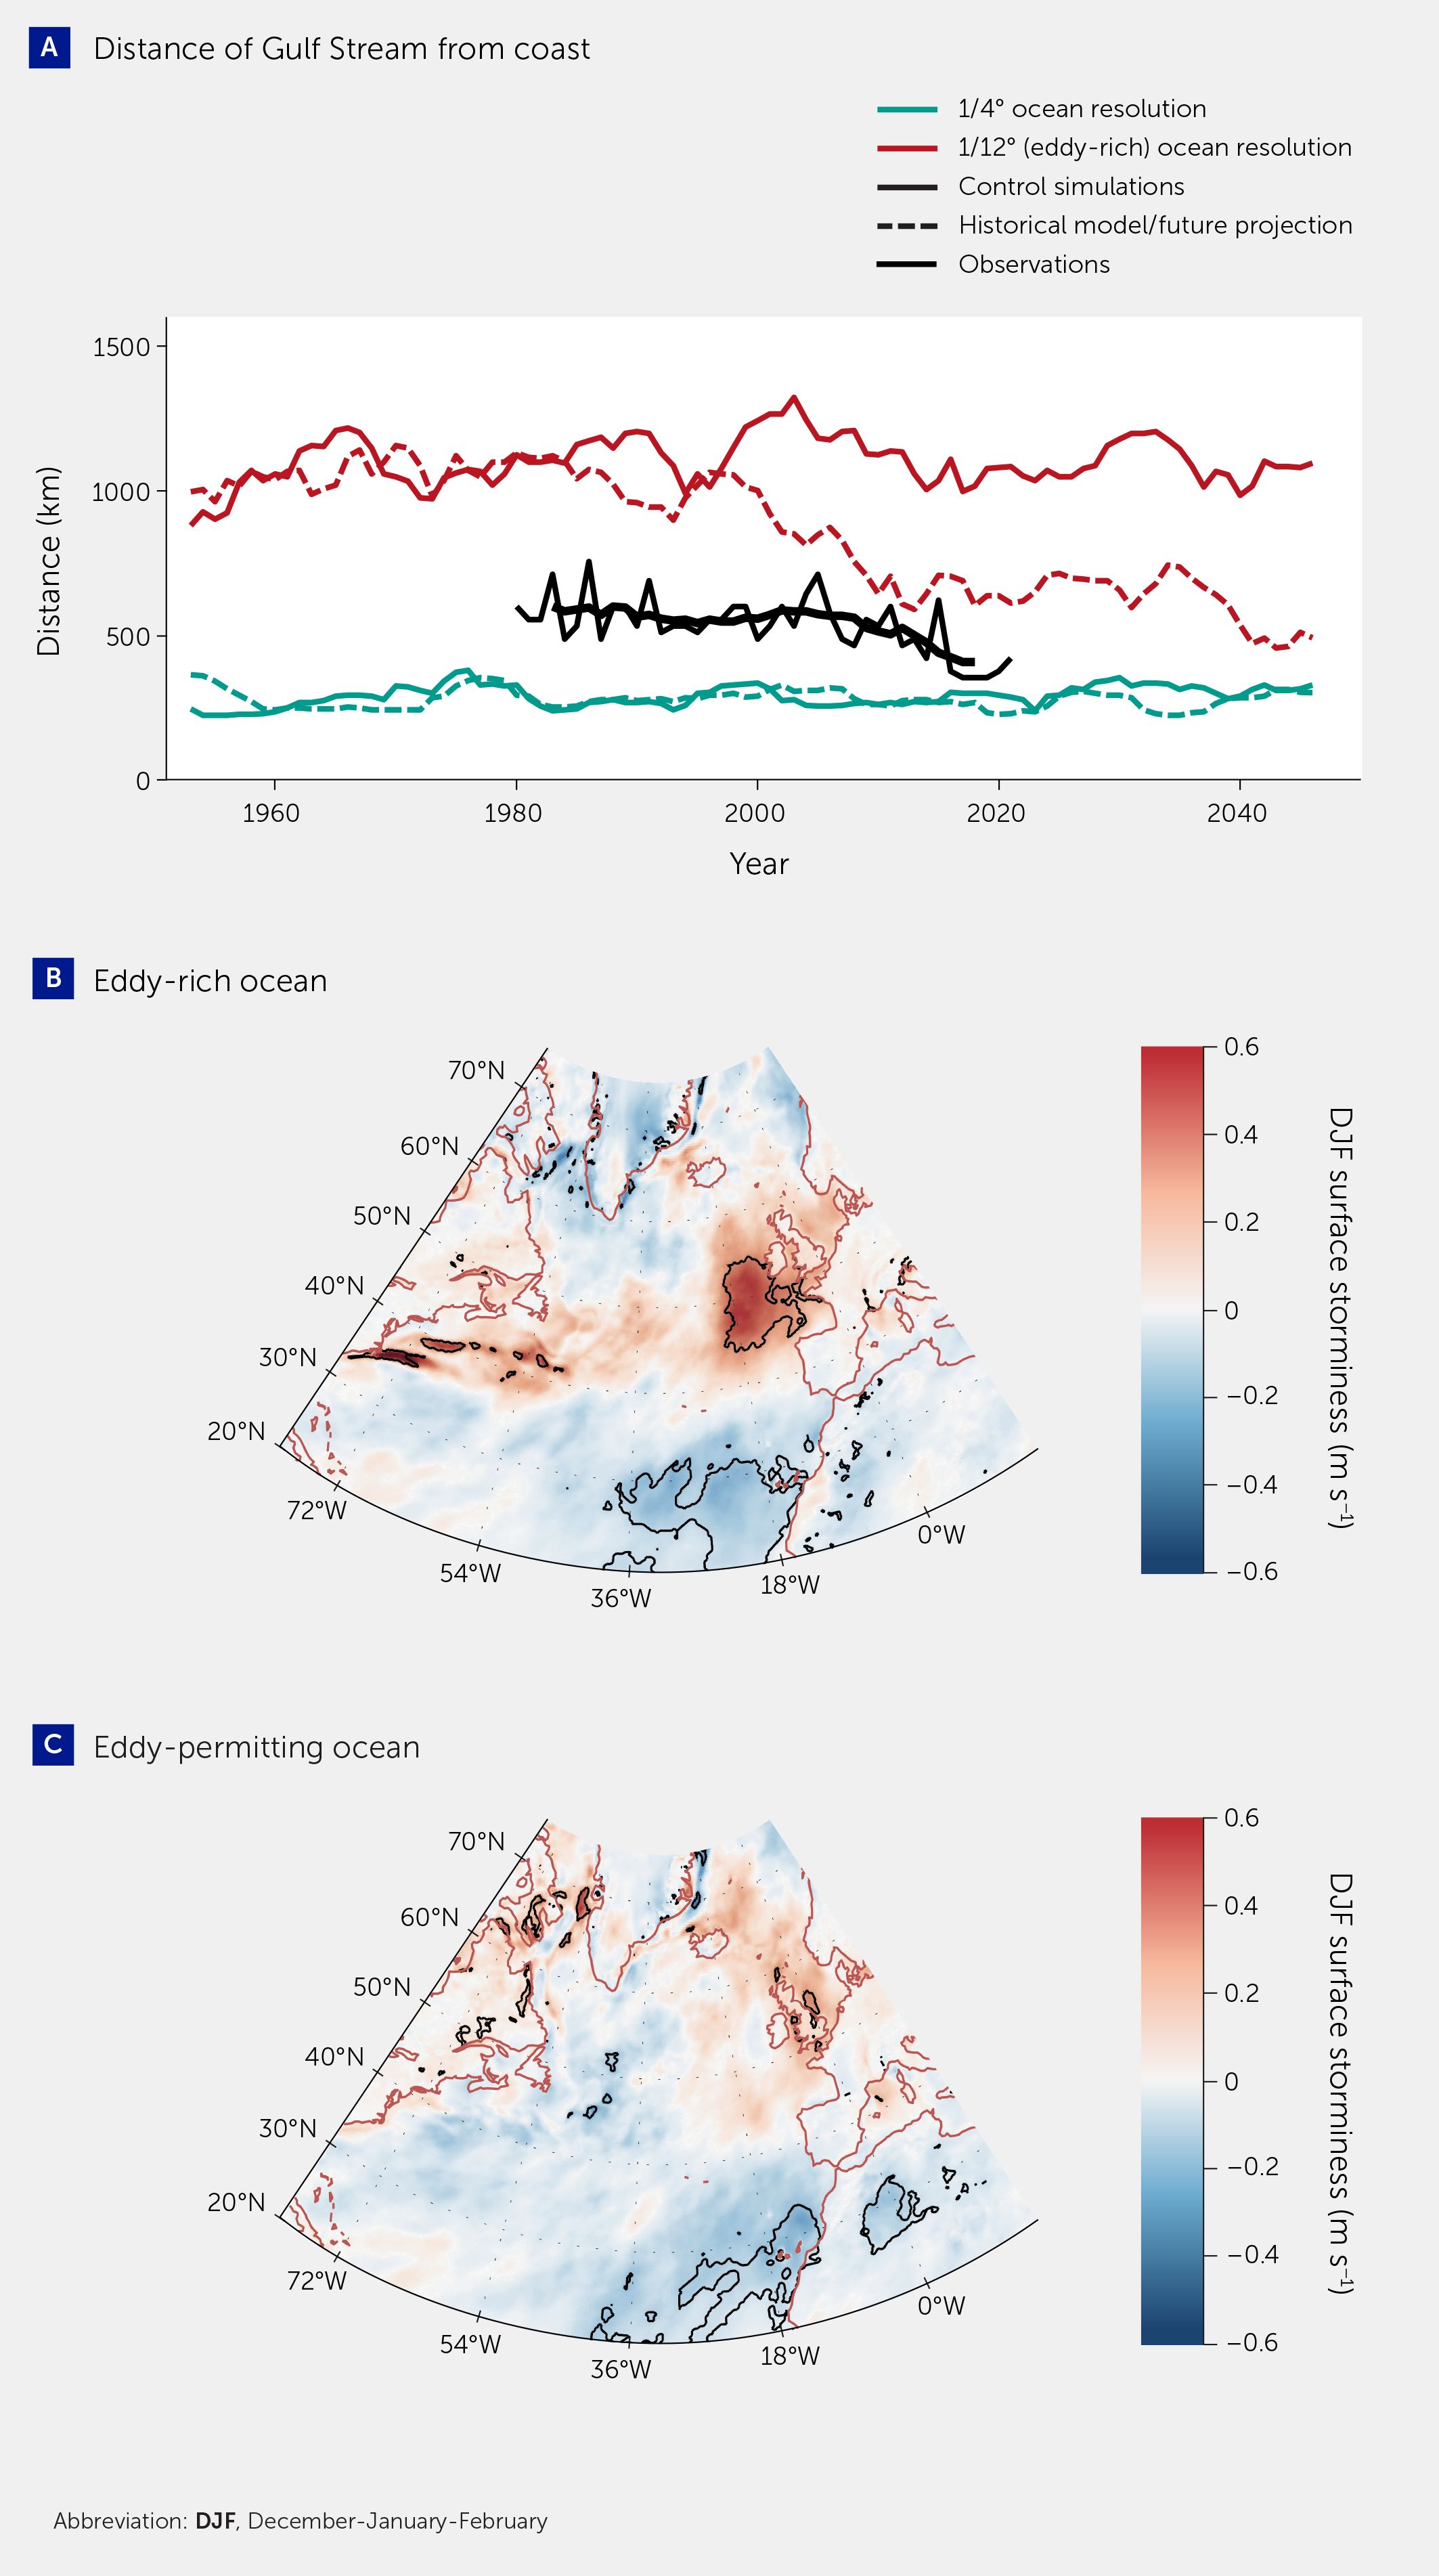
Figure 4 (A) Shows the modeled historical (1951–2014) and projected (2015–2050) Gulf Stream separation, measured by the distance of the maximum winter sea surface temperature from the United States coast at 37°N, according to 1/4° and 1/12° (eddy-rich) ocean resolutions. A 7-year running mean has been applied. The climate model is HadGEM3 3.1. Lower panels show projected change (2031–2050 minus 1950–1969) in December–February surface storminess in (B) eddy-rich projection and (C) eddy-permitting resolution [updated from (61)].
Changes in emissions of atmospheric aerosols have been found to influence storm tracks as well as monsoons. The Eurasian subtropical westerly jet (ESWJ) is a major feature of the summertime atmospheric circulation in the Northern Hemisphere. CMIP6 simulations suggest that the observed weakening of the ESWJ over the past four decades is likely driven by changes in aerosol forcing. Warming over mid-high latitudes due to aerosol reductions in Europe, and cooling in the tropics and subtropics due to aerosol increases over South and East Asia, reduced the meridional temperature gradient at the surface and in the lower and middle troposphere, leading to reduced vertical shear of the zonal wind and a weaker ESWJ in the upper troposphere. If Asian anthropogenic aerosol precursor emissions decline in the future there may be a renewed strengthening of the summer ESWJ (64).
Blocking anticyclones and summer heatwaves
Anticyclones, i.e., regions of high atmospheric pressure, are also a feature of midlatitude weather and often form blocking situations that can persist for many days (65) and cause prolonged heatwaves, especially in summer. While global warming over land is the main cause of shifting temperature distributions and increases in the frequency and intensity of heatwaves in the future, climate models can also be used to detect changes in blocking frequency and in the relationship between blocking intensity and heatwaves. Over Europe, for example, models show a small decrease in blocking frequency, implying a small decrease in blocking-related heatwaves. However, the relationship between blocking and heatwaves strengthens, offsetting this decrease. Models indicate that blocking frequency generally decreases over the main Atlantic and Pacific midlatitude storm track regions but increases over the Arctic Ocean and Greenland. However, these signals are generally small and can be hard to detect against the noise of natural variability (66). Improving the ability of models to simulate blocking events is still an active area of research.
Low-frequency climate variability
Low-frequency variability, i.e., anomalies that persist for more than one season, in atmospheric circulation in the Atlantic sector appears to be underrepresented even in the latest climate models (67–71). Similarly, signals of decadal change in and around the Atlantic sector appear to be underestimated in current climate predictions (72, 73). This means that uncertainty in multidecadal climate change around the Atlantic basin is also likely to be underestimated (74, 75) and multidecadal variations, for example in winter storminess, could be greater than estimated by current models.
Related to this is the question “how robust are current projections of ocean circulation changes and their impacts on midlatitude storms to an increase in model resolution?” Early experiments with higher resolution ocean models suggest the potential for greater decadal variability (76) and greater levels of climate change and climate variability (61, 63, 75) than found in lower resolution models. Atmospheric resolution may also play a role, as transient eddy feedback—crucial for maintaining storm tracks and amplifying changes—may increase at higher resolutions (77), further exacerbating trends beyond current predictions by lower resolution models.
Polar changes
Although geographically remote from major centers of human population, the polar regions are key centers of action for major aspects of the global climate system. The seas around Antarctica are a major regulator of global atmospheric concentrations of heat and CO2 (78), and changes in the seasonal ice cover and ocean density structure would have important effects on the climate worldwide. The Arctic is the most rapidly warming region of the planet (a phenomenon called Arctic amplification), and sea ice loss has been suggested to affect midlatitude weather systems and climatic conditions (79). Loss of polar ice sheets is the main source of uncertainty in estimates of future global sea level change.
Sea ice changes
The IPCC AR6 report concluded that the Arctic is likely to be practically free of sea ice in September at least once before 2050 under the five RCP scenarios considered, with more frequent occurrences for higher warming levels (3). Such changes are among the major feedbacks in the climate system that amplify polar warming and will lead to large impacts on both land and marine ecosystems. Arctic sea ice loss could also influence the weather in middle latitudes (see section “Connections from the polar regions to midlatitudes”).
However, the same report assigns low confidence to projections of Antarctic sea ice owing to uncertainties in the representation of key processes and our poor understanding of recent trends, which have shown large variability in sea ice extent. Nevertheless, CMIP6 models largely project loss of Antarctic sea ice by the end of the 21st century, with the forcing scenario playing a key role in this timescale. Antarctic sea ice loss is significantly reduced in strong mitigation scenarios such as SSP1–2.6 (80).
Relationships between historical Antarctic sea ice area (SIA) and future loss provide opportunities to reduce uncertainty in the future trajectory of the latter (81, 82). More detailed analysis techniques, such as deriving sea ice concentration budgets, can further segregate models based on the underlying physical processes as well as their projected ice cover. Some models in CMIP5 were able to capture the relative contributions of dynamics and thermodynamics to the development of the Antarctic sea ice winter maximum (83), improving confidence in model projections.
Shared process biases in all climate models, such as parameterized ocean processes due to low resolution (84) or lack of dynamic freshwater flux from the Antarctic Ice Sheet (85), may imply that all CMIP models exaggerate centennial-scale Antarctic sea ice loss. Comprehensive multi-model comparisons are required to determine the model and parameter sensitivities of the results. Better evidence on future sea ice changes at smaller spatial scales is crucial to elucidating the local and wider impacts, e.g., on ice shelves, ice sheets, and Antarctic ecosystems.
Precipitation in polar regions
CMIP6 models project a faster increase in Arctic precipitation throughout the century than earlier models (86). CMIP6 models also project that more of the precipitation will fall as rain rather than snow, with Arctic-wide reductions in snow and increases in rain occurring (especially in autumn) by the end of the century. This transition to a rainfall-dominated precipitation in the Arctic is therefore expected decades earlier than previously anticipated, driven by amplified Arctic warming and more open water and atmospheric moisture transport. Parts of the central Arctic are expected to transition one or two decades earlier than in CMIP5 models, even accounting for CMIP6 models with high equilibrium climate sensitivity (87). A transition to a rainfall-dominated Arctic would be less likely if global warming were limited to 1.5°C than 3°C (86).
The mass balance of the Antarctic Ice Sheet is particularly relevant to projections of future sea level. Precipitation over the Antarctic Ice Sheet is also likely to increase throughout this century, with projected increases of +27 to +70 mm year-1 (88). With this falling predominantly as snow, the resulting gain in ice sheet mass will partly offset sea level rise from other sources. As in the Arctic, however, more of this increased precipitation will fall as rainfall, which could reach 15.3% of the total precipitation for the entire Antarctic and 56.9% for the Antarctic Peninsula, potentially destabilizing floating ice shelves in affected regions (88).
Polar contributions to sea level changes
The West Antarctic Ice Sheet (WAIS) is losing ice and is the largest source of uncertainty in projections of future sea level (3). This ice loss is caused by changes in ocean melting of floating ice shelves in the region, but it is unclear why this melting has changed and whether this is driven by anthropogenic forcing. The warm (1°C) Circumpolar Deep Water melting the ice sheet has been buried in the deep ocean for centuries and has not simply warmed during the historical period (i.e., from pre-industrial times to today). However, the supply of this warm water towards the ice sheet is regulated by winds, and changes in winds across the shelf seas surrounding Antarctica may have accelerated melting. Climate model simulations contain historical westerly wind trends over the shelf break in the Amundsen Sea (89). An ocean model driven by these winds shows enhanced transport of warm water onto the shelf, resulting in increased melting of the WAIS (90). However, this is a region of extremely strong internal climate variability, linked to the tropical Pacific. Internally generated wind trends over the Amundsen Sea are of the same magnitude as those driven by external forcing, and so could substantially enhance or offset the anthropogenic trends (89). Paleoclimate reconstructions that better constrain the trajectory of historical variability (91) are therefore key to quantifying the role of anthropogenic forcing in sea level rise from the WAIS.
Circulation change
Projected changes in midlatitude tropospheric westerly jets and associated storm tracks are closely linked to polar amplification and projected changes in sea ice. As sea ice retreats under future warming scenarios, the lower-tropospheric meridional temperature gradients are reduced, which acts to weaken the jets and shift them equatorward (79). However, at upper levels (in the tropopause region) GHG-induced global warming increases the equator-to-pole meridional temperature gradients, which strengthens and shifts the jets poleward (92, 93). The latter effect is stronger in the Southern Hemisphere, with relatively weak low-level polar amplification and clear positive anomalies in zonal mean zonal wind at midlatitudes (Figure 5). In the Northern Hemisphere, strong Arctic amplification opposes the strengthening influence of upper-level change, leading to overall weaker wind changes than in the Southern Hemisphere.
Figure 5
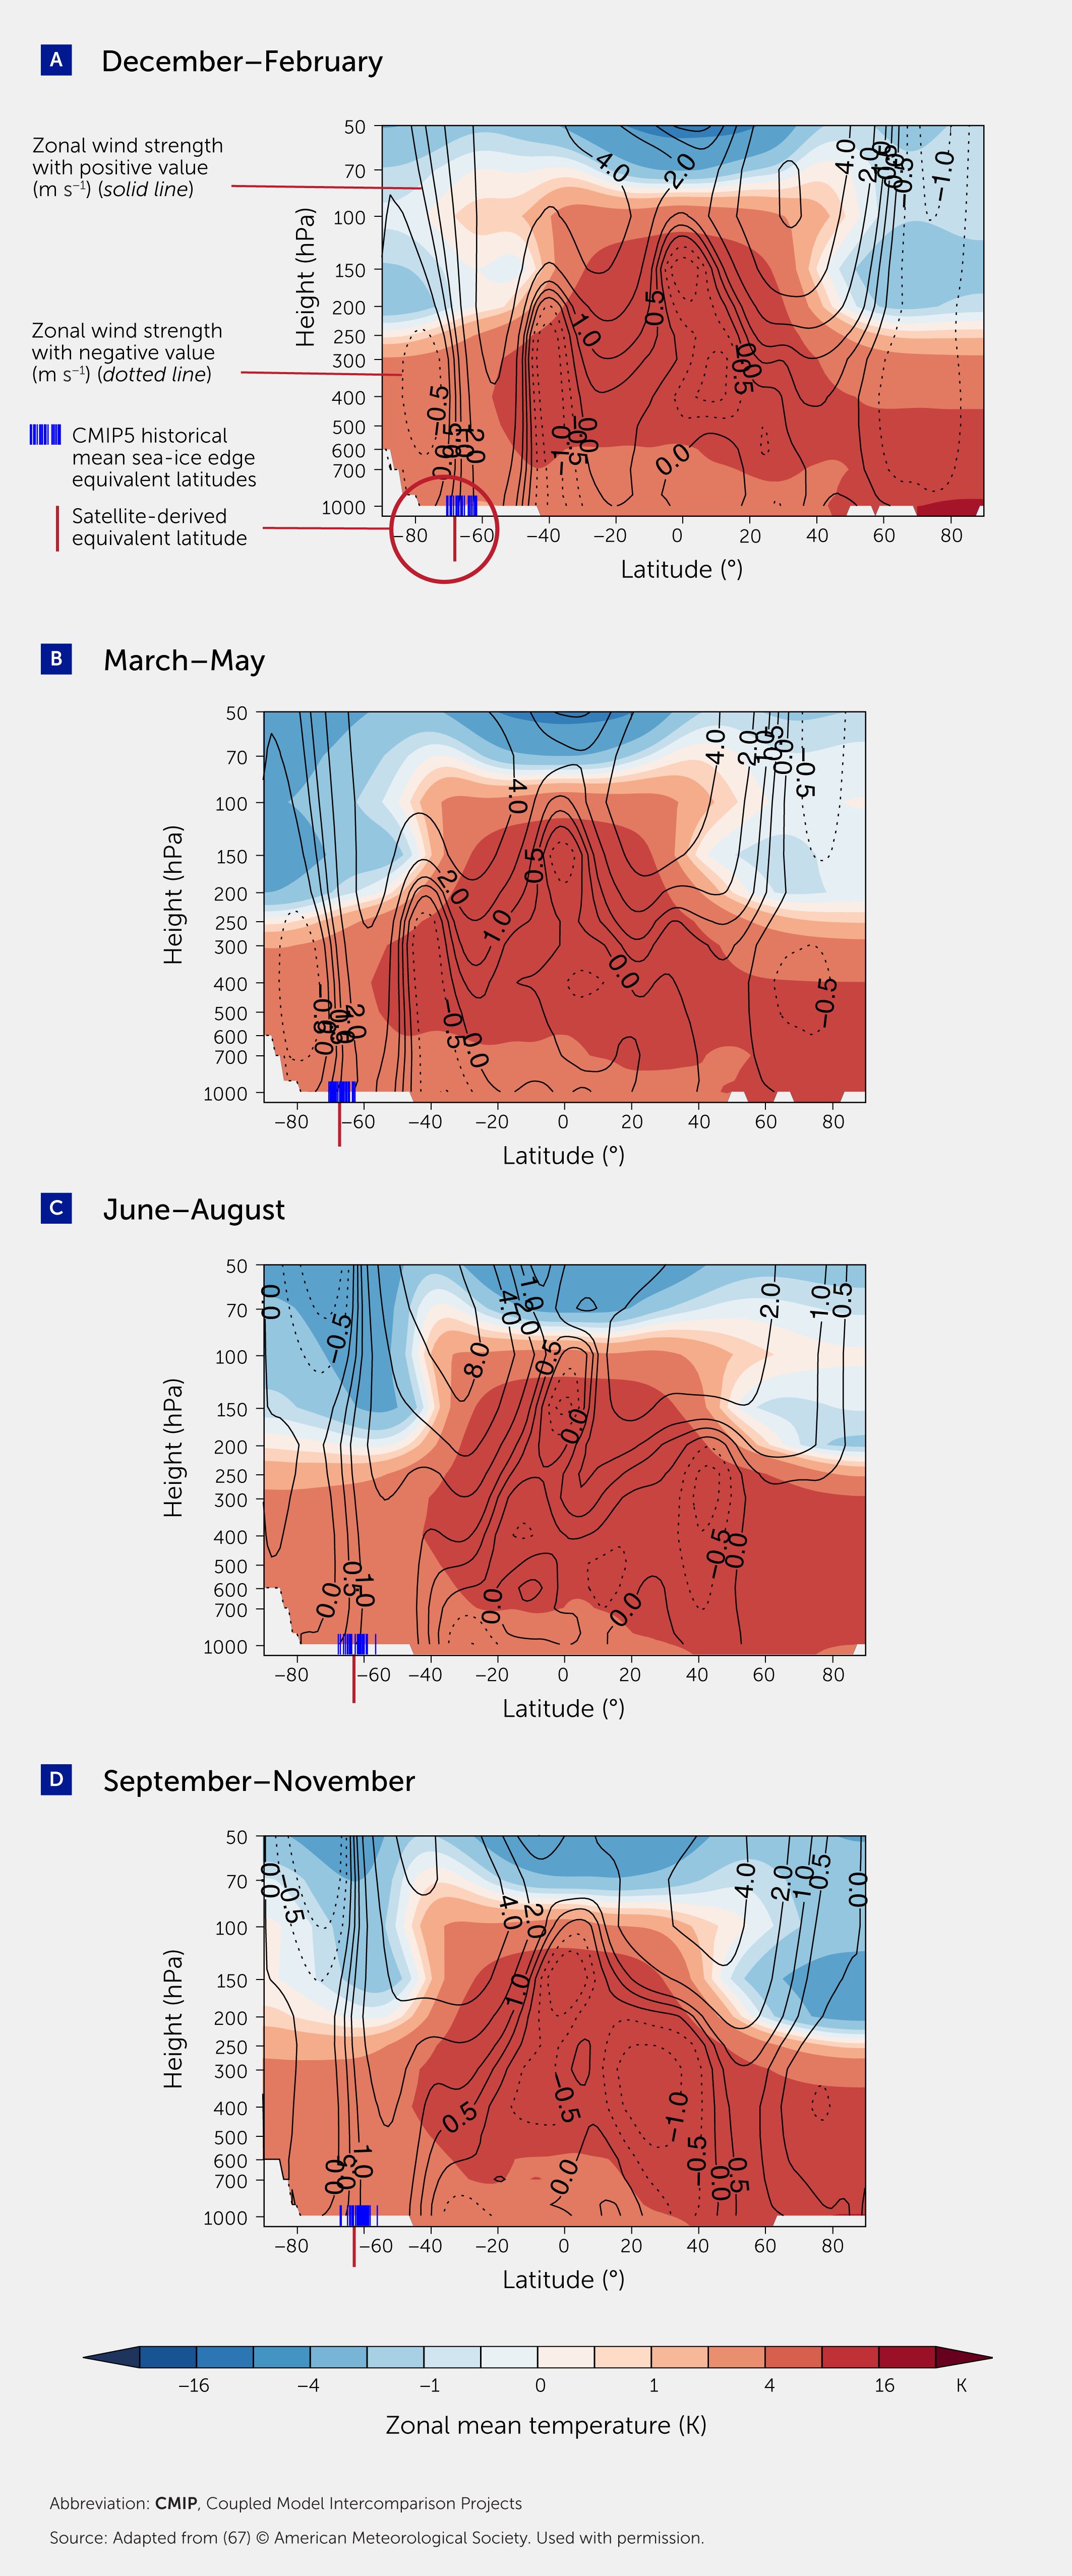
Figure 5 Projections of 21st century changes in zonal mean temperatures and zonal winds. Plots (A–D) show Coupled Model Intercomparison Projects (CMIP)-5 ensemble means of time-slice differences between 2070–2099 (representative concentration pathway 8.5 [representative concentration pathway 8.5 (RCP8.5) scenario]. The figure also shows CMIP5 historical mean sea ice edge equivalent latitudes and satellite-derived equivalent latitudes. Adapted from (67) with permission from © American Meteorological Society, where details of the CMIP5 models and methods are provided.
Climate models vary greatly in their projections of how much the jets and storm tracks strengthen and shift poleward under future warming scenarios (67, 92). Much of this inter-model diversity in projected strengthening is related to variations in the amount of sea ice retreat within different models: more retreat is associated with stronger polar amplification and a greater offset of the upper-level-induced jet strengthening (67, 93). Many climate models exhibit unrealistically large or small climatological sea ice extent under present-day climate forcing, which affects the realism of their projections (e.g., a model with very little sea ice in the present day is limited in the amount that can be lost under future warming). For the Southern Hemisphere, this has implications for the realism of projections of the westerly jet from these models, offering the potential for constraining projections (67).
Uncertainties in sea ice projections add to knowledge gaps in atmospheric circulation changes. Improved sea ice projections would help to provide more certain and/or realistic projections of storm tracks and winds at mid-high latitudes. A further challenge is that many climate models appear to underestimate the weakening and equatorward shift of the jet stream in response to Arctic (and potentially Antarctic) sea ice loss, with the observationally constrained estimate towards the upper end of the model range (79).
Teleconnections between climate system regions
Aspects of regional climate and climate change, including tropical rains, storm tracks, and polar regions, do not evolve independently. Strong connections, known as teleconnections, often exist between regions owing to the dynamic nature of the atmosphere and ocean. These causal connections or correlations between climate phenomena can occur across great distances, e.g., from the tropics to the midlatitudes or across different ocean basins. The many teleconnection pathways that exist in the atmosphere and ocean include tropospheric Rossby Waves, stratosphere-troposphere coupling, and large-scale ocean circulations such as the Atlantic Meridional Overturning Circulation. Here we focus on two such pathways.
Connections from the tropics to midlatitudes
The El Niño Southern Oscillation (ENSO) is a major driver of global teleconnection patterns. ENSO is expected to become more extreme and more frequent in the future, as measured by the frequency by which rainfall shifts into the tropical east Pacific. According to projections, the signal of this change may emerge by the 2040s under all SSP scenarios. This date is uncertain, however, owing to substantial background variability in ENSO (94). Present-day ENSO impacts temperature, rainfall, and atmospheric circulation and increases the risk of phenomena such as wildfires around the tropics and toward midlatitude and polar regions. However, there is little agreement between models on the magnitude and even sign of such changes in ENSO impacts (95).
Midlatitude storms and storm tracks are strongly influenced by remote climate variations in the tropics. Tropical convective diabatic heating influences climate, weather, and storm patterns in the midlatitudes through the triggering of quasi-stationary Rossby waves (96, 97). Numerous teleconnections from the tropics appear to strengthen under future climate scenarios, potentially increasing the impact of tropical changes on midlatitude climate (e.g., via the ENSO (98), Madden Julian Oscillation (99), or Quasi-Biennial Oscillation (100)) and producing a more variable winter storm track in future. Indeed, recent decades have seen an increase in the year-to-year variability of the winter atmospheric circulation between very westerly winters conducive to extreme storms and easterly winters associated with reduced storm activity (101).
Shifts in tropical rainfall variability might also trigger changes in teleconnections. CMIP6 models consistently predict that the positive temperature anomalies over Alaska and northern North America associated with present-day El Niño events are much weaker, or of the opposite sign, under a quadrupling of CO2 (Figure 6) (102, 103). According to a barotropic model, the projected eastward shift of ENSO precipitation, rather than the increase in its magnitude, is the main driver of the temperature teleconnection change.
Figure 6
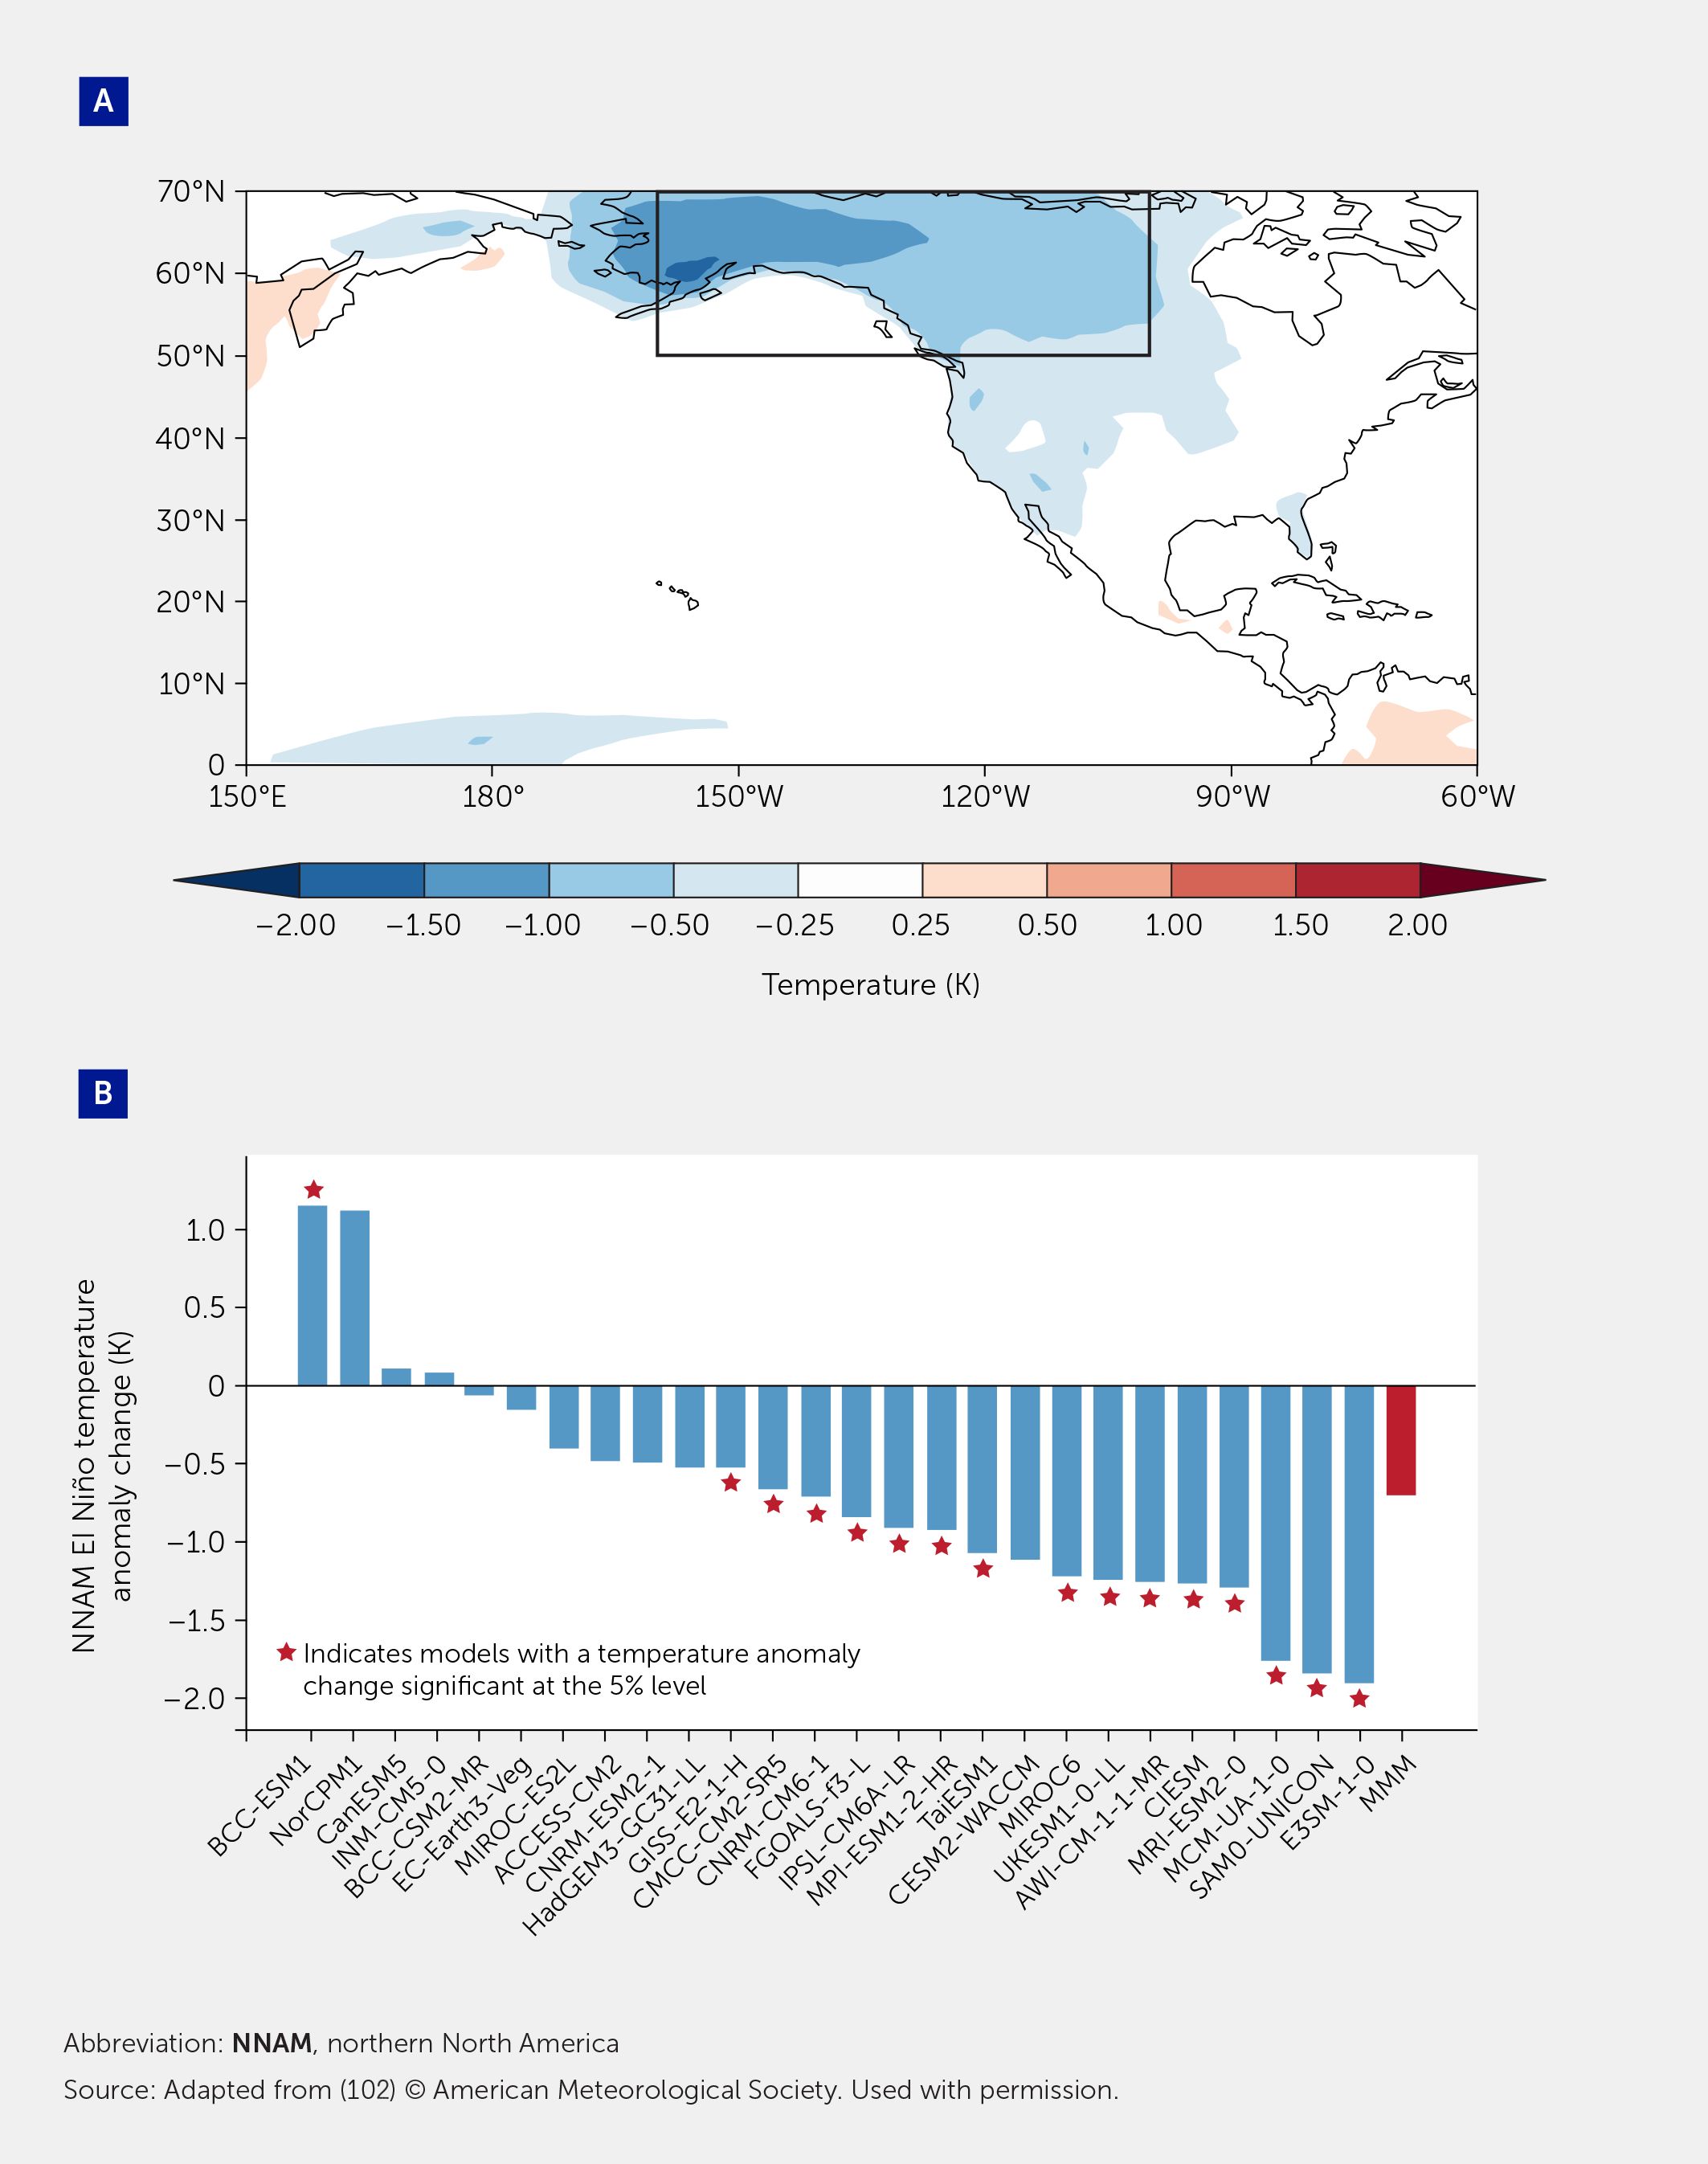
Figure 6 Changes in El Niño Southern Oscillation (ENSO) teleconnections. (A) Multimodel mean (MMM) abrupt-4×CO2 minus piControl surface temperature anomaly in El Niño years. (B) Change in surface temperature anomaly averaged over the northern North America (NNAM) region [boxed in (A)] for each Coupled Model Intercomparison Projects (CMIP)-6 model and the MMM. In the abrupt-4×CO2 simulations, the positive El Niño temperature anomalies are weaker in almost all models across much of northern North America. The models in (B) are arranged from positive to negative temperature anomaly change, with red stars indicating models with a temperature anomaly change significant at the 5% level. Adapted from (102) with permission from © American Meteorological Society.
Thanks to a recent methodological advance, the response of the Northern Hemisphere winter atmospheric circulation can be modeled as a series of reactions to variations in tropical precipitation (104). For example, anomalous tropical rainfall in the eastern Indian Ocean and the Maritime Continent reveals a robust teleconnection pattern across the whole of the Northern Hemisphere mid-latitudes that appears after around 2 weeks of precipitation forcing. This pattern is due to the excitation of Rossby waves, which propagate along a waveguide determined by the large-scale atmospheric circulation in midlatitudes. The pattern is largely the same for both forcing regions considered but is sensitive to the model representation of the waveguide.
Connections from the polar regions to midlatitudes
What happens at the poles does not stay at the poles. While this common trope is undoubtedly true, our knowledge of how polar climate change affects lower latitude climate and extreme weather is imprecise. Consensus on the lower-latitude effects of amplified Arctic warming has been hampered in part by apparent discrepancies between models (105) and between observations and models (106), with models suggesting weaker effects than implied from statistical analyses of observations. In recent years, progress has been made in reconciling observations and models in two ways. First, updated observational records show a weaker relationship between Arctic change and midlatitude weather (79, 107), highlighting that large internal variability hinders quantification of the causal links over relatively short observed records (108–110). Second, new coordinated model experiments (111) have facilitated a better estimate of the large-scale circulation response to Arctic sea ice loss and its robustness across models (79).
Many models appear to underestimate the weakening and southward shift of the jet stream in response to Arctic sea ice loss, with the observationally constrained estimate towards the upper end of the model range. Thus, a downward adjustment of the observed estimate and an upward adjustment of the model estimate align the two and suggest a robust but weak effect (79). The large-scale circulation response to Arctic sea ice loss is likely weak compared to interannual variability. Nevertheless, it may still explain a non-negligible component of future atmospheric circulation trends (79, 112) given that sea ice is projected to continue to sharply decline.
Extremes and hazardous climate change
A hazardous event is one that has the potential to cause damage to some part of society or the physical natural environment. Weather and climate hazards include temperature extremes (e.g., heatwaves and cold surges), hydrological extremes (e.g., heavy rainfall and droughts), and extra-tropical storms and tropical cyclones, along with associated storm surges. Their potentially disastrous impact on society is proportionate to the intensity of the event and may exceed the adaptation capacity for some event types. We need to start considering these extreme hazards more seriously to prevent serious socioeconomic damage, for instance to our health systems (113).
Understanding the current likelihood of hazardous events is vital. Extreme heat events already occur regularly—such as the heatwaves in June 2021 that broke local temperature records by over 4°C in western North America (114) and the one in July 2022 that delivered the first temperatures exceeding 40°C in the United Kingdom. Extreme rainfall events are also increasing, such as those which led to the devastating floods in Pakistan in 2022. While many regions have experienced extreme events, others have not, so they may be more susceptible to the impacts due to lack of preparation.
Observational estimates of the likelihood and intensity of extreme events are limited by the length of historical records. Moreover, in a non-stationary climate, the use of early observations must account for the evolving global warming signal (115). Observed past extremes can inform about conditions leading to record-breaking extremes (116), yet observations alone are not sufficient to sample possible temperature extremes. This problem is exacerbated when we try to calculate the chances of extreme events that lie, by definition, in the tails of event distributions and therefore change in frequency more quickly than moderate events. New techniques to calculate the current chances of extreme hazards have therefore been developed in recent years using large ensembles of climate simulations (117). For instance, thousands of seasonal simulations of United Kingdom winters may be used to calculate the chances of unprecedented extreme rainfall—e.g., through estimation of extreme winter rainfall levels out to the 100-year return period and beyond. This technique has been applied to the intensity and frequency of other regional-specific extremes, including Indian monsoon rainfall (118), local rainfall trends (119), and summer heatwaves (120, 121). It has also been extended to non-meteorological impacts, such as effects on crop yields (122). This approach offers much promise in providing scenarios to contingency planners in many areas to allow planning for reasonable worst-case scenarios for impending extreme events that are already being affected by climate change.
Heatwaves
Record-shattering extremes are projected to increase over the next century in both frequency and magnitude (123). Changes in temperature extremes emerge shortly after changes in the mean climate state; such signals are already detectable in many regions, including Asia, West Africa, and many parts of Europe (124, 125). However, regional variations may exist—for instance, under the high-emission SSP5–8.5 scenario, heatwaves are expected to emerge across the western United States and Great Lakes regions during the 2020–2030 decade, while similar events may not emerge before 2050–2070 in the northern and southern Great Plains (126). Notably, while heatwaves require the correct configuration of atmospheric circulation (120), regional effects (such as changes in land surface usage and cover) can influence their evolution (127). The heatwave that occurred in the United Kingdom in 2018 is now around 12-fold more likely than it was in the mid-20th century, and its rate of occurrence is increasing nonlinearly with time (120).
Nevertheless, some studies show that the change in extremes is occurring at the same rate as the climatological mean shift (128). Globally, it is estimated that 1-in-20-year heatwave events in the current climate will increase in frequency by 130% and 340% at the target warming levels of 1.5°C and 2.0°C, respectively (129). These changes and their implications could even be underestimated, as some climate models show unrealistic variability owing to poorly represented land-atmosphere processes. Selecting the most realistic models leads to higher estimates of heatwave increases in many parts of tropical and subtropical areas (130). Furthermore, many recent extreme heat events have been accompanied by fire, which may impact carbon uptake by vegetation and presents a risk on its own.
Heat and humidity
Many countries, especially in tropical and sub-tropical areas, face threats from combined hot and humid conditions in parallel to increased dry-bulb temperatures. These threats include disruption to food systems, water and sanitation, and animal and human health. High temperature and humidity in the atmosphere can result in heat stress in the human body that can exacerbate medical conditions such as asthma and chronic obstructive pulmonary disease (131, 132). Many weather services use humid heat warning systems, although other national heatwave plans do not (133). At present, the correlation of heat-related mortality is highest with dry heat events in Asia and Australia (134). Similar results had previously been found for other regions (135, 136), but recent research suggests that a temperature metric that incorporates humidity and wind speed correlates better with mortality outcomes in Europe (134). Humid heat stress poses particular occupational health risks to outdoor workers (137). For wet-bulb temperature (a measurement of heat that includes moisture), SSP5–8.5 could lead to deadly conditions in India by the end of the century, where mitigation capacity is limited and the population greatly relies on outdoor agricultural labor (138). Even under a more moderate scenario (SSP2–4.5), 55% of the Indian population is projected to experience severe dangerous conditions by 2100, versus 15% currently. Meanwhile, extreme wet-bulb temperature events have already occurred in countries like Pakistan (139). Statistical relationships between humid heat and work ability are stronger (140) and may have previously been understated, especially for outdoor work (141). This raises the possibility that heat stress in crops could be compounded by late harvesting due to human heat stress (137). Many countries have not yet experienced statistically plausible extreme heat, and those countries with increasing populations combined with statistically low current records are most at risk (142). These regions are less likely to have adequate levels of preparedness, and thus are more susceptible to the impacts of extreme heat. Hence, future change in heat is a key factor driving the impacts of climate change.
Droughts
Droughts have significant impacts on agriculture, food, availability of drinking water, and the health of humans and animals. Droughts can arise from deficits in rainfall, enhanced evaporation from soils, or man-made abstraction. Quantifying the emergence of impacts related to the hydrological cycle has proved problematic given inter-model differences in the spatial pattern of projected trends and the range of precipitation trends obtained using different methods (143). However, there is more agreement regarding future increases in wet extremes than in mean changes (143). The issue of model bias in drought projections may be partially solved by looking at the emergence of significant changes in “aridity” (precipitation divided by potential evapotranspiration)—a quantity related to soil dryness. In a set of bias-corrected model projections, restricting global mean temperature changes to 1.5°C above pre-industrial conditions rather than 2°C significantly reduces the area and number of people exposed to significant aridification: for instance, fewer people would experience a climate shift from semi-arid to arid or very dry conditions, with fewer impacts on water supply and agriculture (144). This adds to the evidence that even small reductions in global temperature change could have sizeable effects on many millions of people.
Tropical cyclones
At the extreme end of precipitation hazards are tropical cyclones, which are also associated with many other hazards, including extreme winds and storm surges. As global temperatures rise, tropical cyclone risk is also projected to increase in multiple regions and across multiple related hazards. A recent expert assessment of relevant tropical cyclone research suggests that at a global 2°C warming, higher storm inundation levels driven by sea level rise and increased precipitation rates (~14% globally) are likely, increasing the risk of coastal and surface flooding. The intensity of tropical cyclones is also projected to increase (averaged globally), with modeling suggesting a 5% (1–10%) increase in lifetime maximum surface wind speeds accompanied by a 13% increase in the proportion of cyclones developing into very intense (category 4–5) events (145). One recent study evaluated future changes in population exposure to a storm-surge event of the same scale as Super Cyclone Ampham, which resulted in surges of 2–4 m along the Indian and Bangladeshi coastlines in 2020. Under a high emissions scenario (SSP5–8.5), it projected a >200% increase in exposure to extreme storm surge flooding (>3 m) in India and an >80% increase for low-level flooding (>0.1 m) in Bangladesh. Even under a low emissions scenario (SSP1–2.6), India showed a >50% increase in flood exposure (146).
From hazards to risks to climate action
The recent research findings described above mainly address changes in the probability of different climate hazards. To properly translate hazard analysis into risk analysis also requires evaluation of vulnerability and exposure, and many of the impacts of these events are multi-faceted. For instance, the health impacts of heat depend not only on atmospheric conditions, but also on human behavior and physiology and on the built environment (147). Similarly, damage and human impact from tropical cyclones are a product of relevant socioeconomic and behavioral patterns, demographics, disaster planning, and governance, as well as the physical climate event itself (148, 149).
Consider the global impacts of changes in heat extremes: the ability of 1 billion people to work outdoors will be affected by hot-humid conditions if global warming reaches 2.5°C (150), while 100 million people could be exposed each year to deadly conditions if global warming reaches 3°C (151). As agricultural labor is seasonal, considering only annual averages can lead to an under-estimation of the impact of hot-humid conditions on agriculture (137). These studies, among many others, show how increases in humid heat associated with global climate change can severely affect populations relying on outdoor labor, with a triple threat to health, productivity, and food security.
A more comprehensive assessment of hazards, risks, vulnerability, and resilience would allow governments, citizens, and businesses to take the actions they need to adapt to future climate change in conjunction with the implementation of strong mitigation measures to limit GHG emissions.
Knowledge gaps and priorities for future research
The climate projections discussed here are important for several scientific and policy reasons.
Adaptation to existing climate variability and change, and to further changes in the near future, is a recognized urgent priority of the United Nations Framework Convention on Climate Change (UNFCCC). Climate hazards are also a key risk to be managed under the Sendai Framework for Disaster Risk Reduction (152). Adaptation and risk management must be based on the most up-to-date information about current and future climate changes, as described here. However, we need to go further to understand risks to human and natural systems and the resilience and vulnerability of those systems, communities, and countries to ultimately implement a plan of action to increase resilience and reduce vulnerability. We address risk in several sections above but need to go further if our work on climate hazards is to have an impact. Uncertainties in predictions and projections must be accounted for but cannot be a barrier to action.
Much of the scientific focus on mitigation has been on the sensitivity of the global climate to increases in GHGs and other forcing agents. However, global changes are the sum of regional feedbacks. In the case of the equilibrium climate sensitivity (ECS), these include cloud feedbacks, surface albedo changes (especially in polar regions), and vertical temperature lapse rate and water vapor feedbacks. Understanding and quantifying changes in the phenomena discussed in this article is key for constraining the ECS. Much work in this area has moved from global to regional scale processes (153).
Another key piece of global feedback on the problem of mitigation is the sensitivity of the carbon cycle to global warming. Anthropogenic CO2 emissions add to the natural cycle of CO2 sources and sinks, and regional climate changes can disrupt the cycling between those sources. A key risk is in tropical rainfall regions, which may switch from a sink to a source (154). As for the ECS, understanding regional climate change, particularly in the tropics, is an important component of constraining carbon budgets and in determining emissions to limit warming (155).
Finally, understanding how our complex climate system works and predicting its variations and how it might change under the influence of factors, such as increasing GHGs or a change in orbital conditions (palaeoclimates), is one of the great modern scientific endeavors. We modestly suggest it is on the scale of understanding the structure of the universe, or particle physics, or understanding the human brain. It is a great achievement, for example, that we can write down equations for the climate system, solve those equations on a supercomputer, and produce a model resembling the real climate system we observe. Building on this achievement, the research described in this article is at the cutting edge of science for policy.
Acknowledgements
We acknowledge the World Climate Research Programme, which, through its Working Group on Coupled Modelling, coordinated and promoted CMIP6. We thank the climate modeling groups for producing and making available their model output, the Earth System Grid Federation (ESGF) for archiving the data and providing access, and the multiple funding agencies who support CMIP6 and ESGF.
Statements
Author contributions
All authors listed have made a substantial, direct, and intellectual contribution to the work and approved it for publication. All authors have contributed as such: Writing – original draft, Writing – review & editing, Conceptualization, Data curation, Formal analysis, Funding acquisition, Investigation, Methodology, Project administration, Resources, Software, Supervision, Validation, Visualization.
Data availability statement
Publicly available datasets were analyzed in this study. This data can be found here: https://esgf-node.llnl.gov/projects/cmip6/.
Funding
The author(s) declare financial support was received for the research, authorship, and/or publication of this article. This paper is largely based on the results of two grants from the UK Natural Environment Research Council—Robust Spatial Projections of Real-World Climate Change, NE/N018486/1 and Emergence of Climate Hazards, NE/S004645/1. The funder was not involved in the study design, collection, analysis, interpretation of data, the writing of this article, or the decision to submit it for publication.
Conflict of interest
The authors declare that the research was conducted in the absence of financial relationships that could be construed as a potential conflict of interest.
The reviewer S-PX declared a past co-authorship with the authors AS, PH to the handling editor.
The authors MC, DM, P-AM, and VK declared that they were an editorial board member of Frontiers, at the time of submission. This had no impact on the peer review process and the final decision.
Publisher’s note
All claims expressed in this article are solely those of the authors and do not necessarily represent those of their affiliated organizations, or those of the publisher, the editors and the reviewers. Any product that may be evaluated in this article, or claim that may be made by its manufacturer, is not guaranteed or endorsed by the publisher.
References
1. Allen MR, Friedlingstein P, Girardin CAJ, Jenkins S, Malhi Y, Mitchell-Larson E, et al. Net zero: science, origins, and implications. Annu Rev Environ Resour (2022) 47(1):849–87. doi: 10.1146/annurev-environ-112320-105050
2. MacDougall AH, Frölicher TL, Jones CD, Rogelj J, Matthews HD, Zickfeld K, et al. Is there warming in the pipeline? A multi-model analysis of the Zero Emissions Commitment from CO2. Biogeosciences (2020) 17(11):2987–3016. doi: 10.5194/bg-17-2987-2020
3. IPCC Climate Change 2021: the physical science basis. Contribution of working group I to the sixth assessment report of the Intergovernmental Panel on Climate Change. Climate Change. Cambridge: Cambridge University Press (2021).
4. Eyring V, Bony S, Meehl GA, Senior CA, Stevens B, Stouffer RJ, et al. Overview of the Coupled Model Intercomparison Project Phase 6 (CMIP6) experimental design and organization. Geosci Model Dev (2016) 9(5):1937–58. doi: 10.5194/gmd-9-1937-2016
5. O’Neill BC, Kriegler E, Riahi K, Ebi KL, Hallegatte S, Carter TR, et al. A new scenario framework for climate change research: the concept of shared socioeconomic pathways. Clim Change (2014) 122(3):387–400. doi: 10.1007/s10584-013-0905-2
6. Monerie PA, Pohl B, Gaetani M. The fast response of Sahel precipitation to climate change allows effective mitigation action. NPJ Clim Atmos Sci (2021) 4(1):24. doi: 10.1038/s41612-021-00179-6
7. Stephenson DB. Chapter 23. Handbook of environmental and ecological statistics. In: Climate modelling. New York: Chapman and Hall/CRC (2019).
8. Sansom PG, Cummins D, Siegert S, Stephenson DB. Towards reliable projections of global mean surface temperature (2021). Available at: https://arxiv.org/abs/2101.08198.
9. Cummins DP, Stephenson DB, Stott PA. Optimal estimation of stochastic energy balance model parameters. J Clim (2020) 33(18):7909–26. doi: 10.1175/JCLI-D-19-0589.1
10. IPCC. 2013: the physical science basis. Contribution of working group I to the fifth assessment report of the Intergovernmental Panel on Climate Change. Climate Change. Cambridge, United Kingdom: Cambridge University Press (2013). p. 1535.
11. King AD, Sniderman JMK, Dittus AJ, Brown JR, Hawkins E, Ziehn T. Studying climate stabilization at Paris Agreement levels. Nat Clim Change (2021) 11(12):1010–3. doi: 10.1038/s41558-021-01225-0
12. Dittus A, Hawkins E, Sellar A. "Fixed concentration simulations with UKESM1 across multiple global warming levels (500 years per simulation). [Dataset]." Natural Environment Research Council Environmental Data Service (NERC-EDS) - Centre for Environmental Data Analysis (2024). Available at: https://catalogue.ceda.ac.uk/uuid/b153fcf4ad4944baa059e433c83255c8.
13. Dittus AJ, Collins M, Sutton R, Hawkins E. Reversal of projected European summer precipitation decline in a stabilising climate. Geophys Res Lett (2024) 51(6):e2023GL107448. doi: 10.1029/2023GL107448
14. Collins M, Minobe S, Barreiro M, Bordoni S, Kaspi Y, Kuwano-Yoshida A, et al. Challenges and opportunities for improved understanding of regional climate dynamics. Nat Clim Change (2018) 8(2):101–8. doi: 10.1038/s41558-017-0059-8
15. Wang PX, Wang B, Cheng H, Fasullo J, Guo Z, Kiefer T, et al. The global monsoon across time scales: mechanisms and outstanding issues. Earth Sci Rev (2017) 174:84–121. doi: 10.1016/j.earscirev.2017.07.006
16. Marvel K, Biasutti M, Bonfils C. Fingerprints of external forcings on Sahel rainfall: aerosols, greenhouse gases, and model-observation discrepancies. Environ Res Lett (2020) 15(8):084023. doi: 10.1088/1748-9326/ab858e
17. Monerie P-A, Wilcox LJ, Turner AG. Effects of anthropogenic aerosol and greenhouse gas emissions on Northern Hemisphere monsoon precipitation: mechanisms and uncertainty. J Clim (2022) 35(8):2305–26. doi: 10.1175/JCLI-D-21-0412.1
18. Polson D, Bollasina M, Hegerl GC, Wilcox LJ. Decreased monsoon precipitation in the Northern Hemisphere due to anthropogenic aerosols. Geophys Res Lett (2014) 41(16):6023–9. doi: 10.1002/2014GL060811
19. Dong B, Sutton RT, Highwood E, Wilcox L. The impacts of European and Asian anthropogenic sulfur dioxide emissions on Sahel rainfall. J Clim (2014) 27(18):7000–17. doi: 10.1175/JCLI-D-13-00769.1
20. Hirasawa H, Kushner PJ, Sigmond M, Fyfe J, Deser C. Anthropogenic aerosols dominate forced multidecadal Sahel precipitation change through distinct atmospheric and oceanic drivers. J Clim (2020) 33(23):10187–204. doi: 10.1175/JCLI-D-19-0829.1
21. Huang X, Zhou T, Turner A, Dai A, Chen X, Clark R, et al. The recent decline and recovery of Indian summer monsoon rainfall: relative roles of external forcing and internal variability. J Clim (2020) 33(12):5035–60. doi: 10.1175/JCLI-D-19-0833.1
22. Jain S, Scaife AA. How extreme could the near term evolution of the Indian summer Monsoon rainfall be? Environ Res Lett (2022) 17(3):034009. doi: 10.1088/1748-9326/ac4655
23. Chadwick R, Ackerley D, Ogura T, Dommenget D. Separating the influences of land warming, the direct CO2 effect, the plant physiological effect, and SST warming on regional precipitation changes. JGR Atmospheres (2019) 124(2):624–40. doi: 10.1029/2018JD029423
24. Boos WR, Korty RL. Regional energy budget control of the intertropical convergence zone and application to mid-Holocene rainfall. Nat Geosci (2016) 9(12):892–7. doi: 10.1038/ngeo2833
25. Dong B, Sutton R. Dominant role of greenhouse-gas forcing in the recovery of Sahel rainfall. Nat Clim Change (2015) 5(8):757–60. doi: 10.1038/nclimate2664
26. Chadwick R, Good P, Willett K. A simple moisture advection model of specific humidity change over land in response to SST warming. J Clim (2016) 29(21):7613–32. doi: 10.1175/JCLI-D-16-0241.1
27. Monerie PA, Wainwright CM, Sidibe M, Akinsanola AA. Model uncertainties in climate change impacts on Sahel precipitation in ensembles of CMIP5 and CMIP6 simulations. Clim Dyn (2020) 55(5–6):1385–401. doi: 10.1007/s00382-020-05332-0
28. Hari V, Villarini G, Karmakar S, Wilcox LJ, Collins M. Northward propagation of the intertropical convergence zone and strengthening of Indian summer monsoon rainfall. Geophys Res Lett (2020) 47(23):e2020GL089823. doi: 10.1029/2020GL089823
29. Geng YF, Xie SP, Zheng XT, Long SM, Kang SM, Lin X, et al. CMIP6 intermodel spread in interhemispheric asymmetry of tropical climate response to greenhouse warming: extratropical ocean effects. J Clim (2022) 35(14):4869–82. doi: 10.1175/JCLI-D-21-0541.1
30. Kang SM, Xie SP, Deser C, Xiang B. Zonal mean and shift modes of historical climate response to evolving aerosol distribution. Sci Bull (2021) 66(23):2405–11. doi: 10.1016/j.scib.2021.07.013
31. Giannini A, Saravanan R, Chang P. Oceanic forcing of Sahel rainfall on interannual to interdecadal time scales. Science (2003) 302(5647):1027–30. doi: 10.1126/science.1089357
32. Krishnamurthy L, Krishnamurthy V. Influence of PDO on South Asian summer monsoon and monsoon-ENSO relation. Clim Dyn (2014) 42(9–10):2397–410. doi: 10.1007/s00382-013-1856-z
33. Monerie PA, Robson J, Dong B, Hodson DLR, Klingaman NP. Effect of the Atlantic multidecadal variability on the global monsoon. Geophys Res Lett (2019) 46(3):1765–75. doi: 10.1029/2018GL080903
34. Park J, Bader J, Matei D. Anthropogenic Mediterranean warming essential driver for present and future Sahel rainfall. Nat Clim Change (2016) 6(10):941–5. doi: 10.1038/nclimate3065
35. Wilcox LJ, Dong B, Sutton RT, Highwood EJ. The 2014 hot, dry summer in North East Asia. Bull Am Meteorol Soc (2015) 96(12):S105–10. doi: 10.1175/BAMS-D-15-00123.1
36. Herbert R, Wilcox LJ, Joshi M, Highwood E, Frame D. Nonlinear response of Asian summer monsoon precipitation to emission reductions in South and East Asia. Environ Res Lett (2022) 17(1):014005. doi: 10.1088/1748-9326/ac3b19
37. Wilcox LJ, Liu Z, Samset BH, Hawkins E, Lund MT, Nordling K, et al. Accelerated increases in global and Asian summer monsoon precipitation from future aerosol reductions. Atmos Chem Phys (2020) 20(20):11955–77. doi: 10.5194/acp-20-11955-2020
38. Sperber KR, Annamalai H, Kang IS, Kitoh A, Moise A, Turner A, et al. The Asian summer monsoon: an intercomparison of CMIP5 vs. CMIP3 simulations of the late 20th century. Clim Dyn (2013) 41(9–10):2711–44. doi: 10.1007/s00382-012-1607-6
39. Zhou S, Huang G, Huang P. A bias-corrected projection for the changes in East Asian summer monsoon rainfall under global warming. Clim Dyn (2020) 54(1–2):1–16. doi: 10.1007/s00382-019-04980-1
40. Monerie PA, Sanchez-Gomez E, Boé J. On the range of future Sahel precipitation projections and the selection of a sub-sample of CMIP5 models for impact studies. Clim Dyn (2017) 48(7–8):2751–70. doi: 10.1007/s00382-016-3236-y
41. Yan Y, Lu R, Li C. Relationship between the future projections of Sahel rainfall and the simulation biases of present South Asian and western North Pacific rainfall in summer. J Climate (2019) 32(4):1327–43. doi: 10.1175/JCLI-D-17-0846.1
42. Douville H, Raghavan K, Renwick J, Allan RP, Arias PA, Barlow M, et al. Water cycle changes. In: Masson-Delmotte V, Zhai P, Pirani A, Connors SL, Péan C, Berger S, Caud N, Chen Y, Goldfarb L, Gomis MI, Huang M, Leitzell K, Lonnoy E, Matthews JBR, Maycock TK, Waterfield T, Yelekçi O, Yu R, Zhou B, editors. Climate change. The Physical Science Basis. Contribution of Working Group I to the Sixth Assessment Report of the Intergovernmental Panel on Climate Change. Cambridge, United Kingdom: Cambridge University Press (2021). p. 1055–210. doi: 10.1017/9781009157896.010
43. Caretta MA, Mukherji A, Arfanuzzaman M, Betts RA, Gelfan A, Hirabayashi Y, et al. Water. In: Pörtner HO, Roberts DC, Tignor M, Poloczanska ES, Mintenbeck K, Alegría A, Craig M, Langsdorf S, Löschke S, Möller V, Okem A, Rama B, editors. Climate Change 2022: impacts, adaptation and vulnerability. Contribution of Working Group II to the Sixth Assessment Report of the Intergovernmental Panel on Climate Change. J Water Clim Change. Cambridge, United Kingdom: Cambridge University Press (2022). p. 551–712. doi: 10.1017/9781009325844.006
44. Joshi MM, Gregory JM, Webb MJ, Sexton DMH, Johns TC. Mechanisms for the land/sea warming contrast exhibited by simulations of climate change. Clim Dyn (2008) 30(5):455–65. doi: 10.1007/s00382-007-0306-1
45. Saint-Lu M, Chadwick R, Lambert FH, Collins M. Surface warming and atmospheric circulation dominate rainfall changes over tropical rainforests under global warming. Geophys Res Lett (2019) 46(22):13410–9. doi: 10.1029/2019GL085295
46. Shonk JKP, Turner AG, Chevuturi A, Wilcox LJ, Dittus AJ, Hawkins E. Uncertainty in aerosol radiative forcing impacts the simulated global monsoon in the 20th century. Atmos Chem Phys (2020) 20(23):14903–15. doi: 10.5194/acp-20-14903-2020
47. Mutton H, Chadwick R, Collins M, Lambert FH, Taylor CM, Geen R, et al. The impact of uniform ocean warming on the West African monsoon. Clim Dyn (2024) 62:103–22. doi: 10.1007/s00382-023-06898-1
48. Mutton H, Chadwick R, Collins M, Lambert FH, Geen R, Todd A, et al. The impact of the direct radiative effect of increased CO2 on the West African monsoon. J Clim (2022) 35(8):2441–58. doi: 10.1175/JCLI-D-21-0340.1
49. Owen LE, Catto JL, Stephenson DB, Dunstone NJ. Compound precipitation and wind extremes over Europe and their relationship to extratropical cyclones. Weather Clim Extremes (2021) 33:100342. doi: 10.1016/j.wace.2021.100342
50. Catto JL, Shaffrey LC, Hodges KI. Can climate models capture the structure of extratropical cyclones? J Clim (2010) 23(7):1621–35. doi: 10.1175/2009JCLI3318.1
51. Chang EKM, Guo Y, Xia X. CMIP5 multimodel ensemble projection of storm track change under global warming. J Geophys Res Atmos (2012) 117(D23118). doi: 10.1029/2012JD018578
52. Gao J, Shoshiro M, Roberts M, Haarsma R, Putrasahan D, Roberts C, et al. Influence of model resolution on bomb cyclones revealed by HighResMIP-Primavera simulations. Environ Res Lett (2020) 15(8):084001. doi: 10.1088/1748-9326/ab88fa
53. Priestley MDK, Catto JL. Improved representation of extratropical Cyclone Structure in HighResMIP models. Geophys Res Lett (2022) 49(5):e2021GL096708. doi: 10.1029/2021GL096708
54. Priestley MDK, Ackerley D, Catto JL, Hodges KI, McDonald RE, Lee RW. An overview of the extratropical storm tracks in CMIP6 historical simulations. J Clim (2020) 33(15):6315–43. doi: 10.1175/JCLI-D-19-0928.1
55. Priestley MDK, Catto JL. Future changes in the extratropical storm tracks and cyclone intensity, wind speed, and structure. Weather Clim Dynam (2022) 3(1):337–60. doi: 10.5194/wcd-3-337-2022
56. Zappa G, Shaffrey LC, Hodges KI, Sansom PG, Stephenson DB. A multimodel assessment of future projections of North Atlantic and European extratropical cyclones in the CMIP5 climate models. J Clim (2013) 26(16):5846–62. doi: 10.1175/JCLI-D-12-00573.1
57. Catto JL, Ackerley D, Booth JF, Champion AJ, Colle BA, Pfahl S, et al. The future of midlatitude cyclones. Curr Clim Change Rep (2019) 5(4):407–20. doi: 10.1007/s40641-019-00149-4
58. Manning C, Kendon EJ, Fowler HJ, Roberts NM, Berthou S, Suri D, et al. Extreme windstorms and sting jets in convection-permitting climate simulations over Europe. Clim Dyn (2022) 58(9–10):2387–404. doi: 10.1007/s00382-021-06011-4
59. Grams CM, Wernli H, Böttcher M, Čampa J, Corsmeier U, Jones SC, et al. The key role of diabatic processes in modifying the upper-tropospheric wave guide: a North Atlantic case-study. Q J R Meteorol Soc (2011) 137(661):2174–93. doi: 10.1002/qj.891
60. Pfahl S, O’Gorman PA, Singh MS. Extratropical cyclones in idealized simulations of changed climates. J Clim (2015) 28(23):9373–92. doi: 10.1175/JCLI-D-14-00816.1
61. Grist JP, Josey SA, Sinha B, Catto JL, Roberts MJ, Coward AC. Future evolution of an eddy rich ocean associated with enhanced East Atlantic storminess in a coupled model projection. Geophys Res Lett (2021) 48(7):e2021GL092719. doi: 10.1029/2021GL092719
62. Grist JP, Sinha B, Hewitt HT, Duchez A, MacLachlan C, Hyder P, et al. Re-emergence of North Atlantic subsurface ocean temperature anomalies in a seasonal forecast system. Clim Dyn (2019) 53(7–8):4799–820. doi: 10.1007/s00382-019-04826-w
63. Moreno-Chamarro E, Caron LP, Ortega P, Loosveldt Tomas S, Roberts MJ. Can we trust CMIP5/6 future projections of European winter precipitation? Environ Res Lett (2021) 16(5):054063. doi: 10.1088/1748-9326/abf28a
64. Dong B, Sutton RT, Shaffrey L, Harvey B. Recent decadal weakening of the summer Eurasian westerly jet attributable to anthropogenic aerosol emissions. Nat Commun (2022) 13(1):1148. doi: 10.1038/s41467-022-28816-5
65. Drouard M, Woollings T, Sexton DMH, McSweeney CF. Dynamical differences between short and long blocks in the Northern Hemisphere. JGR Atmospheres (2021) 126(10):e2020JD034082. doi: 10.1029/2020JD034082
66. Chan P, Catto J, Collins M. Heatwave-blocking relation change likely dominates over decrease in blocking frequency under global warming. NPJ Clim Atmos Sci (2022) 5(1):68. doi: 10.1038/s41612-022-00290-2
67. Bracegirdle TJ, Hyder P, Holmes CR. CMIP5 diversity in southern westerly jet projections related to historical sea ice area: strong link to strengthening and weak link to shift. J Clim (2018) 31(1):195–211. doi: 10.1175/JCLI-D-17-0320.1
68. Eade R, Stephenson DB, Scaife AA, Smith DM. Quantifying the rarity of extreme multi-decadal trends: how unusual was the late twentieth century trend in the North Atlantic Oscillation? Clim Dyn (2022) 58(5–6):1555–68. doi: 10.1007/s00382-021-05978-4
69. Kajtar JB, Collins M, Frankcombe LM, England MH, Osborn TJ, Juniper M. Global mean surface temperature response to large-scale patterns of variability in observations and CMIP5. Geophys Res Lett (2019) 46(4):2232–41. doi: 10.1029/2018GL081462
70. Simpson IR, Deser C, McKinnon KA, Barnes EA. Modeled and observed multidecadal variability in the North Atlantic jet stream and its connection to sea surface temperatures. J Climate (2018) 31(20):8313–38. doi: 10.1175/JCLI-D-18-0168.1
71. Sun L, Deser C, Tomas RA. Mechanisms of stratospheric and tropospheric circulation response to projected Arctic sea ice loss. J Clim (2015) 28(19):7824–45. doi: 10.1175/JCLI-D-15-0169.1
72. Scaife AA, Smith D. A signal-to-noise paradox in climate science. NPJ Clim Atmos Sci (2018) 1(1):28. doi: 10.1038/s41612-018-0038-4
73. Smith DM, Scaife AA, Eade R, Athanasiadis P, Bellucci A, Bethke I, et al. North Atlantic climate far more predictable than models imply. Nature (2020) 583(7818):796–800. doi: 10.1038/s41586-020-2525-0
74. Deser C, Hurrell JW, Phillips AS. The role of the North Atlantic Oscillation in European climate projections. Clim Dyn (2017) 49(9–10):3141–57. doi: 10.1007/s00382-016-3502-z
75. O’Reilly CH, Befort DJ, Weisheimer A, Woollings T, Ballinger A, Hegerl G. Projections of northern hemisphere extratropical climate underestimate internal variability and associated uncertainty. Commun Earth Environ (2021) 2(1):194. doi: 10.1038/s43247-021-00268-7
76. Zhang W, Kirtman B, Siqueira L, Clement A, Xia J. Understanding the signal-to-noise paradox in decadal climate predictability from CMIP5 and an eddying global coupled model. Clim Dyn (2021) 56(9–10):2895–913. doi: 10.1007/s00382-020-05621-8
77. Scaife AA, Camp J, Comer R, Davis P, Dunstone N, Gordon M, et al. Does increased atmospheric resolution improve seasonal climate predictions? Atmos Sci Lett (2019) 20(8):e922. doi: 10.1002/asl.922
78. Hu S, Xie SP, Kang SM. Global warming pattern formation: the role of ocean heat uptake. J Clim (2022) 35(6):1885–99. doi: 10.1175/JCLI-D-21-0317.1
79. Smith DM, Eade R, Andrews MB, Ayres H, Clark A, Chripko S, et al. Robust but weak winter atmospheric circulation response to future Arctic sea ice loss. Nat Commun (2022) 13(1):727. doi: 10.1038/s41467-022-28283-y
80. Roach LA, Dörr J, Holmes CR, Massonnet F, Blockley EW, Notz D, et al. Antarctic sea ice area in CMIP6. Geophys Res Lett (2020) 47(9):e2019GL086729. doi: 10.1029/2019GL086729
81. Bracegirdle TJ, Stephenson DB, Turner J, Phillips T. The importance of sea-ice extent biases in 21st century multi-model projections of Antarctic temperature and precipitation. Geophys Res Lett (2015) 42(24):10,832–9. doi: 10.1002/2015GL067055
82. Holmes CR, Bracegirdle TJ, Holland PR. Antarctic sea ice projections constrained by historical ice cover and future global temperature change. Geophys Res Lett (2022) 49(10):e2021GL097413. doi: 10.1029/2021GL097413
83. Holmes CR, Holland PR, Bracegirdle TJ. Compensating biases and a noteworthy success in the CMIP5 representation of Antarctic sea ice processes. Geophys Res Lett (2019) 46(8):4299–307. doi: 10.1029/2018GL081796
84. Rackow T, Danilov S, Goessling HF, Hellmer HH, Sein DV, Semmler T, et al. Delayed Antarctic sea-ice decline in high-resolution climate change simulations. Nat Commun (2022) 13(1):637. doi: 10.1038/s41467-022-28259-y
85. Pauling AG, Bitz CM, Smith IJ, Langhorne PJ. The response of the Southern Ocean and Antarctic sea ice to freshwater from ice shelves in an earth system model. J Clim (2016) 29(5):1655–72. doi: 10.1175/JCLI-D-15-0501.1
86. McCrystall MR, Stroeve J, Serreze M, Forbes BC, Screen JA. New climate models reveal faster and larger increases in Arctic precipitation than previously projected. Nat Commun (2021) 12(1):6765. doi: 10.1038/s41467-021-27031-y
87. Zelinka MD, Myers TA, Mccoy DT, Po-Chedley S, Caldwell PM, Ceppi P, et al. Causes of higher climate sensitivity in CMIP6 models. Geophys Res Lett (2020) 47(1):e2019GL085782. doi: 10.1029/2019GL085782
88. Vignon É, Roussel ML, Gorodetskaya IV, Genthon C, Berne A. Present and future of rainfall in Antarctica. Geophys Res Lett (2021) 48(8):e2020GL092281. doi: 10.1029/2020GL092281
89. Holland PR, Bracegirdle TJ, Dutrieux P, Jenkins A, Steig EJ. West Antarctic ice loss influenced by internal climate variability and anthropogenic forcing. Nat Geosci (2019) 12(9):718–24. doi: 10.1038/s41561-019-0420-9
90. Naughten KA, Holland PR, Dutrieux P, Kimura S, Bett DT, Jenkins A. Simulated twentieth-century ocean warming in the Amundsen Sea, West Antarctica. Geophys Res Lett (2022) 49(5):GL094566:e2021. doi: 10.1029/2021GL094566
91. O’Connor GK, Steig EJ, Hakim GJ. Strengthening Southern Hemisphere westerlies and Amundsen Sea Low Deepening over the 20th century revealed by proxy-data assimilation. Geophys Res Lett (2021) 48(24):e2021GL095999. doi: 10.1029/2021GL095999
92. Harvey BJ, Shaffrey LC, Woollings TJ. Equator-to-pole temperature differences and the extra-tropical storm track responses of the CMIP5 climate models. Clim Dyn (2014) 43(5–6):1171–82. doi: 10.1007/s00382-013-1883-9
93. Oudar T, Sanchez-Gomez E, Chauvin F, Cattiaux J, Terray L, Cassou C. Respective roles of direct GHG radiative forcing and induced Arctic sea ice loss on the Northern Hemisphere atmospheric circulation. Clim Dyn (2017) 49(11–12):3693–713. doi: 10.1007/s00382-017-3541-0
94. Ying J, Collins M, Cai W, Timmermann A, Huang P, Chen D, et al. Emergence of climate change in the tropical Pacific. Nat Clim Change (2022) 12(4):356–64. doi: 10.1038/s41558-022-01301-z
95. Yeh S-W, Cai W, Min S-K, McPhaden MJ, Dommenget D, Dewitte B, et al. ENSO atmospheric teleconnections and their response to greenhouse gas forcing. Rev Geophys (2018) 56(1):185–206. doi: 10.1002/2017RG000568
96. Henderson SA, Maloney ED, Barnes EA. The influence of the Madden-Julian oscillation on Northern Hemisphere winter blocking. J Clim (2016) 29(12):4597–616. doi: 10.1175/JCLI-D-15-0502.1
97. Scaife AA, Comer RE, Dunstone NJ, Knight JR, Smith DM, MacLachlan C, et al. Tropical rainfall, Rossby waves and regional winter climate predictions. Q J R Meteorol Soc (2017) 143(702):1–11. doi: 10.1002/qj.2910
98. Fereday DR, Chadwick R, Knight JR, Scaife AA. Tropical rainfall linked to stronger future ENSO-NAO teleconnection in CMIP5 models. Geophys Res Lett (2020) 47(22):e2020GL088664. doi: 10.1029/2020GL088664
99. Samarasinghe SM, Connolly C, Barnes EA, Ebert-Uphoff I, Sun L. Strengthened causal connections between the MJO and the North Atlantic with climate warming. Geophys Res Lett (2021) 48(5):e2020GL091168. doi: 10.1029/2020GL091168
100. Rao J, Garfinkel CI, White IP. Projected strengthening of the extratropical surface impacts of the stratospheric quasi-biennial oscillation. Geophys Res Lett (2020) 47(20):e2020GL089149. doi: 10.1029/2020GL089149
101. Hanna E, Cropper TE, Jones PD, Scaife AA, Allan R. Recent seasonal asymmetric changes in the NAO (a marked summer decline and increased winter variability) and associated changes in the AO and Greenland Blocking Index. Int J Climatol (2015) 35(9):2540–54. doi: 10.1002/joc.4157
102. Beverley JD, Collins M, Lambert FH, Chadwick R. Future changes to el Nino teleconnections over the North Pacific and North America. J Clim (2021) 34(15):1–43. doi: 10.1175/JCLI-D-20-0877.1
103. Zhou ZQ, Xie SP, Zheng XT, Liu Q, Wang H. Global warming-induced changes in el Nino teleconnections over the North Pacific and North America. J Clim (2014) 27(24):9050–64. doi: 10.1175/JCLI-D-14-00254.1
104. Deb P, Matthews AJ, Joshi MM, Senior N. The extratropical linear step response to tropical precipitation anomalies and its use in constraining projected circulation changes under climate warming. J Clim (2020) 33(16):7217–31. doi: 10.1175/JCLI-D-20-0060.1
105. Screen JA, Deser C, Smith DM, Zhang XD, Blackport R, Kushner PJ, et al. Consistency and discrepancy in the atmospheric response to Arctic sea-ice loss across climate models. Nat Geosci (2018) 11(3):155–63. doi: 10.1038/s41561-018-0059-y
106. Cohen J, Zhang X, Francis J, Jung T, Kwok R, Overland J, et al. Divergent consensuses on Arctic amplification influence on midlatitude severe winter weather. Nat Clim Change (2020) 10(1):20–9. doi: 10.1038/s41558-019-0662-y
107. Screen JA. An ice-free Arctic: what could it mean for European weather? Weather (2021) 76(10):327–8. doi: 10.1002/wea.4069
108. Blackport R, Screen JA. Insignificant effect of Arctic amplification on the amplitude of midlatitude atmospheric waves. Sci Adv (2020) 6(8):eaay2880. doi: 10.1126/sciadv.aay2880
109. Blackport R, Screen JA. Observed statistical connections overestimate the causal effects of Arctic sea ice changes on midlatitude winter climate. J Clim (2021) 34(8):3021–38. doi: 10.1175/JCLI-D-20-0293.1
110. Blackport R, Screen JA, van der Wiel K, Bintanja R. Minimal influence of reduced Arctic sea ice on coincident cold winters in mid-latitudes. Nat Clim Change (2019) 9(9):697–704. doi: 10.1038/s41558-019-0551-4
111. Smith DM, Screen JA, Deser C, Cohen J, Fyfe JC, García-Serrano J, et al. The Polar Amplification Model Intercomparison Project (PAMIP) contribution to CMIP6: investigating the causes and consequences of polar amplification. Geosci Model Dev (2019) 12(3):1139–64. doi: 10.5194/gmd-12-1139-2019
112. Kretschmer M, Zappa G, Shepherd TG. The role of Barents–Kara Sea ice loss in projected polar vortex changes. Weather Clim Dynam (2020) 1(2):715–30. doi: 10.5194/wcd-1-715-2020
113. Mitchell D. Climate attribution of heat mortality. Nat Clim Change (2021) 11(6):467–8. doi: 10.1038/s41558-021-01049-y
114. Thompson V, Kennedy-Asser AT, Vosper E, Lo YTE, Huntingford C, Andrews O, et al. The 2021 western North America heat wave among the most extreme events ever recorded globally. Sci Adv (2022) 8(18):eabm6860. doi: 10.1126/sciadv.abm6860
115. Van Oldenborgh GJ, Wehner MF, Vautard R, Otto FEL, Seneviratne SI, Stott PA, et al. Attributing and projecting heatwaves is hard: we can do better. Earth's Future (2022) 10(6):e2021EF002271. doi: 10.1029/2021EF002271
116. Cowan T, Undorf S, Hegerl GC, Harrington LJ, Otto FEL. Present-day greenhouse gases could cause more frequent and longer Dust Bowl heatwaves. Nat Clim Change (2020) 10(6):505–10. doi: 10.1038/s41558-020-0771-7
117. Thompson V, Dunstone NJ, Scaife AA, Smith DM, Slingo JM, Brown S, et al. High risk of unprecedented UK rainfall in the current climate. Nat Commun (2017) 8(1):107. doi: 10.1038/s41467-017-00275-3
118. Jain S, Scaife AA, Dunstone N, Smith D, Mishra SK. Current chance of unprecedented monsoon rainfall over India using dynamical ensemble simulations. Environ Res Lett (2020) 15(9):094095. doi: 10.1088/1748-9326/ab7b98
119. Kelder T, Müller M, Slater LJ, Marjoribanks TI, Wilby RL, Prudhomme C, et al. Using UNSEEN trends to detect decadal changes in 100-year precipitation extremes. NPJ Clim Atmos Sci (2020) 3(1):47. doi: 10.1038/s41612-020-00149-4
120. Kay G, Dunstone N, Smith D, Dunbar T, Eade R, Scaife A. Current likelihood and dynamics of hot summers in the UK. Environ Res Lett (2020) 15(9):094099. doi: 10.1088/1748-9326/abab32
121. Thompson V, Dunstone NJ, Scaife AA, Hardiman SC, Ren H-L, Lu B, et al. Risk and dynamics of unprecedented hot months in South East China. Clim Dyn (2019) 52:2585–96. doi: 10.1007/s00382-018-4281-5
122. Kent C, Pope E, Thompson V, Lewis K, Scaife AA, Dunstone N. Using climate model simulations to assess the current climate risk to maize production. Environ Res Lett (2017) 12(5):054012. doi: 10.1088/1748-9326/aa6cb9
123. Fischer EM, Sippel S, Knutti R. Increasing probability of record-shattering climate extremes. Nat Clim Change (2021) 11(8):689–95. doi: 10.1038/s41558-021-01092-9
124. King AD, Donat MG, Fischer EM, Hawkins E, Alexander LV, Karoly DJ, et al. The timing of anthropogenic emergence in simulated climate extremes. Environ Res Lett (2015) 10(9):94015. doi: 10.1088/1748-9326/10/9/094015
125. Ossó A, Allan RP, Hawkins E, Shaffrey L, Maraun D. Emerging new climate extremes over Europe. Clim Dyn (2022) 58(1–2):487–501. doi: 10.1007/s00382-021-05917-3
126. Lopez H, West R, Dong S, Goni G, Kirtman B, Lee SK, et al. Early emergence of anthropogenically forced heat waves in the western United States and Great Lakes. Nat Clim Change (2018) 8(5):414–20. doi: 10.1038/s41558-018-0116-y
127. Wehrli K, Guillod BP, Hauser M, Leclair M, Seneviratne S. Identifying key driving processes of major recent heat waves. JGR Atmospheres (2019) 124(22):11746–65. doi: 10.1029/2019JD030635
128. Butler AH, Thompson DWJ, Heikes R. The steady-state atmospheric circulation response to climate change-like thermal forcings in a simple general circulation model. J Clim (2010) 23(13):3474–96. doi: 10.1175/2010JCLI3228.1
129. Kharin VV, Flato GM, Zhang X, Gillett NP, Zwiers F, Anderson KJ. Risks from Climate Extremes Change Differently from 1.5 degrees C to 2.0 degrees C Depending on Rarity. Earths Future (2018) 6(5):704–15. doi: 10.1002/2018EF000813
130. Freychet N, Hegerl G, Mitchell D, Collins M. Future changes in the frequency of temperature extremes may be underestimated in tropical and subtropical regions. Commun Earth Environ (2021) 2(1):28. doi: 10.1038/s43247-021-00094-x
131. Ebi KL, Vanos J, Baldwin JW, Bell JE, Hondula DM, Errett NA, et al. Extreme weather and climate change: population health and health system implications. Annu Rev Public Health (2021) 42:293–315. doi: 10.1146/annurev-publhealth-012420-105026
132. Sherwood SC, Huber M. An adaptability limit to climate change due to heat stress. Proc Natl Acad Sci USA (2010) 107(21):9552–5. doi: 10.1073/pnas.0913352107
133. Lo YTE, Mitchell DM, Thompson R, O’Connell E, Gasparrini A. Estimating heat-related mortality in near real time for national heatwave plans. Environ Res Lett (2022) 17(2):24017. doi: 10.1088/1748-9326/ac4cf4
134. Lo Y, Mitchell D, Buzan J, Zscheischler J, Schneider R, Mistry M, et al. Optimal heat stress metric for modelling heat-related mortality varies from country to country. Int J Climatol (2022) 43(12):5553–68. doi: 10.1002/joc.8160
135. Anderson BG, Bell ML. Weather-related mortality: how heat, cold, and heat waves affect mortality in the United States. Epidemiology (2009) 20(2):205–13. doi: 10.1097/EDE.0b013e318190ee08
136. Armstrong BG, Chalabi Z, Fenn B, Hajat S, Kovats S, Milojevic A, et al. Association of mortality with high temperatures in a temperate climate: England and Wales. J Epidemiol Community Health (2011) 65(4):340–5. doi: 10.1136/jech.2009.093161
137. Simpson C, Hosking JS, Mitchell D, Betts RA, Shuckburgh E. Regional disparities and seasonal differences in climate risk to rice labour. Environ Res Lett (2021) 16(12):124004. doi: 10.1088/1748-9326/ac3288
138. Im ES, Pal JS, Eltahir EAB. Deadly heat waves projected in the densely populated agricultural regions of South Asia. Sci Adv (2017) 3(8):e1603322. doi: 10.1126/sciadv.1603322
139. Monteiro JM, Caballero R. Characterization of extreme wet-bulb temperature events in Southern Pakistan. Geophys Res Lett (2019) 46(17–18):10659–68. doi: 10.1029/2019GL084711
140. Foster J, Smallcombe JW, Hodder S, Jay O, Flouris AD, Nybo L, et al. An advanced empirical model for quantifying the impact of heat and climate change on human physical work capacity. Int J Biometeorol (2021) 65(7):1215–29. doi: 10.1007/s00484-021-02105-0
141. Parsons LA, Masuda YJ, Kroeger T, Shindell D, Wolff NH, Spector JT. Global labor loss due to humid heat exposure underestimated for outdoor workers. Environ Res Lett (2022) 17(1):014050. doi: 10.1088/1748-9326/ac3dae
142. Thompson V, Mitchell D, Hegerl GC, Collins M, Leach NJ, Slingo JM. The most at-risk regions in the world for high-impact heatwaves. Nat Commun (2023) 14:2152.
143. Uhe P, Mitchell D, Bates PD, Allen MR, Betts RA, Huntingford C, et al. Method uncertainty is essential for reliable confidence statements of precipitation projections. J Clim (2021) 34(3):1227–40. doi: 10.1175/JCLI-D-20-0289.1
144. Park CE, Jeong SJ, Joshi M, Osborn TJ, Ho CH, Piao S, et al. Keeping global warming within 1.5°C constrains emergence of aridification. Nat Clim Change (2018) 8(1):70–4. doi: 10.1038/s41558-017-0034-4
145. Knutson T, Camargo SJ, Chan JCL, Emanuel K, Ho CH, Kossin J, et al. Tropical cyclones and climate change assessment: Part II: Projected response to anthropogenic warming. Bull Am Meteorol Soc (2020) 101(3):E303–22. doi: 10.1175/BAMS-D-18-0194.1
146. Mitchell D, Hawker L, Savage J, Bingham R, Lord NS, Khan MJU, et al. Increased population exposure to Amphan-scale cyclones under future climates. Climate Resilience (2022) 1(2):e36. doi: 10.1002/cli2.36
147. Vanos JK, Baldwin JW, Jay O, Ebi KL. Simplicity lacks robustness when projecting heat-health outcomes in a changing climate. Nat Commun (2020) 11(1):6079. doi: 10.1038/s41467-020-19994-1
148. Peduzzi P, Chatenoux B, Dao H, De Bono A, Herold C, Kossin J, et al. Global trends in tropical cyclone risk. Nat Clim Change (2012) 2(4):289–94. doi: 10.1038/nclimate1410
149. Shultz JM, Russell J, Espinel Z. Epidemiology of tropical cyclones: The dynamics of disaster, disease, and development. Epidemiol Rev (2005) 27:21–35. doi: 10.1093/epirev/mxi011
150. Andrews O, Le Quéré C, Kjellstrom T, Lemke B, Haines A. Implications for workability and survivability in populations exposed to extreme heat under climate change: a modelling study. Lancet Planet Health (2018) 2(12):e540–7. doi: 10.1016/S2542-5196(18)30240-7
151. Freychet N, Hegerl GC, Lord NS, Lo YTE, Mitchell D, Collins M. Robust increase in population exposure to heat stress with increasing global warming. Environ Res Lett (2022) 17(6):064049. doi: 10.1088/1748-9326/ac71b9
152. Sherwood SC, Webb MJ, Annan JD, Armour KC, Forster PM, Hargreaves JC, et al. An assessment of Earth’s climate sensitivity using multiple lines of evidence. Rev Geophys (2020) 58(4):e2019RG000678. doi: 10.1029/2019RG000678
153. United Nations Office for Disaster Risk Reduction. Sendai framework for disaster risk reduction 2015–2030 (2015). Available at: https://www.undrr.org/publication/sendai-framework-disaster-risk-reduction-2015–2030.
154. Parry IM, Ritchie PDL, Cox PM. Evidence of localised Amazon rainforest dieback in CMIP6 models. Earth Syst Dynam (2022) 13:1667–75. doi: 10.5194/esd-13-1667-2022
Keywords: climate change, climate adaptation, greenhouse gas emissions, monsoon, ENSO, storms, climate extremes, Shared Socioeconomic Pathways
Citation: Collins M, Beverley JD, Bracegirdle TJ, Catto J, McCrystall M, Dittus A, Freychet N, Grist J, Hegerl GC, Holland PR, Holmes C, Josey SA, Joshi M, Hawkins E, Lo E, Lord N, Mitchell D, Monerie P-A, Priestley MDK, Scaife A, Screen J, Senior N, Sexton D, Shuckburgh E, Siegert S, Simpson C, Stephenson DB, Sutton R, Thompson V, Wilcox LJ and Woollings T. Emerging signals of climate change from the equator to the poles: new insights into a warming world. Front Sci (2024) 2:1340323. doi: 10.3389/fsci.2024.1340323
Received: 17 November 2023; Accepted: 10 May 2024;
Published: 01 October 2024.
Edited by:
Paulo Artaxo, University of São Paulo, BrazilReviewed by:
Shang-Ping Xie, University of California, San Diego, United StatesJose A. Marengo, Centro Nacional de Monitoramento e Alertas de Desastres Naturais (CEMADEN), Brazil
Swadhin Kumar Behera, Japan Agency for Marine-Earth Science and Technology (JAMSTEC), Japan
Copyright © 2024 Collins, Beverley, Bracegirdle, Catto, McCrystall, Dittus, Freychet, Grist, Hegerl, Holland, Holmes, Josey, Joshi, Hawkins, Lo, Lord, Mitchell, Monerie, Priestley, Scaife, Screen, Senior, Sexton, Shuckburgh, Siegert, Simpson, Stephenson, Sutton, Thompson, Wilcox and Woollings. This is an open-access article distributed under the terms of the Creative Commons Attribution License (CC BY). The use, distribution or reproduction in other forums is permitted, provided the original author(s) and the copyright owner(s) are credited and that the original publication in this journal is cited, in accordance with accepted academic practice. No use, distribution or reproduction is permitted which does not comply with these terms.
*Correspondence: Matthew Collins, TS5Db2xsaW5zQGV4ZXRlci5hYy51aw==