 Lutz Bretschneider1*
 Sven Bollmann1
 Deborah Houssin-Agbomson2
 Jacob Shaw3Neil Howes3Linh Nguyen3Rod Robinson3Jon Helmore3Michael Lichtenstern4Javis Nwaboh5
 Andrea Pogany5
 Volker Ebert5†Astrid Lampert1
- 1TU Braunschweig, Institute of Flight Guidance, Braunschweig, Germany
- 2Air Liquide, Campus Innovation Paris, Paris, France
- 3National Physical Laboratory (NPL), Teddington, United Kingdom
- 4Institut für Physik der Atmosphäre, Deutsches Zentrum für Luft- und Raumfahrt, Oberpfaffenhofen, Germany
- 5Physikalisch-Technische Bundesanstalt (PTB), Braunschweig, Germany
The quickly developing drone technology can be used efficiently in the field of pipeline leak detection. The aim of this article is to provide drone mission concepts for detecting releases from pipelines. It provides an overview of the current applications of natural gas pipeline surveys, it considers environmental conditions by plume modelling, it discusses suitable commercially available sensors, and develops concepts for routine monitoring of pipelines and short term missions for localising and identifying a known leakage. Suitable platforms depend on the particular mission and requirements concerning sensors and legislation. As an illustration, a feasibility study during a release experiment is introduced. The main challenge of this study was the variability of wind direction on a time scale of minutes, which produces considerable differences to the plume simulations. Nevertheless, the leakage rates derived from the observations are in the same order of magnitude as the emission rates. Finally the results from the modeling, the release experiment and possible drone scenarios are combined and requirements for future application derived.
1 Introduction
In order to mitigate global warming, the reduction of the greenhouse gas methane with a mean atmospheric lifetime of 11.8 years and a greenhouse warming potential of 81.2 over 20 years compared to
There are different types of pipelines: Gathering, transmission and distribution pipelines. Gathering pipelines are used for transporting raw gas from production to processing sites above or below the surface. They typically consist of pipeline segments made of plastic, steel or iron of up to 100 km length, pipeline inspection gauges for maintenance, and valves to stop and direct gas flow. The typical pressure is in the range of 55 bar (Roscioli et al., 2015).
There are roughly 200,000 km of transmission pipelines in the EU (European Union Agency for the Cooperation of Energy Regulators (ACER), 2023). They have a typical length of different parts of 100 km, high pressure up to 85 bar, and they are located typically between 1 m and 2 m below the surface in open areas like fields and grass land. According to the German Technical and Scientific Association for Gas and Water (DVGW), a detection limit of 2.5 L
There are more than 2 million km of distribution pipelines and over 20,000 compressor and pressure reduction stations in the EU (European Union Agency for the Cooperation of Energy Regulators (ACER), 2023). They provide gas to individual households, and they are located under streets of settlements. They have a typical diameter of up to 30 cm, but there is a lot of variability between countries, e.g., it can be up to 24 inch (61 cm) diameter in the United States (Pipeline Safety Trust, 2015). Common big leaks are in the size of 15–50 L
The worldwide combined pipeline length was around 1.2 × 10⁶ km in December 2022 (Global Energy Monitor, 2023).
There is a need for automated continuous monitoring systems for leak detection (Golston et al., 2018). Monitoring and leak detection have been done traditionally by ground-based measurements in walking or driving surveys, and airborne surveys. For example, the United Kingdom transmission network has a piloted helicopter based visual survey on a fortnightly basis. DVGW-G501 is active in Germany through services offered by companies, e.g. Adlares et al. (2023). Leaks from distribution networks are commonly reported by the public in the United Kingdom as the gas is odourised at the distribution level.
Recent technological advances in the fields of drones and methane sensors, in particular the availability of small-size and low-weight methane sensors, provide the potential of drone-based leak detection. However, drones are currently mainly deployed to complement and not yet substitute classical technologies of mobile leak detection (Ravikumar et al., 2019). Drone-based leak detection has the potential to be more flexible, more efficient, maybe cheaper and also safer compared to the classical methods, as no person is required to approach the leakage spot. Drones are capable to fill the gap of atmospheric monitoring in the altitude range of 0–1,000 m with high resolution measurements in the range of few seconds and meters. Optimization methods for determining a suitable flight path in pipeline networks for inspection and leakage detection have been discussed (Yan et al., 2019). Drone measurements in the area of a known leakage have been performed in Poland, demonstrating that low flight altitudes should be chosen for sensors that average methane concentrations over the column between surface and measurement altitude (Iwaszenko et al., 2021). However, the application of drones strongly depends on the requirements, ambient conditions, regulations governing drone flights, and the mission design.
A review about drones for quantifying methane emissions (Shaw et al., 2021) showed the advantage of high spatial flexibility, and limitations associated with the typically high atmospheric variability, and accuracy of current instruments. Comparing the estimation of emission strength, drone-based measurements had generally larger errors than other techniques (Liu et al., 2023). A more general review about leak detection and quantification presents different sensors and methods for determining emissions, showing the advantages and disadvantages of the systems (Hollenbeck et al., 2021), and in particular the applicability for drone measurements: Advanced leak detection and quantification mostly combine a numerical model, e.g., the Gaussian plume dispersion, to take into account atmospheric effects and variability, and mobile measurements on different scales. The value of measurements strongly depends on different parameters, like operator skills, cost of equipment, setup time, survey time, and the required precision and accuracy.
Besides leakages from rural pipelines, there may be other sources of methane emissions from e.g., agriculture (Jackson et al., 2020) or waste treatment and landfills (Bogner et al., 1995; Bogner and Matthews, 2003), which may be separated by measuring additional tracer gases (Kille et al., 2019). The emissions from the different sources might mix and could then trigger false alarm for automated systems, which has to be taken into account.
In an underground release experiment, a sharp gradient of the methane concentration was observed within 10 cm altitude above the surface and within 3 m horizontal distance of the source, emphasizing the need of accurate sensor placement and a minimum detection limit of 10 ppm for the sensors (Ulrich et al., 2019). Drone based pipeline leak detection has been done with a remote sensing device, covering each pipeline segment twice (Smith et al., 2016; Li et al., 2020). Here, the criteria to identify a leak were:
For some case studies of real pipeline leakage investigations, low flight altitudes were most useful to locate leakages (Iwaszenko et al., 2021), while others use higher flight altitudes in the range of 40 m (Li et al., 2020). Automated mapping for drone based leak detection has been applied based on rectangular scan patterns with coarse and then fine resolution (Golston et al., 2018). Appropriate post-processing of the data is of high importance for identifying artificial leakages and natural sources (Barchyn et al., 2019; Ravikumar et al., 2019), including filtering for outliers due to highly or not reflecting surfaces, and, e.g., clustering the enhanced concentrations by means of machine learning (Iwaszenko et al., 2021).
For dedicated methane release experiments it is possible to measure the in situ methane concentration by deploying the inlet on the drone and linking it to the analyzer on ground (Shah et al., 2019), which is, however, not practical for the search of unknown leaks along a pipeline.
This article provides principal concepts for drone-based leak detection in Europe, however, it does not aim for emission rate quantification. It takes into account metrology requirements and environmental conditions (Sect. 2), and discusses different drone configurations (Sect. 3) and available methane sensors that fit in the weight, dimension and power constraints of drones (Sect. 4). Two concepts for drone-based pipeline leak monitoring are presented in Sect. 5, taking into account current legal requirements in Europe. An own example of drone-based methane measurements during a controlled release experiment in Poland illustrates the influence of wind direction variability (Sect. 6). Based on this, three scenarios of potential applications are presented in Sect. 7. Finally, the conclusions are provided in Sect. 8.
2 Metrology requirements for pipeline leak detection
For making use of drone-based leak detection it is an advantage to know the estimated distribution of methane for different environmental conditions. Sect. 2.1 describes the typical environmental conditions for which leak detection methods are developed in the following. Two different theoretical approaches of Gaussian distribution are used to describe suitable flight patterns for an in situ point sensor (Sect. 2.2), and for a path-integrating sensor (Sect. 2.3). Throughout the article, concentrations are provided in ppm, referring to volumetric concentrations. For simplicity, flow rates are given in L
2.1 Environmental conditions for pipeline leak detection
For drone-based methane detection, environmental conditions have to be taken into account (Ali et al., 2020). For remote sensing devices based on laser absorption, typically a total reflection of the ground, turbulent atmospheric conditions, which means vertical mixing, and Gaussian dispersion of the plume are assumed (Li et al., 2020). Other flux methods can be used when the plume is non-Gaussian in shape, or assumed not to be.
However, already for relatively low wind speed exceeding 4.5 m
While focusing on smaller leaks with a correlated increase in costs with size less than on huge hazardous leaks the leak investigations are less time critical and weather dependent. For that reason the concepts described within the paper focus on conditions of release rates normally between 2.5 and 500 L
2.2 Estimated methane concentration and distribution for point measurements
The model Ventjet (Miller et al., 2021) is used in the following for the characterization of the methane plume induced by a release from a pipeline above ground and for in situ point concentration measurements. The expected plume properties are necessary to define the main requirements for drone-based pipeline leak detection in terms of drone flight capabilities and detection thresholds. Thus the methane dispersion was studied taking into account several conditions of release (initial methane pressure, leak diameter) and weather (e.g., wind speed, atmospheric stability).
The following conditions were studied, motivated by the own release experiment described in Sect. 6.
• Weather conditions commonly investigated in hazard studies considering atmospheric stability classes according to Gifford (Gifford, 1976)
- 3F: wind speed at 3 m
- 5D: wind speed at 5 m
• Additionally studied weather conditions
- 1F: wind speed at 1 m
• Several methane concentration targets from 1 ppm to 15%
• Methane pressure in the pipeline from 2 bar to 85 bar
• Leak hole diameters:
− 0.35 mm for very small leak in case of tightness default, leaking connection
− 4 mm for intermediate leak
− 12 mm for small breach potentially caused by construction defect, material defect, or corrosion
−70 mm for medium breach due to third party works for instance
• Methane release flow rates:
- from 2.4 L
- with a specific focus on the range from 25 to 500 L
• Release location: at 1 m and 7.2 m altitude above ground
Pipeline full-bore rupture - which leads to catastrophic consequences - was not considered because these preliminary calculations were focused on the definition of the smallest methane concentrations to be detected by the system.
Ventjet, an engineering model dedicated to atmospheric dispersion of various gases, which provides some significant enhancements compared to the dispersion model PHAST (DNV-GL, 2014), was used to define methane plume characteristics considering the parameters described above. Indeed, Ventjet takes into account various weather condition profiles, namely, neutral D and stable F, wind speed and orientation, ground effect.
Preliminary calculations were carried out based on this approach. The main parameters considered are: an upward vertical release orientation and a surface roughness coefficient of 0.18, which is an intermediate value, recommended for an industrial environment.
Among the calculations performed, Table 1 presents horizontal and vertical distances - respectively represented by
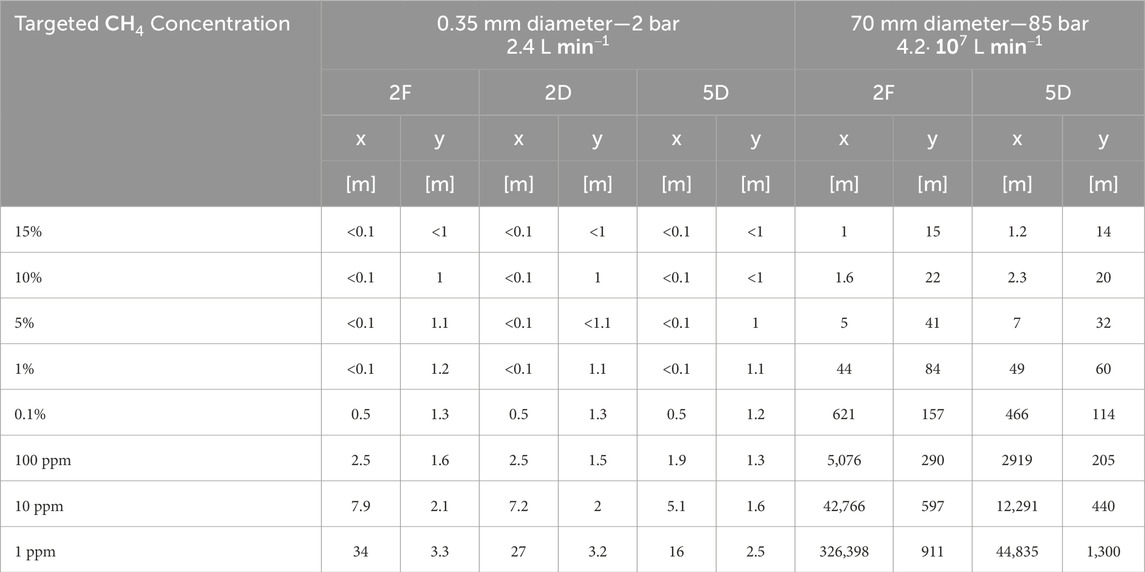
Table 1. Calculated horizontal distance (
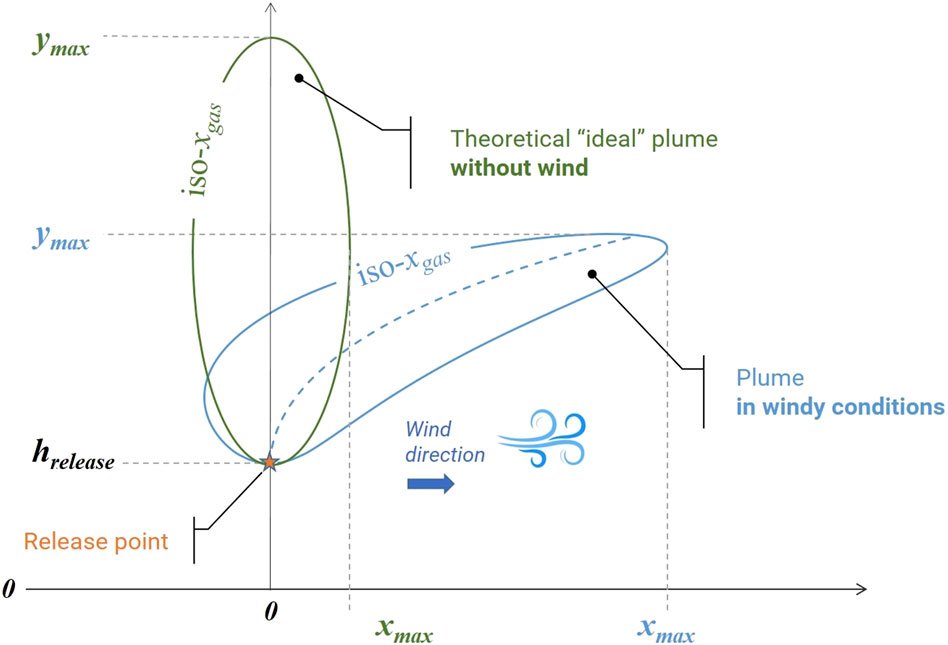
Figure 1. Theoretical plume shape for a buoyant gas depending on different wind conditions.
As a result, for the smallest studied leak - i.e. 2.4 L
Weather conditions and wind speed have a significant impact on methane dispersion and the shape of the plume (see Table 1). Thus without wind the plume will be vertically-oriented, not very wide but very high, compared to a windy weather which will induce a horizontal inclination of the plume leading to a horizontal
The inclination and shape of the plume will depend on the release flow rate as well. In addition to the sensitivity of the embedded sensor for methane detection, these conditions will have to be considered for the flight pattern of the drone and thus achieve fine localization of the release point on the pipeline.
In this way, complementary calculations were carried out considering the flight altitude of the drone for the tests with a tighter release flow rates range from 25 L
For easier understanding, the considered parameters and calculated values in Table 2 are represented in Figure 2.
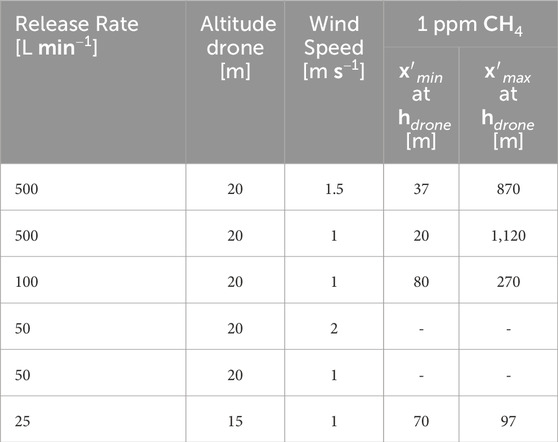
Table 2. Horizontal minimum and maximum calculated distances from the release point for a targeted
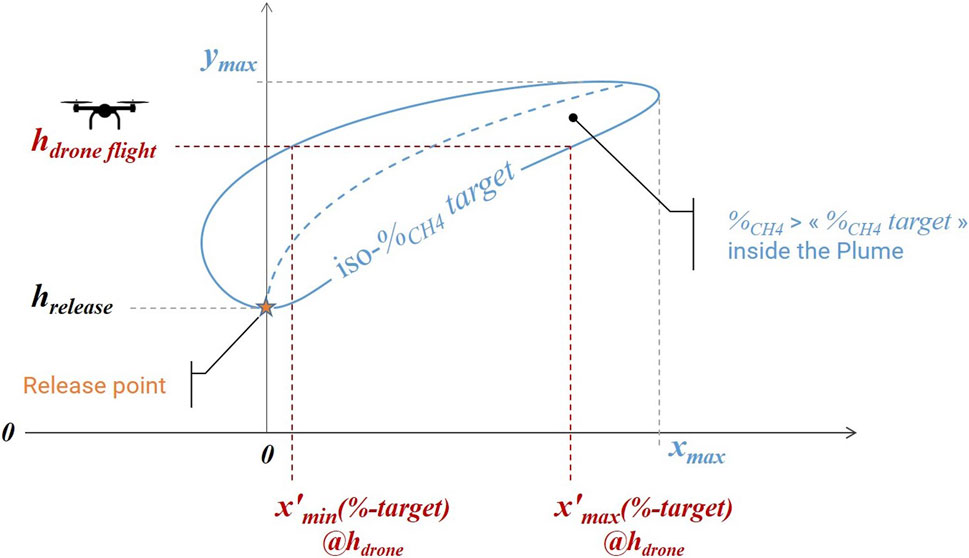
Figure 2. Horizontal minimum and maximum calculated distances for a targeted
• if distance
• if
• if distance
Table 2 gives calculated
At 20 m altitude, 1 ppm of
To complete these calculations, Table 3 gives maximum
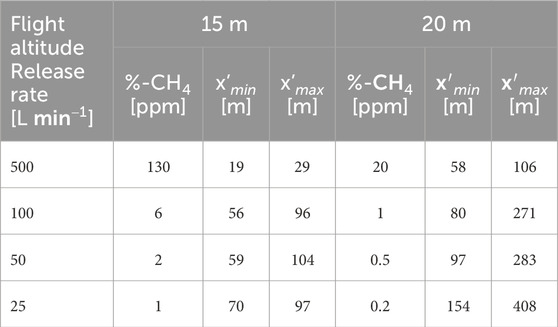
Table 3. Maximum
The theoretically calculated values reported in Table 3 provide only indicative but valuable information for drone flight pattern definition and the required sensor sensitivity range.
2.3 Leak modeling with dispersion model for path-integrating measurements
To better understand dispersion properties of methane pipeline leaks, three different emission rates (2.5 L
For all the emission scenarios modelled a point source with a diameter of 1.25 cm at a height of 7.2 m was used, these parameters were selected to try and correspond with the controlled release configuration (Table 4). For all the emission scenarios the gas composition was assumed to be pure methane. For all the simulations runs, a constant wind direction of 225° was assumed, and a range of different wind speeds was investigated (1.5 m
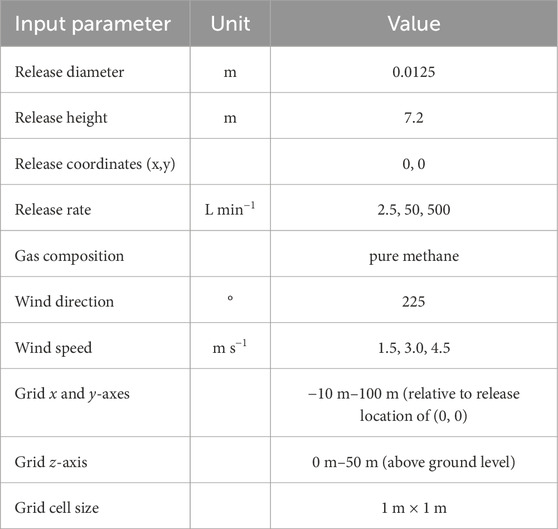
Table 4. Selected input parameters for the model ADMS used within the study.
The primary purpose of the dispersion modelling study was to simulate the expected results from the drone testing within this study. In this study, the drone can be considered the measurement platform. The drone utilised a handheld methane detector, LaserMethane mini, see Sect. 6.1, notably this instrument can only measure the path-integrated concentration (ppm
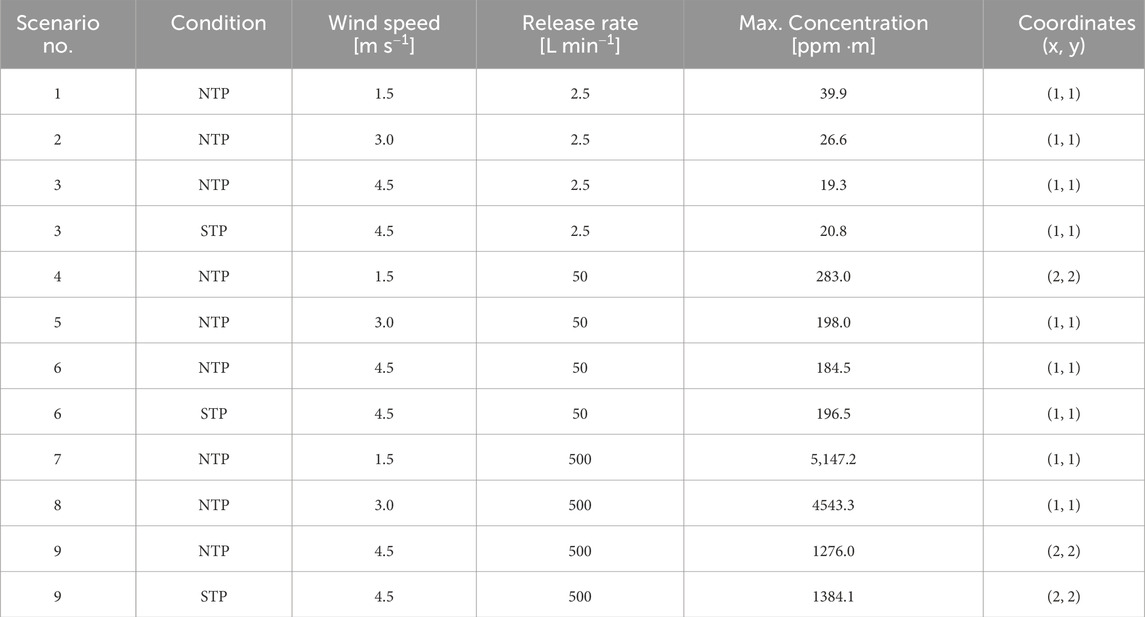
Table 5. Maximum path-integrated concentrations and the associated (x, y) coordinates for the various emission scenarios.
It should be noted an assumption has been made that the point concentrations (in ppm) output from the model at 1 m separation is equivalent to the concentration path integral (ppm
As the release rate increases, the maximum path-integrated concentration also increases, as would be expected. In general, the trend maximum path-integrated concentration shows an inverse correlation with wind speed. It is also seen from Table 5 that for the equivalent volumetric flow rates at STP larger maximum concentrations were simulated. For all of the emission scenarios modelled at both conditions (NTP and STP), a maximum concentration between 6.5% and 8.5% higher was observed for the STP conditions, unsurprisingly this reflects the differences in density and, hence, the mass emission rates modelled.
Modelled aerial maps of the path-integrated concentrations are used to visualise the emission scenarios: Figure 3 shows Scenario 1 and Scenario 3 at the minimum leak size of 2.5 L
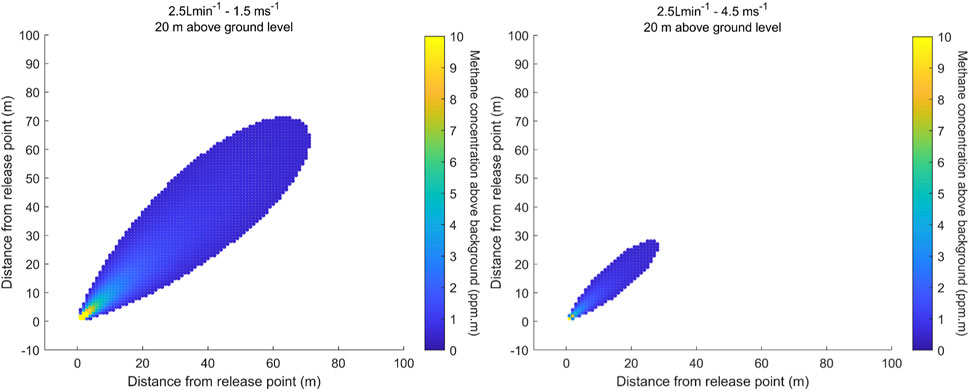
Figure 3. Horizontal distribution of methane path-integrated concentration above background in [ppm
Figure 4 shows the results for a wind speed of 4.5 m
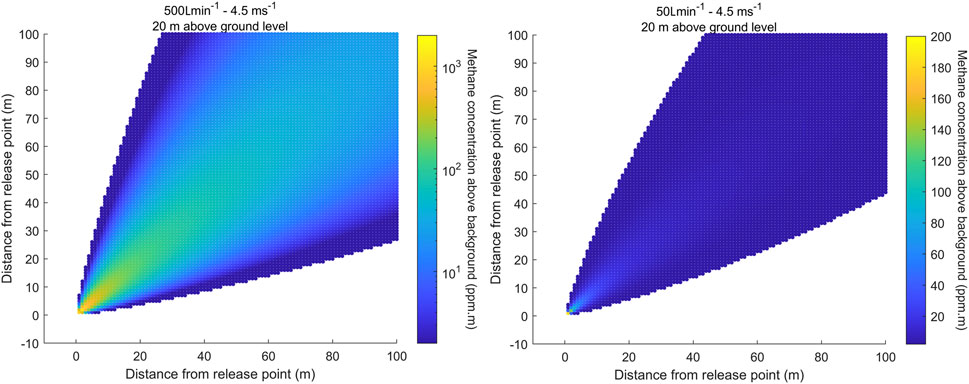
Figure 4. Horizontal distribution of methane path-integrated concentration above background in [ppm
2.4 Sensitivity requirements
The sensitivity of an instrument to be used for leak detection has to be considered in order to perform accurate and reliable measurements, as well as the measurement rate. Previous drone-based methods have published a leak sensitivity in the range of 5.8 L
Table 5 provides an overview of the required sensitivity, which strongly depends on leak rates, wind speed and drone mission parameters, like distance and altitude. For example, for low wind speed of 1 m
In terms of an efficient airborne platform for monitoring long linear assets, fixed wing drones are perhaps more appropriate than rotary wing drones, but these have minimum air speed and safe altitude requirements, meaning that sensors need to measure sufficiently frequently over the expected path length.
3 Drones
There is a variety of drones which may be used for leak detection, all associated with different advantages and disadvantages. The application of drones for leak detection depends on many parameters which have to be taken into account. There are relations between technical and operational requirements, which are associated with different level of cost.
Technical parameters that have to be considered include the type of drone, drone size and mass, the technical complexity and safety level of the drone, propulsion system and battery or fuel capacity. But also the sensor characteristics like size, mass, sampling rate as well as sensitivity influence the bounding and therefore the usability of the technology.
Operational parameters comprise the targeted leak size or intensity, the resulting gas distribution and concentration, the time-critical requirements, environmental conditions of operations, endurance and the required safety level.
The overall cost for drone-based leak detection is strongly influenced by the cost of the drone and sensors, size of the area to be surveyed, system development, system maintenance, crew education and training, crew size, airworthiness and approvals.
For example, to be able to fly beyond visual line of sight (BVLOS) for efficient monitoring, a higher level of robustness has to be fulfilled, including redundancy in mechanical and electric systems and control links, which results in higher cost. Another obvious dependency is the size of payload, respectively sensor. Smaller, lighter sensors only need smaller drone platforms with low air and ground impact risk in case of an accident, which means low drone costs and low regulatory costs, but also low endurance and low precision of the measurements. Both examples illustrate the interdependence between technical, operational and economical parameters.
On a first glance, fixed wing drones are more suitable for routine surveillance, leveraging the fact they can fly for long distances efficiently. Multi-rotors can be used efficiently for follow-up inspections in defined areas. In both cases appropriate sensors need to be used. For fixed wing drones a path integrating sensor with a high sampling rate is more appropriate than a point concentration detector, because the airspeed is high (
3.1 Rotary wing drones
Rotary wing drones (multicopters) are quite common because of their simple technical structure and flight controls. The vertical takeoff and landing makes them easy to use. There are commercially available systems, like the DJI Matrice 600, which can carry several kg of payload.
The main disadvantage of using rotary drones is the need of producing the lift out of the downwash. This means they need a lot of energy even to hover. Normal flight times are between 10–30 min for electrically powered drones, which results in only small distances covered per flight and per day (Li et al., 2020). Another disadvantage for atmospheric applications is the downwash, which disturbs the atmosphere to be investigated below. This requires a careful choice of the placement of the sensor on the drone, in particular for in situ sensors. The optimal sensor location interacts with the drone mission: For vertically profiling the atmosphere, sensors or at least the inlet can be placed above the rotor area, and only data obtained during ascent are used for analyses (Bretschneider et al., 2022). For drones moving forward with a certain speed, a suitable sensor location can be between the two rotors oriented forward in flight direction (Smith et al., 2016). The flight strategy can be adapted to the mission. For example, investigating in a suspected point source a zigzag pattern can be flown (cp. Section 6). For routine monitoring along the pipeline, the airspeed and distance to the pipeline has to match with the sampling rate and sensitivity of the sensor and the plume width for a minimum leak size (cp. Section 2.3).
3.2 Fixed wing drones
Fixed wing drones have a structure that produces lift while flying through the air. Flying wings or common aircraft configurations are used to carry sensors with a propulsion system. The advantage is the lower energy consumption for flying that results in flight times of 30 min and more (Altstädter et al., 2015) depending on the type and size of fuel/battery. The disadvantage is the need of a takeoff and landing area or infrastructural support like a catapult or landing net (Bärfuss et al., 2022). With the higher minimum airspeed of fixed wing drones the flight strategy has to regard the sensor sampling rate, sensitivity and plume width as a result of the minimum leak size and weather condition. As a result normally these drones have to fly along the pipeline and more far away from the pipeline than rotary wing drones with a lower airspeed have to. For fixed wing drones a standard ratio of 1 kg payload and 5 kg system load can be assumed for first calculations. Regarding the wing size the minimum airspeed can be estimated with the lift equation.
3.3 Hybrid drones
Several concepts follow the principle of a hybrid fixed wing rotary drone. The disadvantages of fixed wing drones during takeoff and landing are avoided by adding rotors for vertical movement, and the negative aspect of the high energy consumption during cruise is reduced by applying the lift of a wing. The disadvantage with combining both capabilities is the lower payload mass, while requiring a higher structural mass, as well as the increasing drone complexity. Tilted wing concepts like TW-NEO (flyXdrive GmbH, Germany) or the tilted engine concepts like Wingcopter (Wingcopter, Germany) optimize the useable payload mass while increasing the complexity susceptibility. The optimization reduces the amount of engines by turning the existing engine from vertical rotation for take-off to horizontal rotation for thrust during cruise flight. Therefore, rotation mechanics for engines or wings are added and minimize the mass reduction. Furthermore, the engine-propeller-configuration has to be a compromise for the very different flight phases, respectively tasks of producing lift for low air inflow and thrust during high air inflow.
4 Sensors
Sensors for drone applications have to fulfil constraints concerning size, weight and power consumption. Typically, the overall payload for drone-based applications is in the range of up to several kg, depending on the drone type, dimensions, propulsion system, and drone category. High precision lightweight sensors are highly important for drone-based leak detection (Ali et al., 2020). Low-cost gas sensors, like semiconductor resistive sensors (e.g., MQ-4, (Core Electronics, 2022)) are especially small and lightweight, however, their sensitivity currently is not high enough for environmental leak detection applications (Honeycutt et al., 2019). Up until recently, the classical optical instruments which are often used in ground-based and airborne methane flux measurements, have been generally too large and heavy for drone applications (Picarro, 2022; LI-COR, 2022; Los Gatos, 2023).New solutions are provided by cheaper and more light-weight optical sensors, which can provide both the necessary detection limit and precision, as well as smaller size and weight, which makes them well suited for leak detection applications onboard drones (Schuyler and Guzman, 2017). For pipeline monitoring, real-time transmission of the
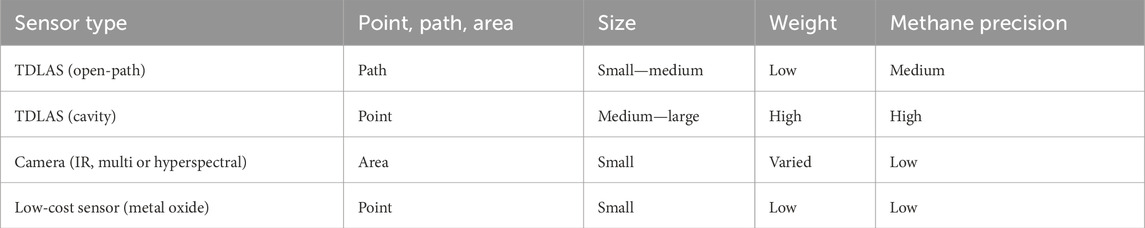
Table 6. Sensor types and indicative specifications at the time of writing. Note that this is an especially generalised perspective of sensor specifications, and that individual sensor performance may exceed (or fall below) the indications presented here.
4.1 Remote sensing
Tunable Diode Laser Absorption Spectrometers (TDLAS) operating in the 1.65
4.2 In situ sensing
In case of in situ sampling with TDLAS, an optical cell has to be integrated into the sensor as well. The cell is usually a multi-pass cell with optical path length in the range of metres to kilometres. This path length may be considerably longer than the optical path lengths in case of open path sensors, thus achieving similar or greater sensitivity. The ABB-LGR Hoverguard operates in the near-infrared (1.65
For specific research projects, sensors have been developed by research institutes, e.g., a mid-infrared TDLAS sensor with an open multi-pass cell, using wavelength modulation spectroscopy, weight of 1.6 kg, size of 25 cm
5 Operational aspects
5.1 Regulatory requirements for drone surveys
In Europe, since 2021, drones can be operated in the different categories “open”, “specific”, and “certified” depending on the potential risk associated with the mission (European Commission, 2019).
The category “open” has the lowest risk, and requires the lowest level of robustness of the drone technology. For drone operations in the category “open”, no flight permissions from the authorities are required. The main restrictions are.
In Germany, the last restriction (VLOS) is defined by the regulations NfL 2022-1-2554 and means that flights are performed within a radius depending on the size of the drone (Attitude Line Of Sight - ALOS) and the weather conditions to detect other aircraft (Detection Line Of Sight - DLOS). ALOS is calculated with the Maximum Characteristic Dimension (CD) in meter for rotary drones
and for fixed-wing drones
DLOS is calculated by
The result is a maximum radius of 1.5 km. VLOS strongly limits surveys of long distances, like along transmission pipelines.
Drone flight operations which are not defined with in the “open” category, e.g., flights beyond visual line of sight (BVLOS), have to be categorized to the “specific” category. In the category “specific”, a flight permission from the responsible aviation authority of the home location of a company or institution is necessary. To obtain such a permission, the operator has to determine the risk of this particular mission at the specific location. The specific operation risk assessment (SORA) includes a ground risk and air risk evaluation based on the size and weight of the drone. Mitigation measures like strategic flight path planing, operational handling or technical solutions can reduce the risks. Based on the final risk a specific assurance integrity level (SAIL) is defined. Six levels are defined and correlate with an integrity from
The third category “certified” applies similar standards as for manned aircraft with full certification process, which is a costly and lengthy process, in contrast to the flexible drone technology. It focuses on large drones or drones carrying humans, like urban air mobility vehicles.
5.2 Routine survey
Routine surveys are planned in advance and cover certain parts of pipelines for regular monitoring. The aerial perspective helps to get a quick overview of the situation, in particular in combination with live transmission of camera images. Fast monitoring is possible compared to ground-based surveys. Compared to manned airborne surveys, a high degree of automation is possible with drones, e.g., precise regular patterns at predefined and low altitude. The flight trajectory can be along the pipeline, taking into account the displacement of potential leaks by the wind, transects across the pipeline on small scales, or scanning patterns by sensor orientation (Bretschneider and Shetti, 2014). Less environmental impact will be created compared to ground-based and manned aerial missions, if electrical propulsion is used. Operation beyond visual line of sight allows efficiently covering larger transects.
For this kind of mission, different concepts are suitable: If frequent automated inspections are required, it could be feasible to place different automated multicopter systems along the pipeline. Either regularly or on demand, they ascend from their docking station, perform the monitoring of a certain part of the pipeline, transfer real-time images and data to a central control facility, and return to their weather-proof station. The concept is cost-intensive due to the requirement of having multiple multicopter systems equipped with sensors available, and the installation of infrastructure along the pipeline. The concept is technologically feasible with a high degree of automation, and the missions are comparable to automated gathering of weather data with drones at specific locations, which is already done at a routine base for several cases (Leuenberger et al., 2020).
For covering larger distances, fixed wing or tilt wing systems are suitable. The typical flight time for electric propulsion is much higher compared to multicopters, as fixed wing systems are much more energy efficient, and can be made of lightweight structures. Therefore, distances in the range of 50–100 km or beyond can be covered without the need of recharging batteries (Schön et al., 2022). Here, the sensor response time has to be fast enough to provide sufficiently high spatial resolution for leak detection. In particular for small leaks and unfavourable environmental conditions (high wind), this poses a challenge for sensor detection limits (see Sect. 2.2).
In both cases a dedicated risk analysis and safety concept are required, to make sure that no damage can be done to uninvolved persons, infrastructure or the environment. The lighter the overall system, the less damage can be expected in case of an accident. With reasonable cost, drone-base automated monitoring is only possible for gathering and transmission pipelines in open terrain and away from settlements.
5.3 On demand missions
On demand missions are performed on short notice for specific and typically small areas. The deployment of drones has certain advantages for leak detection in this context: The aerial perspective and real-time data transfer provide a quick overview of the situation, with added value of camera images. Local deployment, in particular within line of sight, can be done flexibly, and under certain conditions, fulfilling the requirements of the open category, even without the need of a flight permission. In this case only short operation time is needed, which can be done with light multicopter platforms. This kind of mission requires a ground crew in the vicinity of the area of interest, who surveys the mission and interprets the results based on real-time data. Altogether, the mission can be performed with high flexibility, a relatively simple multicopter system with easy handling, and without effort for regulations.
For this approach a suitable drone is a multicopter, in combination with a sensor of small size and weight, and sufficient accuracy.
6 Experiences from a methane release experiment
To gain experience with the capabilities of a small drone and a lightweight sensor for leak detection, the SToR
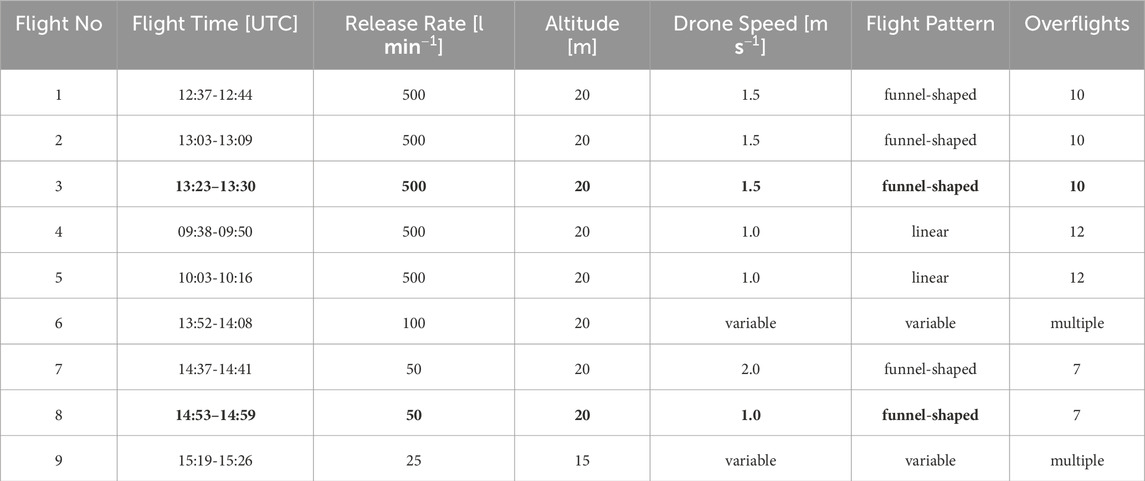
Table 7. Overview of the flights performed during the release experiment with the flight time, the respective
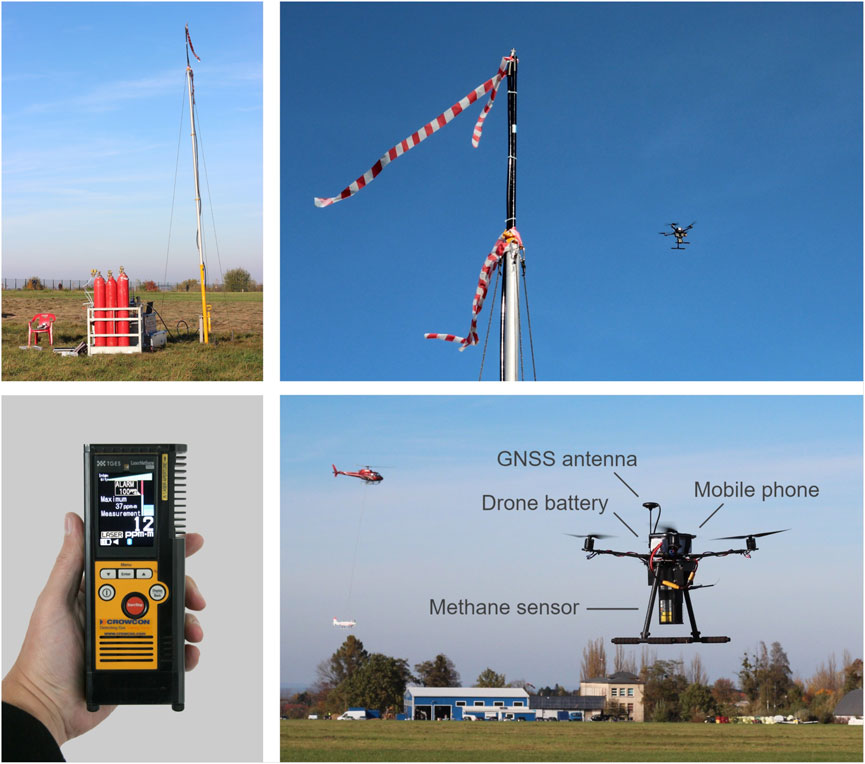
Figure 5. Setup of release experiment: Methane released from a nozzle at 7.2 m above ground (top-left). The drone flew a pre-designed pattern in the proximity of the release nozzle (top-right). The handheld methane detector Laser Methane mini (bottom-left) used as a sensor on the drone SToR
6.1 Methane detector
For the release experiment the handheld methane detector Laser Methane mini (Kimbrel et al., 2019; Tokio Gas Engineering Solutions, 2022) was used as a sensor. In the setup of Bretschneider and Shetti (2014), it was suggested to deploy two of the Laser Methane Mini systems on a gimbal in scanning mode. The 600 g TDLAS-based sensor measures the methane concentration times the distance between itself and a reflective surface in ppm
6.2 Drone configuration
For the SToR
6.3 Flight patterns and measurements
For sensing the methane plume, the drone flew a pre-designed pattern downstream of the release nozzle. Two different flight patterns were designed for the release experiment: One was repeated linear flights across the expected plume, which is perpendicular to the wind direction. The second was a funnel-shaped flight pattern, with meander transects of increasing length with distance perpendicular to the main wind direction. The flight legs were separated around 5 m. Flights were performed at horizontal distances up to 60 m from the release site. At any time, the drone was flying well above the expected plume at an altitude of 15 m or 20 m, within the range limit given by the manufacturer.
During the experiment a total of 9 flights were performed with the SToR
Figure 6 shows the observed methane concentration along the flight path and the variability over the measurement time period of several minutes. The methane plume is evident from an enhanced concentration for each transect, with generally decreasing concentrations with distance. This is expected due to dispersion effects (see Figure 4). Also for the lower release rate, the methane plume can be identified for each flight leg.
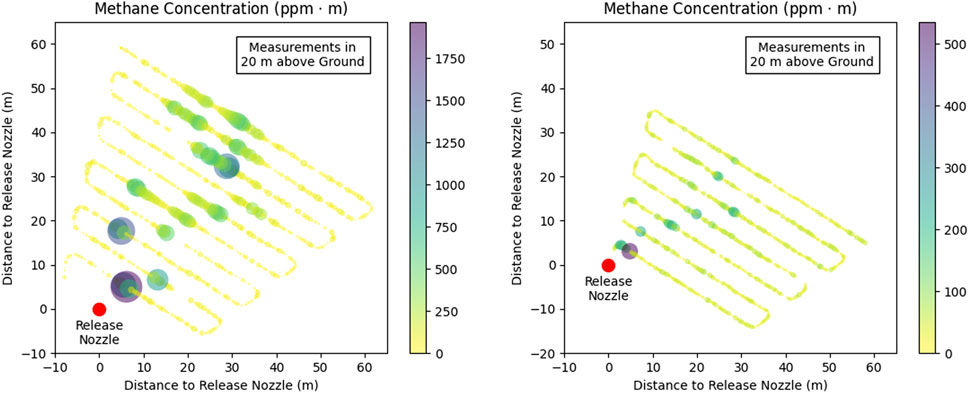
Figure 6. Flight patterns and observed column methane concentrations along the flight track for Flight 3 (release rate 500 L
The horizontal distribution of the methane plume suggests a variability of the wind direction between 211° and 254° for Flight 3 and between 204° and 250° for Flight 8 within the flight duration of 7 min and 6 min, respectively. This variability strongly influences the measured concentrations, and sometimes the plume is distributed over larger sectors. Parallel measurements to Flight 3 were obtained with the helicopter borne meteorological sonde HELiPOD (Pätzold et al., 2023), which measured an averaged wind speed of 5.7 m
The maximum path integrated concentrations were around 1,500–1700 ppm
6.4 Approximate determination of release rates
According to the Gauss’s theorem, the surface integral of a vector field over a closed surface (net flux through the surface) is equal to the volume integral of the divergence over the space enclosed by that surface (sum of all sources and sinks). The theorem can easily be applied to the local conditions during the release experiment: As illustrated in Figure 7, the methane flux
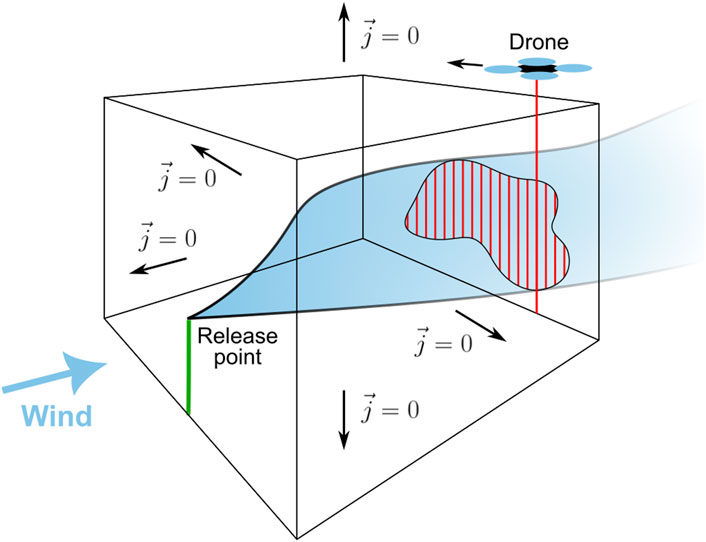
Figure 7. Illustration of the release rate estimation based on a path-integrating sensor on the drone.
To calculate an approximate methane flux through the downwind surface, the drone with the TDLAS-based methane sensor flies across the plume as indicated in the illustration. The sensor points downwards and provides the methane column concentration in ppm
During Flight 4 of the experiment, the drone flew back and forth along a linear pattern at a speed of 1 m
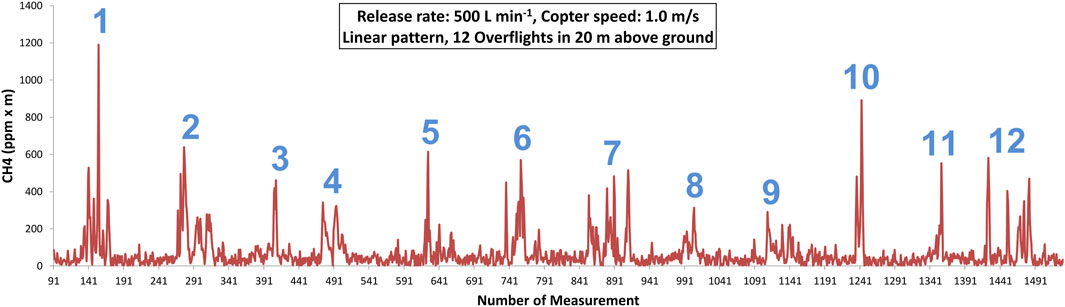
Figure 8. Column methane concentrations observed by the SToR
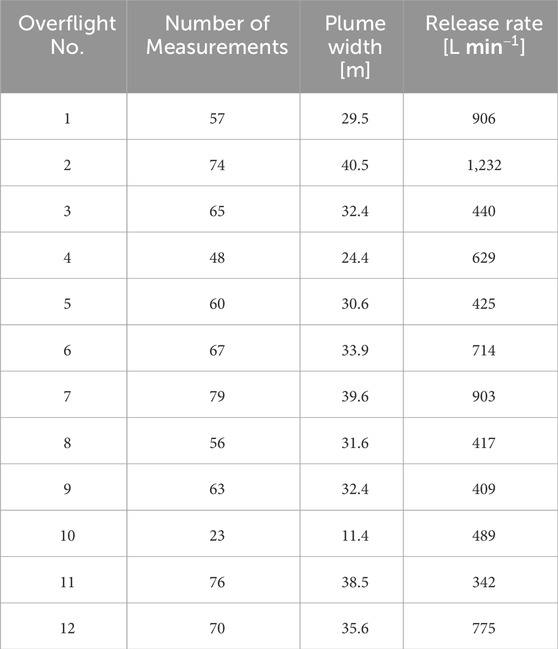
Table 8. Release rates and the observed width of the plume calculated for each overflight during Flight 4.
The quality of such estimates strongly depends on the variability in wind speed and direction as well as the strength of a possible wind sheer that has not been considered so far, as also shown by Wolff et al. (2021). The assumption that all of the released methane passes through the surface in which the drone measurements take place may also not be valid for strongly varying wind directions. Another aspect is the mixture process, that can vary with turbulence and wind speed. These effects as well as the impact of the changing drone attitude and resulting angle of measurement beam and the sensor characteristic itself will be investigated and published in another paper.
7 Potential drone-based leak detection scenarios
In the following, three different scenarios are described how drones may be used for pipeline leakage monitoring. They are very different in complexity and cost, which may be important factors for industrial applications in addition to the accuracy of the measurements (Barchyn et al., 2019).
7.1 Scenario 1: Drone-based support of helicopter missions by trained personnel in the near field
For on demand leakage detection in a relatively small pipeline section (up to few km), it is possible to enhance helicopter missions by drone measurements with an experienced drone operator as described in Sect. 5.3. It is technically feasible, assuming that a suitable sensor is available. Highly automated operations are not required, but instead, the mission is controlled by trained personnel. The overall efficiency strongly depends on the endurance of the drone, the requirements concerning sensitivity, and the terrain for VLOS conditions. However, cost is associated with qualification and training of the operator or crew, and maintenance of the drone and sensors. If the mission is performed in the “open” category, the condition of line of sight leads to frequent changes of location of the operator. Smaller copters generally have a lower endurance and require frequent change of batteries. In comparison with helicopter missions, the payload capacity is much smaller, therefore it is not possible to use highly accurate sensors with enhanced weight. An open question is the minimum detection level of the sensors, in order to identify also leaks of small size and under unfavourable ambient conditions, as explained in Sect. 2.1. Nevertheless, this application can help to identify and confirm medium sized leaks near gathering stations or in a leak suspected areas but not for routine pipeline surveys. Typical performed trajectories are crosswind patterns, like applied exemplarily during the release experiment (see Sect. 6).
7.2 Scenario 2: replacement of helicopter missions by BVLOS flights with fixed-wing or tilt rotor in the far field (
For on demand or regular monitoring of pipeline sections of several km to around 100 km, it is possible to replace helicopter missions by drones. For such distances, it is an advantage to deploy fixed-wing or tilt wing systems with larger endurance, which cover longer transects of pipelines. With electric propulsion, there are less emissions than for helicopter operation. However, for BVLOS flights, the requirements concerning technical performance, in particular robustness, redundancy and level of safety, are much higher compared to VLOS flights. The operating company has to perform a risk assessment and fulfill criteria for the level of robustness in different categories to obtain a flight permission. This financial, technical and operational effort is only justified for regular use of the systems, like for a service provider specialized in BVLOS operations. Also for BVLOS operations, the sensor accuracy and resolution is critical in order not to miss leakages, and the flight planning should take into account wind speed and wind direction for adapting the distance and altitude, as exemplarily indicated in Table 2, 3. Typical trajectories will be along the pipeline within a lateral deviation (
7.3 Scenario 3: Routine automated survey flights for specific small pipeline sections
For frequent and regular monitoring, it is possible to deploy highly automated survey drones, each responsible for a certain section or critical parts of the pipeline. This enables to observe and react to gradual changes with time, like the deterioration of leakages. In this case the drones belong to the pipeline, and need storage shelters for automatic charging. They are released regularly to perform the task, transmit live data to the central control station, and return to their home base. The permission for well-determined operation areas and missions are easier to get than for flexible deployment as described in Scenario 2. The flight pattern can be optimised to take into account environmental conditions, like wind direction. However, the effort is large, as infrastructure for the charging stations has to be set up and maintained, the drones require a high level of safety for automated missions, and have to be checked regularly, as they are exposed to ambient weather conditions.
Given the focus on the monitoring of long linear assets, fixed wing drones clearly have an advantage over rotary wing drones in terms of energy efficiency (energy required per meter or km of pipeline surveyed). However, because of the flight profiles of fixed wings (minimum speed and altitude compared to rotary wing drones) the sensors they use to detect leaks need to be appropriate—relatively high frequency and downward pointing open path instruments are likely most suited. A suitable solution could be the deployment of rotary wing drones as sensing devices once there is an indication of methane emissions in a defined location.
8 Conclusion
The modeling results can be used to derive sensor requirements. The Ventjet model from Sect. 2.2 shows the plume distribution for representative wind situations, mixture processes and release rates. The dispersion model (see Sect. 2.3) shows results for the minimum reference leaks of 2.5 L
The release experiment in Sect. 6 underlines the requirements derived from the distribution models. With the release rate of huge leaks of 500 L
The in situ sensors shown in Sect. 4 already meet the requirements for detecting small leaks with an accuracy of 0.01 ppm (Golston et al., 2017). The disadvantage is that these sensors have to fly through the plume. In case of a minimum leak 2.5 L
In summary, pipeline leak detection by drones is feasible from a technological point of view of the drone systems. In terms of cost efficiency, which is required for industrial deployment, the application of drones strongly depends on the individual scenario and conditions of operations. Currently local observations of leaks within VLOS or near-BVLOS is the state of the art, but limited by the sensor technology - in particular the accuracy and measurement frequency. Replacing manned helicopter observations for large parts of the 200,000 km pipeline grid is currently limited by the sensor technology and costs for system integrity and operational handling resulting from regulations. It can be expected that with the growing market of drones and applications (SESAR JU, 2016), more specialised companies will be able to offer drone-based surveys for different scenarios.
Data availability statement
The raw data supporting the conclusions of this article will be made available by the authors, without undue reservation.
Author contributions
LB: Conceptualization, Investigation, Methodology, Project administration, Resources, Supervision, Validation, Visualization, Writing–original draft, Writing–review and editing. SB: Data curation, Formal Analysis, Investigation, Validation, Visualization, Writing–original draft, Writing–review and editing. DH-A: Data curation, Formal Analysis, Investigation, Methodology, Software, Visualization, Writing–original draft, Writing–review and editing. JS: Data curation, Formal Analysis, Methodology, Software, Validation, Visualization, Writing–original draft, Writing–review and editing. NH: Conceptualization, Data curation, Methodology, Project administration, Software, Validation, Visualization, Writing–original draft, Writing–review and editing. LN: Writing–original draft, Writing–review and editing. RR: Funding acquisition, Methodology, Project administration, Resources, Supervision, Writing–original draft, Writing–review and editing. JH: Investigation, Project administration, Writing–original draft, Writing–review and editing. ML: Conceptualization, Data curation, Investigation, Writing–original draft, Writing–review and editing. JN: Conceptualization, Funding acquisition, Project administration, Writing–original draft, Writing–review and editing. AP: Methodology, Writing–original draft, Writing–review and editing. VE: Conceptualization, Funding acquisition, Project administration, Writing–review and editing. AL: Conceptualization, Formal Analysis, Funding acquisition, Investigation, Methodology, Project administration, Resources, Supervision, Validation, Writing–original draft, Writing–review and editing.
Funding
The author(s) declare that financial support was received for the research, authorship, and/or publication of this article. This research was funded by the EU project EMPIR Grant Agreement 20IND10 Decarb. The release experiment was conducted by the German Aerospace Center (DLR), who has been funded in the framework of UNEP′s International Methane Emissions Observatory (IMEO). We acknowledge the support by the Open Access Publication Funds of the Technische Universitaet Braunschweig.
Acknowledgments
The authors would like to thank NPL for sharing the LaserMethane Mini sensor for the release experiment.
Conflict of interest
Author DH-A was employed by Air Liquide.
The remaining authors declare that the research was conducted in the absence of any commercial or financial relationships that could be construed as a potential conflict of interest.
Publisher’s note
All claims expressed in this article are solely those of the authors and do not necessarily represent those of their affiliated organizations, or those of the publisher, the editors and the reviewers. Any product that may be evaluated in this article, or claim that may be made by its manufacturer, is not guaranteed or endorsed by the publisher.
Supplementary material
The Supplementary Material for this article can be found online at: https://www.frontiersin.org/articles/10.3389/frobt.2024.1426206/full#supplementary-material
References
ADLARES (2023). ADLARES. Advanced Laser Remote Sensors. Available at: https://www.adlares.com/en/ (Accessed on December 3, 2023).
Ali, N. B. H., Abichou, T., and Green, R. (2020). Comparing estimates of fugitive landfill methane emissiosn using inverse plume modeling obtained with Surface Emission Monioring (SEM), Drone Emission monitoring (DEM), and Downwind Plume Emission Monitoring (DWPEM). J. Air Waste Manag. Assoc. 70 (4), 410–424. doi:10.1080/10962247.2020.1728423
Altstädter, B., Platis, A., Wehner, B., Scholtz, A., Wildmann, N., Hermann, M., et al. (2015). ALADINA – an unmanned research aircraft for observing vertical and horizontal distributions of ultrafine particles within the atmospheric boundary layer. Atmos. Meas. Tech. 8, 1627–1639. doi:10.5194/amt-8-1627-2015
Andersen, T., Scheeren, B., Peters, W., and Chen, H. (2018). A UAV-based active AirCore system for measurements of greenhouse gases. Atmos. Meas. Tech. 11, 2683–2699. doi:10.5194/amt-11-2683-2018
Barchyn, T. E., Hugenholtz, C. H., and Fox, T. A. (2019). Plume detection modeling of a drone-based natural gas leak detection system. Elem. Sci. 7, 41. doi:10.1525/elementa.379
Bärfuss, K., Dirksen, R., Schmithüsen, H., Bretschneider, L., Pätzold, F., Bollmann, S., et al. (2022). Drone-based atmospheric soundings up to an altitude of 10 km - technical approach towards operations. Drones 6, 404. doi:10.3390/drones6120404
Benyeogor, M., Olatunbosun, A., and Kumar, S. (2020). Airborne system for pipeline surveillance using an unmanned aerial vehicle. Eur. J. Eng. Res. Sci. 5, 178–182. doi:10.24018/ejers.2020.5.2.1761
Bogner, J., and Matthews, E. (2003). Global methane emissions from landfills: new methodology and annual estimates 1980–1996. Glob. Biogeochem. Cycles 17, 1065. doi:10.1029/2002GB001913
Bogner, J., Spokas, K., Burton, E., Sweeney, R., and Corona, V. (1995). Landfills as atmospheric methane sources and sinks. Chemosphere 31 (9), 4119–4130. doi:10.1016/0045-6535(95)80012-A
Bretschneider, L., Schlerf, A., Baum, A., Bohlius, H., Buchholz, M., Düsing, S., et al. (2022). MesSBAR - multicopter and instrumentation for air quality research. Atmosphere 13, 629. doi:10.3390/atmos13040629
Bretschneider, T. R., and Shetti, K. (2014). “UAV-based gas pipeline leak detection,” in Proceedings of the 35th asian conference on remote sensing, nay pyi taw (Nay Pyi Taw, Myanmar: Myanmar), 27–31. Available at: https://www.proceedings.com/25565.html.
Chen, Z., Jacob, D. J., Gautam, R., Omara, M., Stavins, R. N., Stowe, R. C., et al. (2023). Satellite quantification of methane emissions and oil–gas methane intensities from individual countries in the Middle East and North Africa: implications for climate action. Atmos. Chem. Phys. 23, 5945–5967. doi:10.5194/acp-23-5945-2023
Core Electronics (2022). Methane CNG Gas Sensor - MQ-4. Available at: https://core-electronics.com.au/methane-cng-gas-sensor-mq-4.html (Accessed on February 22, 2024)
DNV-GL (2014). Unified dispersion model theory, supporting documentation for PHAST software package. Available at: https://www.dnv.com/software/services/phast/index.html (Accessed on April 12, 2021).
Dowd, E., Manning, A. J., Orth-Lashley, B., Girard, M., France, J., Fisher, R. E., et al. (2023). First validation of high-resolution satellite-derived methane emissions from an active gas leak in the UK. EGUsphere. [preprint]. doi:10.5194/egusphere-2023-2246
Dutzik, T., Scarr, A., and Casale, M. (2022). Methane Gas Leaks - frequent leaks are resulting in death, injury and other damage to our health and environment. NCPIRG Educ. Fund. Available at: https://publicinterestnetwork.org/wp-content/uploads/2022/05/Methane-Gas-Leaks-Frequent-leaks-are-resulting-in-death-injury-and-other-damage-to-our-health-and-environment.pdf.
DVGW (2012). DVGW G 501:2012-05. Airborne remote gas detection. Bonn: DVGW. Available at: https://www.dinmedia.de/en/technical-rule/dvgw-g-501/153758419
European Commission (2019). Commission implementing regulation (EU) 2019/947. Available at: http://data.europa.eu/eli/reg_impl/2019/947/oj (Accessed on April 24, 2024).
European Union Agency for the Cooperation of Energy Regulators (ACER) (2023). Gas Factsheet. Available at: https://www.acer.europa.eu/gas-factsheet (Accessed on June 8, 2023).
European Union Aviation Safety Agency (EASA) (2024). Predefined risk assessment (PDRA). Available at: https://www.easa.europa.eu/en/domains/civil-drones-rpas/specific-category-civil-drones/predefined-risk-assessment-pdra (Accessed on April 24, 2024).
Förster, E., Huntrieser, H., Lichtenstern, M., Pätzold, F., Bretschneider, L., Lampert, A., et al. (2024). Quantifying methane emissions from industrial activities: a novel helicopter-borne application. Prep. Atmos. Meas. Tech.
Gålfalk, M., Påledal, S. N., and Bastviken, D. (2021). Sensitive drone mapping of methane emissions without the need for supplementary ground-based measurements. ACS Earth Space Chem. 5, 2668–2676. doi:10.1021/acsearthspacechem.1c00106
Global Energy Monitor (2023). Global gas infrastructure tracker. Available at: https://globalenergymonitor.org/projects/global-gas-infrastructure-tracker/ (Accessed on December 3, 2023).
Golston, L. M., Aubut, N. F., Frish, M. B., Yang, S., Talbot, R. W., Gretencord, C., et al. (2018). Natural gas fugitive leak detection using an unmanned aerial vehicle: localization and quantification of emission rate. Atmosphere 333, 333. doi:10.3390/atmos9090333
Golston, L. M., Tao, L., Brosy, C., Schäfer, K., Wolf, B., McSpiritt, J., et al. (2017). Lightweight mid-infrared methane sensor for unmanned aerial systems. Appl. Phys. B 123, 170. doi:10.1007/s00340-017-6735-6
Harris, S. J., Schwietzke, S., France, J. L., Velandia, N., Meixus Fernandez, T., Randles, C., et al. (2023). Revised methane emissions from the 2022 Nord Stream subsea pipeline leaks. Nat. Sci. Rep. submitted to.
Hollenbeck, D., Zulevic, D., and Chen, Y. (2021). Advanced leak detection and quantification of methane emissions using sUAS. Drones 5, 117. doi:10.3390/drones5040117
Honeycutt, W. T., Ley, M. T., and Materer, N. F. (2019). Precision and limits of detection for selected commercially available, low-cost carbon dioxide and methane gas sensors. Sensors 19, 3157. doi:10.3390/s19143157
ICI (2022). Tunable Diode Laser Spectrometer (TDLAS). Available at: https://infraredcameras.com/products/tunable-diode-laser-spectroscopy-tdlas(Accessed on August 02, 2022).
IEA (2023). Global methane tracker 2023. Paris: IEA. Available at: https://www.iea.org/reports/global-methane-tracker-2023 (Accessed February 7, 2023).
Intergovernmental Panel on Climate Change (IPCC) (2023). Climate change 2021—the physical science basis: working group. contribution to the sixth assessment report of the intergovernmental panel on climate change. Cambridge, United Kingdom: Cambridge University Press. doi:10.1017/9781009157896
Iwaszenko, S., Kalisz, P., Slota, M., and Rudzki, A. (2021). Detection of natural gas leakages using a laser-based methane sensor and UAV. Remote Sens. 13, 510. doi:10.3390/rs13030510
Jackson, R. B., Saunois, M., Bousquet, P., Canadell, J. G., Poulter, B., Stavert, A. R., et al. (2020). Increasing anthropogenic methane emissions arise equally from agricultural and fossil fuel sources. Environ. Res. Lett. 15, 071002. doi:10.1088/1748-9326/ab9ed2
Kamieniak, J., Randviir, E. P., and Banks, C. E. (2015). The latest developments in the analytical sensing of methane. Trac. Trends Anal. Chem. 73, 146–157. doi:10.1016/j.trac.2015.04.030
Kille, N., Chiu, R., Frey, M., Hase, F., Sha, M. K., Blumenstock, T., et al. (2019). Separation of methane emissions from agricultural and natural gas sources in the Colorado front range. J. Geophys. Res. 46 (7), 3990–3998. doi:10.1029/2019GL082132
Kimbrel, D. E., Balasbas, J., Zolnierek, J., Fallah, J., and Thibodeaux, C. (2019). Sampling of methane emissions detection technologies and practices for natural gas distribution infrastructure. An Educational Handbook for State Energy Regulators. Available at: https://pubs.naruc.org/pub/0CA39FB4-A38C-C3BF-5B0A-FCD60A7B3098 (Accessed on December 3, 2023).
Leuenberger, D., Haefele, A., Omanovic, N., Fengler, M., Martucci, G., Calpini, B., et al. (2020). Improving high-impact numerical weather prediction with lidar and drone observations. Bull. Am. Metall. Soc. 101 (7), E1036–E1051. doi:10.1175/bams-d-19-0119.1
Li, H. Z., Mundia-Howe, M., Reeder, M. D., and Pekney, N. J. (2020). Gathering pipeline methane emissions in utica shale using an unmanned aerial vehicle and ground-based mobile sampling. Atmosphere 11, 716. doi:10.3390/atmos11070716
LI-COR (2022). LI-7700 Open Path CH4 Analyzer. Available at: https://www.licor.com/env/products/eddy_covariance/LI-7700.html (Accessed on August 02, 2022).
Liu, Y., Paris, J.-D., Broquet, G., Bescós Roy, V., Meixus Fernandez, T., Andersen, R., et al. (2023). Assessment of current methane emissions quantification techniques for natural gas midstream applications. Atmos. Meas. Tech. Discuss. doi:10.5194/amt-2023-97
Los Gatos Research (2023). Greenhous gas analyzer CH4, CO2, H2O. Available at: https://www.lgrinc.com/analyzers/overview.php?prodid=23&type= (Accessed on August 02, 2022).
Maazallahi, H., Delre, A., Scheutz, C., Fredenslund, A. M., Schwietzke, S., Denier van der Gon, H., et al. (2023). Intercomparison of detection and quantification methods for methane emissions from the natural gas distribution network in Hamburg, Germany. Atmos. Meas. Tech. 16, 5051–5073. doi:10.5194/amt-16-5051-2023
McVay, R. (2023). Methane emissions from U.S. Gas pipeline leaks. Available at: https://www.edf.org/sites/default/files/documents/Pipeline%20Methane%20Leaks%20Report.pdf (Accessed on February 7, 2024).
Miller, D., Vyazmina, E., Shen, A., and Lutostansky, E. (2021). “Gone with the wind: Ventjet is a new engineering model for atmospheric dispersion,” in 2021 spring meeting and 17th global congress on process safety (Virtual). Available at: https://www.aiche.org/conferences/videos/conference-presentations/gone-wind-ventjet-new-engineering-model-atmospheric-dispersion.
Morales, R., Ravelid, J., Vinkovic, K., Korbeń, P., Tuzson, B., Emmenegger, L., et al. (2022). Controlled-release experiment to investigate uncertainties in UAV-based emission quantification for methane point sources. Atmos. Meas. Tech. 15, 2177–2198. doi:10.5194/amt-15-2177-2022
Nooralishahi, P., Lopez, F., and Maldague, X. (2021). A drone-enabled approach for gas leak detection using optical flow analysis. App. Sci. 11, 1412. doi:10.3390/app11041412
Pätzold, F., Bretschneider, L., Nowak, S., Brandt, B., Schlerf, A., Asmussen, M. O., et al. (2023). HELiPOD – revolution and evolution of a helicopter borne measurement system for multidisciplinary research in demanding environments. Elem. Sci. Anth. 11, 1. doi:10.1525/elementa.2023.00031
Picarro (2022). Methane (CH4). Available at: https://www.picarro.com/products/gas_concentration_analyzers/methane_ch4 (Accessed on 02 August 2022)
Pipeline Safety Trust: Pipeline Basics & Specifics About Natural Gas Pipelines (2015). Pipeline briefing paper #2. Available at: https://pstrust.org/wp-content/uploads/2015/09/2015-PST-Briefing-Paper-02-NatGasBasics.pdf (Accessed December 1, 2023).
Ravikumar, A. P., Sreedhara, S., Wang, J., Englander, J., Roda-Stuart, D., Bell, C., et al. (2019). Single-blind inter-comparison of methane detection technologies – results from the Stanford/EDF Mobile Monitoring Challenge. Elem. Sci. Anth. 7, 37. doi:10.1525/elementa.373
Roscioli, J. R., Yacovitch, T. I., Floerchinger, C., Mitchell, A. L., Tkacik, D. S., Subramanian, R., et al. (2015). Measurements of methane emissions from natural gas gathering facilities and processing plants: measurement methods. Atmos. Meas. Tech. 8, 2017–2035. doi:10.5194/amt-8-2017-2015
Schön, M., Suomi, I., Altstädter, B., van Kesteren, B., zum Berge, K., Platis, A., et al. (2022). Case studies of the wind field around Ny-Alesund, Svalbard, using unmanned aircraft. Polar Res. 41, 7884. doi:10.33265/polar.v41.7884
Schuyler, T. J., and Guzman, M. I. (2017). Unmanned aerial systems for monitoring trace tropospheric gases. Atmosphere 8, 206. doi:10.3390/atmos8100206
Sesar, J. U. (2016). European drones outlook study. Single Eur. Sky ATM Res. (November), 93. Available at: http://www.sesarju.eu/sites/default/files/documents/reports/Euro-pean_Drones_Outlook_Study_2016.pdf.
Shah, A., Allen, G., Pitt, J. R., Ricketts, H., Williams, P. I., Helmore, J., et al. (2019). A near-field Gaussian plume inversion flux quantification method, applied to unmanned aerial vehicle sampling. Atmosphere 10, 396. doi:10.3390/atmos10070396
Shaw, J. T., Shah, A., Yong, H., and Allen, G. (2021). Methods for quantifying methane emissions using unmanned aerial vehicles: a review. Phil. Trans. R. Soc. A 379, 20200450. doi:10.1098/rsta.2020.0450
Shirizadeh, B., Villavicencio, M., Douguet, S., Trüby, J., Bou Issa, C., Sokhna Seck, G., et al. (2023). The impact of methane leakage on the role of natural gas in the European energy transition. Nat. Commun. 14, 5756. doi:10.1038/s41467-023-41527-9
Smith, B., John, G., Stark, B., Christensen, L. E., and Chen, Y. Q. (2016). “Applicability of unmanned aerial systems for leak detection,” in Proceedings of the international conference on unmanned aircraft systems (ICUAS) (Arlington, VA, USA). Available at: https://ieeexplore.ieee.org/stamp/stamp.jsp?tp=&arnumber=7502635 (Accessed June 7, 2016).
Smith, C., Nicholls, Z. R. J., Armour, K., Collins, W., Forster, P., Meinshausen, M., et al. (2021). “The earth’s energy budget, climate feedbacks, and climate sensitivity supplementary material,” in Climate change 2021: the physical science basis. Contribution of working group I to the sixth assessment report of the intergovernmental panel on climate change. Editors V. Masson-Delmotte, P. Zhai, A. Pirani, S. L. Connors, C. Péan, S. Bergeret al. Available at: https://ipcc.ch/static/ar6/wg1.
Tokio Gas Engineering Solutions (2022). LaserMethaneMini (LMm) - technical specification. Available at: https://www.tokyogas-es.co.jp/en/business/eq/laser_methane_mini.html (Accessed on August 02, 2022).
Tokyo Gas Engineering Co., Ltd (2013). GasViewer manual. Available at: https://www.crowcon.com/wp-content/uploads/2018/12/GasViwer-Eng-manual.pdf (Accessed on April 30, 2024).
Ulrich, B. A., Mitton, M., Lachenmeyer, E., Hecobian, A., Zimmerle, D., and ans Smits, K. M. (2019). Natural gas emissions from underground pipelines and implications for leak detection. Environ. Sci. Technol. Lett. 6, 401–406. doi:10.1021/acs.estlett.9b00291
Ulrich, B. A., Mitton, M., Lachenmeyer, E., Hecobian, A., Zimmerle, D., and Smits, K. M. (2019). Natural gas emissions from underground pipelines and implications for leak detection. Environ. Sci. Technol. Lett. 6, 401–406. doi:10.1021/acs.estlett.9b00291
Wang, F., Maksyutov, S., Janardanan, R., Tsuruta, A., Ito, A., Morino, I., et al. (2022). Atmospheric observations suggest methane emissions in north-eastern China growing with natural gas use. Sci. Rep. 12, 18587. doi:10.1038/s41598-022-19462-4
Weller, Z. D., Hamburg, S. P., and von Fischer, J. C. (2020). A national estimate of methane leakage from pipeline mains in natural gas local distribution systems. Environ. Sci. Technol. 54 (14), 8958–8967. doi:10.1021/acs.est.0c00437
Wolff, S., Ehret, G., Kiemle, C., Amediek, A., Quatrevalet, M., Wirth, M., et al. (2021). Determination of the emission rates of CO2 point sources with airborne lidar. Atmos. Meas. Tech. 14, 2717–2736. doi:10.5194/amt-14-2717-2021
Yan, Y., Liang, Y., Zhang, H., Zhang, W., Feng, H., Wang, B., et al. (2019). A two-stage optimization method for unmanned aerial vehicle inspection of an oil and gas pipeline network. Petroleum Sci. 16, 458–468. doi:10.1007/s12182-019-0305-y
Keywords: drone, leak detection, methane, pipeline, SDG13, plume modeling, release experiment
Citation: Bretschneider L, Bollmann S, Houssin-Agbomson D, Shaw J, Howes N, Nguyen L, Robinson R, Helmore J, Lichtenstern M, Nwaboh J, Pogany A, Ebert V and Lampert A (2024) Concepts for drone based pipeline leak detection. Front. Robot. AI 11:1426206. doi: 10.3389/frobt.2024.1426206
Received: 30 April 2024; Accepted: 19 July 2024;
Published: 15 August 2024.
Edited by:
Franziska Kirstein, Blue Ocean Robotics, DenmarkReviewed by:
Derek Hollenbeck, University of California, Merced, United StatesUmair Liaquat Qureshi, Universal Robots, Denmark
Copyright © 2024 Bretschneider, Bollmann, Houssin-Agbomson, Shaw, Howes, Nguyen, Robinson, Helmore, Lichtenstern, Nwaboh, Pogany, Ebert and Lampert. This is an open-access article distributed under the terms of the Creative Commons Attribution License (CC BY). The use, distribution or reproduction in other forums is permitted, provided the original author(s) and the copyright owner(s) are credited and that the original publication in this journal is cited, in accordance with accepted academic practice. No use, distribution or reproduction is permitted which does not comply with these terms.
*Correspondence: Lutz Bretschneider, bC5icmV0c2NobmVpZGVyQHR1LWJyYXVuc2Nod2VpZy5kZQ==
†ORCID: Volker Ebert, orcid.org/0000-0002-1394-3097