 Enrique Orduna-Malea
 Emilio Delgado López-Cózar
94% of researchers rate our articles as excellent or good
Learn more about the work of our research integrity team to safeguard the quality of each article we publish.
Find out more
ORIGINAL RESEARCH article
Front. Res. Metr. Anal., 22 December 2017
Sec. Research Assessment
Volume 2 - 2017 | https://doi.org/10.3389/frma.2017.00014
This article is part of the Research TopicAltmetrics: Opportunities and ChallengesView all 7 articles
The main goal of this work is to verify the existence of diverse behavior patterns in academic production and impact, both among members of the same scientific community (inter-author variability) and for a single author (intra-author variability), as well as to find out whether this fact affects the correlation among author-level metrics (AutLMs) in disciplinary studies. To do this, two samples are examined: a general sample (members of a discipline, in this case Bibliometrics; n = 315 authors), and a specific sample (only one author; n = 119 publications). Four AutLMs (Total Citations, Recent Citations, Reads, and Online mentions) were extracted from three platforms (Google Scholar Citations, ResearchGate, and ImpactStory). The analysis of the general sample reveals the existence of different performance patterns, in the sense that there are groups of authors who perform prominently in some platforms, but exhibit a low impact in the others. The case study shows that the high performance in certain metrics and platforms is due to the coverage of document typologies, which is different in each platform (for example, Reads in working papers). It is concluded that the identification of the behavior pattern of each author (both at the inter-author and intra-author levels) is necessary to increase the precision and usefulness of disciplinary analyses that use AutLMs, and thus avoid masking effects.
The development of the Internet, the Web, and, lastly, social networks has gradually widened the spectrum of tools that researchers can use to generate content (not only peer-reviewed content, but all sorts of materials related to research activities as well) and to communicate and disseminate their results. In addition, the nature of these tools has made it possible to register new pieces of evidence (metrics) about the activities and actions of researchers, some of which are related to activities that researchers had already done in the pre-web era, whereas some others are completely new. These metrics have also broadened the possibilities to assess the impact of authors themselves [author-level metrics (AutLMs)] as well as the impact of the documents they produce, disseminate, and use (article-level metrics).
The first pieces of evidence of academic impact in the Web that were quantified were the ones related to visits (the pioneering log analyses) and hyperlinks. Those were the first of an extensive corpus of scientific literature on link analysis (Thelwall, 2004; Thelwall and Kousha, 2015), which can be further separated into the studies that focus on web impact (links received), on the one hand, and the ones focused on connectivity (graphs), on the other hand. Therefore, the beginning of Altmetrics (understood as alternative metrics for the study of academic impact) dates back to the last decade of the twentieth century, before even the term Altmetrics was coined.
Obviously, these studies only analyzed few metrics, which were severely limited by the tools available at the time to collect the data (mainly search engines), and their orders of magnitude—although far superior to those of other metrics like citations received—were still low at the author-level and document-level, only reaching high levels in certain aggregation levels, such as journals or universities.
It was not until the widespread adoption of the so-called Web 2.0 or Social Web that the number of metrics available and their orders of magnitude skyrocketed. In addition, the Social Web brought a change in the reference system, changing the focus from the website (that belongs to a person or an organization) to user profiles and the resources with which the user interacts (users can mention, download, tag, share, vote, link, or disseminate a resource, as well as interact directly with other users).
As a response to the transformations that scientific communication (and the way it is measured) is undergoing, the Altmetric Manifesto1 came to light in October 2010. This document offers incontrovertible pieces of evidence of the need to observe, quantify, and understand the academic activities that are already taking place in social network platforms (Priem and Hemminger, 2010). Since then, scientific literature on altmetrics has boomed, becoming one of the hottest topics in Bibliometrics (Weller, 2015; Sugimoto et al., 2017). The number of studies that include the term Altmetrics in the title, abstract, or keywords (published between 2012 and 2016) is 283 according to Scopus (Figure 1). Moreover, this list does not include studies that, under the umbrella of “link analysis” or “webometrics,” take an “altmetrics” approach, although they do not use that term necessarily.

Figure 1. Evolution of the number of articles on Altmetrics (Scopus).
Within Altmetrics, the study of the so-called AutLMs can be considered a specific line of work (Fenner, 2014). Obviously not all these metrics fall necessarily within Altmetrics. For example, the h-index (one AutLM among others) can be computed using citation databases such as Scopus or WoS (Bar-Ilan, 2008; Wildgaard et al., 2014; Wildgaard, 2015), but this indicator has thrived in the web environment. In this study, we consider AutLM as metrics that originate from social network platforms, web academic profiles, repositories, or any other online application or environment that provides performance and impact data (not necessarily scientific but academic in the broad sense of the term) focused on authors. These metrics can be categorized in the following dimensions: bibliometrics, usage, participation, rating, social connectivity, and composite indicators (Orduna-Malea et al., 2016b).
Among the studies that discuss AutLM, there are those that address the issue of understanding the underlying relationships among the various metrics. For example, inter-platform correlations (correlations between the same metric according to different platforms; for example, the number of followers of an author in Linkedin, ResearchGate, Twitter, and Academia.edu) or intra-platform (correlations between different metrics in the same platform; for example, citations received, Reads, and Followers, all available from ResearchGate). In addition, these studies can be approached from an institutional (Mikki et al., 2015; Ortega, 2015b) or disciplinary point of view (Martín-Martín et al., 2017).
A disciplinary study adds special context to the analysis of correlations among AutLMs. By focusing in a population that belongs to the same scientific community (in which a priori we may assume certain homogeneity as regards the use of academic profiles services as well as productivity and citation patterns), we may unveil certain relationships that perhaps do not occur (or arise to a lower degree) in other disciplines. Studies at the institutional level (generally multidisciplinary) might mask these behaviors.
Considering apart other external variables (e.g., the popularity of the author and/or his/her online strategies to disseminate works), other factors may affect correlations between AutLMs in disciplinary studies, in particular, the authors’ behavior patterns (the authors’ products) and the type of platform used to disseminate their work (the authors’ display window), which shape the objectives of this study.
Regarding the first factor, there are authors who conform to a formal pattern, based on publishing in journals indexed in the JCR (Journal Citation Reports), and authors with more informal publication patterns, who publish other typologies of documents such as reports, presentations, working papers, etc. There are even authors who conform to a hybrid pattern, who publish a wide variety of document typologies.
As for the second factor, both the degree of exposure of an author in a platform (quantity of available production) and the features and characteristics of an academic profile platform will determine the performance of an author. In addition, the demographic aspects of the platform (number of authors from a scientific community with a profile) also affect the orders of magnitude of the metrics available.
Given that each “display window” offers its own particular side of the work of an author, failure to measure all these different sides may result in a biased measurement because it was done using incomplete data. Moreover, it is not enough to look at all these display windows, it is also necessary to analyze the products that “are sold” in each display. Some will be sold (receiving citations, reads, downloads, etc.) more than others depending on the typology of the product (articles, presentations, reports, etc.).
In this sense, the main goal of this study is to verify the existence of diverse behavior patterns in academic production and impact, both among members of the same scientific community (inter-author variability) and for a single author (intra-author variability), as well as to find out whether this fact affects the correlation among AutLMs in disciplinary studies.
In order to carry out this study from a disciplinary perspective (thus assuming certain homogeneity among the researchers in the sample), we decided to select the field of Bibliometrics as a case study. Because of its own nature, it is assumed that authors in this discipline are familiar with metrics and academic profiles.
To date, there have been various studies addressing AutLMs by analyzing the field of Bibliometrics. Specifically, Bar-Ilan et al. (2012) and Haustein et al. (2014) carry out mainly demographic studies (most used academic profile services by a sample of authors in the discipline). Martín-Martín et al. (2016) carry out the most exhaustive study to date (811 authors), generating a correlation matrix of 31 different AutLMs.
However, the study of the existence of different academic behavior patterns inside a same discipline (in this case Bibliometrics) and its potential influence in the correlations between AutLMs has not been addressed before. Therefore, in order to answer the main goal mentioned above, we pose the following research questions:
RQ1: Is it possible to detect different academic behavior patterns among authors working in the same discipline (inter-author variability) using the AutLMs available in online academic profile services?
RQ2: Is it possible to detect different academic behavior patterns by the same author (intra-author variability) using the AutLMs available in online academic profile services?
RQ3: If the two previous questions can be answered affirmatively, do these behaviors affect the correlations between AutLMs?
In order to answer the research questions, we have selected a sample of authors from a discipline (in this case, Bibliometrics) and extracted a number of metrics about these authors available in various platforms (see Table 1). This sample was used to detect general patterns of behavior among the authors (inter-author variability). In addition, in order to find out the causes of that behavior, an in-depth analysis of an author is also carried out as a case study (intra-author variability).
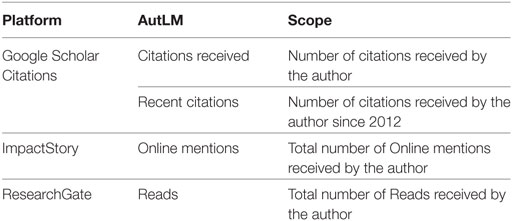
Table 1. Author-level metrics (AutLMs) gathered.
The sample of authors was extracted from the database Scholar Mirrors,2 a web application that compiles an exhaustive list of authors that have published either primarily (specialists) or sporadically in the field of Bibliometrics, and related disciplines (Informetrics, Scientometrics, Altmetrics, Webometrics). This web application provides a number of AutLMs extracted from the main academic profile platforms (Google Scholar Citations, ResearcherID, ResearchGate, Mendeley, and Twitter). The data available in this web application were collected in July 2015.
Once the main sample was obtained (made up of 811 authors), we proceeded to check whether those authors currently (September 2017) have a public profile in a series of academic profile services (Google Scholar Citations, ImpactStory, and ResearchGate). The selection of these three academic profile platforms was motivated by the need to analyze three of the main dimensions of online academic impact and their correlations: citations received (Google Scholar Citations), reads (ResearchGate), and, lastly, Online mentions in social network platforms (ImpactStory). Each platform has its own peculiarities:
• Citations: Google Scholar Citations automatically computes the total number of citations received by a document. In this study, we will use the sum of all the citations of all the documents included by the authors in their profiles. There is no restriction on the origin of the citing documents nor in the documents available in the profile (cited documents) beyond the technical requirements imposed by Google Scholar.3
• Reads: ResearchGate computes the number of Reads received by a document as the sum of a heterogeneous group of actions and interactions between a user and a document. According to ResearchGate, a Read “is counted each time someone views the publication summary (such as the title, abstract, and list of authors), clicks on a figure linked to the publication (either directly on the publication page or via the home feed), or views or downloads the full-text, if there is one.”4 In this study, we will use the sum of all the Reads received by all the documents included in the profiles of our sample of authors.
• Online mentions: ImpactStory records mentions in various sources to any publication with a DOI that is added to the ORCID profile of an author. The main sources from which it provides information are Tweets (Twitter), Pages (Facebook), Posts (Blogs, Google+, Reddit), news, and Wikipedia articles. Both in the case of blogs (Impact of Social Sciences Blog, Retraction Watch, etc.) and news sites (Nature news, Science news, etc.), the system only extracts information from a list of prestigious sources (Jobmann et al., 2014). In this study, we will use the sum of all mentions received by all the documents included in the profile.
In the case of Google Scholar Citations and ResearchGate, the profiles of the authors in the sample were extracted directly from Scholar Mirrors, although it was checked that they were still functional. All ResearchGate accounts were active and claimed profiles.5 As regards ImpactStory, first we checked whether the author had an ORCID profile,6 because the ImpactStory profiles currently include data only from ORCID profiles. To check the existence of the profile, the search feature available in ORCID was used. In order to avoid incorrect identifications, the affiliation data in the documents recorded in the ORCID records were matched against the affiliation information available in Google Scholar Citations and/or ResearchGate. Using these ORCIDs, it was very simple to find out whether an ImpactStory profile were available, because the URL to the ImpactStory profile always contains the ORCID. For example, if the ORCID of an author is “0000-0002-1989-8477,” the ImpactStory profile will be accessible from https://profiles.impactstory.org/u/0000-0002-1989-8477.
In the cases where it was not possible to disambiguate the profile, it was determined that the author did not have an ORCID (nor, therefore, an ImpactStory profile). For this reason, the number of authors with an ORCID might be slightly higher than reported in this study. Nevertheless, this problem did not arise frequently (in less than 5% of the studied sample), and so the effect of any potential mistakes on the results is expected to be low.
511 authors with an ORCID profile were found, of which 393 had an ImpactStory profile as well (although 2.7% of these profiles were empty or without any mentions). Regarding ResearchGate, 315 authors in the sample were found to have a profile in this platform (Figure 2). The number of authors with a profile in the three platforms is, therefore, 315. This is the sample that was used in the analysis for this study.
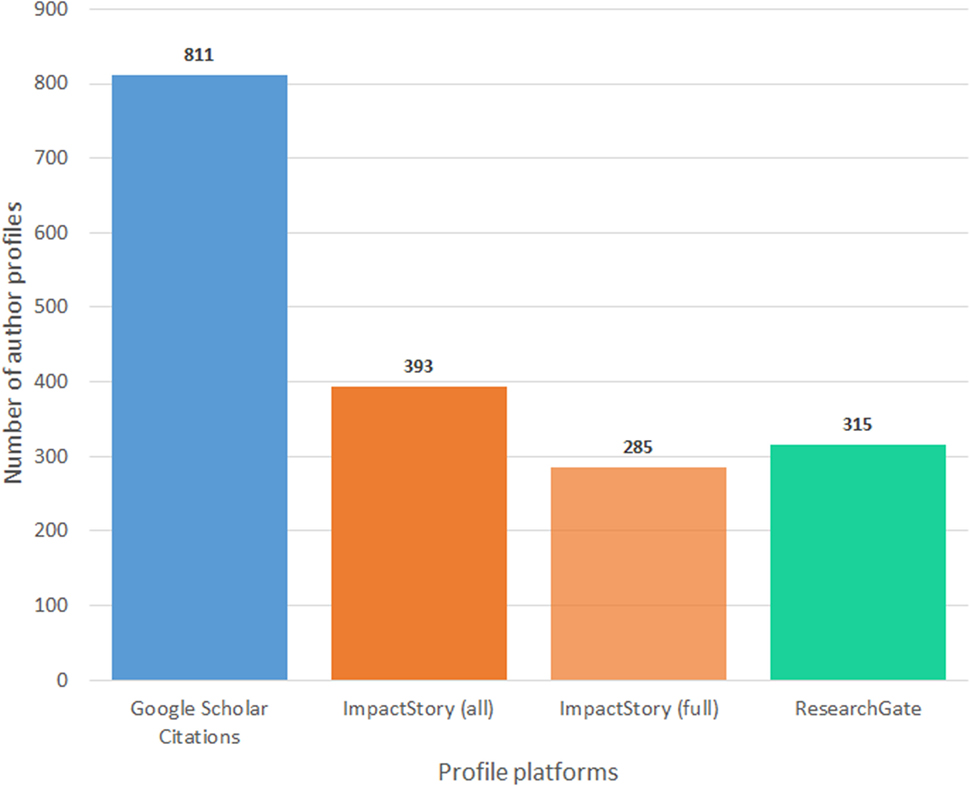
Figure 2. Number of profiles created in each platform.
Once all the profiles were identified, we proceeded to automatically extract the following AutLMs (Table 1).
Since the number of Online mentions reported by ImpactStory is mainly from Twitter (see Discussion), it was deemed appropriate to count the number of Tweets published by the authors in their personal Twitter accounts, in case this factor might affect the number of mentions received. The existence of personal Twitter accounts for the authors in the sample was checked in Scholar Mirrors and through direct searches in Twitter.
Once all the data had been obtained, a statistical analysis was carried out to answer the research questions previously proposed. Regarding RQ1, all the correlation coefficients between the various metrics were computed using Spearman’s method (α < 0.1) to account for the known non-linear distribution of web data. In addition, the same correlations were computed for the set of authors in the 10th percentile (P10) for each of the academic impact metrics (Citations, Reads, and Online mentions), in order to check the potential existence of differences when compared to the entire sample (in this case, the highest ranked researchers according to each of the three metrics).
After computing these correlations, a cluster analysis (k-means) was carried out with the goal of identifying the various patterns of online academic behavior according to the performance of authors in the various academic profiles (inter-author variability). That is to say, the potential existence of a group of authors who stand out in the three measured impact dimensions, of other group of authors who only stand out in one of the metrics and have a lower performance in the remaining dimensions, or any other possible combination. For this, up to eight classes were defined to identify all the possible combinations on the basis of the three dimensions analyzed (Citations, Reads, and Online mentions). In addition, a principal component analysis (PCA, with varimax rotation) was carried out in order to visually represent in a bidimensional space the relationships between each of the three studied dimensions.
Lastly, an ego-analysis of one of the authors (the first author of this article) was also carried out to answer RQ2 (intra-author variability). For this, all the publications available in his Google Scholar Citations profile were exported (n = 119), and document types were assigned to each publication (journal article, conference paper, book, book chapter, presentation, report). For each of the publications, the number of Reads in ResearchGate as well as the number of mentions according to ImpactStory was gathered. This procedure can be justified on the basis of the high amount and wide variety of documents published by the author, who has both a formal profile (journal articles published in journals indexed in Web of Science and/or Scopus) as well as an alternative profile (reports, conference presentations, book chapters). It is also justified because of the certainty that the profile is a faithful representation of all the author’s publications, across the three platforms studied, and, of course, because of the in-depth knowledge of his work, a necessary aspect to be able to contextualize the results obtained.
All the data were collected and analyzed during September 2017.
The volume of Online mentions obtained is inferior to the number of citations and Reads by an order of magnitude. While the maximum value of Online mentions equals 3,520, the highest number of Total Citations and Reads are 55,141 and 77,840, respectively (Table 2). In addition, a high variability in the data is observed, as the boxplot (Figure 3) shows.
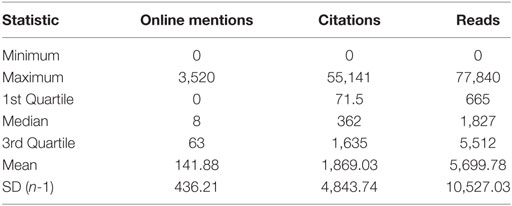
Table 2. Author-level metrics descriptive statistics.
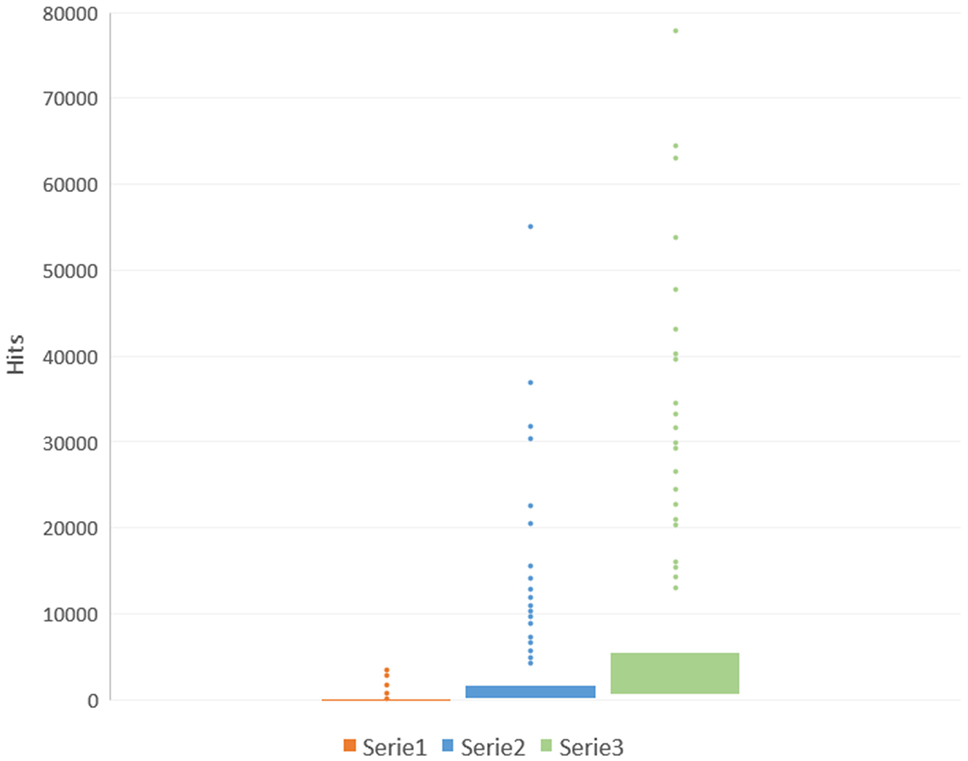
Figure 3. Author-level metrics box-and-whisker plot.
The low order of magnitude in Online mentions by the 315 profiles identified in ImpactStory is confirmed by the fact that 71% of the active profiles do not reach 100 mentions received (29 profiles had only received one mention), while only 16 profiles have received more than 1,000 mentions. This skewed and discrete distribution can be observed in Figure 4.
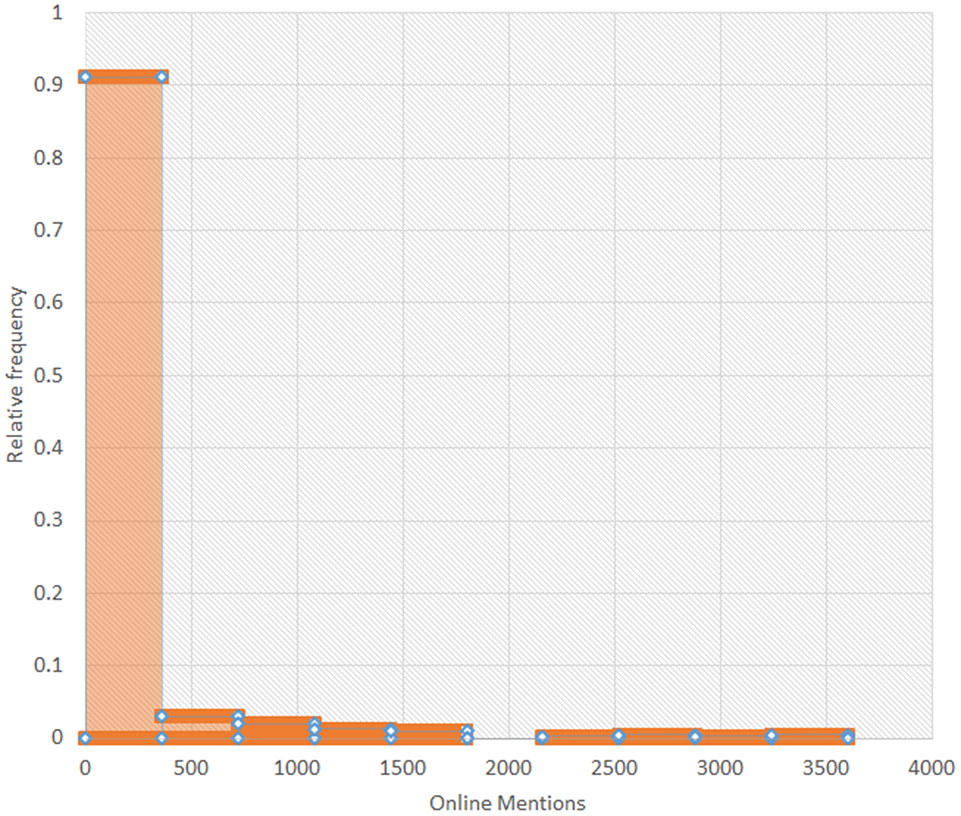
Figure 4. Online mentions (ImpactStory) histogram.
The correlations (Spearman; α < 0.1) between the different metrics (Total Citations, Recent Citations, Reads, and Online mentions) are displayed in Table 3. If we consider all the authors with a profile in the three platforms studied (Google Scholar Citations, ResearchGate, and ImpactStory) (Table 3a), we can observe a positive, high, and significant correlation between Citations and Reads (Rs = 0.75), slightly higher if we consider Recent citations (Rs = 0.78). Otherwise, we find a lower although still significant correlation between Citations and Online mentions (Rs = 0.56) and between Reads and Online mentions (Rs = 0.52).
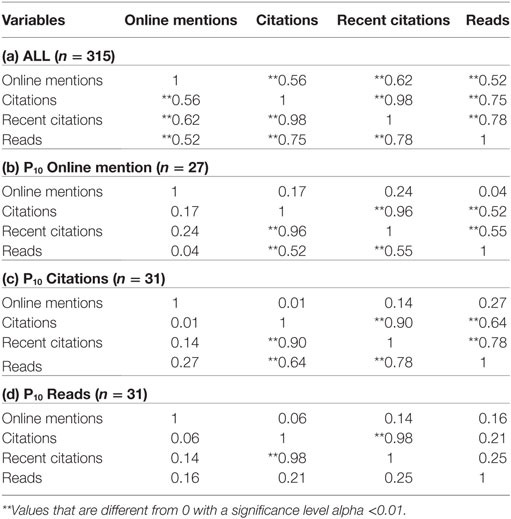
Table 3. Correlation matrix between author-level metrics: (a) all authors; (b) top authors according to Online mentions received; (c) top authors according to Citations received; (d) top authors according to Reads received.
However, if we only consider the authors who have received more Mentions (P10), the results vary slightly. A decrease in all the correlations is observed (Table 3b). The strongest correlation is still between Recent Citations and Reads (Rs = 0.55). However, the correlation between Citations and Online mentions decreases dramatically (Rs = 0.17). If the same procedure is applied to the most cited authors (Table 3c), the correlation between Citations and Reads increases (Rs = 0.64), but the correlation between Citations and Online mentions becomes near 0 (Rs = 0.01). Lastly, if we only consider the researchers with a higher number of Reads (Table 3d), the correlation between Citations and Reads decreases significantly (Rs = 0.21).
The variability in these correlations shows that the most prominent authors are not the same across dimensions (Citations, Reads, and Online mentions).
It is confirmed that there is a stronger relationship between Citations (especially recent ones) and Reads (especially if the authors with the highest number of Reads are excluded), whereas Mentions seem to reflect other aspects of an author’s impact. This fact can be observed in Figure 5, where the PCA reflects the existence of authors with markedly distinctive characteristics (many Citations and few Reads, many reads and few Online mentions, many Online mentions and few Citations, etc.).
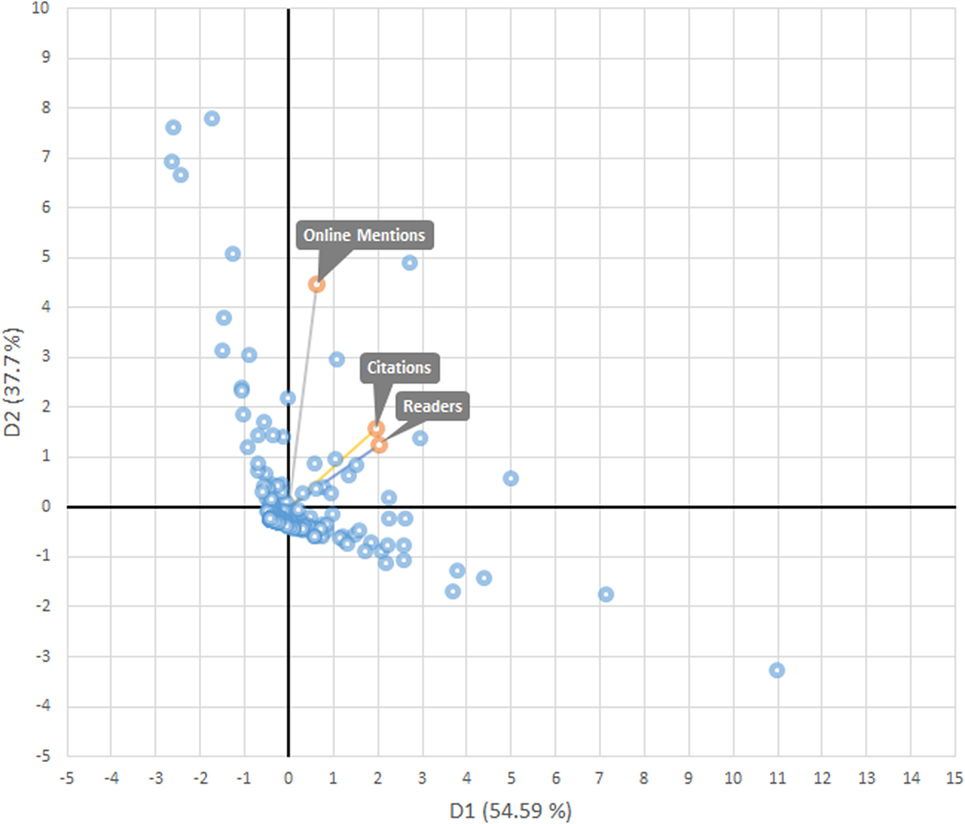
Figure 5. Principal component analysis of author-level metrics (n = 315).
The clustering method that was used (k-means) aims precisely at detecting the existence of different patterns of online academic behavior according to the AutLMs that were extracted. To do this, an author-ranking was generated according to each metric, assigning to each author an integer value (authors with the same value for a certain metric will get the same position in the ranking). In this manner, low figures indicate a high position in the ranking (1 is better performance than 2).
Thus, we can observe a first cluster (which includes 64 authors) that stands out because authors have a high performance in all three dimensions. On the other hand, the authors of the second cluster (23 authors) have a high number of Reads, but a lower number of Online mentions and Citations, whereas the members of the third cluster (33 authors) are ranked high according to Citations and Reads, but barely receive any Online mentions. In Figure 6, we can see the 8 behavior patterns studied through the performance of each author according to each metric (Citations, Reads, and Online mentions).
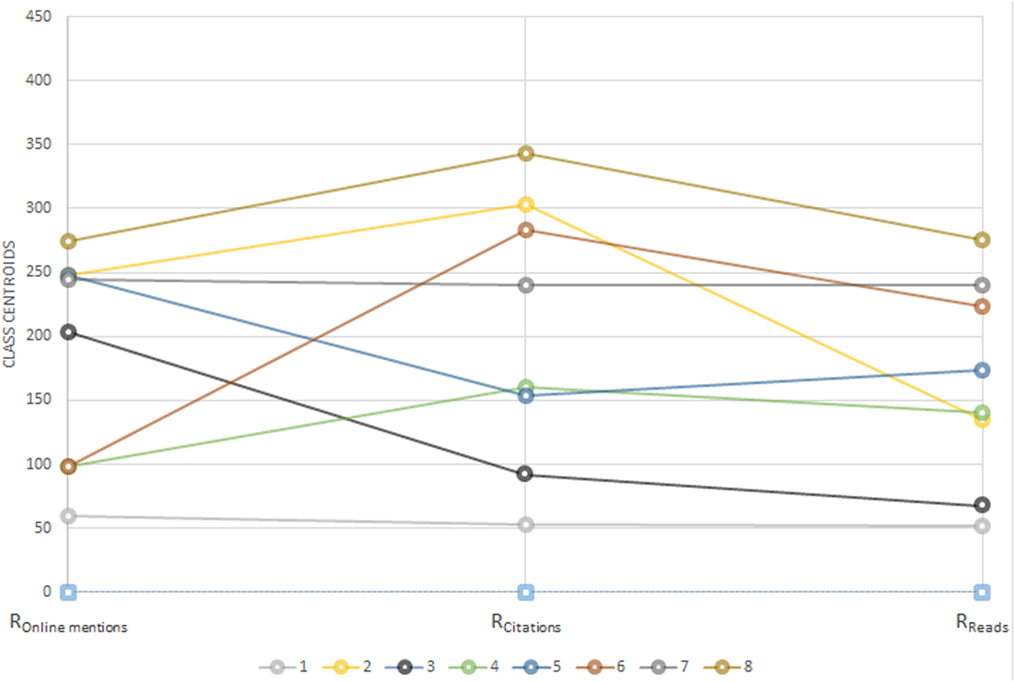
Figure 6. Academic performance patterns according to author-level metrics performance.
The various behavior patterns might repeat themselves in a fractal way inside a single researcher, in the cases when a researcher has a varied research output. Journal articles might receive many Citations but few Reads and Online mentions, while reports or presentations might get the opposite.
In order to check this effect, an in-depth study of all the scientific production of a single author according to his Google Scholar Citations profile has been carried out. A total of 119 items were analyzed, including 56 journal articles, 22 working papers; 10 conference papers; 15 course, seminar, and workshop presentations; 5 documents with supplementary material to articles; 4 book chapters; 3 dissertations; 2 books; and 2 research blog posts.
A rank of the top 25 publications according to number of citations received reveals that the most frequent document typology is the article (17), followed by working papers (6). However, if we rank documents according to their number of Reads or Online mentions, the results vary slightly (Table 4). In the case of Reads, we can see a predominance of reports (10 among the top 25 most read documents), while the top 25 with most Online mentions contain mostly articles (18), because ImpactStory only quantifies mentions to documents with a DOI that are also included in the author’s ORCID profile, which introduces a bias toward journal articles.
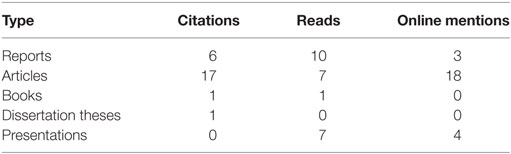
Table 4. Document categories according to each Top 25 author-level metric (AutLM) performance ranking.
The correlations between all AutLMs can be found in Table 5. A strong correlation is found between Online mentions and Reads (Rs = 0.65), and no correlation was found between Citations and Reads (Rs = −0.12). However, the correlation between Online mentions and Reads decreases if we only consider journal articles (Rs = 0.47), which indicates that this particular author profile is clearly marked by the publication of working papers with a high number of Reads, evidencing the difference between the audience that reads and the audience that cites the outputs of the author.
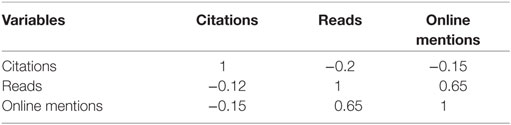
Table 5. Correlation matrix for case study author-level metrics (n = 34).
Even though only three platforms have been analyzed (Google Scholar Citations, ResearchGate, and ImpactStory), significant demographic differences in the three platforms have been found regarding the presence of authors from the same scientific discipline (in this case, Bibliometrics). Only 38.8% of the analyzed authors had a profile in the three platforms. It is also worth noting that the number of authors with an ORCID profile is relatively low (63%), specially considering that we are talking about a discipline that routinely engages in quantitative analysis of science and its main agents (authors, journals, publications, etc.) and, therefore, it is expected that they are aware of the convenience of creating an ORCID profile. Furthermore, the uptake of ImpactStory (48.5%) and ResearchGate (38.8%) is also moderately low. Nevertheless, the sample that was analyzed (n = 315) is considered sufficiently large as to answer the objectives and research questions that were posed.
The data relative to the uptake of the different platforms differ from the results reported by Bar-Ilan et al. (2012) and Haustein et al. (2014). In the latter, the authors found a larger percentage of authors in ResearchGate (58%) than in Google Scholar Citations (53%). However, the study by Martín-Martín et al. (2017), which uses the same sample of authors as this study, shows a preference toward Google Scholar Citations. The fact that a larger sample was studied (811 authors instead of 57) might explain these differences. It should be highlighted, however, that the sample is biased toward this platform (only authors with a public profile created in Google Scholar Citations were included in Scholar Mirrors). Nonetheless, the great difference found between ResearchGate and Google Scholar Citations along with the sample size may reinforce the preferences found. A longitudinal study using the same sample would be necessary to unveil the demographic evolution in each platform over time. In the case of ORCID, Haustein et al. (2014) already identified a low uptake (only 35% of their sample had a profile in this platform), while in this study, which uses a larger sample, the figure is higher (63%). Regarding ImpactStory, no other studies targeted on the bibliometrics community with data from this platform have been found.
As regards AutLMs, their high variability (they are updated constantly) and volatility (there are no records on the evolution of most of these metrics) is worth noting, which makes it difficult to contextualize the results and to replicate them. Moreover, many sources (especially the ones related to Online mentions) disappear or are constantly changing, which adds a measure of instability to the combined metrics that are generated. At any rate, as far as the objectives of this study are concerned, these issues are of no great consequence. Perhaps, the variability of the distributions of each metric might change the results shown in Table 3. To account for this, the data available in Scholar Mirrors (July 2015) have been compared with the data used in this study (September 2017), correlating Total Citations, Recent Citations, and Reads. The results obtained (Table 6) show a high consistency and robustness, confirming that, in general, the current over-performers are the same people as in 2015.
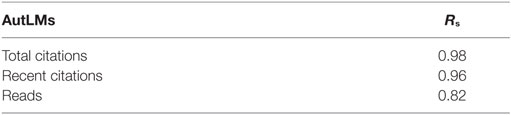
Table 6. Author-level metrics (AutLMs) correlation over years (2015–2017).
Regarding the analysis of the authors’ online academic behavior (inter-author variability), the use of percentiles (P10) together with the need to analyze all the three platforms, means that the number of observations is low in some cases (31 in the case of authors with more total Citations and Reads; 27 in the case of authors with more Online mentions). Obviously, these are very few cases and the results cannot be generalized, but they serve as a way to illustrate the fact that the over-performers are not the same across the different metrics. Given the non-linear distribution of the data from each metric, this means that the group of over-performers contains the researchers with the highest performance, while the rest (the vast majority) have a moderate or low performance (especially in the case of Citations and Online mentions; in the case of Reads, the long tail of the statistical distribution is less pronounced). For this reason, despite the fact that the sizes of the samples are small, the results of the correlations reveal a different relationship between the metrics, according to the best performing researchers in each of the three dimensions studied.
Due to the fact that the number of Online mentions reported by ImpactStory are mainly from Twitter (Kraker et al., 2015), the number of Tweets published by authors in their profiles might affect the number of mentions received (which do not exclude self-mentions) and, therefore, the correlations between this metric and the others (Citations and Reads). In order to settle this issue, it was deemed appropriate to quantify the number of Tweets published by the authors in their personal Twitter accounts and observe the potential correlation with the metrics studied (Table 7). The results show an absolute lack of correlation, regardless of whether all the authors with profiles in the three platforms are considered (sample 1), or only the authors with more mentions (sample 2).
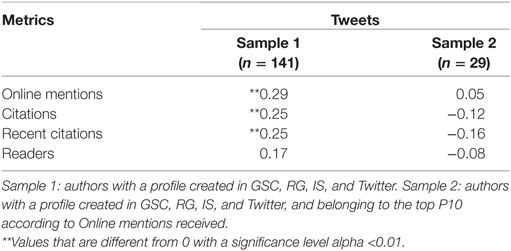
Table 7. Correlation between author-level metrics and number of Tweets.
Otherwise, obtaining weak correlations between AutLMs when it comes to consider only the over-performer authors in each of the metrics may be due to the following reasons:
(a) The existence of different patterns of use in the platforms (for example, failing to update a profile in ORCID/ImpactStory), and/or
(b) The existence of different work patterns (for example, publishing documents that might be highly read, but not cited).
Although the cluster analysis that was carried out can identify the different performance patterns, the availability of these data by itself is not enough to reveal whether any of the factors described above (or both) cause a low performance in a profile. Nevertheless, it lets us know that there are different patterns within the authors of the same discipline. This result answers positively to the first research question (RQ1).
The identification of performance patterns in the ego-analysis that has been carried out also presents a series of limitations that are worth noting. First, the pattern of behavior of the studied author might be unique in the sense that no other author shares the same characteristics (distribution of document typologies, type of impact, etc.), so the results cannot be generalized to other authors. In addition, in order to carry out this type of analysis and be able to contextualize the results with precision, it is necessary to be very familiar with the work of the author.
For example, in the case at hand, the author has published presentations and working papers which make up for a large portion of the Online mentions in ImpactStory. This is so because the documents were uploaded to ResearchGate (which generates DOIs if requested by the author), then they were added to the ORCID public profile and, lastly, the ORCID profile was synchronized with ImpactStory. This tedious process is probably only carried out by a few authors that are familiar with how these platforms work. For this reason, the data extracted from ImpactStory are clearly an underrepresentation of the actual Online mentions (the update frequency of ImpactStory profiles by authors is unknown since it depends on the previous ORCID profile update); whereas in Google Scholar Citations, the metrics are updated automatically, and in ResearchGate it depends directly on the user. This issue makes us think that ImpactStory should not be used in studies that carry out comparisons between AutLMs, at least in the discipline of Bibliometrics. This issue might explain in part the low quantity of altmetric studies that use data from ImpactStory, among which we should mention the ones by Jobmann et al. (2014), Kraker et al. (2015) and Peters et al. (2016), which focus on article-level metrics. In this case, we could not find any previous studies that analyze the uptake of this platform by a scientific community at an author level (such as Bibliometrics).
Despite all these limitations, the analysis successfully depicts the intended issue, that is, to verify the existence of different performances depending on the type of academic output generated by authors and their degree of use of online academic profile platforms.
Lastly, the analysis was carried out within the context of one discipline (Bibliometrics), which means the results should not be generalized to other disciplines. The literature has proved the existence of disciplinary differences in the impact measured by Google Scholar’s Citations (Kousha and Thelwall, 2007; Orduna-Malea et al., 2016a), ResearchGate’s Views/Reads (Ortega, 2015a; Thelwall and Kousha, 2017), and Online mentions (Holmberg and Thelwall, 2014; Zahedi et al., 2014; Costas et al., 2015; Htoo et al., 2017). In any case, the results show variability among authors (inter-author) and even within the same author (intra-author). This issue, regardless of the potential differences among disciplines, is the core issue in this study.
The literature has previously discussed that the motivations behind social media mentions are complex and diverse (Priem and Costello, 2010; Haustein et al., 2016). The heterogeneity of social media metrics consequently comprises and brings up a wide diversity of acts and online events (Haustein, 2016). For this reason, the utilization of aggregated values (such as the number of Online mentions offered by ImpactStory) is controversial since the number of Tweets, likes, or mentions may come from a wide variety of actions and purposes.
In this work the authors merely pretended to show how key metrics (Citations, Reads, and Online mentions) cannot be directly correlated without considering different academic behavior patterns. However, deeper analyses may take also into account the specific web source. To this end, by November 2017, all Online mentions were re-gathered for all those authors that exhibited more than one online mention in the first data sample (n = 285), decomposing the aggregated value into their different web sources (Table 8).
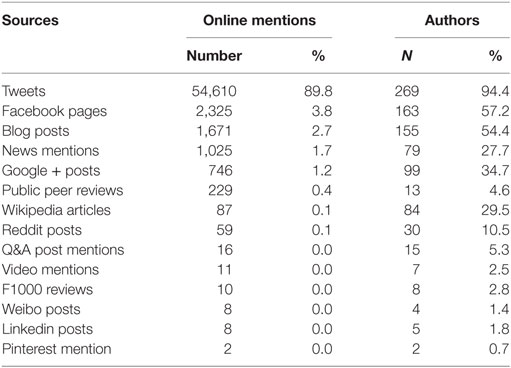
Table 8. Distribution of Online mentions according to the source.
We can check the predominance of Twitter as the main source. The 89.8% of all online mentions gathered come from this source whereas the 94.4% of all authors receive at least one Mention from Twitter. These results indicate that online mentions from ImpactStory are reflecting mainly academic impact in Twitter.
Obviously, the impact of these scientific products may be dependent on some external variables such as the authors’ productivity and popularity, the intrinsic and/or perceived quality of the product, the topic, the authority of the group or institution where the author is affiliated, the specific time when the product is online exposed as well as other communication strategies followed by the author to promote his/her work. Although all these factors must be formally acknowledged, they do not diminish or influence the main goal pursuit in this work, which is checking whether different academic behavior patterns exist when correlating AutLMs in academic profiles. Precisely, the online behavior pattern should become a new factor to be controlled in AutLM studies.
As regards AutLMs, a non-linear distribution in the data extracted from the three platforms (Google Scholar Citations, ResearchGate, and ImpactStory) has been found. There are few authors with a high performance, and a long tail with moderate, low, or null performance. Moreover, the high performance authors are not the same across the three studied dimensions of impact (Citations, Reads, and Online mentions). The lack of correlation might be explained by the fact that each platform offers different documents, targeted to different audiences.
This fact has facilitated the identification of different patterns of online academic behavior in the studied platforms (RQ1). Some authors present a markedly formal performance (Citations, mainly to journal articles) while other authors stand out in Reads (both to articles and to other document typologies), or in Online mentions (mainly Articles). Combined patterns have also been found (high performance in Citations and Reads, and low in Online mentions). This issue evidences that the analysis of a single platform, not even considering of the demographic aspects related to the population of a discipline that is reflected, can mask the performance of an author who has particularly high or low values in any given platform.
Lastly, the ego-analysis has allowed us to confirm the existence of authors with different patterns of online academic behavior depending on the types of documents that they publish (RQ2). In this case, we could observe the existence of working papers with a high amount of Reads and Online mentions, as well as the existence of a large group of articles with a lower number of citations. That is, certain typologies are generating an impact (Reads in ResearchGate) that cannot be observed in other platforms. Again, the different nature of the research activity (article: generating knowledge; report: application of knowledge to solve a problem; educational materials: knowledge transfer, etc.) determines everything. The people who cite are scientists, the same ones that produce scientific knowledge, whereas practitioners read but do not cite as much, so it is less likely that they would cite other studies.
This fact again brings us to the need not only of considering different online academic profile platforms (in order to capture different impact profiles) but also to categorize the type of impact according to the document typologies, because a general analysis of authors might mask their actual impact.
All this makes us question the usefulness and precision of the correlation analyses of AutLMs within a discipline that have not taken into account inter-author or intra-author variability to model the multidimensional impact of authors. This is one of the aspects in which Altmetrics studies should focus their attention from now on.
EO-M: co-designed the original research, gathered data, performed statistical analysis, and co-written the manuscript. EDL-C: co-designed the original research and co-written the manuscript.
The authors declare that the research was conducted in the absence of any commercial or financial relationships that could be construed as a potential conflict of interest.
EO-M holds a Juan de la Cierva postdoctoral fellowship (IJCI-2015-26702), granted by the Ministerio de Economía, Industria y Competividad (Spain).
Bar-Ilan, J. (2008). Which h-index? − a comparison of WoS, Scopus and Google Scholar. Scientometrics 74, 257–271. doi: 10.1007/s11192-008-0216-y
Bar-Ilan, J., Haustein, S., Peters, I., Priem, J., Shema, H., and Terliesner, J. (2012). “Beyond citations: scholars’ visibility on the social Web,” in Proceedings of the 17th International Conference on Science and Technology Indicators, eds É. Archambault, Y. Gingras, and V. Larivière (Montréal, Canada), 98–109.
Costas, R., Zahedi, Z., and Wouters, P. (2015). The thematic orientation of publications mentioned on social media: large-scale disciplinary comparison of social media metrics with citations. Aslib J Inform Manag 67, 260–288. doi:10.1108/ajim-12-2014-0173
Fenner, M. (2014). “Altmetrics and other novel measures for scientific impact,” in Opening Science, eds S. Bartling, and S. Friesike (Heidelberg: Springer), 179–189.
Haustein, S. (2016). Grand challenges in altmetrics: heterogeneity, data quality and dependencies. Scientometrics 108, 413–423. doi:10.1007/s11192-016-1910-9
Haustein, S., Bowman, T. D., and Costas, R. (2016). “Interpreting ‘altmetrics’: viewing acts on social media through the lens of citation and social theories,” in Theories of Informetrics and Scholarly Communication, ed. C. R. Sugimoto (Berlin/Boston: De Gruyter Mouton), 372–406.
Haustein, S., Peters, I., Bar-Ilan, J., Priem, J., Shema, H., and Terliesner, J. (2014). Coverage and adoption of altmetrics sources in the bibliometric community. Scientometrics 101, 1145–1163. doi:10.1007/s11192-013-1221-3
Holmberg, K., and Thelwall, M. (2014). Disciplinary differences in Twitter scholarly communication. Scientometrics 101, 1027–1042. doi:10.1007/s11192-014-1229-3
Htoo, T. H. H., Htoo, T. H. H., Na, J. C., and Na, J. C. (2017). Disciplinary differences in altmetrics for social sciences. online Inform Rev 41, 235–251. doi:10.1108/oir-12-2015-0386
Jobmann, A., Hoffmann, C. P., Künne, S., Peters, I., Schmitz, J., and Wollnik-Korn, G. (2014). “Altmetrics for large, multidisciplinary research groups: comparison of current tools,” in Proceedings of the 13th Libraries in the Digital Age (LIDA), eds S. F. Tanacković, and B. Bosančić (Zadar, Croatia), 245–254.
Kousha, K., and Thelwall, M. (2007). Google scholar citations and Google Web/URL citations: a multi-discipline exploratory analysis. J Assoc Inform Sci Technol 58, 1055–1065. doi:10.1002/asi.20584
Kraker, P., Lex, E., Gorraiz, J., Gumpenberger, C., and Peters, I. (2015). Research Data Explored II: the Anatomy and Reception of Figshare. arXiv preprint arXiv:1503.01298.
Martín-Martín, A., Orduna-Malea, E., Ayllón, J. M., and Delgado López-Cózar, E. (2016). The Counting House: Measuring those who count. Presence of Bibliometrics, Scientometrics, Informetrics, Webometrics and Altmetrics in the Google Scholar Citations, ResearcherID, ResearchGate, Mendeley & Twitter. EC3 Working Papers, 23.
Martín-Martín, A., Orduna-Malea, E., and Delgado López-Cózar, E. (2017). A novel method for depicting academic disciplines through Google scholar citations: the case of Bibliometrics. Scientometrics. doi:10.1007/s11192-017-2587-4
Mikki, S., Zygmuntowska, M., Gjesdal, ØL., and Al Ruwehy, H. A. (2015). Digital presence of Norwegian scholars on academic network sites-where and who are they? PLoS ONE 10:e0142709. doi:10.1371/journal.pone.0142709
Orduna-Malea, E., Martín-Martín, A., Ayllón, J. M., and Delgado López-Cózar, E. D. (2016a). La revolución Google Scholar: destapando la caja de Pandora académica. Granada: UNE.
Orduna-Malea, E., Martín-Martín, A., and Delgado-López-Cózar, E. (2016b). The next bibliometrics: ALMetrics (Author Level Metrics) and the multiple faces of author impact. El profesional de la información 25, 485–496. doi:10.3145/epi.2016.may.18
Ortega, J. L. (2015a). Disciplinary differences in the use of academic social networking sites. Online Inform Rev 39, 520–536. doi:10.1108/oir-03-2015-0093
Ortega, J. L. (2015b). Relationship between altmetric and bibliometric indicators across academic social sites: the case of CSIC’s members. J Inform 9, 39–49. doi:10.1016/j.joi.2014.11.004
Peters, I., Kraker, P., Lex, E., Gumpenberger, C., and Gorraiz, J. (2016). Research data explored: an extended analysis of citations and altmetrics. Scientometrics 107, 723–744. doi:10.1007/s11192-016-1887-4
Priem, J., and Costello, K. L. (2010). How and why scholars cite on Twitter. Proc Assoc Inform Sci Technol 47, 1–4. doi:10.1002/meet.14504701201
Priem, J., and Hemminger, B. H. (2010). Scientometrics 2.0: new metrics of scholarly impact on the social Web. First Monday 15. doi:10.5210/fm.v15i7.2874
Sugimoto, C. R., Work, S., Larivière, V., and Haustein, S. (2017). Scholarly use of social media and altmetrics: a review of the literature. J Assoc Inform Scie Technol 68, 2037–2062. doi:10.1002/asi.23833
Thelwall, M., and Kousha, K. (2015). Web indicators for research evaluation. Part 1: citations and links to academic articles from the web. El profesional de la informacion 24, 587–606. doi:10.3145/epi.2015.sep.08
Thelwall, M., and Kousha, K. (2017). ResearchGate articles: age, discipline, audience size, and impact. J Assoc Inform Sci Technol 68, 468–479. doi:10.1002/asi.23675
Weller, K. (2015). “Social media and altmetrics: an overview of current alternative approaches to measuring scholarly impact,” in Incentives and Performance: Governance of Research Organizations, eds I. Welpe, J. Wollersheim, S. Ringelhan, and M. Osterloh (Heidelberg: Springer), 261–276.
Wildgaard, L. (2015). A comparison of 17 author-level bibliometric indicators for researchers in astronomy, environmental science, philosophy and public health in Web of science and Google scholar. Scientometrics 104, 873–906. doi:10.1007/s11192-015-1608-4
Wildgaard, L., Schneider, J. W., and Larsen, B. (2014). A review of the characteristics of 108 author-level bibliometric indicators. Scientometrics 101, 125–158. doi:10.1007/s11192-014-1423-3
Keywords: altmetrics, author-level metrics, Google scholar citations, ResearchGate, ImpactStory, Twitter, citation analysis, online mentions
Citation: Orduna-Malea E and Delgado López-Cózar E (2017) Performance Behavior Patterns in Author-Level Metrics: A Disciplinary Comparison of Google Scholar Citations, ResearchGate, and ImpactStory. Front. Res. Metr. Anal. 2:14. doi: 10.3389/frma.2017.00014
Received: 30 September 2017; Accepted: 12 December 2017;
Published: 22 December 2017
Edited by:
Kim Holmberg, University of Turku, FinlandReviewed by:
Saeed-Ul Hassan, Information Technology University, PakistanCopyright: © 2017 Orduna-Malea and Delgado López-Cózar. This is an open-access article distributed under the terms of the Creative Commons Attribution License (CC BY). The use, distribution or reproduction in other forums is permitted, provided the original author(s) or licensor are credited and that the original publication in this journal is cited, in accordance with accepted academic practice. No use, distribution or reproduction is permitted which does not comply with these terms.
*Correspondence: Enrique Orduna-Malea, ZW9yZHVuYUB1Z3IuZXM=
Disclaimer: All claims expressed in this article are solely those of the authors and do not necessarily represent those of their affiliated organizations, or those of the publisher, the editors and the reviewers. Any product that may be evaluated in this article or claim that may be made by its manufacturer is not guaranteed or endorsed by the publisher.
Research integrity at Frontiers
Learn more about the work of our research integrity team to safeguard the quality of each article we publish.